Abstract
Soil Moisture (SM) is a key parameter in several research and application fields, from climate studies to farming, from natural disaster prediction to land management. In this respect, Earth Observation (EO) images have been widely recognized as a useful tool able to provide information on a large scale. In the last few decades, several near-infrared (NIR) and short-wavelength-infrared (SWIR) indices have been proposed for SM monitoring. Nonetheless, the number of EO studies addressing real, heterogeneous scenarios is very limited. In this paper, we present the results of a comparative analysis conducted on a multi-temporal sequence of optical EO images by computing a set of NIR-SWIR-based indices in order to assess their performances for SM monitoring. The studied area was a highly heterogeneous farming area featuring bare soil, cultivated areas and forests. The outcomes highlighted an overall good performance for some indices despite the effects of some environmental parameters.
1. Introduction
Soil Moisture (SM) monitoring is an extremely important task in land management and planning. Several methods have been developed to monitor SM, such as time domain reflectometry (TDR) [1] or gravimetry. Both methods require many resources in terms of time and data processing and cannot be used to monitor SM in wide areas. Remote sensing methods are useful for monitoring SM because they use Earth Observation (EO) data, providing information at different scales. Based on specific frequencies, SAR data’s (L, P bands) usefulness in SM monitoring has been widely demonstrated [2]. Optical EO data can also provide valuable information for SM monitoring with high spatial resolution and frequent revisit time. The usefulness of short-wavelength-infrared (SWIR) and near-infrared (NIR) reflectance bands to monitor SM has been studied in the laboratory [3], from airplanes [4] and also by using EO data [5]. Several studies have shown good results using normalized spectral NIR- SWIR-based indices. The most used are as follows: Normalized Difference Infrared Index (NDII) [6] developed by Hardisky et al. to detect leaf biomass, Normalized Multiband Drought Index (NMDI), used to monitor both soil and vegetation from space [7], and Visible and Shortwave Infrared Drought Index (VSDI), successfully applied to study the humidity of several land cover types in Oklahoma [8].
In this study, we investigated the potential of Landsat 8 images to monitor SM by assessing the performances of three multispectral indices—NDII, NMDI and VSDI—on a multitemporal sequence of images referring to a study area characterized by strong environmental variability. We performed this study in the south of Tuscany using SM data provided by Global Land Data Assimilation System (GLDAS) 2.1 as validation data.
2. Materials and Methods
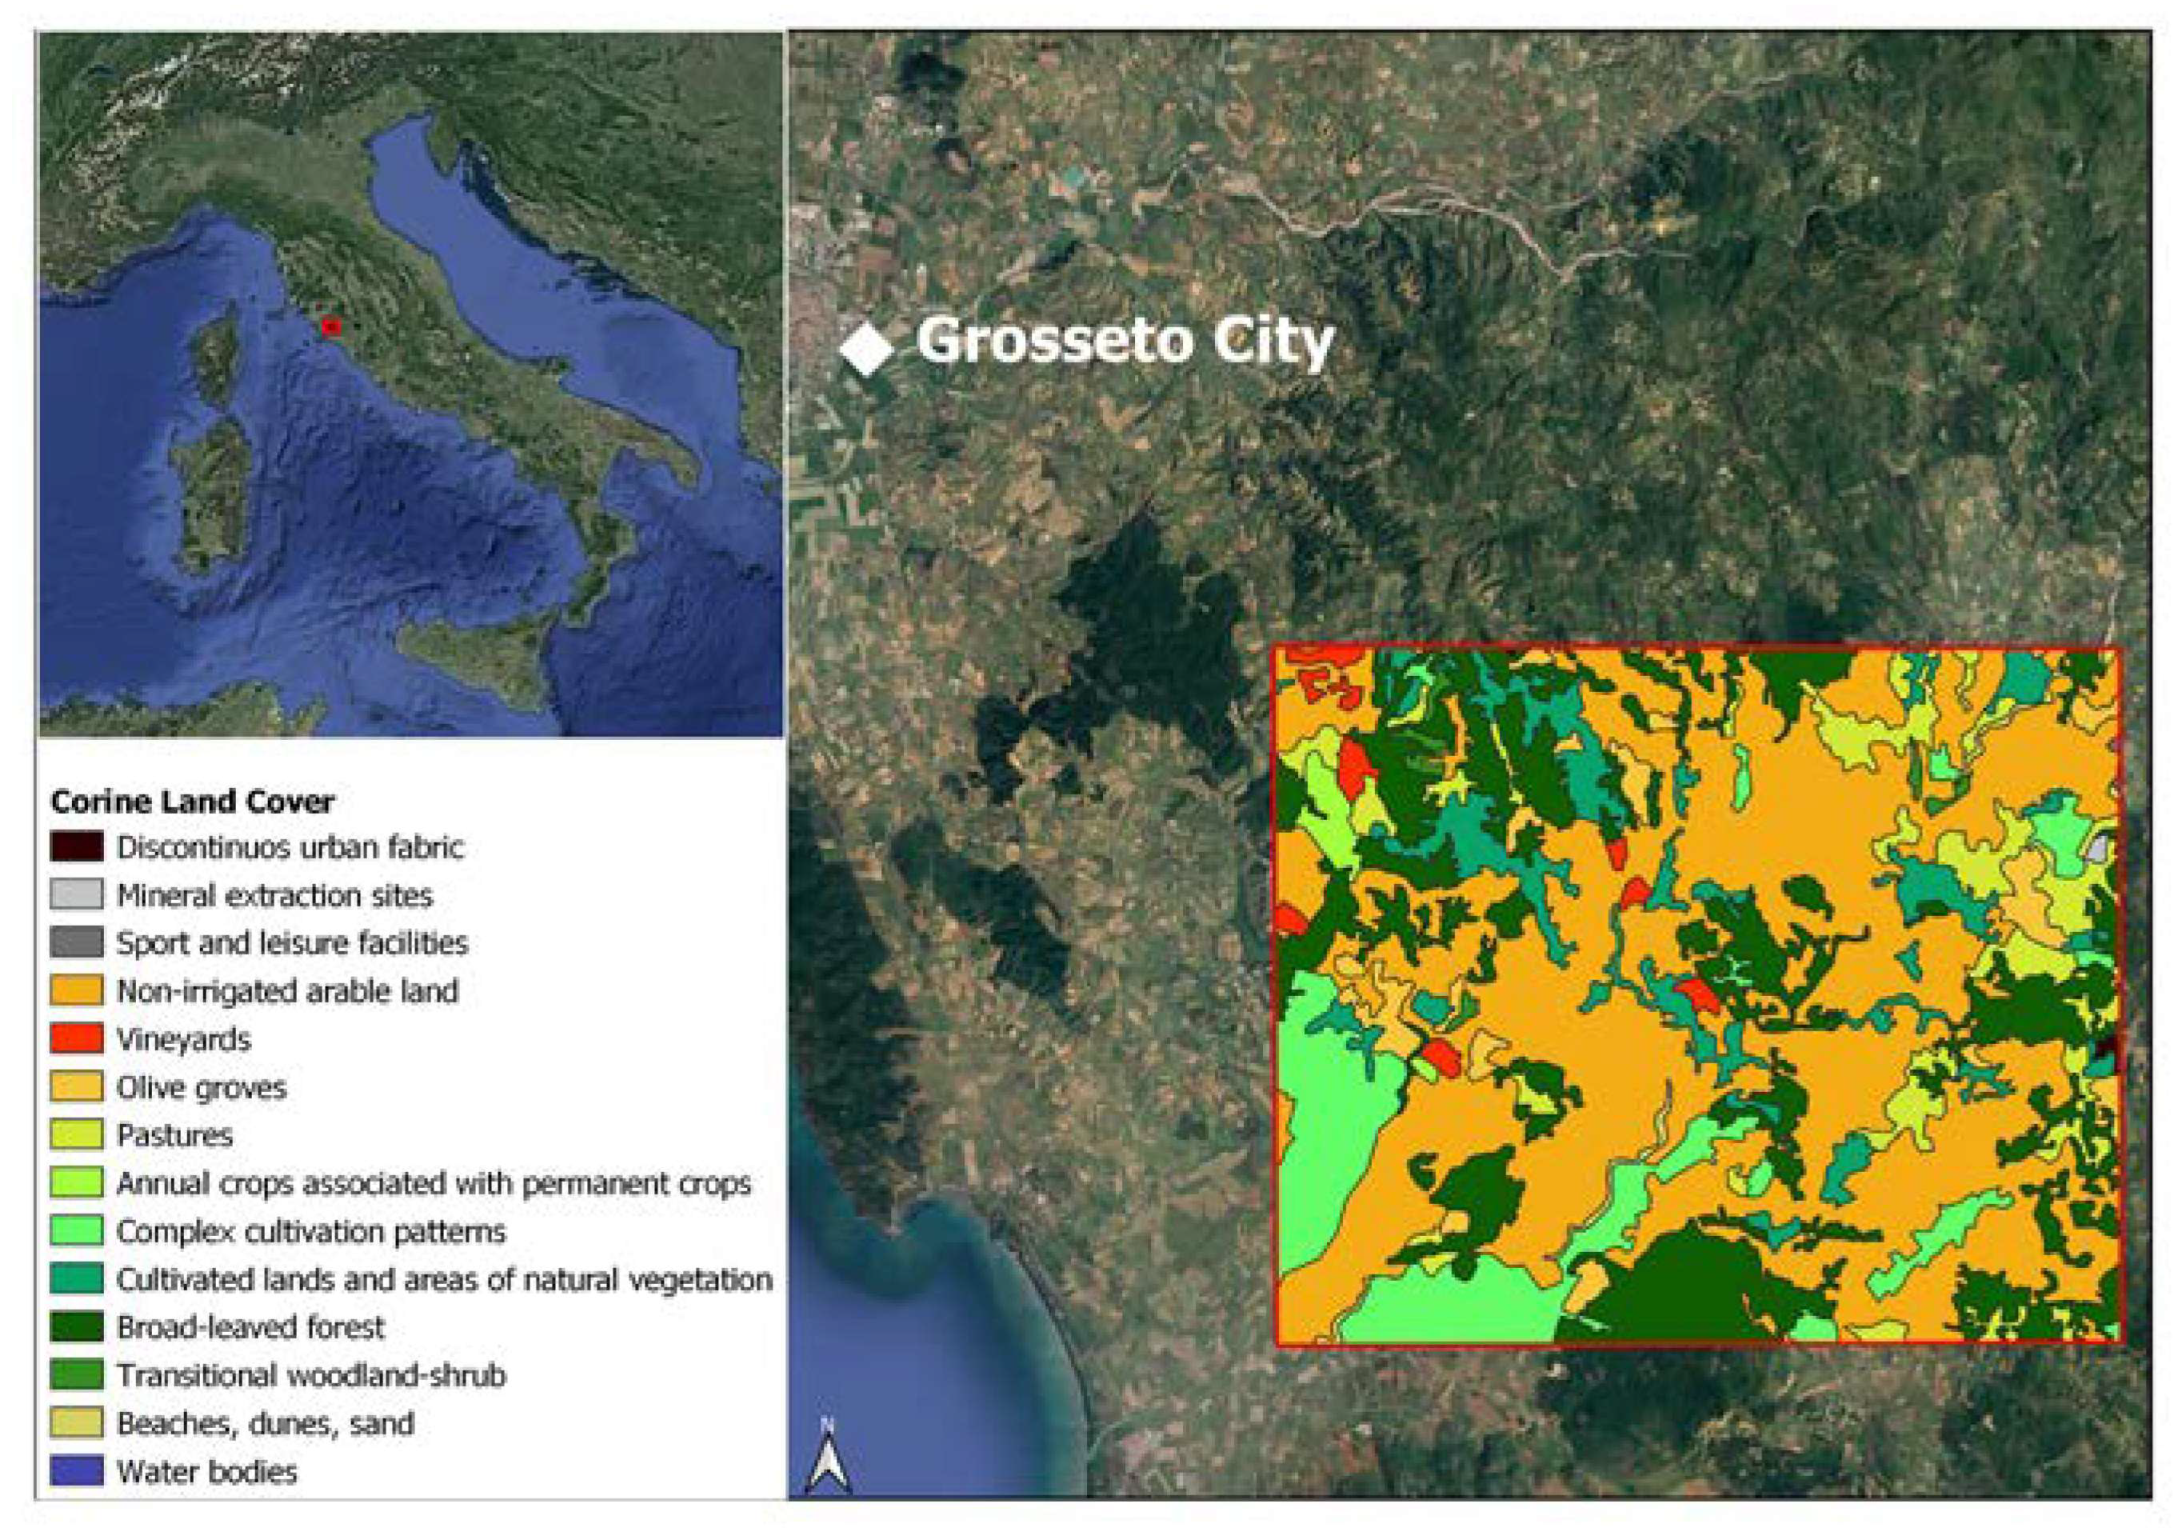
The study area is based in south-western Tuscany in Italy, near the town of Grosseto (42°31′30.0″ N 11°15′5.4″ E, 42°32′35.7″ N 11°33′37.4″ E). The study area is characterized by strong environmental variability, with forested, agricultural and bare soil areas (Figure 1).

Figure 1.
Image showing the study area in south-western Tuscany, near the town of Grosseto.
We used Landsat-8 multispectral images with high spatial resolution (30 m) in the test area during summer season, between June and September, from 2017 to 2020. In each year, we selected only the images with a very low cloud score (<10%), obtaining a dataset composed of 31 images. SM values referring to the study area were obtained using the Global Land Data Assimilation System (GLDAS 2.1). To develop SM data, GLDAS uses satellites, ground-based observational data and several models and methods to assimilate data [9]. SM data (expressed as kg/m2) were handled on Google Earth Engine, and we downloaded the SSM dataset product: GLDAS Noah Land Surface Model L4 3 hourly 0.25 × 0.25 degree V2.1 (GLDAS_NOAH025_3H_2.1)) [9].
As a first step, we applied cloud masking, based on the Landsat thermal band, to the entire study area. Subsequently, we removed the water bodies and the anthropic areas. Then, we identified the bare soil areas and the vegetated areas by means of a Random Forest classifier. The 31 bare soil and vegetation masks, obtained from the RF, were applied to all the datasets. We made a first intersection to obtain a temporal bare-soiled mask and a temporal vegetated mask for each year; then, we used a second intersection from the temporal vegetation and bare soil masks, obtaining a single multitemporal vegetation mask and a single multitemporal bare soil mask. Then, we made a union between the multitemporal masks to obtain a masked multitemporal dataset.
3. Results
The masked dataset was processed in order to compute the three multispectral indices—NDII, NMDI and VSDI. The multispectral indices computed over the entire study area are shown in Figure 2.
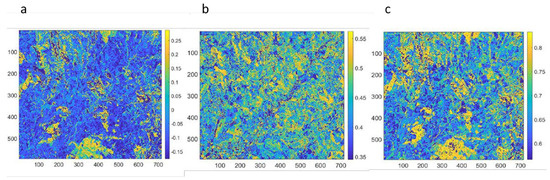
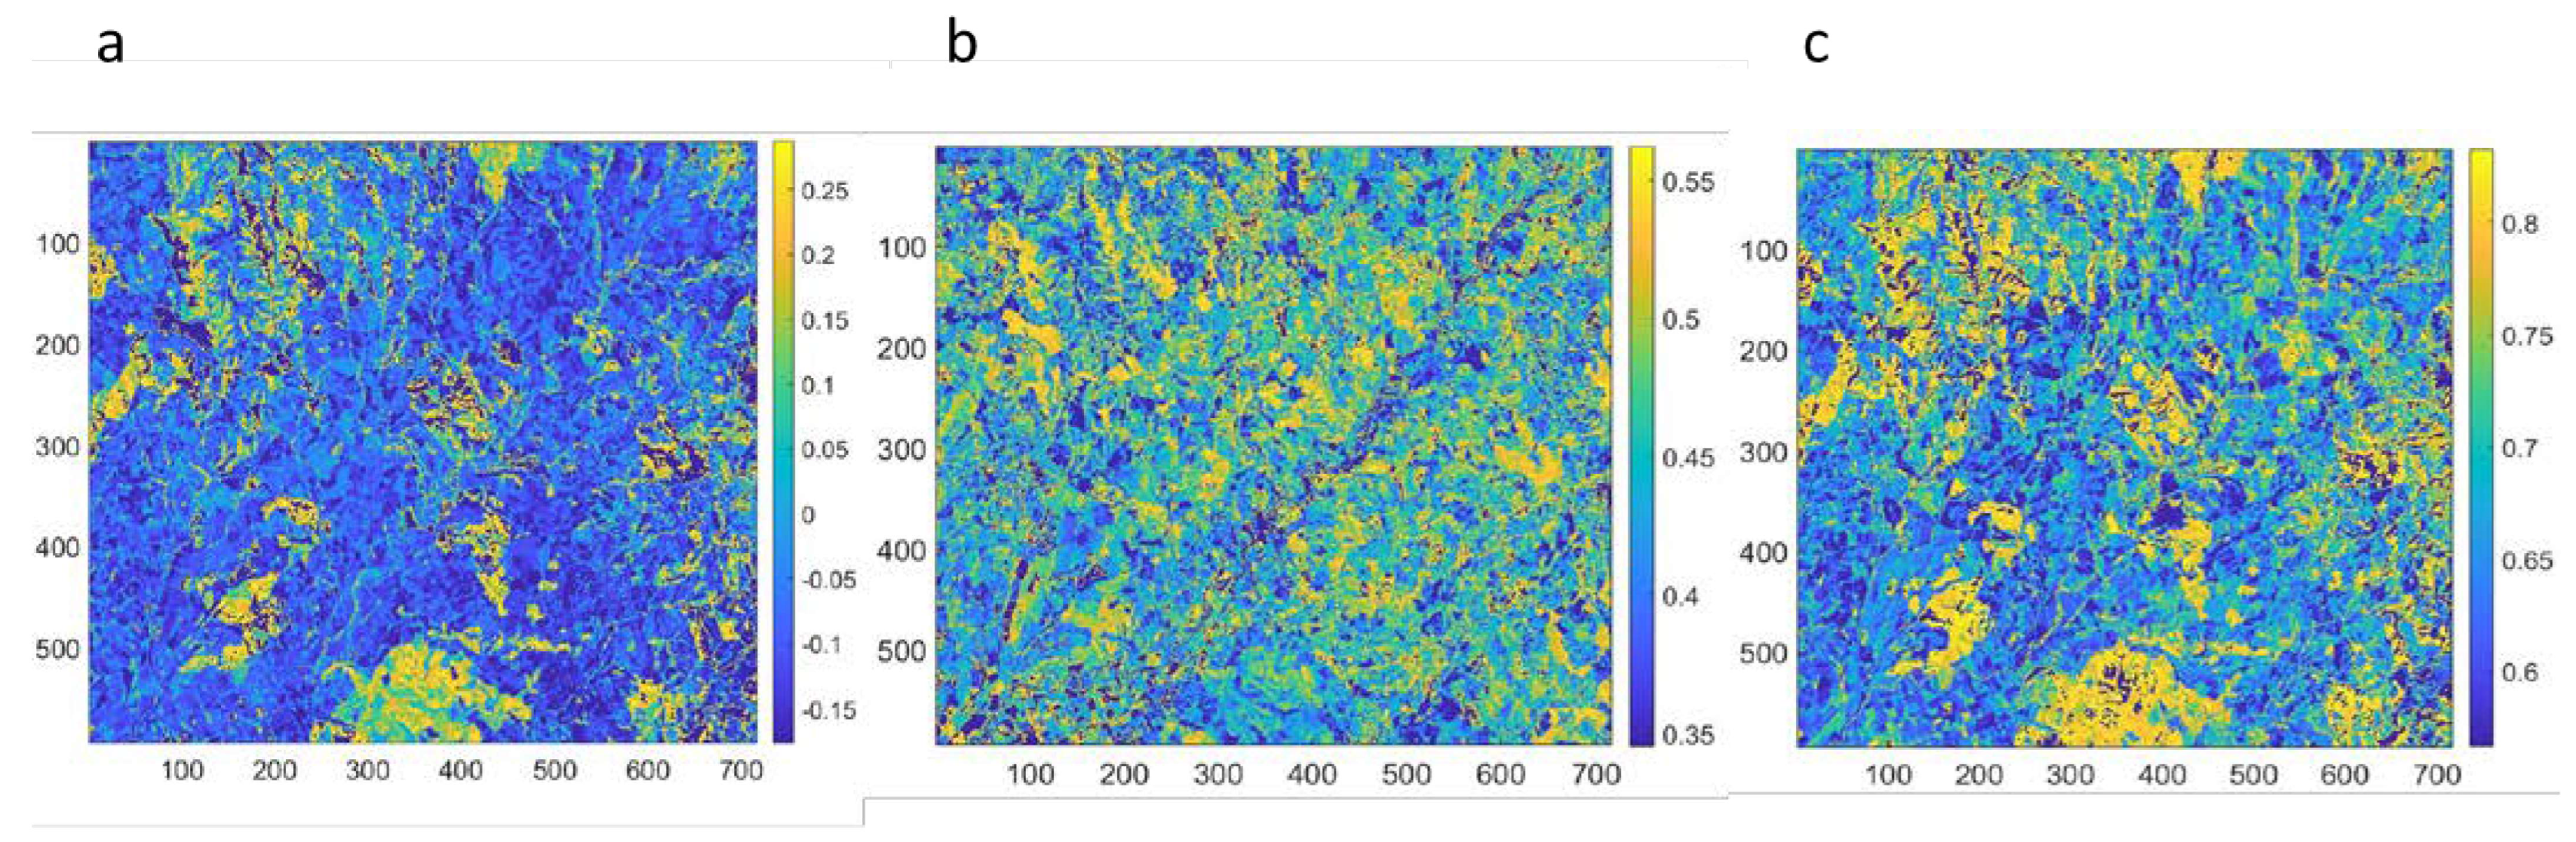
Figure 2.
Multispectral indices computed over the entire study area refer to the image acquired on 23 August 2017: (a) NDII, (b) NMDI and (c) VSDI.
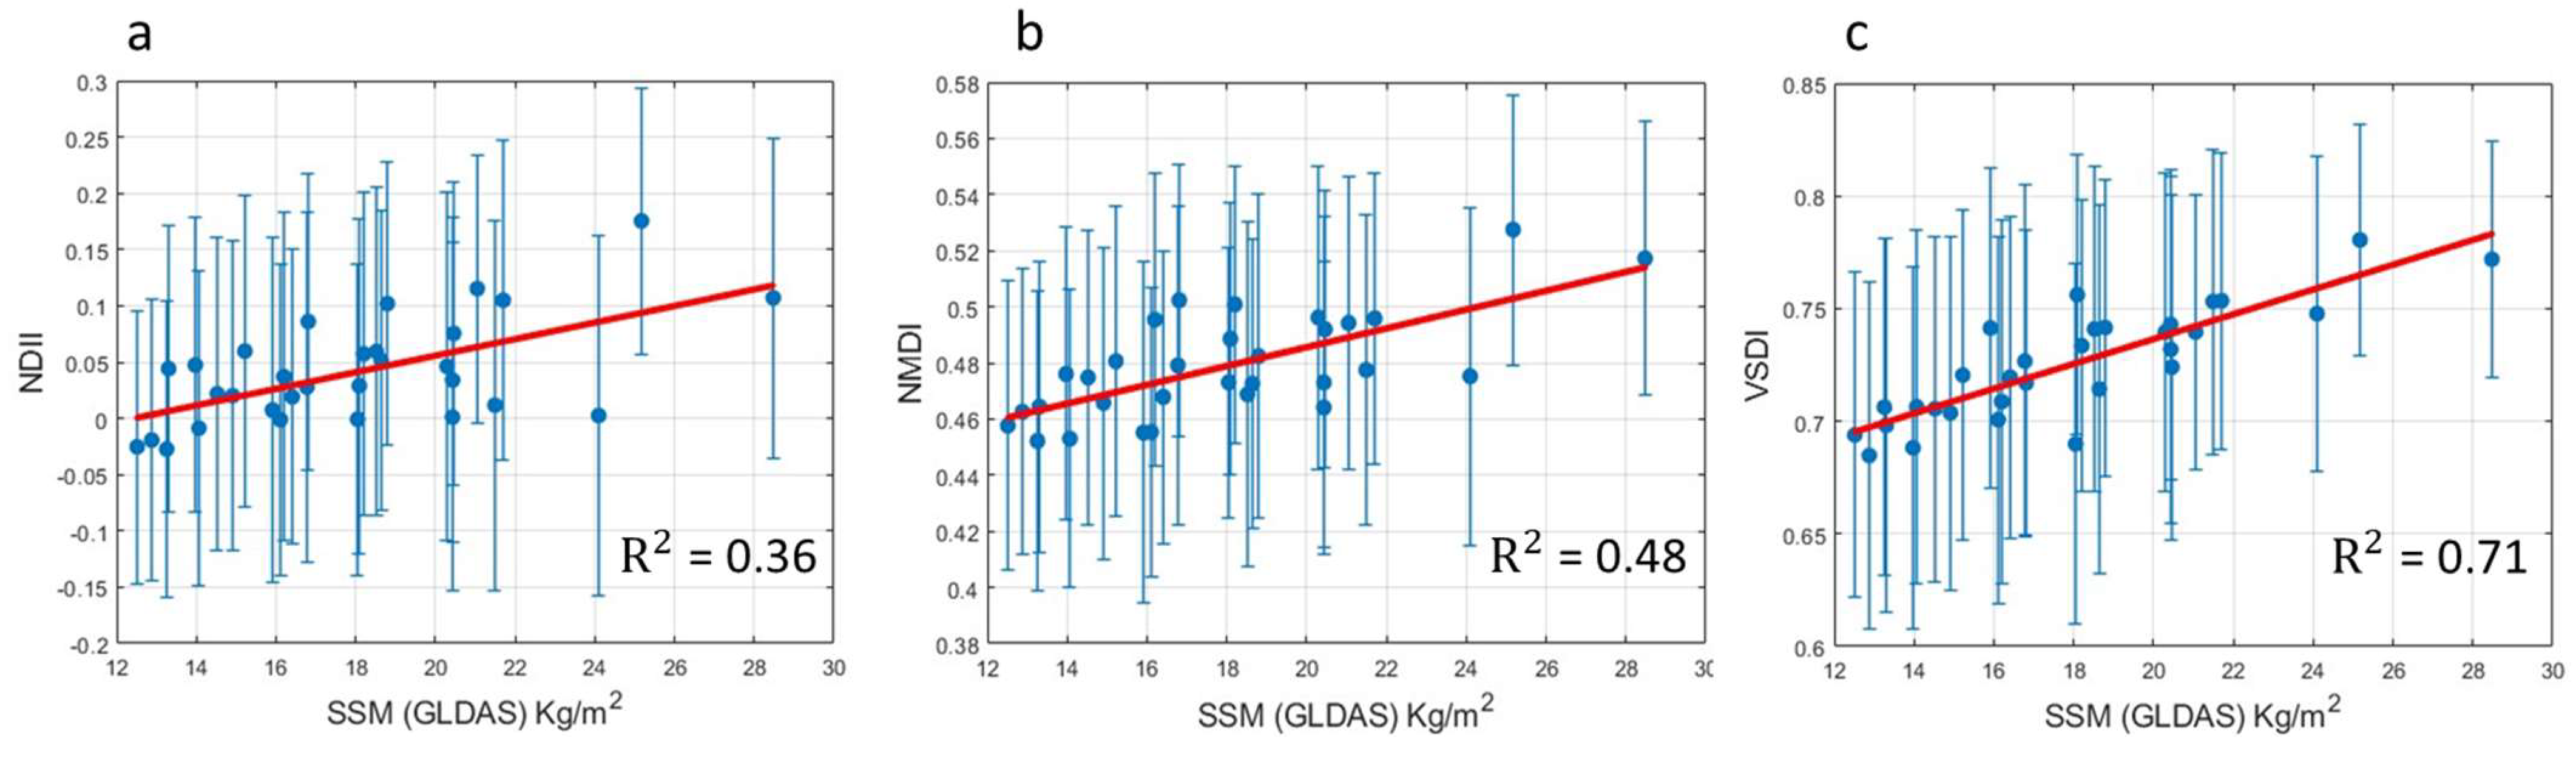
We then calculated the averaged value of each multispectral index for each image and compared it with the corresponding SM mean value estimates provided by GLDAS. We also studied the correlation between the indices and the SM by evaluating the Pearson Correlation Coefficient (PCC). In order to assess the statistical significance of the analysis, for each computed PCC, we also computed the relevant p-values, which were all below. Then, we plotted the scatterplots for each index compared with SM estimates and their relative coefficients of determination (R2), as shown in Figure 3. The results showed that the multispectral indices, computed over the entire study area, had different abilities in monitoring SM estimates. NDII was the index with the worst performances (PCC = 0.60 and R2 = 0.36), with a p-value of 3.5 × 10⁻⁴; NMDI showed a medium-low ability to monitor SM (PCC = 0.69 and R2 = 0.48), with a p-value of 2 × 10⁻⁵; and VSDI was the index with the best performance (PCC = 0.84 and R2 = 0.71), with a p-value of 2.5 × 10⁻⁹.
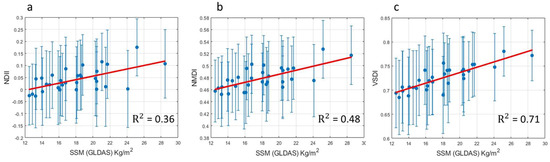
Figure 3.
Scatterplot of each multispectral index in function of the SM estimates and their relative linear regression (red line): (a) NDII, (b) NMDI and (c) VSDI.
4. Conclusions
In this work, we assessed the performance of three different multispectral indices proposed in the literature to monitor SM by analyzing a multitemporal sequence of Landsat-8 satellite images acquired in summer from 2017 to 2020. The comparison of their temporal trend against the relevant SM estimates derived from GLDAS 2.1 showed a significantly better performance from VSDI with respect to the other indices.
Author Contributions
Conceptualization, A.G., R.C., S.B. and V.R.; methodology, A.G., R.C., S.B. and V.R.; software, A.G. and R.C.; validation, A.G., R.C., S.B. and V.R.; formal analysis, A.G. and R.C.; investigation, A.G., R.C., S.B. and V.R.; resources, R.C. and V.R.; data curation, A.G. and R.C.; writing—original draft preparation, A.G. and R.C.; writing—review and editing, A.G., R.C., S.B. and V.R.; visualization, A.G. and R.C.; supervision, V.R.; project administration, V.R.; funding acquisition, V.R. All authors have read and agreed to the published version of the manuscript.
Funding
This research received no external funding.
Institutional Review Board Statement
Not applicable.
Informed Consent Statement
Not applicable.
Data Availability Statement
Data analyzed in this study are publicly available at: https://earthexplorer.usgs.gov (accessed on 25 October 2023).
Conflicts of Interest
The authors declare no conflict of interest.
References
- Cole, R.H. Time Domain Reflectometry. Annu. Rev. Phys. Chem. 1997, 28, 283–300. [Google Scholar] [CrossRef] [PubMed]
- Magagi, R.; Jammali, S.; Goïta, K.; Wang, H.; Colliander, A. Potential of L- and C- Bands Polarimetric SAR Data for Monitoring Soil Moisture over Forested Sites. Remote Sens. 2022, 14, 5317. [Google Scholar] [CrossRef]
- Musick, H.B.; Pelletier, R.E. Response of Some Thematic Mapper Band Ratios to Variation in Soil Water Content. Photogramm. Eng. 1986, 52, 1661–1668. [Google Scholar]
- Raymond Hunt, E.; Rock, B.N.; Nobel, P.S. Measurement of Leaf Relative Water Content by Infrared Reflectance. Remote Sens. Environ. 1987, 22, 429–435. [Google Scholar] [CrossRef]
- Ma, S.; Zhou, Y.; Gowda, P.H.; Dong, J.; Zhang, G.; Kakani, V.G.; Wagle, P.; Chen, L.; Flynn, K.C.; Jiang, W. Application of the Water-Related Spectral Reflectance Indices: A Review. Ecol. Indic. 2019, 98, 68–79. [Google Scholar] [CrossRef]
- Hardisky, M.A.; Smart, R.M. Growth Response and Spectral Characteristics of a Short Spartina Altemiflora Salt Marsh Irrigated with Freshwater and Sewage Effluent. Remote Sens. Environ. 1983, 13, 57–67. [Google Scholar] [CrossRef]
- Wang, L.; Qu, J.J. NMDI: A Normalized Multi-Band Drought Index for Monitoring Soil and Vegetation Moisture with Satellite Remote Sensing. Geophys. Res. Lett. 2007, 34, L20405. [Google Scholar] [CrossRef]
- Zhang, N.; Hong, Y.; Qin, Q.; Liu, L. VSDI: A Visible and Shortwave Infrared Drought Index for Monitoring Soil and Vegetation Moisture Based on Optical Remote Sensing. Int. J. Remote Sens. 2013, 34, 4585–4609. [Google Scholar] [CrossRef]
- Rodell, M.; Houser, P.R.; Jambor, U.; Gottschalck, J.; Mitchell, K.; Meng, C.-J.; Arsenault, K.; Cosgrove, B.; Radakovich, J.; Bosilovich, M.; et al. The Global Land Data Assimilation System. Bull. Am. Meteorol. Soc. 2004, 85, 381–394. [Google Scholar] [CrossRef]
Disclaimer/Publisher’s Note: The statements, opinions and data contained in all publications are solely those of the individual author(s) and contributor(s) and not of MDPI and/or the editor(s). MDPI and/or the editor(s) disclaim responsibility for any injury to people or property resulting from any ideas, methods, instructions or products referred to in the content. |
© 2023 by the authors. Licensee MDPI, Basel, Switzerland. This article is an open access article distributed under the terms and conditions of the Creative Commons Attribution (CC BY) license (https://creativecommons.org/licenses/by/4.0/).