


Abstract
Labour-driven grading of apples can be inconsistent because quality judgments may vary between inspectors, particularly for internal attributes such as sweetness that cannot be determined reliably from appearance alone. Artificial intelligence offers a more consistent alternative; however, its performance can be affected when the available training data are limited and unevenly distributed across quality classes. The multispectral apple dataset used in this work comprises images acquired in eight discrete spectral bands for non-destructive apple sweetness classification. For sweetness classification, the available samples remain imbalanced across Brix ranges, making minority class recognition more difficult. Five deep learning architectures—AppleNet, MobileNetV3-Small, EfficientNet-B0, ResNet18, and Swin-Tiny—were first compared using five-fold cross-validation on the real dataset. EfficientNet-B0 and Swin-Tiny achieved mean accuracies of approximately 94%, while AppleNet showed substantially weaker and more class-biased predictions. EfficientNet-B0 was then evaluated using classical augmentation, GAN, DDPM, and DDPM2 with different synthetic data proportions. The generated samples were further examined using structural, perceptual, feature distribution, diversity, and class fidelity measures. Augmented training improved class-wise consistency and fold-level performance, although larger synthetic proportions gradually reduced correspondence with the real data distribution. The results indicate that synthetic augmentation is most effective when sample quantity is controlled together with fidelity and class preservation.
1. Introduction
Apple sorting is an essential process after harvesting since the economic value of the fruit is based on the appearance and intrinsic quality of the product, including its visual features, type of cultivar, maturity, surface, hardness, and sweetness. In traditional supply chain networks, some of these factors are assessed using manual methods or destruction in laboratories. Inspection based on manual analysis is highly dependent on human senses and experience, and thus the process may lead to subjectivity whenever a large quantity of fruits needs to be analysed. Internal properties are yet another complication, since parameters like soluble solids concentration (SSC) in °Brix, which is very much linked to the degree of fruit sweetness, cannot be determined by looking at the fruit alone. Rapid and non-destructive techniques for determining fruit quality have gained importance in recent years [1,2,3]. Optical sensors combined with artificial intelligence constitute a good alternative to traditional fruit inspection systems. For example, multispectral and hyperspectral sensors collect information in addition to traditional visual (RGB) appearance through the wavelength response of the fruit tissues.
Such spectral data can provide information on variations due to chemical content and physiological state while at the same time keeping the spatial information about form, colour, texture, and surface irregularities. In fact, some recent studies have demonstrated the possible use of spectral imaging along with deep learning techniques in the non-destructive evaluation of apple quality. This was illustrated in a study where the application of hyperspectral imaging and multi-attention convolutional neural networks resulted in high prediction accuracy for apple SSC (soluble solids content) [4], and spectral–spatial deep learning models have been for estimating other nutritional components together with SSC [5]. In more recent times, the application of deep learning to near-infrared spectroscopy has proved the feasibility of simultaneously determining the place of origin of the apple and estimating the SSC value of the fruit [6].
Recent advances in multispectral imaging have also enabled the development of publicly available apple datasets for non-destructive quality assessment. A multispectral apple dataset containing 32,463 images acquired across eight spectral bands was developed for three grading tasks: assessing sweetness, assessing ripeness, and recognising cultivars [7].
The dataset of having 1620 images for sweetness while 29,160 images for ripeness identification and 1683 images for cultivars identification [7]. In the exiting benchmark work, AppleNet architecture is used as by achieving 87% accuracy for classification of ripeness, for identification of cultivars for apple including the 65% for detection of sweetness at Brix level [3,7]. The noticeably lower performance obtained for sweetness suggests that Brix-related information is more difficult to model accurately, particularly when only a small number of independently labelled fruits are available and the class frequencies are not evenly distributed.
Recent studies have also explored lightweight and attention-oriented deep learning architectures for fruit detection, defect recognition, and disease classification [8,9,10]. Related studies have further demonstrated the value of hyperspectral imaging and spectral-data fusion for non-destructive evaluation of internal apple quality and SSC [11,12].
Class imbalance is a common problem in agricultural datasets because collecting equal numbers of observations across varieties, maturity stages, quality levels, or defect categories is often difficult. This issue becomes even more severe when the use of destructive reference measurements is needed, for instance, for sweetness evaluation. An uneven distribution of classes could lead to classifier bias toward more frequent classes and low detection rates for less typical classes’ features [13]. As a consequence, the derived decision boundaries are likely to favour the majority classes and result in less efficient distinction of underrepresented quality groups.
Conventional augmentation methods like rotation, flipping, cropping, scaling, and colour alteration help enhance the effective training set in terms of size while retaining the content of the originals. Nevertheless, these transformations remain based on existing samples and do not add much new variation.
Generative modeling provides an alternative approach by learning the underlying data distribution and generating samples possessing greater diversity in their appearance. Denoising Diffusion Probabilistic Models (DDPMs) represent a generative modeling technique that is based on the concept of learning to gradually reverse the noise-adding process to produce new samples from random noise [14]. The utilization of diffusion-based data augmentation in agriculture has recently gained attention since the generated samples add variation instead of only reproducing the modified versions of previously existing image samples. The effectiveness of diffusion-augmented images has been previously illustrated in the process of classifying agricultural image samples for the detection of certain plant diseases [15,16,17]. Nonetheless, its efficacy heavily relies on the sample quality and the number of samples created. In multispectral fruit grading, the issue remains relatively unexplored, particularly with regard to the internal quality indicators like sweetness and the separation of fruit classes based on Brix degrees.
Classifier selection is important because different architectures offer different trade-offs in representation capacity, model size, and computational cost. MobileNetV3 emphasis computational efficiency [18], EfficientNet balances network depth, width, and resolution [19], ResNet provides a strong residual convolutional baseline [20], and Swin Transformer captures local and cross-window relationships through shifted-window self-attention [21]. Evaluating these models under identical data partitions therefore provides a consistent basis for selecting a classifier for the subsequent augmentation experiments.
More recent hyperspectral studies have investigated feature-learning approaches for apple SSC estimation and have also examined prediction across different cultivars, seasons, and geographical sources [22,23]. A further challenge is the limited and uneven distribution of samples across sweetness classes. The original sweetness subset comprised 19 individual apples and 171 grouped multispectral observations distributed across the 10, 12–12.8, 13–13.8, and 15 °Brix groups. Since the 15 °Brix group was represented by only a single physical apple, it was removed from the experimental evaluation because this sample size was insufficient to create dependable training and test partitions under the adopted cross-validation procedure. The final analysis consequently used 18 physical apples and 162 grouped multispectral samples across the remaining three classes, with a class distribution of 3:2:1. Five architectures, AppleNet, MobileNetV3-Small, EfficientNet-B0, ResNet18, and Swin-Tiny, were first evaluated using five-fold cross-validation on the real dataset. Among these five architecture, one stable is selected for further implementation of augmented dataset, created using different techniques like classical augmentation, GAN, DDPM, and DDPM2-based synthetic data ratios of 25%, 50%, 100%, and 200%.
This study makes three main contributions. First, five deep learning models were examined using the same apple-level cross-validation scheme so that their predictive accuracy, class-specific performance, stability, and model complexity could be compared under identical conditions. Second, the quality of the generated samples was evaluated through a combination of structural, perceptual, feature-based, diversity, and class-consistency measures. Thirdly, different proportions of synthetic data is analyzed to understand the quality differences of synthetic data and any improvement in the classification of unseen real apples. The aforementioned contributions will play an important role in the systematic analysis of the synthetic augmentation process.
2. Materials and Methods
2.1. Dataset and Image Preparation
The data for sweetness was extracted from the multispectral apple database presented by Gaikwad et al. [7]. The dataset consists of the following five varieties: Kinnaur (K), Red Delicious USA (RDU), Red Delicious New Zealand (RDNZ), Royal Gala (RG), and Washington (W). Examination of the available sweetness records identified 19 physical apples, including 4 apples from each of the K, RDU, RDNZ, and RG types and 3 Washington apples. Although the published sweetness subset reports 1620 source images, inspection of the available records yielded 1539 images corresponding to these 19 apples. The available sweetness subset contained 19 physical apples, as summarized in Table 1. Soluble solids content was measured using a handheld refractometer and is expressed in °Brix.
Table 1.
Sweetness dataset distribution before class consolidation.
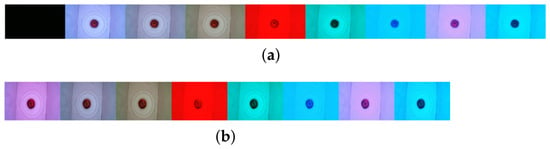
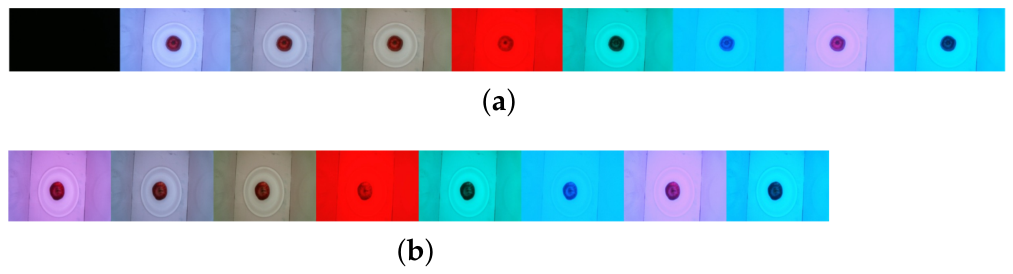
Each physical apple contributed nine grouped acquisitions. A grouped acquisition consisted of one black reference frame and eight illumination images, each recorded at 1920 × 1080 pixels (1080p). The black reference frame was used for dark reference correction and was not included in the classifier input, as shown in Figure 1. Each of the eight light images was individually processed, and from each of them, an ROI of an apple was identified. This apple ROI was then scaled down to pixels using bilinear interpolation before the training process of the model. Here each image is identified as being original physical apple and combined preserved by preprocessing and evaluation of stages.
Figure 1.
Representative samples from the source dataset [7]: (a) original grouped sample containing the black reference image together with the eight wavelength-specific images; (b) corresponding multispectral sample after removal of the black reference image.
The initial sweetness values were reorganized into three broader categories to create a clearer and more practical classification scheme. Samples measured at 12, 12.1, 12.5, and 12.8 °Brix were grouped together under the 12–12.8 °Brix category, whereas the 13 and 13.8 °Brix measurements were merged into the 13–13.8 °Brix category, as presented in Table 2. Samples measured at 10 °Brix were kept as an independent category. The 15 °Brix group was not used in the experimental evaluation because it was represented by only one apple, which was insufficient for forming dependable training and validation partitions. Removing this category left 18 physical apples and 162 grouped multispectral observations for the subsequent analysis.
Table 2.
Three-class dataset used for sweetness classification.
Following the class consolidation and removal of the unsupported category, the analysis used 18 individual apples assigned to three sweetness groups: 10 °Brix, 12–12.8 °Brix, and 13–13.8 °Brix. These apples produced 162 grouped samples, with each grouped sample containing 8 processed illumination images, resulting in 1296 processed images. The three classes contained 9, 6, and 3 physical apples, corresponding to 81, 54, and 27 grouped samples and 648, 432, and 216 processed images, respectively. Because multiple processed images originated from the same physical fruit, the 1296 images were not treated as independent biological samples. The unequal class sizes also confirm that class imbalance remained in the final dataset.
2.2. Experimental Methodology
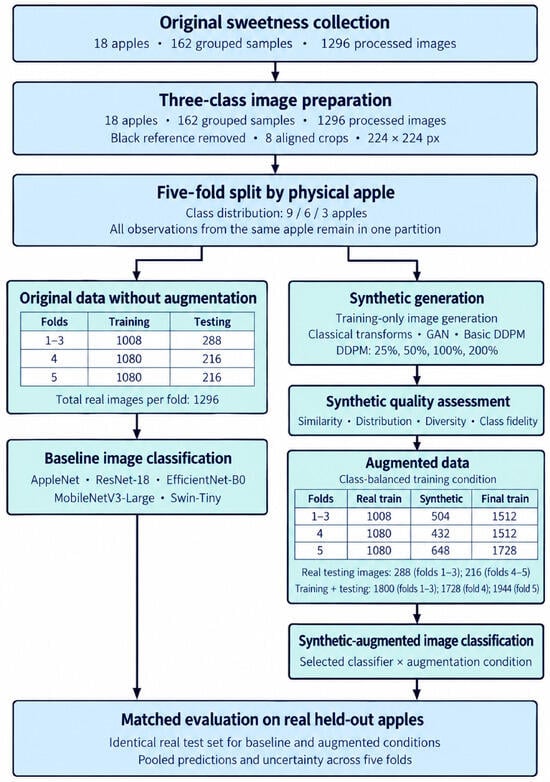
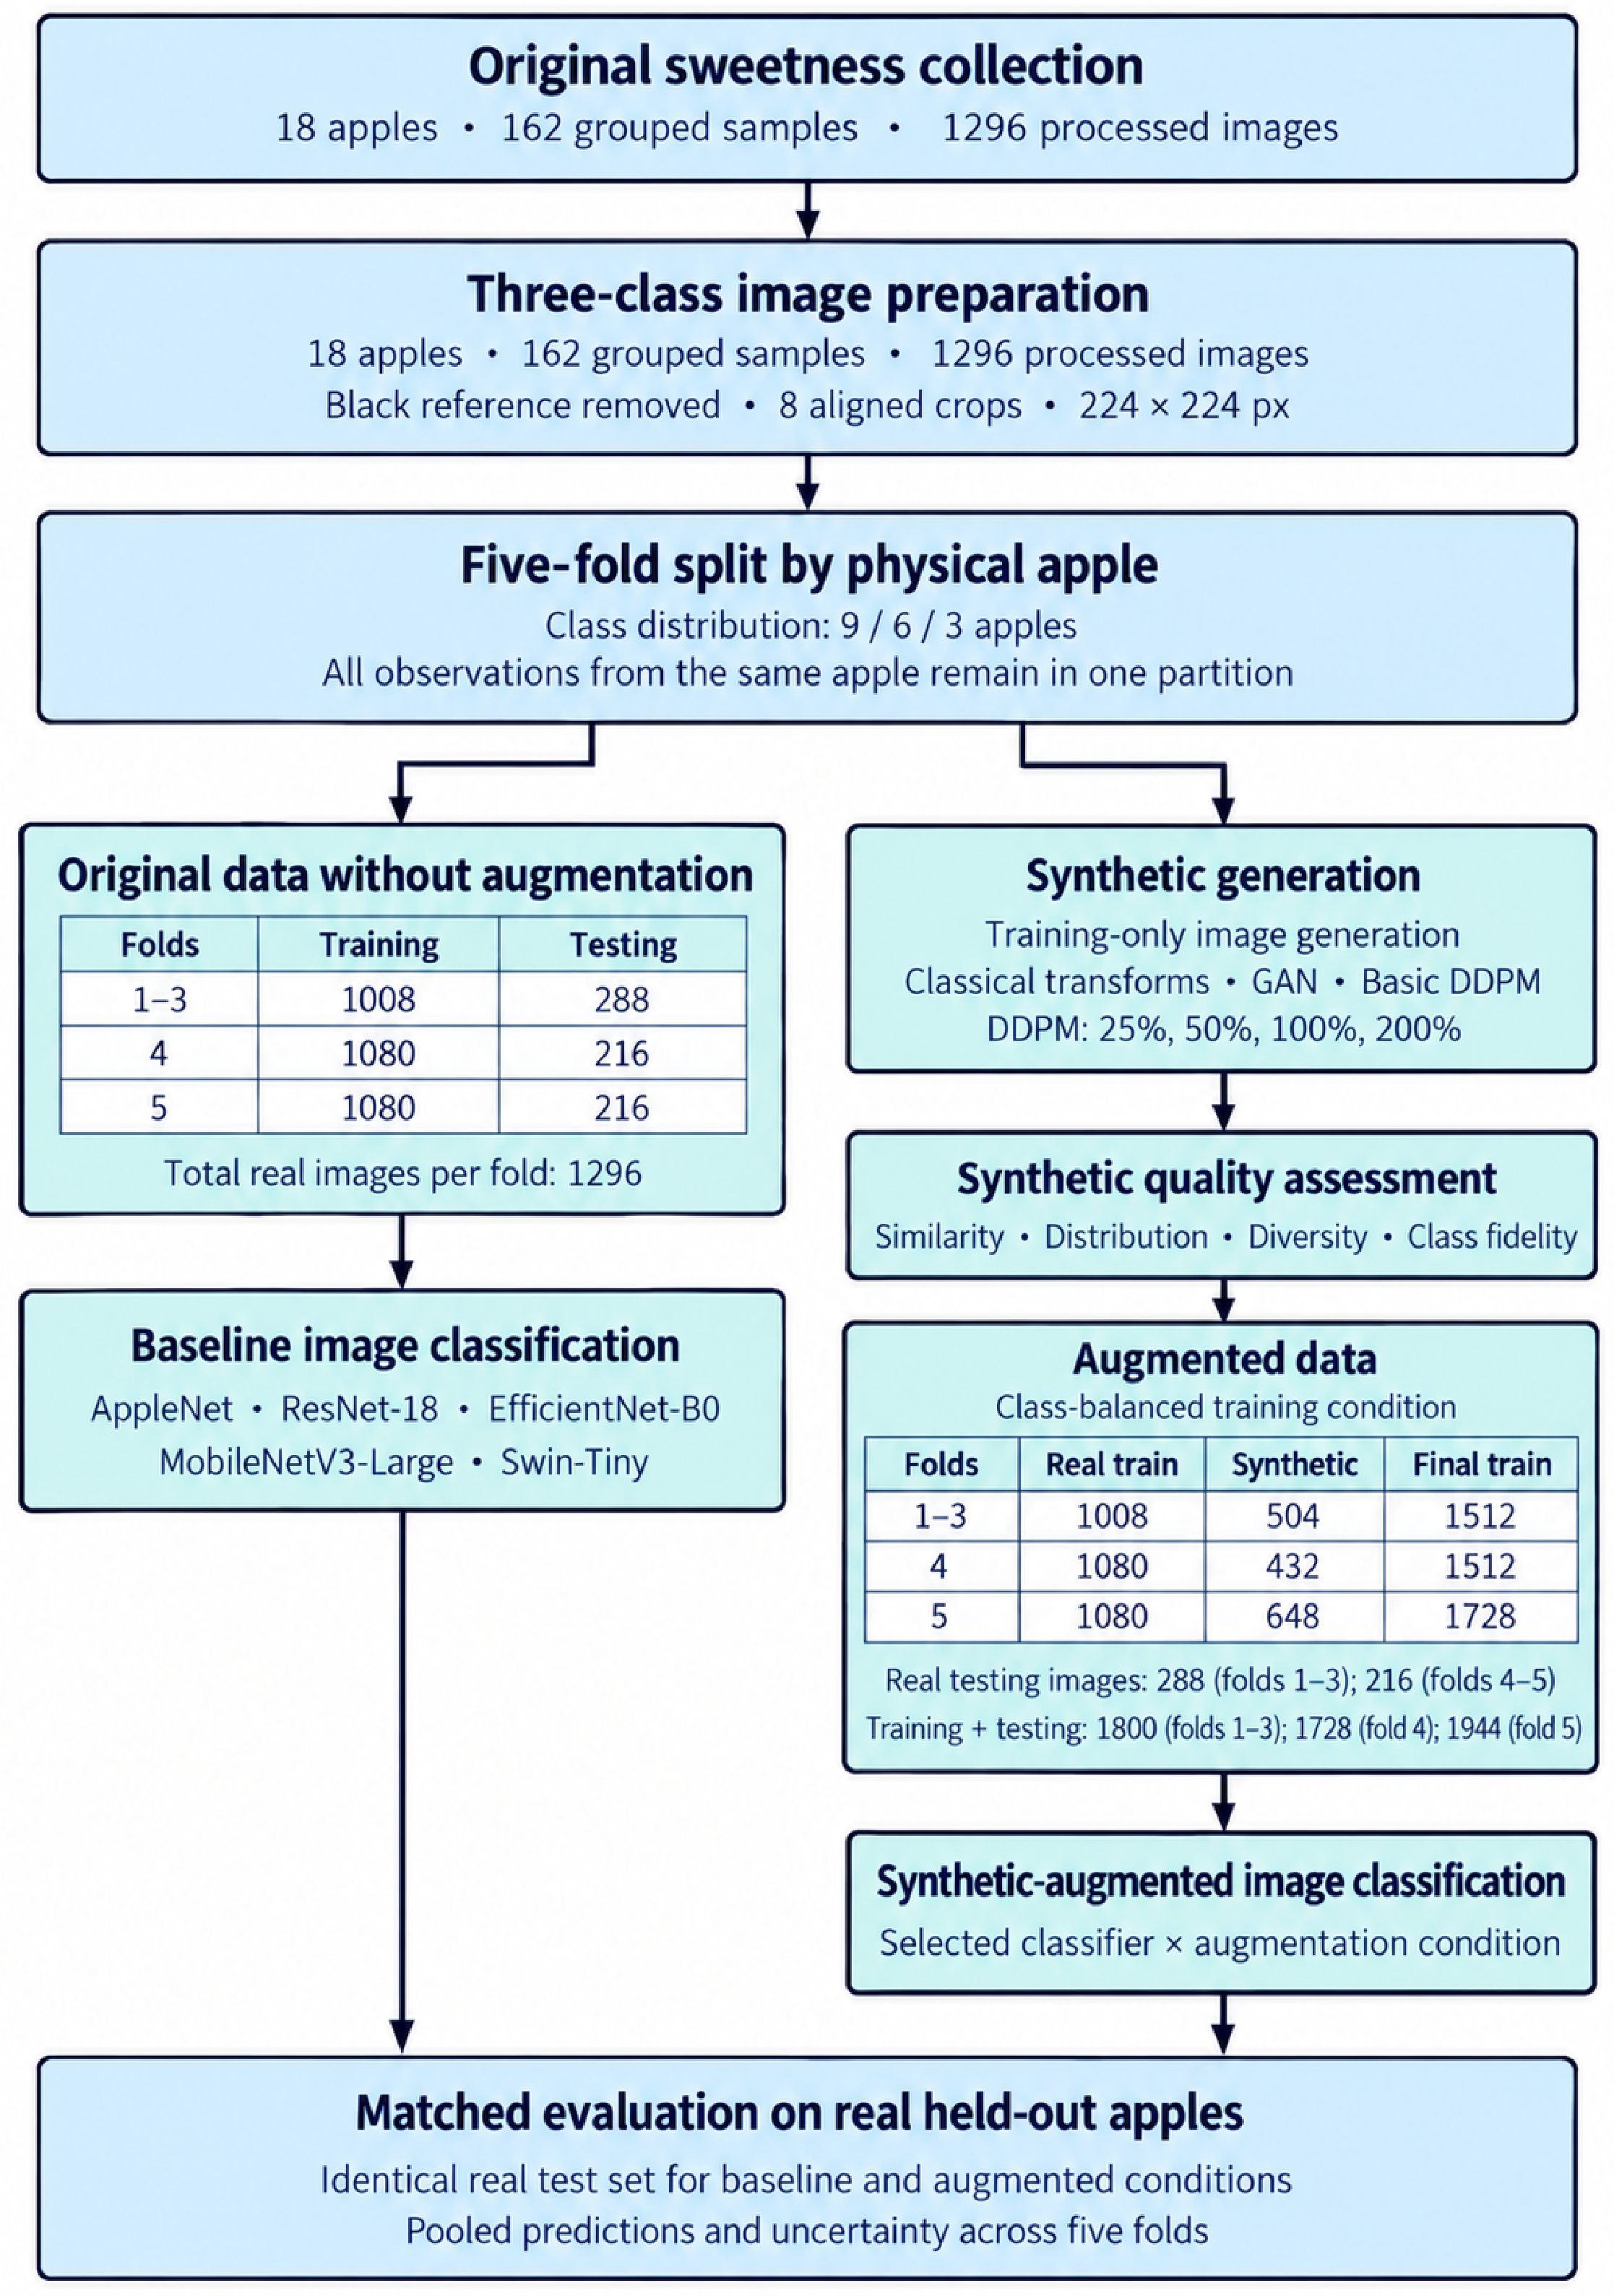
The overall experimental workflow, including preprocessing, apple-level cross-validation, model comparison, synthetic data generation, quality assessment, and final classification evaluation, is summarised in Figure 2.
Figure 2.
Workflow for multispectral apple sweetness classification using original data and training-only synthetic augmentation. Fold-wise image counts are shown for the class-balanced condition, with evaluation on unchanged real test sets.
2.2.1. Cross-Validation and Model Comparison
To evaluate the classification models while preventing observations from the same fruit from appearing in both training and testing, five-fold cross-validation was performed at the physical apple level. All nine grouped acquisitions belonging to a given apple were assigned together to the same held-out fold. The resulting fold distribution is summarized in Table 3.
Table 3.
Apple-level distribution used in the five-fold cross-validation.
In Folds 1–3, four physical apples were held out for testing, comprising two apples from the 10 °Brix class and one apple from each of the 12–12.8 and 13–13.8 °Brix classes. These folds therefore contained 36 grouped test samples and 126 grouped training samples. As each grouped sample contributed eight processed illumination images, this corresponded to 288 test images and 1008 training images.
In Folds 4 and 5, three apples were used for testing, giving 27 grouped test samples and 135 grouped training samples. These partitions contained 216 test images and 1080 training images, respectively. Across all five folds, each of the 18 physical apples appeared once in a held-out partition, while the remaining apples were used for training in the other folds.
The fold assignments were established before any augmentation or synthetic data generation. Normalisation, augmentation, and synthetic generation were applied only to the training partition of each fold, whereas the corresponding test partition contained real samples only.
Five architectures were evaluated on the original real dataset: AppleNet, MobileNetV3-Small, EfficientNet-B0, ResNet18, and Swin-Tiny. AppleNet was included as the dataset-specific baseline [3,7]. MobileNetV3-Small represents a lightweight convolutional architecture designed for computational efficiency [18], while ResNet18 provided a residual convolutional baseline [20]. EfficientNet-B0 was included because its compound scaling strategy provides a useful balance between representational capacity and computational cost [19]. Swin-Tiny provided a hierarchical Transformer-based comparison using shifted-window self-attention [21]. All architectures were trained and evaluated using identical data partitions and class definitions.
AppleNet provides a dataset-specific baseline because it was developed for the source apple-imaging task [3,7]. Its output layer was adapted to the present three-class problem, and it was trained using the same real folds as the other networks. Its classification and computational measurements provided a reference for evaluating the general-purpose architectures.
ResNet-18 was included as a moderate-depth convolutional model using residual connections [20]. It was trained and evaluated on the identical held-out apples used for the other classifiers. Its parameter count and measured inference duration were considered alongside predictive performance when assessing its practical suitability.
EfficientNet-B0 was included as the baseline member of the EfficientNet architecture family [19]. It was trained and evaluated on the identical held-out apples used for the other classifiers. Its parameter count and measured inference duration were considered alongside predictive performance when assessing its practical suitability.
MobileNetV3-Small was included as an efficiency-oriented convolutional architecture [18]. It was trained independently for each fold and evaluated using the corresponding real held-out apples. Its comparison with EfficientNet-B0 allowed the two efficiency-oriented architectures to be assessed under the same image-processing and cross-validation protocol.
Swin-Tiny was included as a hierarchical Transformer based on shifted-window attention [21]. It follows the same training and evaluation protocol as the CNNs. It provides an attention-based comparison without assuming in advance that it is faster or better suited to edge deployment.
The eight illumination images belonging to each grouped sample remained associated during evaluation. The classifier processed the pixel illumination images individually, and the resulting class probability scores were averaged to obtain one prediction for each grouped sample. Apple-level predictions were subsequently obtained by aggregating the predictions from the nine grouped samples belonging to the same physical apple. Pooled out-of-fold predictions were used to calculate accuracy, macro-F1, per-class precision and recall, and confusion matrices; fold-level scores and computational measurements are also reported. Because the highest Brix range contained only three physical apples, two of the five test folds necessarily lacked that class. Pooled class metrics are therefore reported alongside the fold-level scores. The classifier used for the subsequent augmentation experiments was selected according to the highest mean five-fold classification accuracy on the original real dataset, with macro-F1 and computational measurements used as supporting criteria.
2.2.2. Training-Only Augmentation and Synthetic Data Generation
The class-wise training counts were obtained from the apple-level fold structure reported in Table 3. Each apple yielded nine grouped observations, and every group produced eight processed illumination images, giving a total of 72 processed images per fruit. For complete class balancing, synthetic samples were added only to classes with fewer training images until their size reached that of the largest class in the same fold. This calculated shortfall was also used to define the DDPM2 augmentation levels of 25%, 50%, 100%, and 200%.
Table 4 summarizes the synthetic-image requirement for each fold after considering the original class composition. A total of 504 images had to be added in each of Folds 1–3, whereas Fold 4 required 432 synthetic samples. Fold 5 started with the same number of real training images as Fold 4, but its class distribution was less balanced, which increased the required synthetic count to 648. Once the balancing procedure was completed, Folds 1–4 each contained 1512 training images, while Fold 5 contained 1728.
Table 4.
Class-wise training distribution and synthetic samples required for balancing.
The final analysis included 18 independent apples, with only three fruits belonging to the highest Brix category. To reduce the possibility of information leakage, the cross-validation folds were established before any augmentation or synthetic-image generation was carried out. Within each fold, new samples were produced exclusively from the real training partition, while the corresponding test partition was kept untouched and consisted only of real observations.
Four augmentation settings were considered in the experiments. Classical augmentation served as the non-generative baseline and introduced only controlled transformations to the original training images. The GAN [24] and DDPM [14] models were trained separately within each fold using only its real training partition. An additional diffusion setting, referred to as DDPM2, was used to examine how changing the amount of synthetic data affected the experiment, with generated samples set at 25%, 50%, 100%, and 200% of the calculated minority-class shortfall.
In this formulation, denotes the real training count for class c, whereas is the largest class count within the corresponding fold. For any selected augmentation level q, the synthetic requirement was determined from . The 100% setting therefore generated enough samples to eliminate the existing class gap, while the 200% setting intentionally doubled that shortfall to examine whether a larger synthetic contribution could provide additional classification benefit. All held-out test sets remained strictly composed of real samples only.
2.2.3. Synthetic Image Quality Assessment
The synthetic images were assessed before classification through several complementary criteria covering structural similarity, perceptual quality, feature-space agreement, diversity, and class preservation. Structural resemblance was measured using the Structural Similarity Index Measure (SSIM) together with Peak Signal-to-Noise Ratio (PSNR) [25]. Differences in visual perception between real and generated images were further examined with Learned Perceptual Image Patch Similarity (LPIPS) [26]. Agreement in the learned feature space was measured through cosine similarity together with the distance to the closest real-sample representation. Differences between the real and generated feature distributions were further characterized using Fréchet Feature Distance (FFD) and an MMD/KID-like statistic based on Maximum Mean Discrepancy and Kernel Inception Distance [27]. In addition, synthetic-to-real diversity was estimated to examine whether the generated images contributed feature variation beyond that already present in the original training data. Class consistency was checked with the selected classifier by examining whether each generated sample was assigned to its intended Brix category. The relationship between real and synthetic representations in feature space was also explored visually through t-distributed Stochastic Neighbour Embedding (t-SNE) [28].
The classifier selected from the original data comparison was subsequently trained independently under classical augmentation, generative adversarial network (GAN), Denoising Diffusion Probabilistic Model (DDPM), and DDPM2 augmentation conditions using the same cross-validation partitions. Each augmentation condition was evaluated on the corresponding unchanged real test data. This design allowed differences in downstream performance to be associated with the training data strategy rather than with changes in classifier architecture or test set composition. The results of the model comparison and synthetic data experiments are presented in the following section.
3. Results
3.1. Sweetness Grading Using the Original Imbalanced Dataset
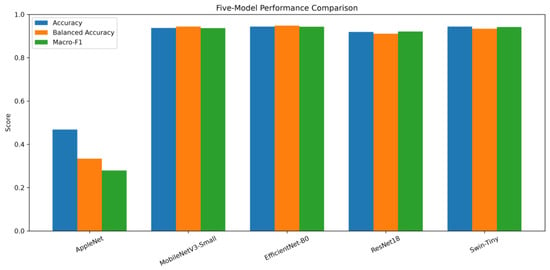
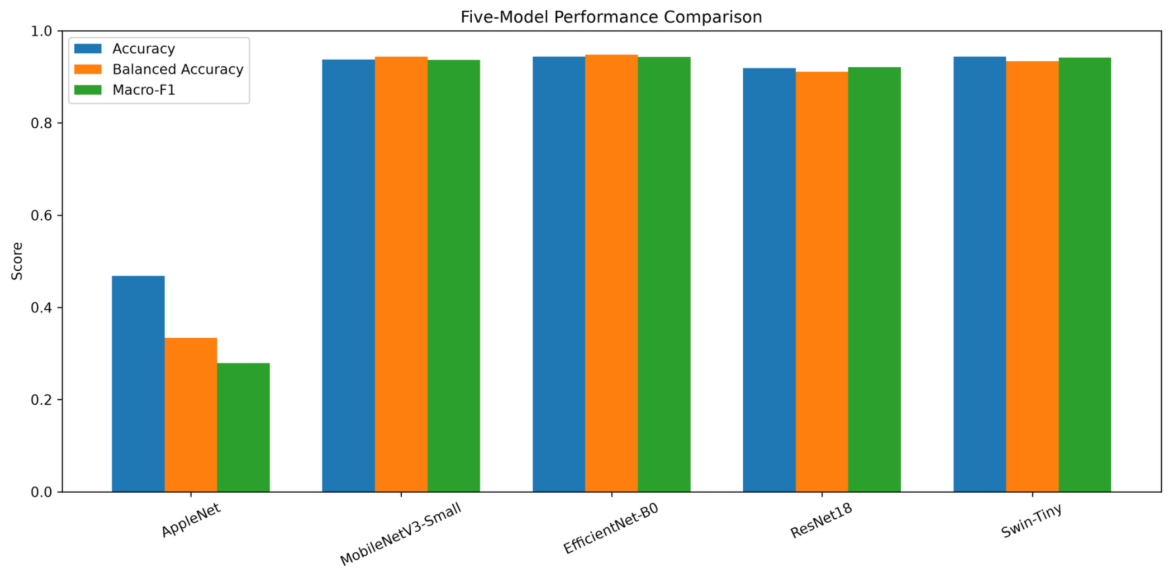
Performance on the real dataset varied substantially across the evaluated architectures, as reported in Table 5. The best mean accuracy was obtained by EfficientNet-B0 and Swin-Tiny, both reaching 0.944, while MobileNetV3-Small and ResNet18 achieved 0.938 and 0.919, respectively. A comparison of accuracy, balanced accuracy, and Macro-F1 is presented in Figure 3. Across these three evaluation measures, EfficientNet-B0 showed the most uniform overall behaviour among the tested models. EfficientNet-B0 also produced closely aligned values for accuracy (0.944), balanced accuracy (0.948), and Macro-F1 (0.943), reflecting a relatively even performance across the three sweetness categories. Swin-Tiny reached the same mean accuracy of 0.944; however, EfficientNet-B0 was preferred for the later augmentation experiments because it achieved better balanced accuracy (0.948 compared with 0.934), a marginally higher Macro-F1 score (0.943 compared with 0.942), lower variation across folds, and improved recall for the minority 13–13.8 °Brix group (0.96 compared with 0.89). This EfficientNet-B0’s results indicated that EfficientNet-B0 more stable and balanced performance across the three sweetness classes. Overall, these findings show that the stronger models handled the class imbalance more evenly. AppleNet, by comparison, reached a mean accuracy of 0.468, while its balanced accuracy and Macro-F1 were only 0.334 and 0.279. The greater variation observed across folds, together with its weak recall for the less represented classes, suggests that AppleNet was less suitable for the small and unevenly distributed training set used in this study.
Table 5.
Five-fold performance and class-wise recall of the evaluated models on the real dataset.
Figure 3.
Comparison of mean accuracy, balanced accuracy, and Macro-F1 across the five evaluated architectures on the real dataset.
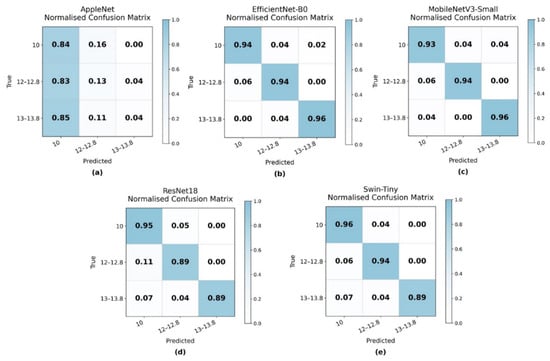
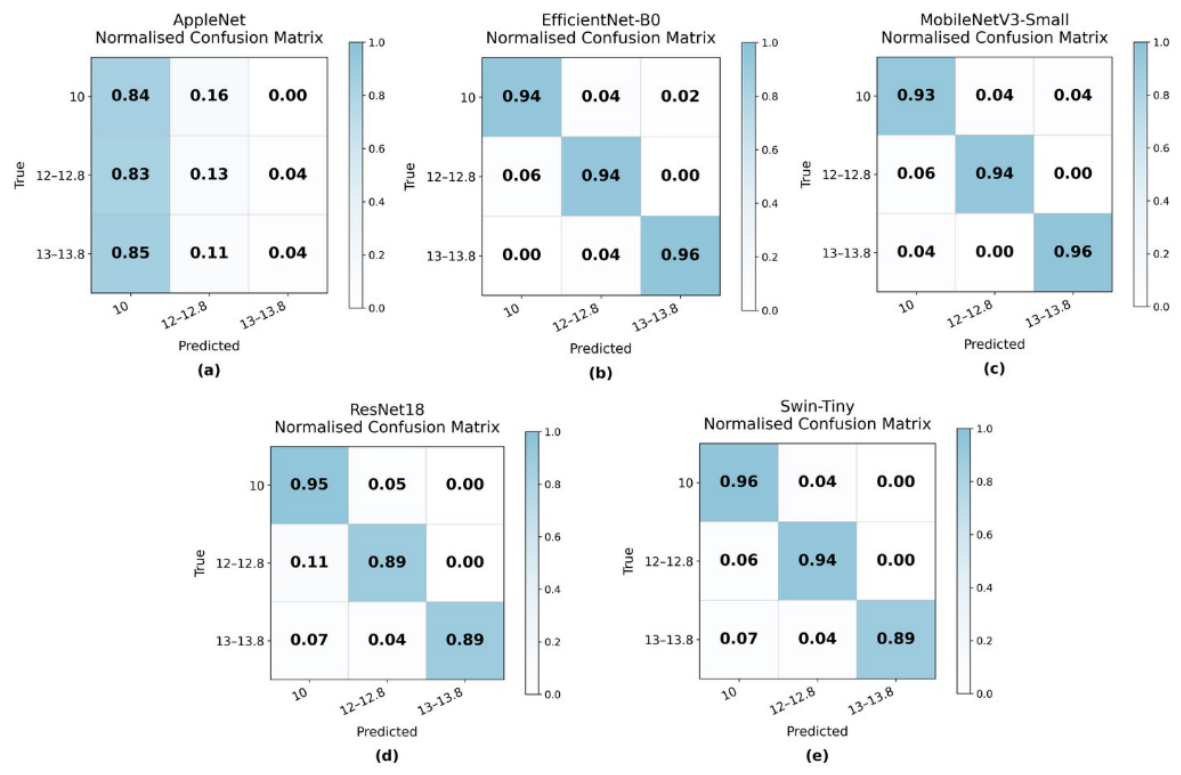
The class-wise prediction behaviour of the evaluated models is illustrated in Figure 4. EfficientNet-B0 correctly detected approximately 94%, 94%, and 96% of the three classes, whereas MobileNetV3-Small achieved corresponding recall values of 93%, 94%, and 96%.
Figure 4.
Normalised confusion matrices of the evaluated models: (a) AppleNet, (b) EfficientNet-B0, (c) MobileNetV3-Small, (d) ResNet18, and (e) Swin-Tiny.
Swin-Tiny achieved a recall of 96% for the 10 °Brix category as well as 94% for the 12–12.8 °Brix class; however, recall for the 13–13.8 °Brix category dropped to 89%. ResNet18 encountered a similar decline in the higher Brix classes.
AppleNet showed a markedly different class-wise pattern, correctly identifying 84% of the 10 °Brix samples but only 13% of the 12–12.8 °Brix class and 4% of the 13–13.8 °Brix class. Most errors were therefore concentrated toward the majority class, indicating weak separation of the two higher-Brix groups. EfficientNet-B0 and MobileNetV3-Small provided the maximum balanced class-wise recall, instead Swin-Tiny has achieved similar accuracy but shown the larger reduction of recall for class 13–13.8 °Brix class.
The optimisation behaviour of the evaluated models is summarized in Table 6, where training accuracy and loss are recorded at 10-epoch intervals across the five folds. These outcomes were used to compare the convergence behavior of the these five architectures and to understand whether additional training shown any meaningful improvements.
Table 6.
Mean training accuracy and loss at 10-epoch intervals across five folds.
EfficientNet-B0 showed fast optimisation, reaching an average training accuracy close to 1.00 by roughly epoch 40, while its mean loss decreased to less than 0.02. ResNet18 and Swin-Tiny followed similarly strong learning trends, whereas MobileNetV3-Small required more epochs to reach comparable training behaviour. AppleNet differed substantially, with training accuracy remaining around 0.50 and loss values staying above 1.06 even toward the end of training. This weak convergence pattern was consistent with its comparatively poor performance on the test data.
3.2. Synthetic Data Quality and Augmentation Analysis
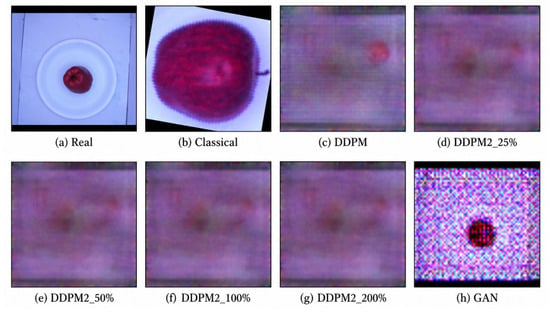
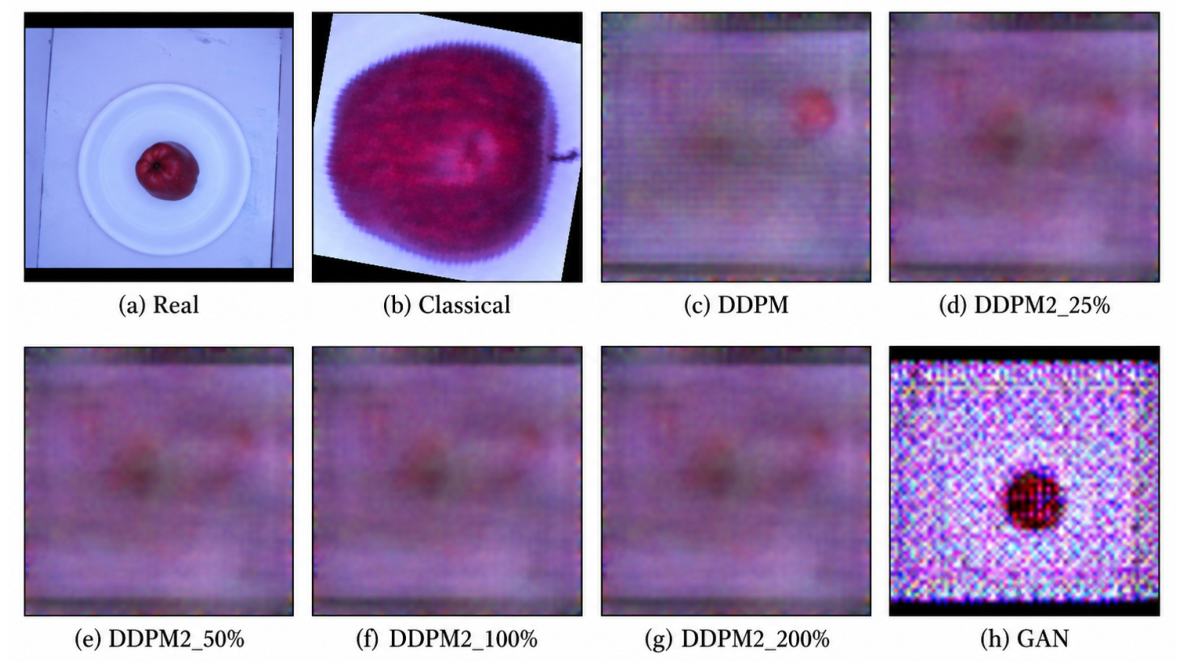
Additional training samples were introduced to lessen the imbalance among the sweetness categories, using classical transformations as well as GAN-, DDPM-, and DDPM2-based generation. Figure 5 shows representative real and synthetic examples from the 12–12.8 °Brix class. Images produced through classical augmentation retained much of the appearance of their source samples, whereas the generative methods created a wider range of differences in texture, colour, and background characteristics.
Figure 5.
Representative real and augmented images from one illumination wavelength for the 12–12.8 °Brix class: (a) real image, (b) classical augmentation, (c) DDPM, (d) DDPM2_25%, (e) DDPM2_50%, (f) DDPM2_100%, (g) DDPM2_200%, and (h) GAN.
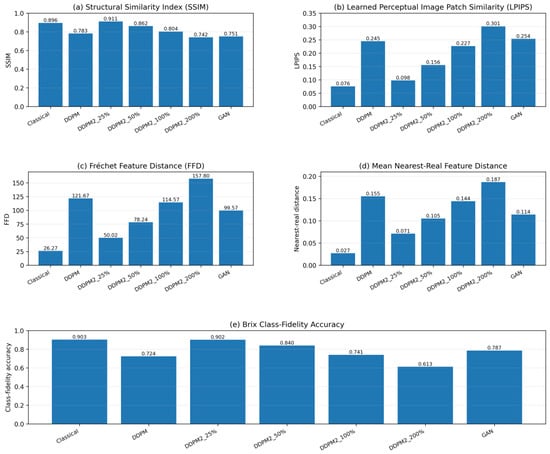
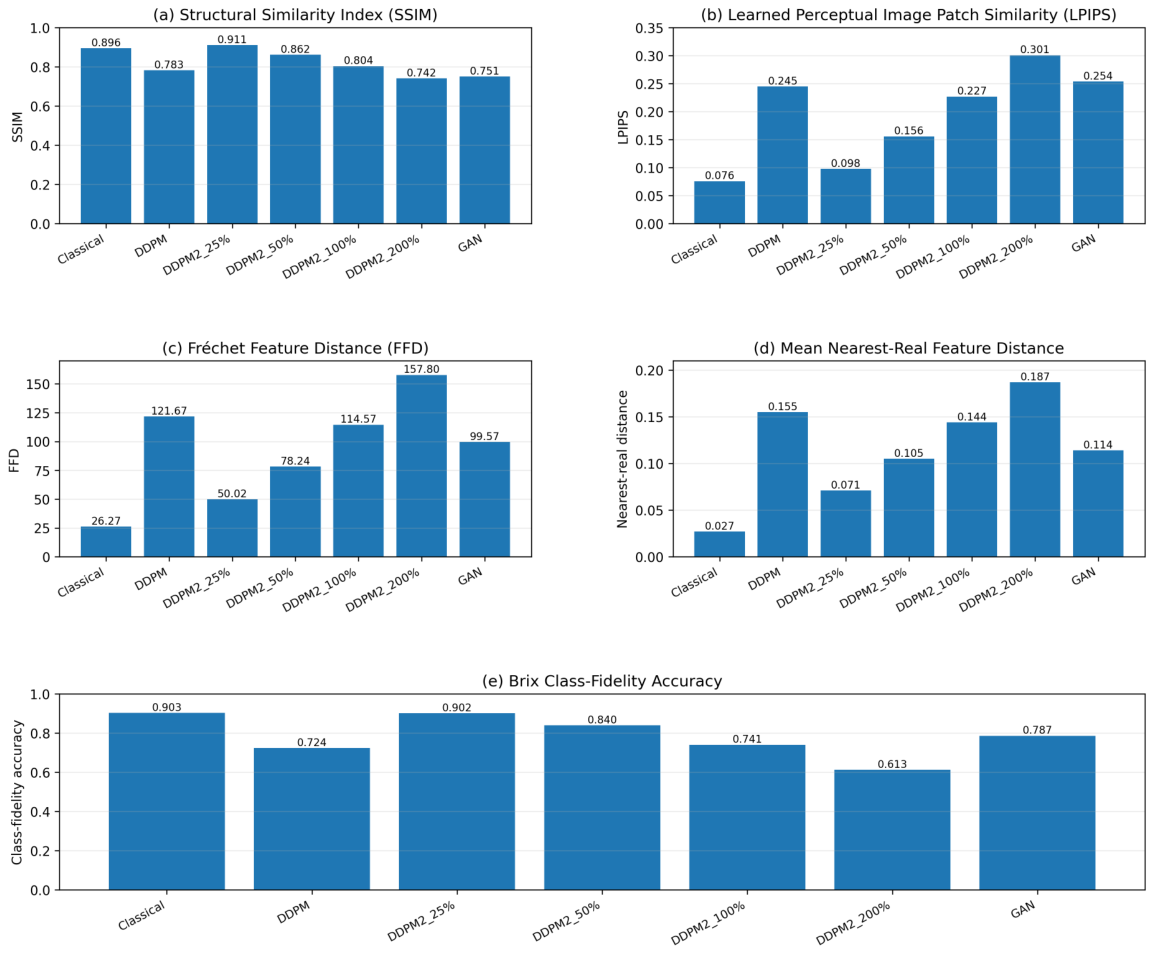
Table 7 represents quality and fidelity comparison of augmentation methods with repsect to the original data. For the classical techniques of augmentation showing Highest corresponding as per real samples, calculating the lowest FFD of 26.27, an MMD/KID as per the values of 0.077, with a nearest feature distance of 0.027. This has achieved as being highest featured space of cosine similarity, of value 0.979. Among the generative alternatives, DDPM2_25% shown the most favourable compromise between sample fidelity and added variation. As the proportion of DDPM2-generated sample of data increased, agreement with the real samples became weaker. SSIM decreased from 0.911 for the 25% setting to 0.742 for the 200% setting, while FFD increased from 50.02 to 157.80 across the same range. The Kruskal–Wallis analysis further showed statistically significant differences among the augmentation methods for the examined quality measures ().
Table 7.
Comparison of synthetic data quality and fidelity across augmentation strategies.
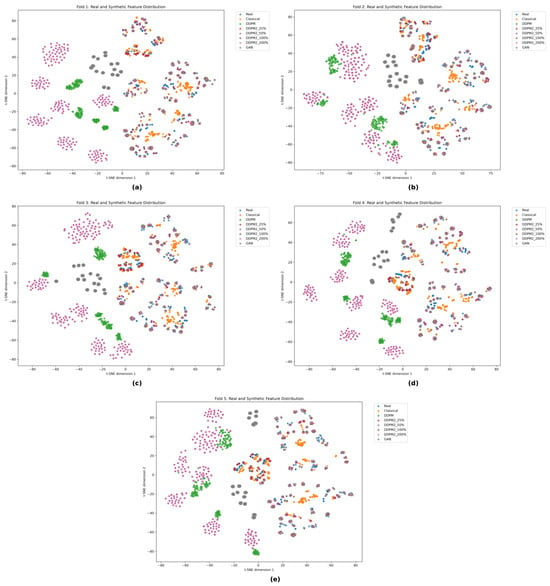
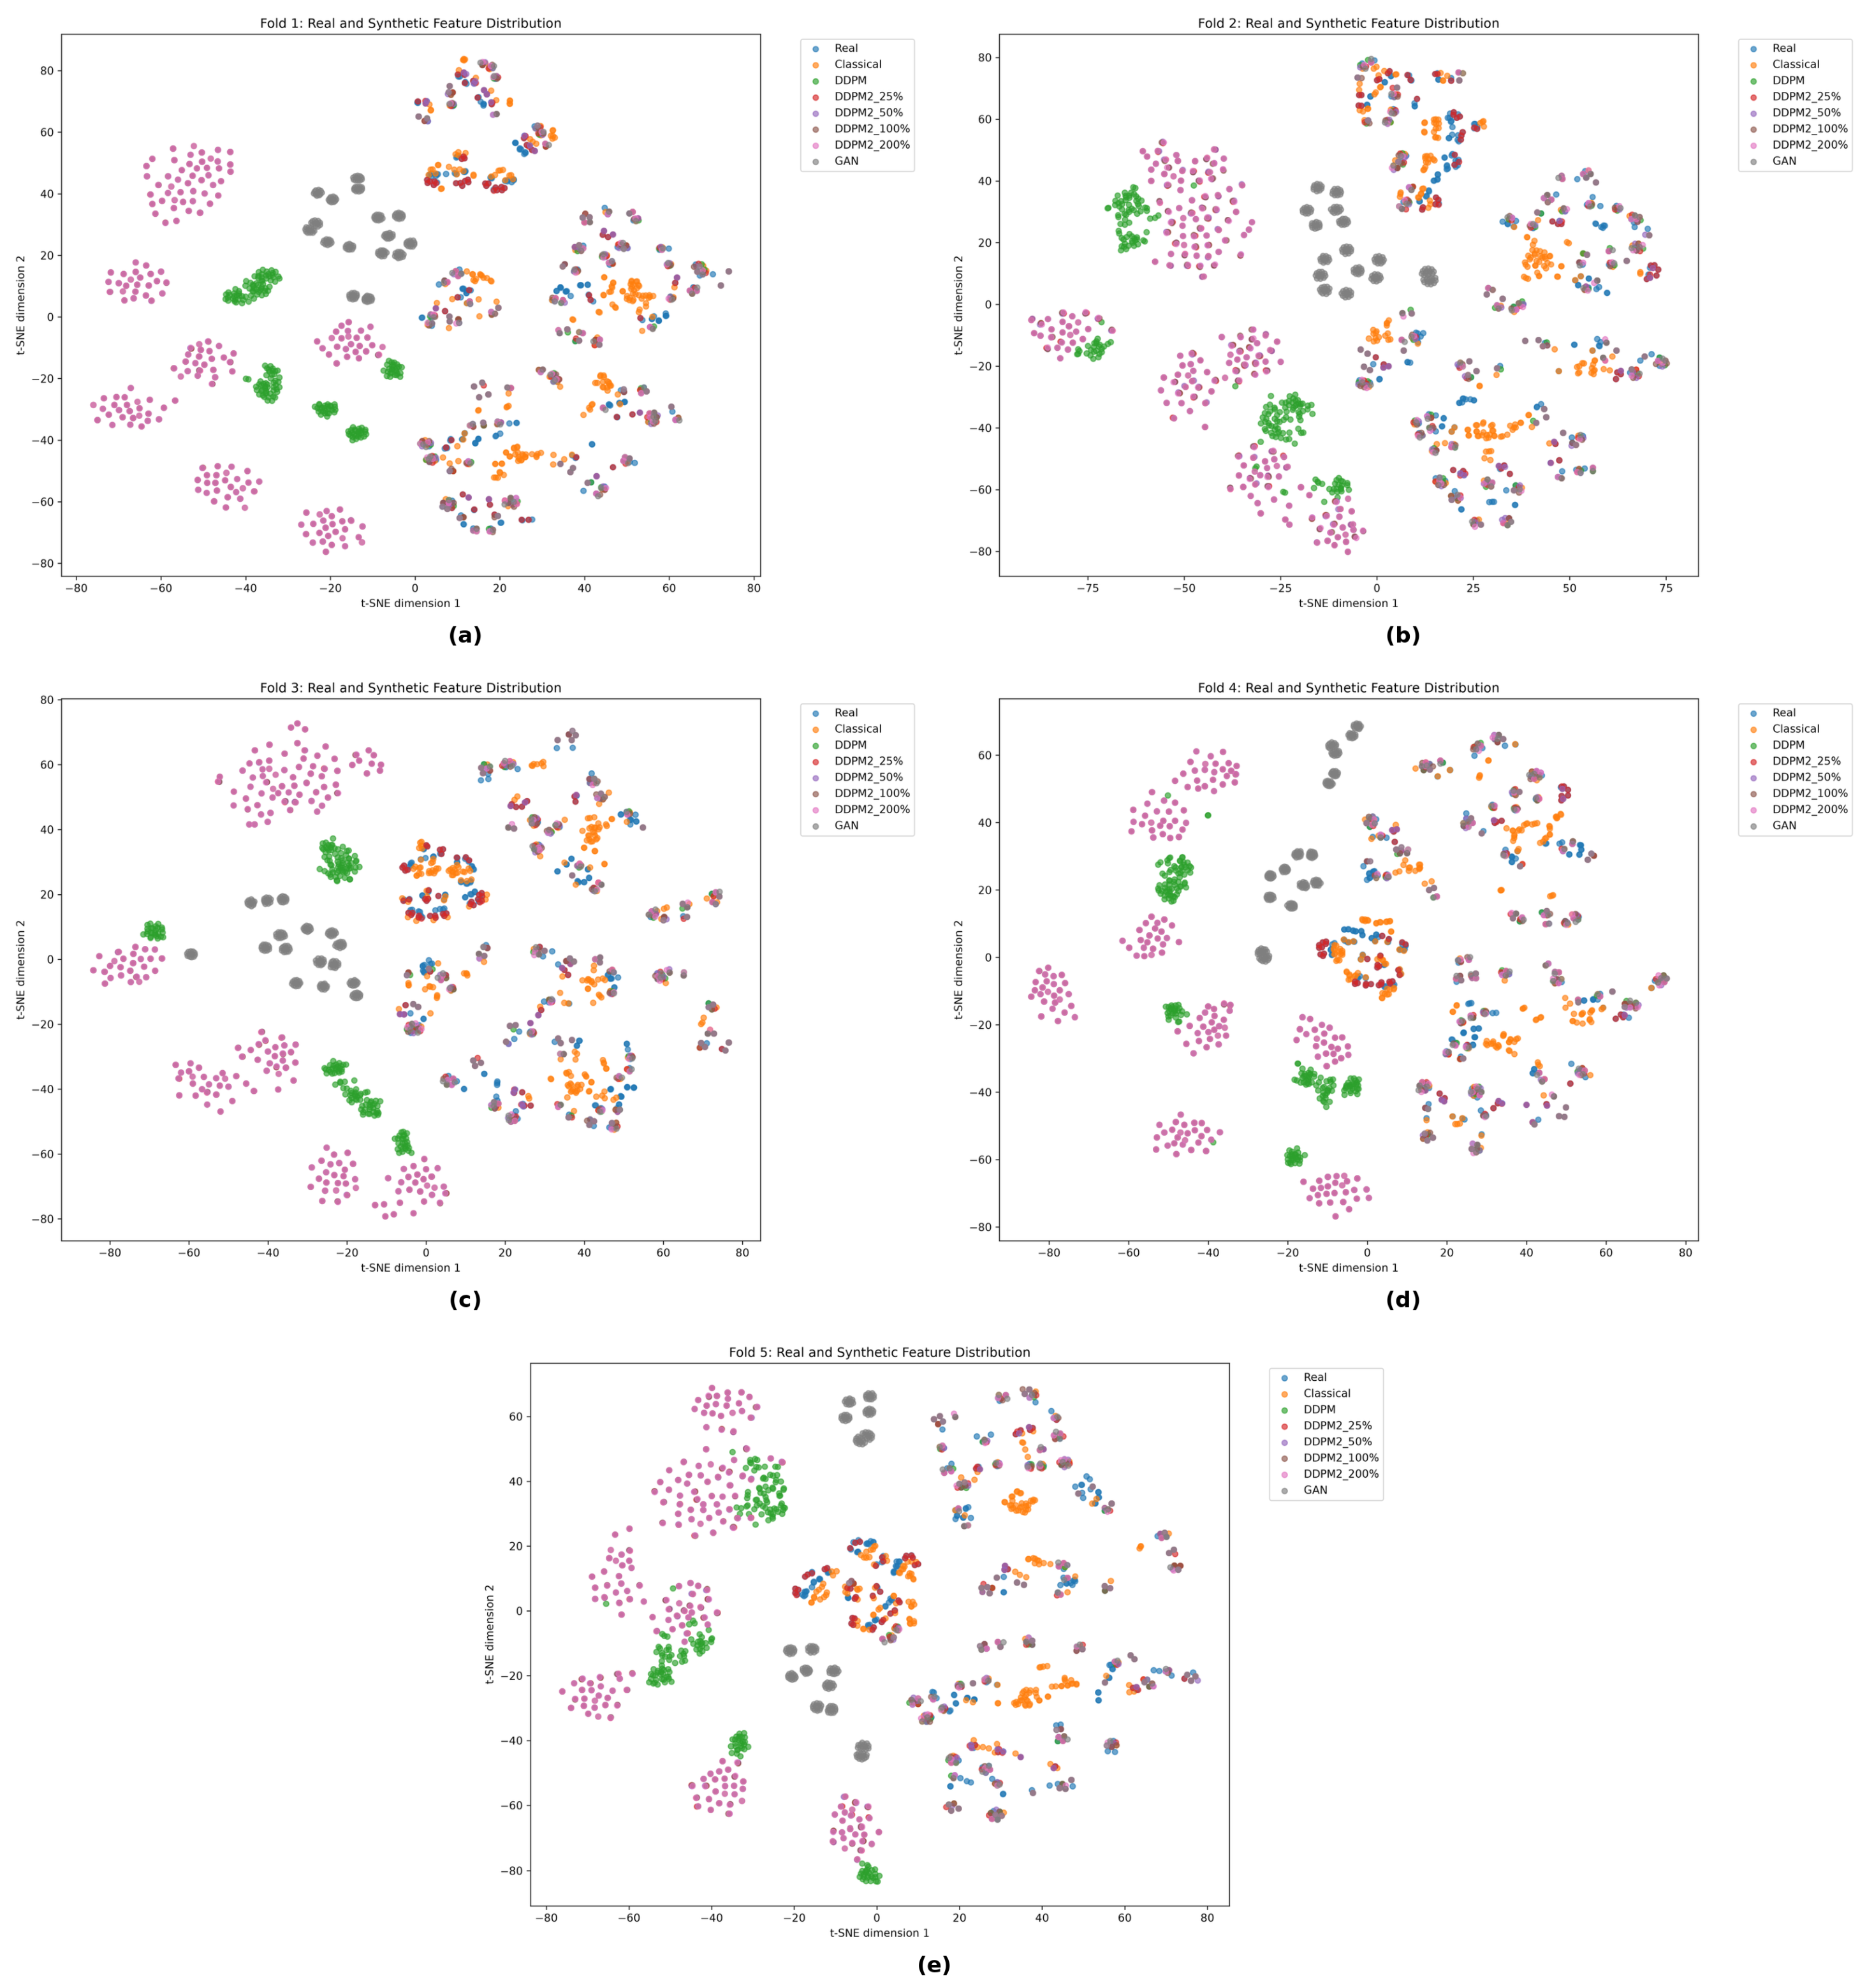
Figure 6 illustrates the relative placement of real and synthetic samples in the learned feature representation. Across all five folds, the samples produced by classical augmentation and DDPM2_25% tended to remain closer to the real-data clusters, whereas increasing the DDPM2 proportion led to progressively greater separation from those regions.
Figure 6.
t-SNE feature distributions of real and synthetic samples across the five cross-validation folds: (a) Fold 1, (b) Fold 2, (c) Fold 3, (d) Fold 4, and (e) Fold 5.
DDPM225% has shown a diverse ratio of 1.231 even with string structural similarity and fidelity as shown in Figure 7. While DDPM2_200% shown a diversity ratio with 1.280, with weaker fidelity calculated. The results shown a tradeoff in diversity and fidelity; for a certain amount of synthetic data given as broaden training distribution, whereas excessive generation may cause the synthetic samples to diverge increasingly from the properties of the real data.
Figure 7.
Synthetic data quality comparison across augmentation strategies: (a) SSIM, (b) LPIPS, (c) Fréchet feature distance, (d) mean nearest real feature distance, and (e) Brix class fidelity accuracy.
3.3. Impact of Synthetic Data Augmentation
Using the apple-level five-fold protocol, EfficientNet-B0 delivered almost ceiling-level results for nearly all augmentation conditions, as reported in Table 8. Classical augmentation, DDPM, and each of the DDPM2 settings obtained mean accuracy, balanced accuracy, and Macro-F1 scores of 1.000 when evaluated on the unchanged real test samples. GAN produced a slight decline in performance, yielding a mean accuracy of , a balanced accuracy of , and a Macro-F1 score of . Because the same EfficientNet-B0 model and identical real test partitions were used throughout all experiments, any remaining performance differences were linked to the augmentation approach applied during training. The findings should nevertheless be interpreted carefully, as the study involved only 18 independent apples, with several processed observations originating from repeated measurements of those same fruits.
Table 8.
EfficientNet-B0 performance across augmentation strategies.
Amongst all types of augmentations, having varied results as in training which was required for evaluation. In case of classical augmentation, the lowest result came at 23 epochs, after DDPM and DDPM2 which were later on at 25–32 epochs. It is seen that many Diffusion based models as per the above configurations, namely, DDPM2_100%, have achieved a lowest value of training loss. Further, the improvement in loss values was not reflected in any test results due to maximum metrics scores of the held out data.
As larger DDPM2 percentages have been exhibited through the synthetic samples based on the quality of measurement from different real data distributions, yet no substantial impact has been made to the performance of classification. Regarding the issue of ceiling effect: regarding EfficientNet-B0 to get large separation in terms of three sweetness categories, After adding more synthetic data based on distribution change in training as well as pattern convergence to get better performance on held-out samples.
4. Conclusions
The main aim of this study was to examine how different deep learning models perform on the original imbalanced dataset and how their performance changes after synthetic data augmentation. Five deep learning architectures were first evaluated for multispectral apple sweetness classification. Among the models tested on the original real dataset, EfficientNet-B0 showed the most consistent overall performance. It also maintained strong class-wise recall, while MobileNetV3-Small achieved comparable performance across the three sweetness classes.
To reduce the effect of class imbalance, several augmentation approaches were then investigated, including classical augmentation, GAN, DDPM, and DDPM2-based synthetic generation. All augmentation experiments were evaluated using the same held-out real test partitions. Under the five-fold evaluation, EfficientNet-B0 produced very similar classification results across most augmentation settings. However, the quality assessment of the generated samples showed that increasing the amount of synthetic data did not always improve similarity to the real data. In the DDPM2 experiments, higher synthetic proportions gradually moved the generated samples further from the real-data distribution, whereas the 25% setting maintained closer agreement while still providing useful variation to the training set. These findings indicate that the quantity of synthetic data should not be considered alone when selecting an augmentation strategy. Sample quality, class consistency, and similarity to the real-data distribution are also important factors.
Future studies should evaluate the proposed approach using larger numbers of independent physical apples, additional cultivars and growing seasons, and external datasets. The framework can also be extended to other internal quality attributes of apples to assess its generalizability beyond sweetness classification.
Author Contributions
K.K. and S.S.; methodology, K.K.; software and data set analysis, K.K.; analysis and visualization, K.K. and R.S.; writing—original draft, K.K.; writing—review and editing, K.K., S.S. and R.S. All authors have read and agreed to the published version of the manuscript.
Funding
This research received no external funding.
Institutional Review Board Statement
Not applicable.
Informed Consent Statement
Not applicable.
Data Availability Statement
The original dataset used in this study is publicly available at Mendeley Data: https://data.mendeley.com/datasets/y5h6v8w6ms/2 (accessed on 22 September 2026). The augmented and synthetically generated dataset derived from the original dataset to address class imbalance and support the experiments will be made available by the corresponding author on request.
Conflicts of Interest
The authors declare no conflicts of interest.
References
- Musacchi, S.; Serra, S. Apple fruit quality: Overview on pre-harvest factors. Sci. Hortic. 2018, 234, 409–430. [Google Scholar] [CrossRef] [Scilit]
- Gaikwad, S.; Tidke, S. Multi-Spectral Imaging for Fruits and Vegetables. Int. J. Adv. Comput. Sci. Appl. 2022, 13, 743–760. [Google Scholar] [CrossRef] [Scilit]
- Gaikwad, S.; Kothari, S. Deep learning framework for precision grading and non-invasive Apple sweetness evaluation. Int. J. Smart Sens. Intell. Syst. 2025, 18. [Google Scholar] [CrossRef] [Scilit]
- Tian, Y.; Sun, J.; Zhou, X.; Cong, S.; Dai, C.; Shi, L. Nondestructive Detection of Soluble Solids Content in Apples Based on Multi-Attention Convolutional Neural Network and Hyperspectral Imaging Technology. Foods 2025, 14, 3832. [Google Scholar] [CrossRef] [Scilit]
- Zhai, H.; Xie, P.; Xie, X.; Sha, S.S. Deep learning-enabled hyperspectral imaging for high-accuracy non-destructive quantification of nutritional components in multi-variety apples. Front. Plant Sci. 2025, 16, 1634785. [Google Scholar] [CrossRef] [Scilit]
- Yan, Z.; Li, Z.; Tang, Z.; Zhang, Z.; Li, T.; Feng, X.; Wu, J.; Xie, Q.; Li, X.; Li, X. Apple Origin Classification and Sugar Content Prediction of “Fuji” Apples Using Near-Infrared Spectroscopy and Deep Learning. Foods 2026, 15, 2227. [Google Scholar] [CrossRef] [Scilit] [PubMed]
- Gaikwad, S.; Kothari, S.; Rajathi G, I. Dataset of apples for grading by sweetness, ripeness and variety. Data Brief 2025, 61, 111865. [Google Scholar] [CrossRef] [Scilit] [PubMed]
- Yang, X.; Zhao, W.; Wang, Y.; Yan, W.Q.; Li, Y. Lightweight and efficient deep learning models for fruit detection in orchards. Sci. Rep. 2024, 14, 26086. [Google Scholar] [CrossRef] [Scilit] [PubMed]
- Zhu, X.; Dang, H.; Jin, X.; Li, X. Ju-LiteMobileAtt: A lightweight attention network for efficient jujube defect classification. PLoS ONE 2025, 20, e0337898. [Google Scholar] [CrossRef] [Scilit]
- Tonmoy, M.R.; Adnan, M.A.; Al Masud, S.M.R.; Safran, M.; Alfarhood, S.; Shin, J.; Mridha, M.F. Attention mechanism-based ultralightweight deep learning method for automated multi-fruit disease recognition system. Agron. J. 2025, 117, e70035. [Google Scholar] [CrossRef] [Scilit]
- Wang, X.; Han, J.; Liu, C.; Feng, T. Non-destructive assessment of apple internal quality using rotational hyperspectral imaging. Front. Plant Sci. 2024, 15, 1432120. [Google Scholar] [CrossRef] [Scilit] [PubMed]
- Lin, Y.; Fan, R.; Wu, Y.; Zhan, C.; Qing, R.; Li, K.; Kang, Z. Combining hyperspectral imaging technology and visible-near infrared spectroscopy with a data fusion strategy for the detection of soluble solids content in apples. J. Food Compos. Anal. 2025, 137, 106996. [Google Scholar] [CrossRef] [Scilit]
- Johnson, J.M.; Khoshgoftaar, T.M. Survey on deep learning with class imbalance. J. Big Data 2019, 6, 27. [Google Scholar] [CrossRef] [Scilit]
- Ho, J.; Jain, A.; Abbeel, P. Denoising Diffusion Probabilistic Models. Adv. Neural Inf. Process. Syst. 2020, 33, 6840–6851. [Google Scholar]
- Du, M.; Wang, F.; Wang, Y.; Li, K.; Hou, W.; Liu, L.; He, Y.; Wang, Y. Improving long-tailed pest classification using diffusion model-based data augmentation. Comput. Electron. Agric. 2025, 234, 110244. [Google Scholar] [CrossRef] [Scilit]
- Muhammad, A.; Salman, Z.; Lee, K.; Han, D. Harnessing the power of diffusion models for plant disease image augmentation. Front. Plant Sci. 2023, 14, 1280496. [Google Scholar] [CrossRef] [Scilit] [PubMed]
- Yoon, M.S.; Lee, Y. Novel augmentation techniques using diffusion models for green wall plant health classification. Comput. Biol. Med. 2025, 189, 109899. [Google Scholar] [CrossRef] [Scilit] [PubMed]
- Howard, A.; Sandler, M.; Chu, G.; Chen, L.-C.; Chen, B.; Tan, M.; Wang, W.; Zhu, Y.; Pang, R.; Vasudevan, V.; et al. Searching for MobileNetV3. In Proceedings of the IEEE/CVF International Conference on Computer Vision (ICCV), Seoul, Republic of Korea, 27 October–2 November 2019; pp. 1314–1324. [Google Scholar]
- Tan, M.; Le, Q.V. EfficientNet: Rethinking Model Scaling for Convolutional Neural Networks. In Proceedings of the 36th International Conference on Machine Learning; PMLR: Long Beach, CA, USA, 2019; Volume 97, pp. 6105–6114. [Google Scholar]
- He, K.; Zhang, X.; Ren, S.; Sun, J. Deep Residual Learning for Image Recognition. In Proceedings of the IEEE Conference on Computer Vision and Pattern Recognition (CVPR), Las Vegas, NV, USA, 27–30 June 2016; pp. 770–778. [Google Scholar] [CrossRef] [Scilit]
- Liu, Z.; Lin, Y.; Cao, Y.; Hu, H.; Wei, Y.; Zhang, Z.; Lin, S.; Guo, B. Swin Transformer: Hierarchical Vision Transformer Using Shifted Windows. In Proceedings of the IEEE/CVF International Conference on Computer Vision (ICCV), Montreal, QC, Canada, 10–17 October 2021; pp. 10012–10022. [Google Scholar] [CrossRef] [Scilit]
- Zong, H.; Tian, S.; Liu, Z.; Guo, B.; Wang, Y.; Ren, J.; Sun, Y.; Zhao, T.; Zhang, E. Dual-branch feature-enhanced neural network for apple SSC estimation from hyperspectral imaging. J. Food Compos. Anal. 2026, 149, 108700. [Google Scholar] [CrossRef] [Scilit]
- Tang, H.; Liu, Y.; Boukhennoufa, I.; Yu, W.; Xu, X.; Zhai, X. Toward accurate prediction of apple firmness and Brix across countries, seasons and cultivars with hyperspectral imaging. Discov. Food 2026, 6, 335. [Google Scholar] [CrossRef] [Scilit] [PubMed]
- Goodfellow, I.; Pouget-Abadie, J.; Mirza, M.; Xu, B.; Warde-Farley, D.; Ozair, S.; Courville, A.; Bengio, Y. Generative Adversarial Nets. Adv. Neural Inf. Process. Syst. 2014, 27, 2672–2680. [Google Scholar]
- Wang, Z.; Bovik, A.C.; Sheikh, H.R.; Simoncelli, E.P. Image quality assessment: From error visibility to structural similarity. IEEE Trans. Image Process. 2004, 13, 600–612. [Google Scholar] [CrossRef] [Scilit] [PubMed]
- Zhang, R.; Isola, P.; Efros, A.A.; Shechtman, E.; Wang, O. The Unreasonable Effectiveness of Deep Features as a Perceptual Metric. In Proceedings of the IEEE/CVF Conference on Computer Vision and Pattern Recognition, Salt Lake City, UT, USA, 18–23 June 2018; pp. 586–595. [Google Scholar] [CrossRef] [Scilit]
- Heusel, M.; Ramsauer, H.; Unterthiner, T.; Nessler, B.; Hochreiter, S. GANs Trained by a Two Time-Scale Update Rule Converge to a Local Nash Equilibrium. Adv. Neural Inf. Process. Syst. 2017, 30, 6626–6637. [Google Scholar]
- van der Maaten, L.J.P.; Hinton, G.E. Visualizing Data Using t-SNE. J. Mach. Learn. Res. 2008, 9, 2579–2605. [Google Scholar]

Disclaimer/Publisher’s Note: The statements, opinions and data contained in all publications are solely those of the individual author(s) and contributor(s) and not of MDPI and/or the editor(s). MDPI and/or the editor(s) disclaim responsibility for any injury to people or property resulting from any ideas, methods, instructions or products referred to in the content. |
© 2026 by the authors. Licensee MDPI, Basel, Switzerland. This article is an open access article distributed under the terms and conditions of the Creative Commons Attribution (CC BY) license.