


Abstract
In Bangladesh, adhering to prescribed irrigation schedules is critical for the sustainable production of potatoes, as climate variability combined with a lack of field-specific decision support ensures that water supplied to the crop is largely inefficient. This study presents a new Internet of Things (IoT)-based machine learning (ML) framework composed of irrigation demand forecasting and automatic irrigation control in potato fields from 7-day forecast data. The research had two rounds. Phase 1 involved ML models, namely Extreme Gradient Boosting (XGBoost), Random Forest (RF), and Long Short-Term Memory (LSTM), pre-trained on publicly available datasets from Kaggle, and then retrained with data obtained from peer-reviewed, trusted government sources. This dataset contains historical weather variables and soil moisture dynamics from 2015 to 2025, in addition to rainfall indicators and temporal properties. Most of the models were tested using k-fold cross-validation and were preprocessed through full-fledged preprocessing, keeping focus on hyperparameter choice. We performed comprehensive feature engineering to account for meteorological, hydrological, and calendar effects on short-horizon irrigation demand regression. XGBoost demonstrated its superiority over other algorithms, achieving the highest predictive accuracy (R2 = 0.9991), MAPE (6.71%) and MSE (93.69). In the second phase, a validated XGBoost model that integrates an IoT-based smart irrigation system was developed. It comprises a sensing and actuation layer (ESP32-based), which consists of DHT22 air temperature and relative humidity sensors, capacitive soil moisture sensing, and relay-activated pump operation. Field data are transmitted via Wi-Fi to a Node.js and Express backend for validation and storage in MongoDB, while a React and Next.js dashboard enables real-time monitoring and manual override. The system samples field data every 30 s, generates daily seven-day forecasts, and executes irrigation commands with a five-minute safety timeout. The proposed framework demonstrates the feasibility of integrating forecast-aware machine learning and IoT-based automation for more efficient irrigation management and provides a validated prototype for future field-scale evaluation in potato cultivation.
1. Introduction
There has been a recent move towards data-driven agricultural water management, integrating temporal and spatial variability in crop water demand as opposed to fixed irrigation schedules. This evolution is especially difficult in areas where agricultural production relies heavily on irrigation and where water, energy, and farm-management resources are scarce [1,2]. Potato is a significant food security and cash crop relied upon in Bangladesh and is primarily grown during the relatively cool, dry Rabi season of the country [3]. As a result, the amount and timing of irrigation can have a significant effect on production efficiency and proper utilization of water resources.
Potato is a water-sensitive crop, especially during tuber initiation and bulking stages. Both are substandard or excess irrigation, subsequently affecting production effectivity. On the one hand, water deficits can limit plant development and tuber quality, whereas on the other, excessive irrigation increases the demand for water and energy, leading to nutrient leaching and unfavorable root-zone conditions [4,5,6,7]. Such challenges underscore the necessity for irrigation decisions to be made based on dynamic conditions in relation to soil, crop, and meteorological data, instead of on a static set schedule.
Fixed calendars, farmer experience, or visual inspection often guide irrigation management in many smallholder settings, and even simple sensor thresholds can cause inappropriate control actions. These approaches are appealing because they are easy to put in place; however, this remains mostly reactive. They react to the field status at a moment in time and typically do not predict future rain or atmospheric demand. While IoT-based systems achieve a good level of situational awareness by continuously sensing environmental observations, without the appropriate decision-making and prediction capabilities, information alone could not make irrigation predictive. In contrast, a controller that operates a pump only when soil moisture drops below an established threshold is truly reactive [8,9,10,11,12].
Machine learning offers a pathway for extending irrigation management from reactive control to predictive decision support. Supervised learning can be formulated as a regression problem when the objective is to estimate a continuous agricultural response, or as a classification problem when the objective is an irrigation ON/OFF decision. Tree-based ensemble methods such as Random Forest and gradient boosting are well suited to heterogeneous tabular agricultural data, whereas recurrent architectures such as Long Short-Term Memory (LSTM) can represent temporal dependencies [13,14,15]. The appropriate model, however, depends on the characteristics, size, and temporal granularity of the available dataset.
IoT and ML consequently provide complementary capabilities. IoT supplies continuous observations of field conditions, while ML can learn nonlinear relationships among soil moisture, meteorological variables, rainfall, temporal characteristics, and agricultural outcomes. The framework developed in this study further incorporates forecast information into the operational decision process. In principle, this allows irrigation to be initiated when water deficit is anticipated and postponed when rainfall is expected, thereby extending decision support beyond the current soil-moisture state [16,17,18].
Despite these developments, practical smart-irrigation systems still face several interconnected challenges. The literature considered in this study highlights fragmented integration of sensor, historical weather, and forecast information; limited comparative evaluation of different ML paradigms; insufficient reporting of operational characteristics such as latency and reliability; and a shortage of application-specific systems for Bangladeshi potato cultivation [19,20]. In addition, agricultural datasets may be limited in length or granularity, while sensor placement and calibration can affect the reliability of downstream predictions.
To address these challenges, this study develops an integrated IoT–ML framework for predictive irrigation management in potato cultivation under Bangladeshi agricultural conditions. The framework combines multi-source agricultural data, comparative ML modeling, field sensing, automated pump control, data persistence, dashboard-based monitoring, and fault-safety mechanisms within a single architecture.
The principal contributions are fourfold. First, the study develops a multi-source predictive framework that combines agro-meteorological information with field observations and forecast-aware decision support. Second, it provides a comparative evaluation of XGBoost, Random Forest, and LSTM and identifies XGBoost as the strongest-performing model for the investigated dataset. Third, it integrates the selected model with an ESP32-based sensing and actuation platform and a full-stack software architecture. Finally, it evaluates the prototype at both the predictive and system levels, including latency, reliability, fault recovery, safety, dashboard performance, and resource-use outcomes.
2. Materials and Methods
2.1. Research Framework
The entire proposed framework is divided into two interconnected experimental phases, which are shown in Figure 1.
Figure 1.
Workflow of the proposed smart irrigation demand forecasting framework.
Phase 1 creates the predictive modeling aspect. It covers data collection and ETL, preprocessing, data augmentation, feature engineering, candidate-model training, validation against the test set, and comparative evaluation of XGBoost, RF, and LSTM. The combined source data contain agricultural and weather-related variables, soil moisture measurements, rainfall indices, as well as time series properties, apart from the background linking potato production over a dataset for agricultural years 2014/15–2024/25. This will produce a workflow to choose the trade-off between prediction accuracy and computational efficiency in the integration of models down the line.
Phase 2 turns the selected model into an acceptable operational IoT platform. An ESP32 field node connected to the validated XGBoost model. The architecture decouples the sensing/actuation logic from any backend processing and ML inference while also providing end-to-end traceability through structured logs and request identifiers.
Sensing from the field → transmit data → validate and enrich features → ML prediction → safety decision logic → pump command → record in database → display on dashboard.
2.2. Phase One: ML Model Selection
2.2.1. Data Collection and ETL Process
The study integrates two temporally aligned data streams covering the agricultural years 2014/15–2024/25. The first consists of agro-meteorological observations obtained from the Bangladesh Meteorological Department (BMD) and Bangladesh Climate Information Management System (CIMS). The selected variables are monthly total rainfall Rm (mm), monthly mean air temperature, Tm (°C), humidity, and soil moisture for the four potato-growing months: m ∈ {1,2,3,4}≡{Oct, Nov, Dec, Jan}. The second data stream consists of potato-production information obtained from the Bangladesh Bureau of Statistics (BBS) and the Bangladesh Agricultural Research Institute (BARI). Potato yield was calculated as:
where P denotes total production (tons) and A denotes harvested area (ha).
The integrated dataset is represented as:
The study produced a final dataset of 1240 observations shown in Table 1. The reported potato yield of 8610.94 kg ha−1.
Table 1.
Statistical summary of the dataset.
2.2.2. Data Preprocessing
The integrated dataset was processed through a structured preprocessing pipeline of missing value handling (Equation (3)), outlier mitigation (Equation (4)), temporal and spatial alignment (Equation (5)), normalization (Equation (6)), and variance stabilization and feature screening (Equation (7)) to improve data quality, numerical stability, and learning efficiency.
In Equations (3)–(7), denotes the value of feature j for observation y; μj is the mean of feature j; Q1,j and Q3,j are its first and third quartiles, respectively; denotes the temporally aggregated value of feature j for month m; S is the number of observations included in the aggregation; is the normalized feature value; and min(xj) and max(xj) denote the minimum and maximum values of feature j. The logarithm in Equation (7) denotes the natural logarithm.
2.2.3. Data Augmentation and Feature Engineering
To enhance robustness, mitigate overfitting, and improve learning under climatic variability, the preprocessed dataset DPrep was expanded using six complementary operations such as Random Noise Injection (Equation (8)), Masking (Equation (9)), Mixup (Equations (10) and (11)), Pattern Mixing (Equation (12)), Shuffling (Equation (13)), and Feature Engineering (Equations (14)–(17)).
In Equations (8)–(17), X(i) and X(k) denote the feature vectors of observations i and k, respectively; ϵ is a Gaussian noise vector with variance σ2; I is the identity matrix; π is the masking probability; λ is the Mixup interpolation coefficient; y(i) and y(k) are the corresponding target values; M1 and M2 denote feature masks; D denotes the dataset; Rm and Tm represent monthly rainfall and temperature, respectively; Rcum is cumulative rainfall; is mean temperature; denotes temperature variance across the four months; and ∅m denotes the rainfall–temperature interaction feature for month m. These derived variables provide additional representations of nonlinear climate–yield relationships without altering the underlying agricultural information. After the sequential augmentation and feature-engineering procedures, the dataset was expanded to 5440 ML-ready records.
2.2.4. Candidate ML Model Selection
The predictive component evaluates three regression models: M = {XGBoost, LSTM, RF}. XGBoost (Equation (19)) predicts yield from observations with similar agro-meteorological characteristics. LSTM (Equations (20) and (21)) provides a kernel-based nonlinear regression approach, while RF (Equation (22)) uses an ensemble of decision trees to capture nonlinear relationships, interactions, and threshold effects.
The ML-ready dataset was divided according to the experimental design into: 70% training data; 15% validation data; and 15% testing data. For each model, hyperparameter configurations (Equation (23)) were evaluated using the validation procedure. The configuration with the lowest validation error was retained.
The optimized models were subsequently retrained using the combined training and validation data and evaluated on the test data using:
The final predictor was selected by minimizing MSE and MAPE while maximizing R2. In Equations (18)–(26), Dml represents the ML-ready dataset; In the model equations, x is the input feature vector, is the predicted target, k is the number of neighbors, w and b are model parameters, C is a regularization parameter, ξi and are slack variables, ft(x) is the output of tree t, and T is the number of trees. For hyperparameter optimization, denotes a candidate configuration, the selected configuration, K the number of validation folds, and the loss function. In the evaluation equations, N is the number of test observations, yi and are the observed and predicted values, respectively, and is the mean observed target.
2.3. Phase Two: IoT and ML-Based Smart Irrigation Demand Forecasting
2.3.1. IoT Sensing and Actuation Layer
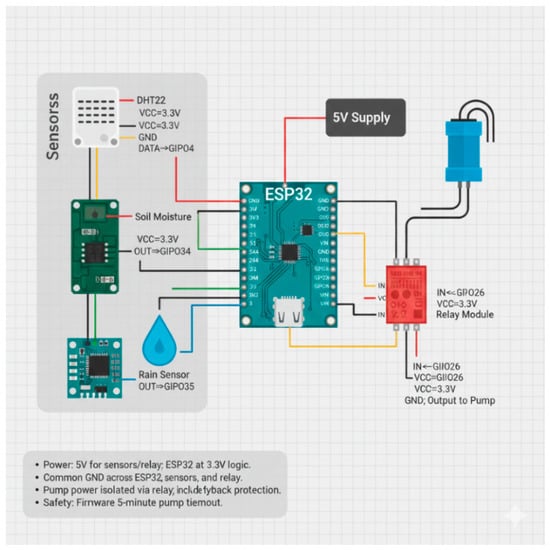
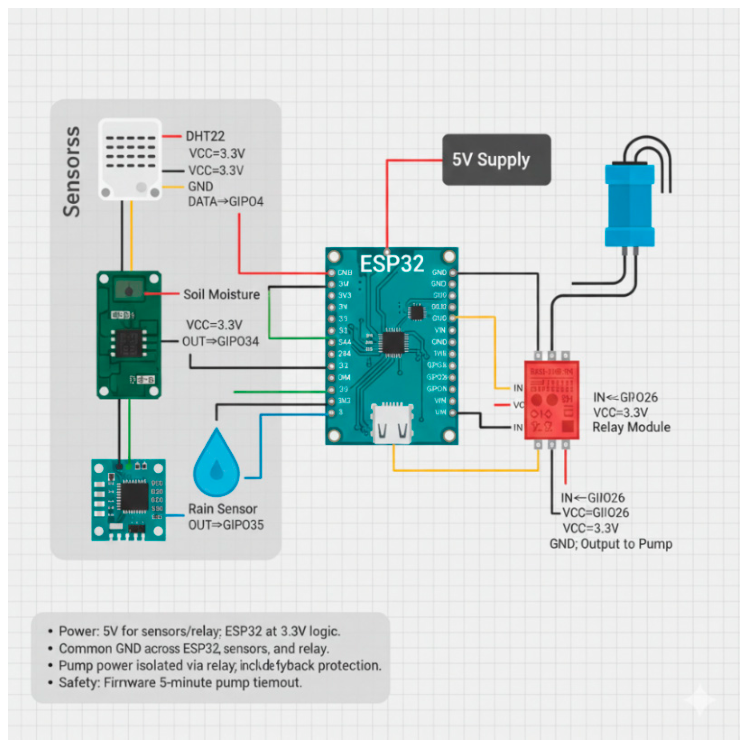
The physical sensing and actuation node was built around an ESP32-WROOM-32 microcontroller (Espressif Systems Co., Ltd., Shanghai, China). It incorporated a DHT22 temperature and relative-humidity sensor (Aosong Electronics Co., Ltd., Guangzhou, China), a capacitive soil-moisture probe (DFRobot, Shanghai, China), a relay module (Ningbo Songle Relay Co., Ltd., Ningbo, China), a water pump (RFL, Dhaka, Bangladesh), and a weather-resistant enclosure (Zhejiang Selhot Electric Co., Ltd., Wenzhou, China). The DHT22 was set up inside a ventilated radiation shield while the capacitive soil-moisture probe was placed approximately 12 cm within the potato root zone. Wi-Fi connectivity and local control logic were provided by the ESP32. As seen in Figure 2, the hardware design also included voltage-domain separation, star ground, signal filtering, and electrical isolation of pump-control circuits.
Figure 2.
Circuit diagram of the proposed system.
2.3.2. Sensor Calibration
The soil moisture sensor was calibrated at a two-point scale (dry vs. saturated soil) in situ. Calibration constants were kept to ensure traceability and allow for recalibration later on. DHT22 was also validated with a calibrated reference instrument. The validation trials reported a temperature error of 0.2 °C, humidity error of 0.8% RH, and soil moisture error of 1.5 percentage points.
2.3.3. Software and Data Architecture
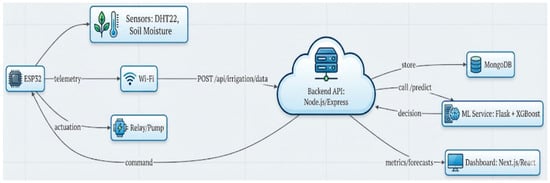
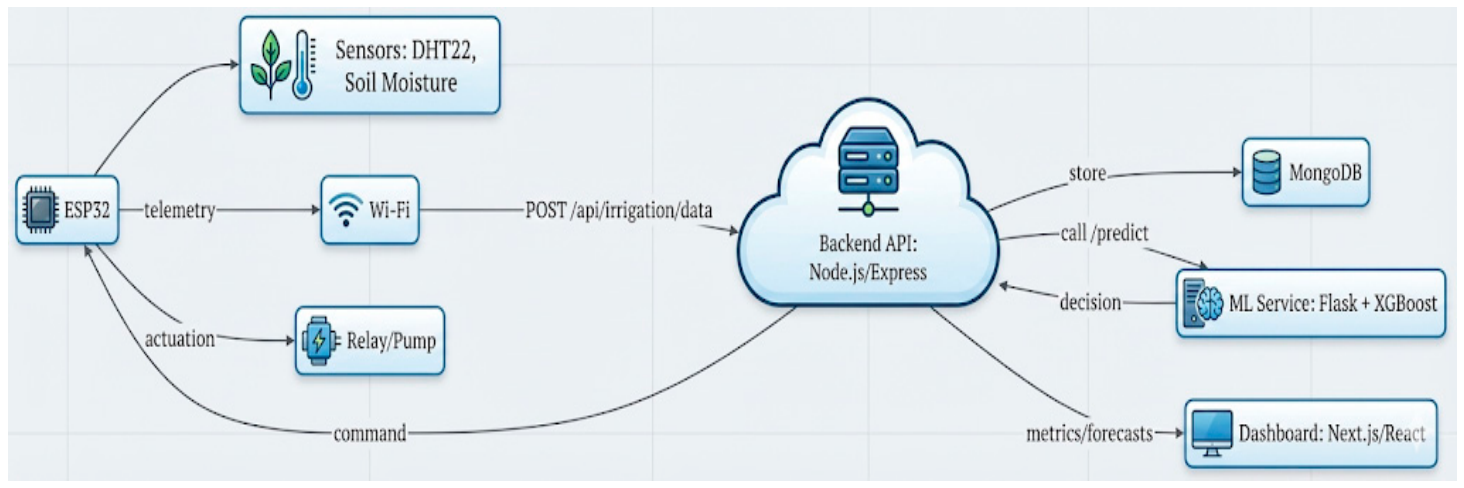
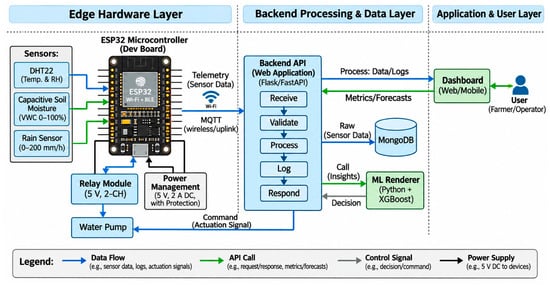
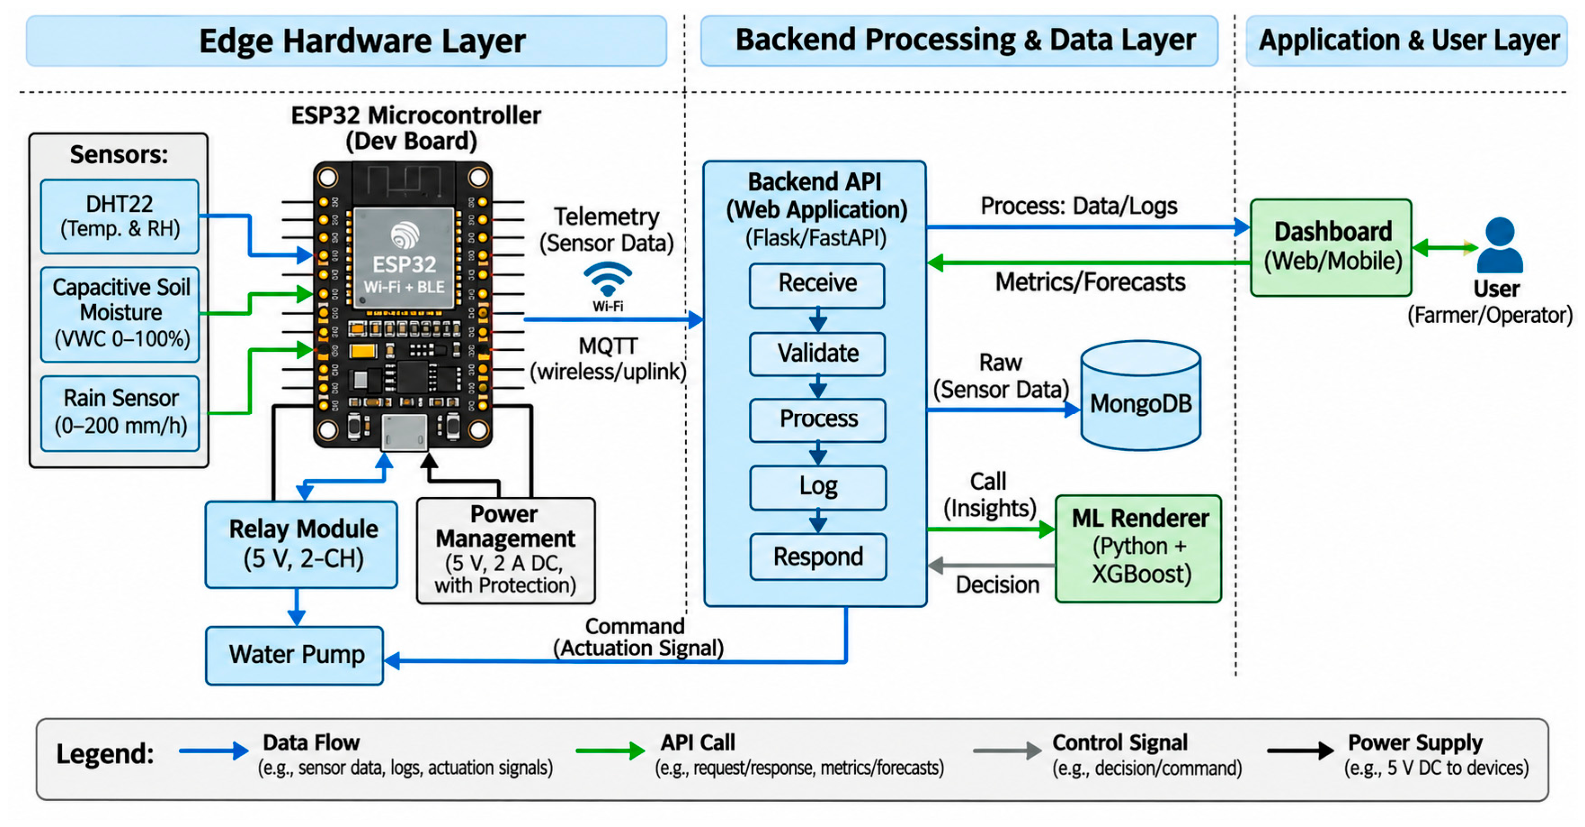
The software architecture comprised ESP32 firmware implemented in Arduino C/C++ (v3.3.11); a Node.js (v26.8.1)/Express backend (v4.22.3) with TypeScript (v6.0.3); a Python (v3.15.1) /Flask (v3.1.2) ML service; MongoDB (v9.0.2) for data persistence; and a Next.js/React dashboard with TypeScript. As illustrated in Figure 3, the backend receives sensor observations through a REST endpoint, validates them using schema-based checks, enriches them with temporal features, requests predictions from the ML service, applies safety logic, records the resulting decision, and returns the actuator command. MongoDB stores telemetry, enriched features, model identity, prediction confidence, pump status, final commands, and system status, thereby providing an auditable record of the decision process.
Figure 3.
Data flow diagram of the proposed system.
2.3.4. Control and Safety Mechanisms
The system was deliberately designed to fail safely. The ESP32 enforced a maximum pump runtime of five minutes independently of backend commands. If the actuator had a communication loss, the default state was OFF. On the backend side, we implemented a circuit breaker so that if the ML service was unavailable, repeated failed calls to it would return a safe OFF command. These multiply redundant safeguards significantly decreased the probability that uncontrolled pump operation would be caused by a software, network, or inference failure.
2.3.5. Implementation
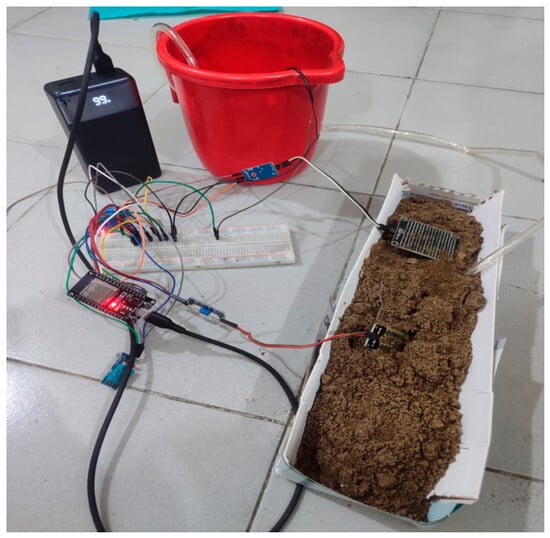
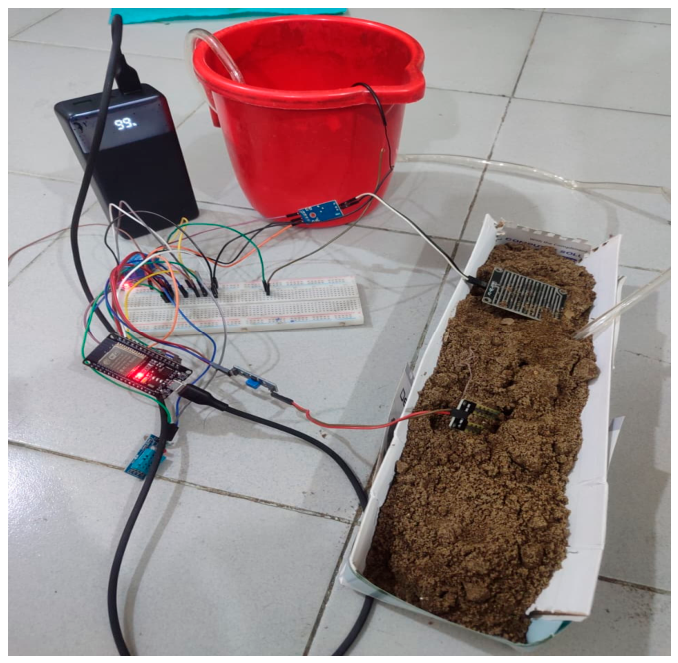
The prototype implementation is shown in Figure 4. The assembled setup demonstrates the physical arrangement of the sensing node, pump-control components, and soil container used for system testing.
Figure 4.
Implementation of the proposed framework.
2.3.6. Operational Case-Study Scenarios
Two operational scenarios were established to evaluate the decision behavior of the proposed irrigation framework under contrasting soil-moisture and weather conditions. The first scenario represented a dry-soil condition, in which the measured root-zone soil moisture was 22.4% and no rainfall was forecast. The purpose of this scenario was to evaluate whether the system would initiate irrigation under an anticipated water-deficit condition. The second scenario represented a wet-soil condition with the soil approximately at field capacity and an 85% probability of rainfall. This scenario was used to evaluate whether the forecast-aware controller would suppress unnecessary irrigation when additional rainfall was anticipated. For each scenario, the measured sensor observations were processed through the same backend validation, feature-enrichment, ML-inference, and safety-decision pipeline described in Section 2.3. These scenarios were controlled prototype evaluations and were not intended to represent statistically independent long-term field trials.
3. Results and Discussion
3.1. Machine Learning Model Performance
3.1.1. Comparative Model Evaluation
The comparative evaluation strongly favored XGBoost. As shown in Table 2, XGBoost achieved R2 = 0.9991, MAPE = 6.71%, and MSE = 93.69, substantially outperforming Random Forest and LSTM.
Table 2.
Comparative predictive performance of the evaluated ML models.
Random Forest also performed strongly, with R2 = 0.9956, MAPE of 11.26%, and MSE = 478.47, indicating that the underlying feature set contained substantial predictive information independent of the specific ensemble implementation. The relatively small difference in R2 between XGBoost and Random Forest, however, was accompanied by a considerably lower MSE for XGBoost.
LSTM produced substantially lower performance, with R2 = 0.6133, MAPE = 23.53%, and MSE = 983.57. A plausible explanation, consistent with the study design, is that the available sequential data were limited in length and temporal granularity for learning complex recurrent dependencies. The result also demonstrates that greater model complexity does not necessarily produce better predictive performance when the data representation is more naturally suited to tabular learning.
3.1.2. Prediction Performance Across Forecast Horizons
Table 3 presents the reported R2 values across the evaluated forecast horizons. XGBoost retained the highest performance at each horizon, with R2 decreasing from 0.9992 for one-day-ahead prediction to 0.9840 for seven-day-ahead prediction. This corresponds to an absolute reduction of only 0.0152 across the reported range.
Table 3.
R2 values of XGBoost, Random Forest, and LSTM for one-, three-, and seven-day-ahead yield prediction.
The gradual decline in predictive performance with increasing horizon is consistent with the greater uncertainty associated with longer-range forecasts. Nevertheless, the seven-day result remained strong, indicating that forecast variables and temporal features can provide useful forward-looking information beyond a purely reactive soil-moisture threshold strategy.
Operationally, the model output should therefore be interpreted with horizon-dependent confidence. The study places greater confidence in shorter-horizon predictions, particularly Days 1–3, while recognizing that uncertainty increases for longer horizons.
3.2. Hardware and System Reliability
3.2.1. Sensor and Hardware Validation
Table 4 summarizes the sensor validation results and the deviations observed against the reference measurements.
Table 4.
Sensor validation results.
The DHT22 measurements showed relatively small deviations, whereas the soil-moisture probe exhibited greater sensitivity to field conditions and probe placement. This observation reinforces the importance of consistent installation depth, calibration, and periodic recalibration. Because soil moisture is a key input to the predictive pipeline, systematic sensing error could propagate into subsequent decisions.
Accordingly, calibration, filtering, and validation before ML inference form an important part of the overall reliability strategy. The reported validation errors were 0.2 °C for temperature, 0.8% RH for humidity, and 1.5 percentage points for soil moisture.
3.2.2. End-to-End System Latency
Table 5 presents the end-to-end latency breakdown. The median total response time was 270 ms, which was below the predefined 500 ms target. Network transport contributed the largest share of latency, whereas XGBoost inference required only a small fraction of the total cycle. The reported throughput test also indicated a sustained capacity of 240 requests per minute.
Table 5.
End-to-end latency breakdown. P50 and P95 denote the 50th and 95th percentile response times, respectively.
3.2.3. Reliability and Resilience
Table 6 summarizes the principal reliability metrics. The backend and ML service maintained approximately 99% availability, while data persistence success reached 99.95%.
Table 6.
System reliability metrics.
The fault tests further demonstrated the value of layered safety controls. As summarized in Table 7, ML-service failure activated the circuit breaker and forced a safe OFF state; network interruption caused the ESP32 to maintain OFF status while attempting reconnection; invalid payloads were rejected; and transient database failures triggered retry mechanisms. No unsafe pump actuation was reported during the tested failure scenarios.
Table 7.
Fault-recovery performance.
These results are particularly important for agricultural automation. High predictive accuracy alone is insufficient if a software or communication failure can leave a pump operating indefinitely. The five-minute hardware-level timeout and layered OFF-state defaults therefore provide an important safety contribution beyond statistical model performance.
3.2.4. Case Study: Dry-Soil Response
A dry-soil scenario was used to examine whether the system could initiate irrigation under water-deficit conditions. Soil moisture was 22.4%, with no rain forecast. XGBoost predicted irrigation with 87% confidence, after which the pump operated for four minutes. Soil moisture subsequently increased to 28.6%, with approximately 420 L of water applied and no reported overshoot.
This scenario illustrates the value of combining current root-zone measurements with forecast information. Rather than relying solely on a fixed irrigation time, the system responded to the measured soil condition while incorporating anticipated weather information into the decision process.
3.2.5. Case Study: Wet Soil and Forecast Rainfall
The second case considered soil at approximately field capacity with an 85% probability of rainfall. All evaluated models recommended an OFF state, preventing unnecessary irrigation. The reported scenario avoided four irrigation events, saving approximately 1240 L of water and 2.1 kWh of energy.
This case demonstrates a key distinction between forecast-aware and purely reactive irrigation. A soil-moisture-only controller may trigger irrigation after a threshold is crossed, whereas the proposed framework can account for anticipated rainfall and deliberately postpone irrigation. Thus, the value of forecasting lies not only in identifying when irrigation should occur but also in identifying when it should be withheld.
3.2.6. Comparison with Conventional Irrigation
Table 8 compares the predictive system with timer-based irrigation. Daily water use decreased from 1620 L/day to 1180 L/day, corresponding to a reported 27.2% reduction. Overwatering events decreased from eight to one, soil-moisture variance decreased from 6.0% to 3.2%, and pump runtime decreased from 72 to 46 min. These results support the study’s central premise that forecast-aware predictive control can improve irrigation efficiency relative to reactive or schedule-driven operation. The results should nevertheless be interpreted as prototype-level evidence because the reported comparison is based on the experimental conditions described in the study rather than a long-term multi-location field trial.
Table 8.
Predictive system versus timer-based irrigation.
3.2.7. Dashboard Usability
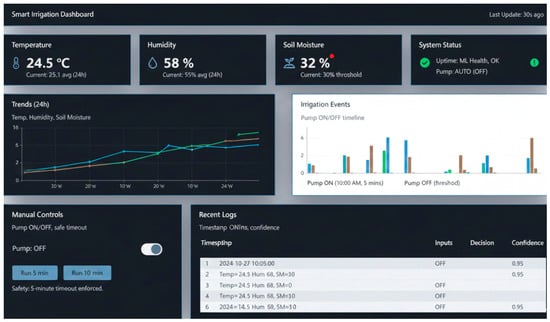
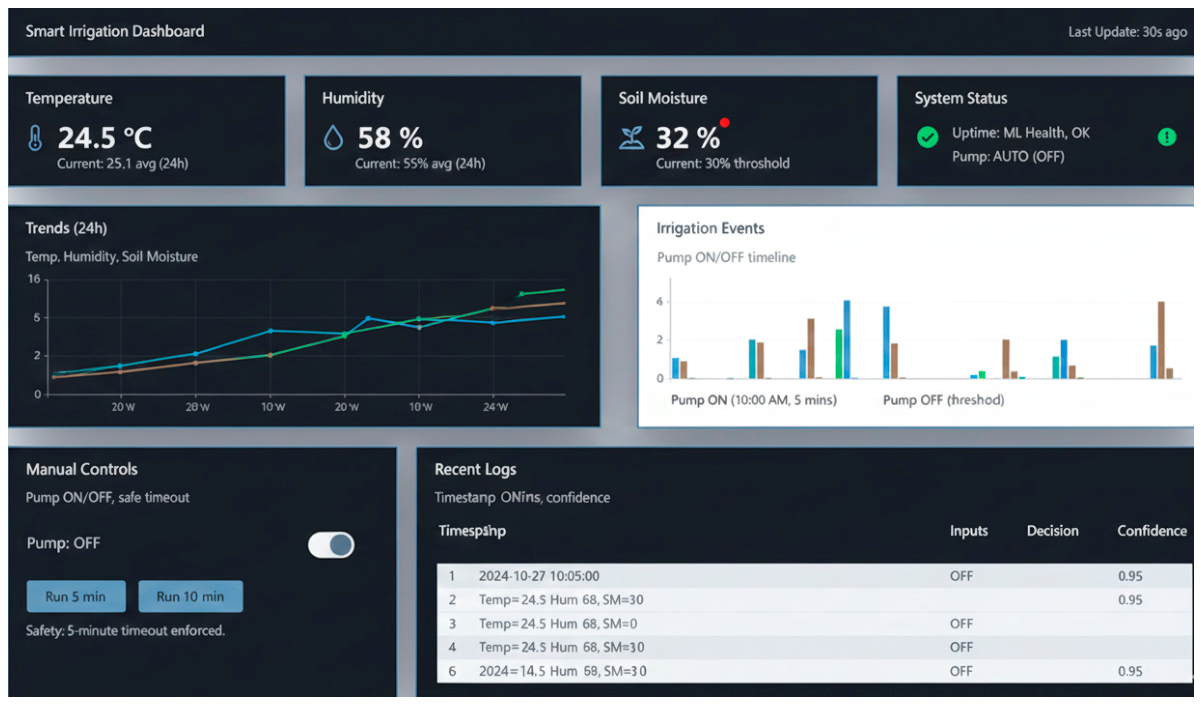
Figure 5 shows the smart-irrigation dashboard used for operational monitoring. The interface provided real-time sensor monitoring, historical decision logs, trend visualization, manual pump control, and system-health information. It was developed using Next.js, React, and TypeScript. The reported interface metrics were an average data-fetch time of 180 ms, a median data-fetch time of 150 ms, an average chart-rendering time of 85 ms, and a median total UI-update time of 220 ms.
Figure 5.
Smart irrigation demand forecasting dashboard.
The dashboard also passed the reported checks for WCAG 2.1 AA color contrast, keyboard navigation, ARIA labels and landmarks, tooltip precision, and decision-rationale visibility. These features position the dashboard as an operational decision-support layer rather than a visualization-only interface.
4. Conclusions
This study developed an IoT and ML framework for predictive irrigation management in potato cultivation. Among the evaluated models, XGBoost achieved the best predictive performance, with an R2 of 0.9991, an MSE of 93.69, and an MAPE of 6.71%, outperforming RF and LSTM on the reported evaluation metrics. The IoT prototype demonstrated the feasibility of integrating ML-based forecasting with automated irrigation control. System evaluation reported a median decision latency of 270 ms, backend uptime of 99.1%, and data persistence success of 99.95%. Compared with timer-based irrigation, the prototype demonstrated a 27.2% reduction in daily water consumption, alongside fewer overwatering events and reduced pump runtime.
Despite these promising results, the framework remains a validated prototype, and its long-term effectiveness under actual potato-growing field conditions has not yet been established. Future work will prioritize extended field trials, improved hardware protection under diverse environmental conditions, and evaluation across different agricultural settings. Overall, the findings indicate that combining forecast-aware ML with IoT-based automation offers potential for more efficient irrigation management.
Author Contributions
Conceptualization, M.J.H. and F.I.F.; methodology, M.J.H., F.I.F. and A.B.S.; software, M.J.H., F.I.F. and A.B.S.; validation, M.J.H. and F.I.F.; formal analysis, M.J.H., F.I.F. and A.B.S.; investigation, M.J.H. and F.I.F.; resources, M.J.H.; data curation, M.J.H., F.I.F. and A.B.S.; writing—original draft preparation, M.J.H., F.I.F. and A.B.S.; writing—review and editing, M.J.H.; visualization, M.J.H., F.I.F. and A.B.S.; supervision, M.J.H. All authors have read and agreed to the published version of the manuscript.
Funding
This research received no external funding.
Institutional Review Board Statement
Not applicable.
Informed Consent Statement
Not applicable.
Data Availability Statement
Data will be available on request.
Conflicts of Interest
The authors declare no conflicts of interest.
References
- Sanyaolu, M.; Sadowski, A. The role of precision agriculture technologies in enhancing sustainable agriculture. Sustainability 2024, 16, 6668. [Google Scholar] [CrossRef] [Scilit]
- Hernández-Ochoa, I.M.; Gaiser, T.; Grahmann, K.; Engels, A.M.; Ewert, F. Within-field temporal and spatial variability in crop productivity for diverse crops—A 30-year model-based assessment. Agronomy 2025, 15, 661. [Google Scholar] [CrossRef] [Scilit]
- Abbas, F.; Afzaal, H.; Farooque, A.A.; Tang, S. Crop yield prediction through proximal sensing and machine learning algorithms. Agronomy 2020, 10, 1046. [Google Scholar] [CrossRef] [Scilit]
- Jannat, A.; Ishikawa-Ishiwata, Y.; Furuya, J. Assessing the impacts of climate variations on the potato production in Bangladesh: A supply and demand model approach. Sustainability 2021, 13, 5011. [Google Scholar] [CrossRef] [Scilit]
- Salan, M.S.A.; Hossain, M.M.; Sumon, I.H.; Rahman, M.M.; Kabir, M.A.; Majumder, A.K. Measuring the impact of climate change on potato production in Bangladesh using Bayesian hierarchical spatial-temporal modeling. PLoS ONE 2022, 17, e0277933. [Google Scholar] [CrossRef] [Scilit] [PubMed]
- Barrile, V.; Maesano, C.; Genovese, E. Optimization of crop yield in precision agriculture using WSNs, remote sensing, and atmospheric simulation models for real-time environmental monitoring. J. Sens. Actuator Netw. 2025, 14, 14. [Google Scholar] [CrossRef] [Scilit]
- Kumar, V.; Sharma, K.V.; Kedam, N.; Patel, A.; Kate, T.R.; Rathnayake, U. A comprehensive review on smart and sustainable agriculture using IoT technologies. Smart Agric. Technol. 2024, 8, 100487. [Google Scholar] [CrossRef] [Scilit]
- Iqbal, N.; Shahzad, M.U.; Sherif, E.-S.M.; Tariq, M.U.; Rashid, J.; Le, T.-V.; Ghani, A. Analysis of wheat-yield prediction using machine learning models under climate change scenarios. Sustainability 2024, 16, 6976. [Google Scholar] [CrossRef] [Scilit]
- Zhang, P.; Lu, B.; Shang, J.; Wang, X.; Hou, Z.; Jin, S.; Yang, Y.; Zang, H.; Ge, J.; Zeng, Z. Ensemble learning for oat yield prediction using multi-growth stage UAV images. Remote Sens. 2024, 16, 4575. [Google Scholar] [CrossRef] [Scilit]
- Kuradusenge, M.; Hitimana, E.; Mtonga, K. SMART-CYPS: An intelligent internet of things and machine learning powered crop yield prediction system for food security. Discov. Internet Things 2024, 4, 23. [Google Scholar] [CrossRef] [Scilit]
- Singh, G.; Sharma, S. Enhancing precision agriculture through cloud based transformative crop recommendation model. Sci. Rep. 2025, 15, 9138. [Google Scholar] [CrossRef] [Scilit] [PubMed]
- Hoque, M.J. Incorporating meteorological data and pesticide information to forecast crop yields using machine learning. IEEE Access 2024, 12, 47768–47786. [Google Scholar] [CrossRef] [Scilit]
- Piekutowska, M.; Niedbała, G. Review of methods and models for potato yield prediction. Agriculture 2025, 15, 367. [Google Scholar] [CrossRef] [Scilit]
- Wang, Y.; Zhang, Q.; Yu, F.; Zhang, N.; Zhang, X.; Li, Y.; Wang, M.; Zhang, J. Progress in research on deep learning-based crop yield prediction. Agronomy 2024, 14, 2264. [Google Scholar] [CrossRef] [Scilit]
- Bhimavarapu, U.; Battineni, G.; Chintalapudi, N. Improved optimization algorithm in LSTM to predict crop yield. Computers 2023, 12, 10. [Google Scholar] [CrossRef] [Scilit]
- Batool, D.; Shahbaz, M.; Asif, H.S.; Shaukat, K.; Alam, T.M.; Hameed, I.A.; Ramzan, Z.; Waheed, A.; Aljuaid, H.; Luo, S. A hybrid approach to tea crop yield prediction using simulation models and machine learning. Plants 2022, 11, 1925. [Google Scholar] [CrossRef] [Scilit] [PubMed]
- Alsaber, A.; Satpathi, A.; Alsabah, M.; Setiya, P. Optimizing potato yield predictions in Uttar Pradesh, India: A comparative analysis of machine learning models. Sci. Rep. 2025, 15, 12719. [Google Scholar] [CrossRef] [Scilit] [PubMed]
- Lin, Y.; Li, S.; Duan, S.; Ye, Y.; Li, B.; Li, G.; Lyv, D.; Jin, L.; Bian, C.; Liu, J. Methodological evolution of potato yield prediction: A comprehensive review. Front. Plant Sci. 2023, 14, 1214006. [Google Scholar] [CrossRef] [Scilit] [PubMed]
- Abdelmoneim, A.A.; Kimaita, H.N.; Al Kalaany, C.M.; Derardja, B.; Dragonetti, G.; Khadra, R. IoT Sensing for Advanced Irrigation Management: A Systematic Review of Trends, Challenges, and Future Prospects. Sensors 2025, 25, 2291. [Google Scholar] [CrossRef] [Scilit] [PubMed]
- Hoque, M.J.; Islam, M.S.; Khaliluzzaman, M. A Fuzzy Logic- and Internet of Things-Based Smart Irrigation System. Eng. Proc. 2023, 58, 93. [Google Scholar] [CrossRef] [Scilit]

Disclaimer/Publisher’s Note: The statements, opinions and data contained in all publications are solely those of the individual author(s) and contributor(s) and not of MDPI and/or the editor(s). MDPI and/or the editor(s) disclaim responsibility for any injury to people or property resulting from any ideas, methods, instructions or products referred to in the content. |
© 2026 by the authors. Licensee MDPI, Basel, Switzerland. This article is an open access article distributed under the terms and conditions of the Creative Commons Attribution (CC BY) license.