


Abstract
Flexible temperature sensors that are lightweight, conformational and low in power are of interest for several applications. Printed temperature sensors of the resistive type, which are made from low-cost materials and are integrated into sensing and wireless communication platforms of small size, are considered to be very promising. Here, two resistive temperature sensors were compared: a control sensor consisting of a silver-ink resistor pattern printed on polyethylene terephthalate (PET), and an identical sensor coated with conductive polyaniline (PANI) nanowires. The temperature-dependent resistances of both temperature sensors were measured under stepwise heating and cooling within the temperature range of 20 °C to 70 °C, which also comprises skin-adjacent temperatures. Both of the temperature sensors showed positive-temperature-coefficient behavior and exhibited a near-linear resistance–temperature characteristic. The integration of PANI nanowires into the printed temperature sensors of flexible nature improved the linearity of the resistance–temperature characteristic, since the coefficient of determination (R2) increased from 0.91 for the heating runs to 0.94 and from 0.90 for the cooling runs to 0.98 for the PANI-modified temperature sensor. Moreover, the hysteresis between the heating runs and the subsequent cooling runs, which was measured for the temperature sensor of the control sample, was halved for the PANI-modified temperature sensor. For the measurement of the resistance values of the temperature-sensitive structures of the flexible temperature sensors, a low-power wireless readout system was used, which consisted of an AD5933 impedance analyzer, an nRF52832 microcontroller and a Bluetooth Low Energy interface. Within the scope of the measurement, the reference resistors, whose resistance values were measured with a multimeter, were measured to within 1% by the wireless readout system at a base current draw of 6.62 mA. In a multi-criteria comparison using the Analytic Hierarchy Process (AHP), the PANI-modified printed flexible temperature sensor was ranked higher than the control sample (0.735 vs. 0.265).
1. Introduction
With the increasing demand of measuring physiological parameters as well as the environment around the wearer, flexible and wearable sensors have become very common. These sensing elements can be easily attached to the human body, and with the help of the corresponding embedded electronics, the data can be efficiently transferred and analyzed [1]. Temperature is an important measurand for these wearable platforms. The surface of the human body and the skin-adjacent environment change with respect to temperature. Thus, flexible temperature sensors, which are thin, sensitive, portable, real-time-capable, and of large area, are being developed for measurement on flexible substrates [2].
Printed resistive temperature sensors (RTS) on flexible substrates often suffer from limited response times, hysteresis, noise and lack of stability. Using conductive polymers as sensing materials for temperature detection on flexible platforms offers the potential for improved temperature sensitivity whilst allowing for large-area, thin, flexible, and even portable applications. Amongst the conductive polymers, polyaniline (PANI) has gained considerable attention. Previous work has utilized PANI nanowires as sensitive chemiresistive elements for a variety of applications including pH, glucose, and biomarker detection via both resistive and impedance measurements [3,4,5,6]. Furthermore, films of PANI, including composite films, have been utilized as elements of flexible printed temperature-sensing films [7].
Here, we present a flexible printed temperature sensor based on conductive PANI nanowires, together with a simple readout circuit. The sensor consists of silver serpentine electrodes printed on a flexible PET substrate and coated with a solution of conductive PANI nanowires. We measured the change in the electrical response of the sensor as a function of temperature under heating, cooling, and cyclic temperature programs, and we report the results for linearity, reversibility (hysteresis), and wireless compatibility using the readout circuit. The readout circuit operates at low power and can therefore be integrated with embedded wireless electronics for wearable applications.
2. Materials and Methods
2.1. Fabrication of Sensors
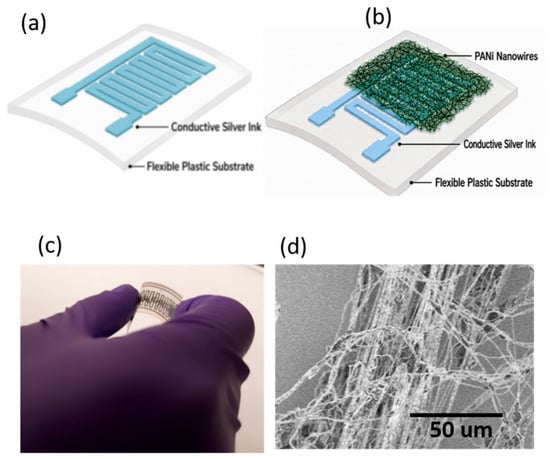
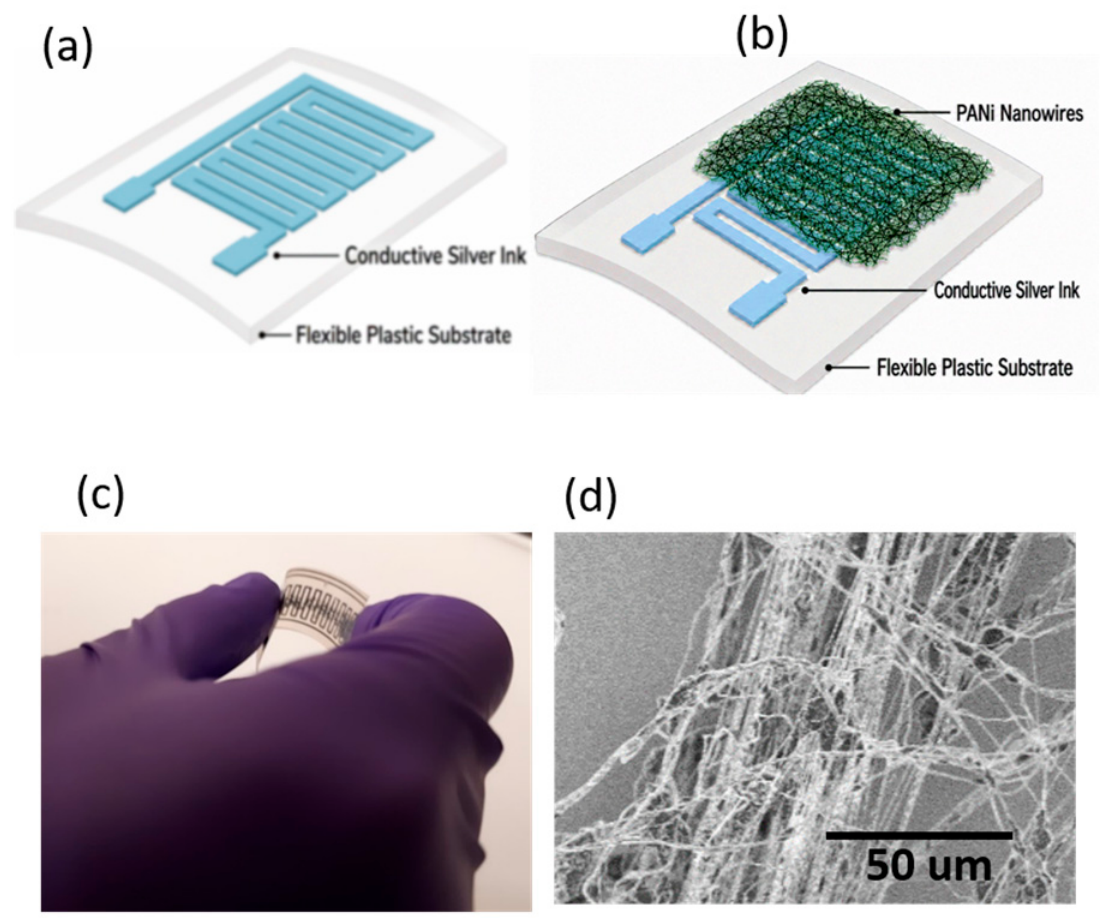
The sensors were fabricated by printing a serpentine resistor pattern with a sensing area of ~0.7 cm2, a pitch of ~750um and a line width of ~500um using conductive silver ink (AgIC, Tokyo, Japan) on flexible polyethylene terephthalate (PET) (MilliporeSigma, Oakville, ON, Canada) sheets using ink jet printing [8]. PANI nanowires were prepared using a previously described method [9] by dissolving PANI with an equimolar amount of (+)-camphor-10-sulfonic acid (HCSA) (MilliporeSigma, Oakville, ON, Canada) in a 5:1 chloroform/N,N-dimethylformamide (DMF) (MilliporeSigma, Oakville, ON, Canada) mixture to obtain 2.0 wt% doped PANI solution. Poly(ethylene oxide) (PEO) (MilliporeSigma, Oakville, ON, Canada) was then added at 2.0 wt% to form blended electrospinning solutions, and the collected PANI fibers were dispersed in DMF to facilitate drop casting. The PANI-modified sensors were produced using the same printed resistor geometry, followed by deposition of a PANI nanowire solution onto the printed sensor surface. The coated sensors were dried for 24 h and then heated to evaporate residual solvent. The same electrode geometry was used for the control and PANI-coated sensors so that changes in response could be attributed primarily to the nanowire coating rather than device geometry. Figure 1 summarizes the printed platform and PANI nanowire morphology used in this study.
Figure 1.
Printed flexible temperature sensor platform. (a) Schematic representation of the silver-ink resistor printed on a flexible PET substrate. (b) PANI nanowires coated sensor. (c) Photograph of a flexible sensor prototype. (d) SEM image of PANI nanowires used to modify the sensing surface.
2.2. Thermal Characterization
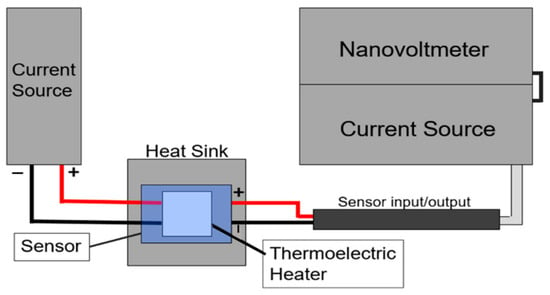
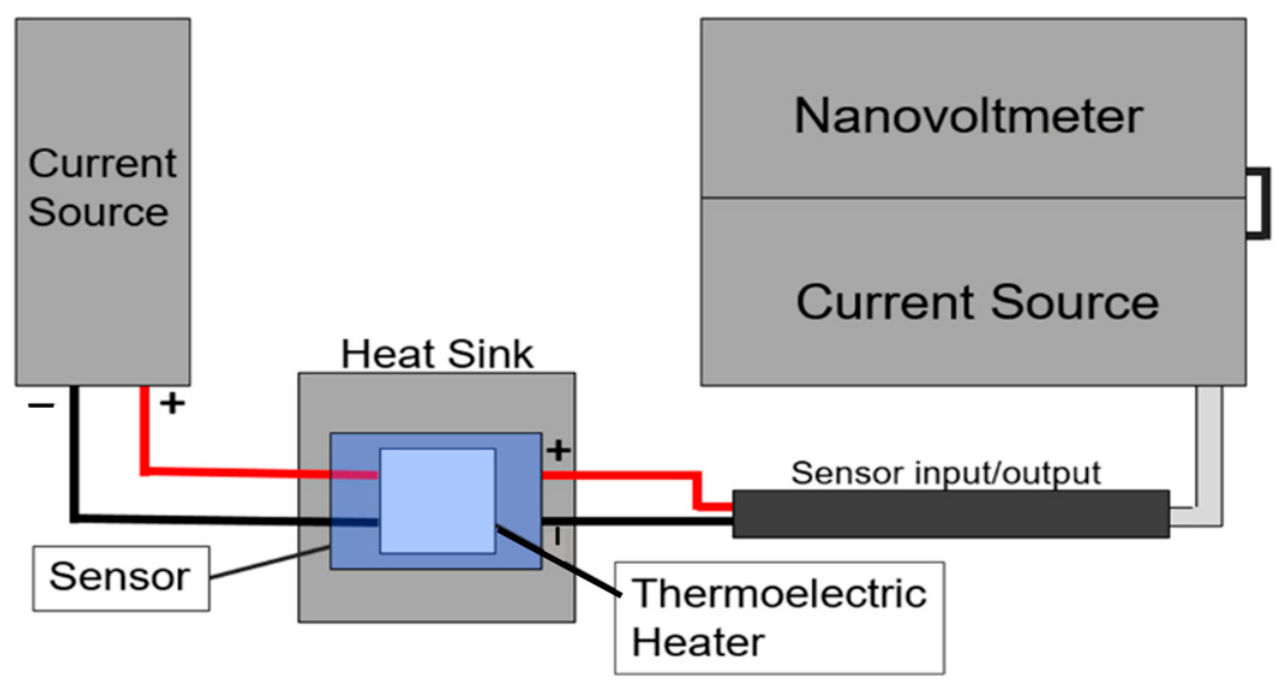
The sensors were placed on a heat sink coupled to a thermoelectric heater (DigiKey, Thief River Falls, MN, USA). A programmable current source-controlled heater current, while the sensor output was measured with a voltmeter/nanovoltmeter (Keithley Instruments, Solon, OH, USA) (Figure 2). We measured the sensors’ output over a wide temperature range of 20–70 °C by increasing the heating current from 0.60 A to 1.60 A in both real-time and stepwise programs. For the characterization of the sensors, we used the same setup for heating and cooling cycles to measure hysteresis and reversibility.
Figure 2.
Schematic of the thermal characterization setup. A thermoelectric (Peltier) heater mounted on a heat sink controls the sensor temperature, while a precision current source excites the sensor and a nanovoltmeter records the resulting voltage; a separate current source drives the heater.
2.3. Wireless Low-Power Readout
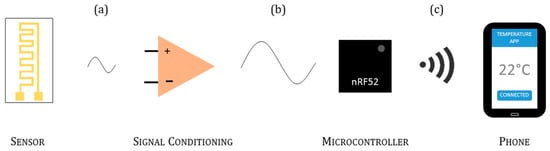
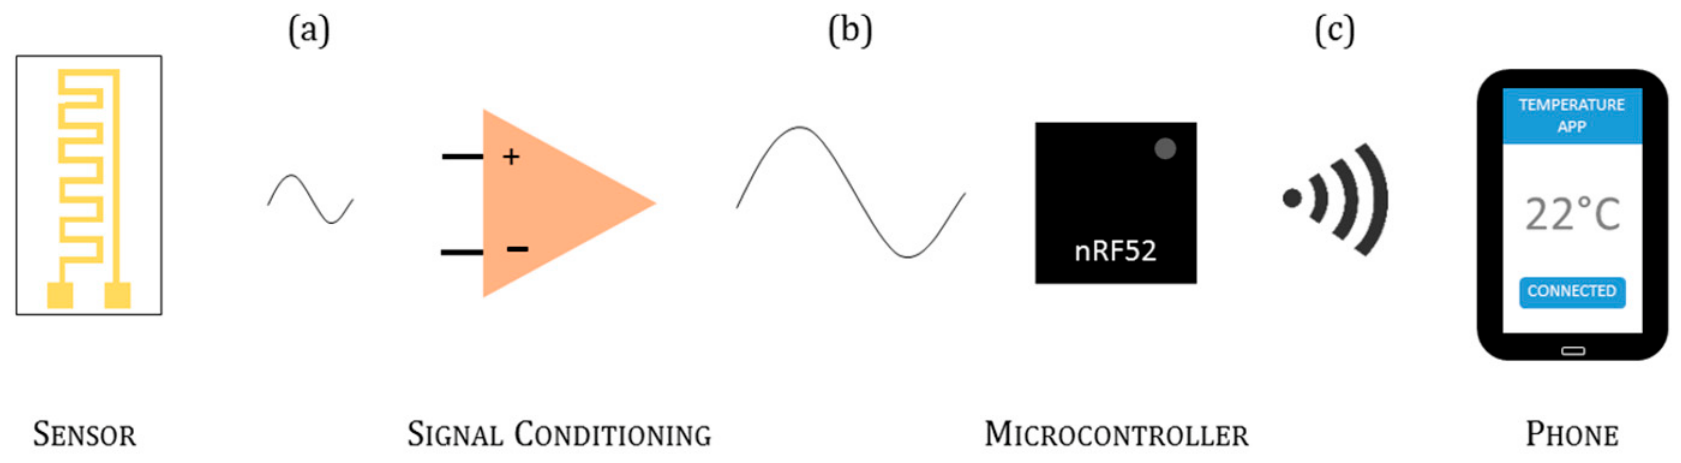
A wireless instrumentation readout for wearable deployment was developed and is illustrated in Figure 3 for temperature readout. The readout was based on signal-conditioning electronics followed by an AD5933 impedance analyzer (Analog Devices, Inc., Wilmington, MA, USA) that measured impedance and/or resistance. An nRF52832 microcontroller (Nordic Semiconductor ASA, Trondheim, Norway) from the nRF52 family was used for data processing and Bluetooth Low Energy (BLE) communication to a phone or computer where the sensor data was displayed and logged using a suitable application. Development used a development board and a Pmod IA module (Digilent, Inc., Pullman, WA, USA). The sensor readout values were sampled, processed in the microcontroller and then transmitted wirelessly.
Figure 3.
A high-level block diagram of the device’s operation. Excited sensor signals shown in (a) are fed into a signal-conditioning circuit. The circuit then outputs a signal (b) that the microcontroller can read and process onboard. Finally, the microcontroller wirelessly transmits the processed data in (c) to a phone, which is running an application.
2.4. Data Analysis
We studied hysteresis and reversibility by comparing the heating/cooling curves and studied repeatability by comparing the same number of heating/cooling cycles measured between two set-points of fixed temperatures. We defined hysteresis as the maximum absolute difference between the two curves, i.e., the heating and the cooling curves. We defined linearity as the least square fitting of each curve over the 20–70 °C range. We also considered a preliminary approach for a quantitative performance scoring by using the Analytic Hierarchy Process (AHP) [10] for ranking the following parameters: response time, linearity, hysteresis, large measuring range and wireless connectivity. We previously used such a multi-factor analysis for ranking the performance of flexible printed sensors [8].
3. Results and Discussion
3.1. Printed Sensor Response
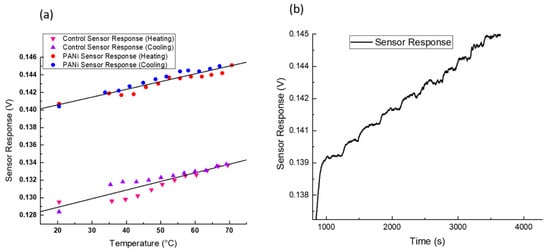
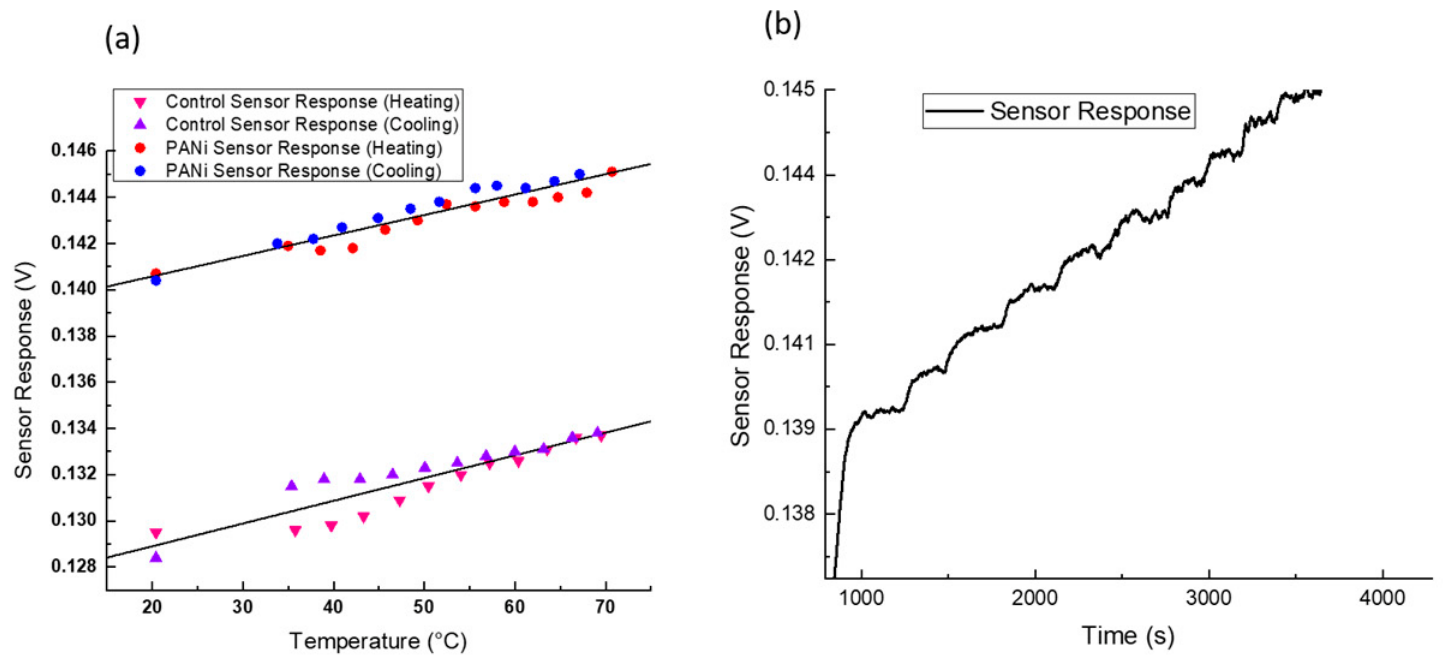
Figure 4a compares thermal response of control and modified (PANI) sensors. These sensors exhibit positive-temperature-coefficient behavior, i.e., increase in resistance with temperature. A more linear thermal response is provided by the modified (PANI) sensor (R2 = 0.944 for heating and R2 = 0.981 for cooling) as compared to that of the control sensor (R2 = 0.908 for heating and R2 = 0.899 for cooling). In addition to linearity, the modified (PANI) sensor also exhibits better reversibility. The maximum heating–cooling hysteresis, measured as a percentage of the full-scale response over 20–70 °C, decreased from 8.4% for the control sensor to 4.0% for the PANI-modified sensor. The real-time responses of the modified (PANI) sensor during the entire course of the heating cycle are depicted in Figure 4b. The signal (i.e., output voltage) increases consistently during the heating phase, i.e., from 0.1375 V to 0.1450 V. A fine step like structure is superimposed on the steadily increasing signal. The step size corresponds to temperature steps, i.e., 10 °C each.
Figure 4.
Temperature response of sensors. (a) Sensor response as a function of temperature for control and PANI-modified sensors during heating and cooling. (b) Real-time response of the sensor throughout the heating cycle.
3.2. Wireless Readout
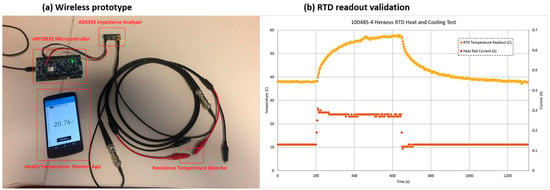
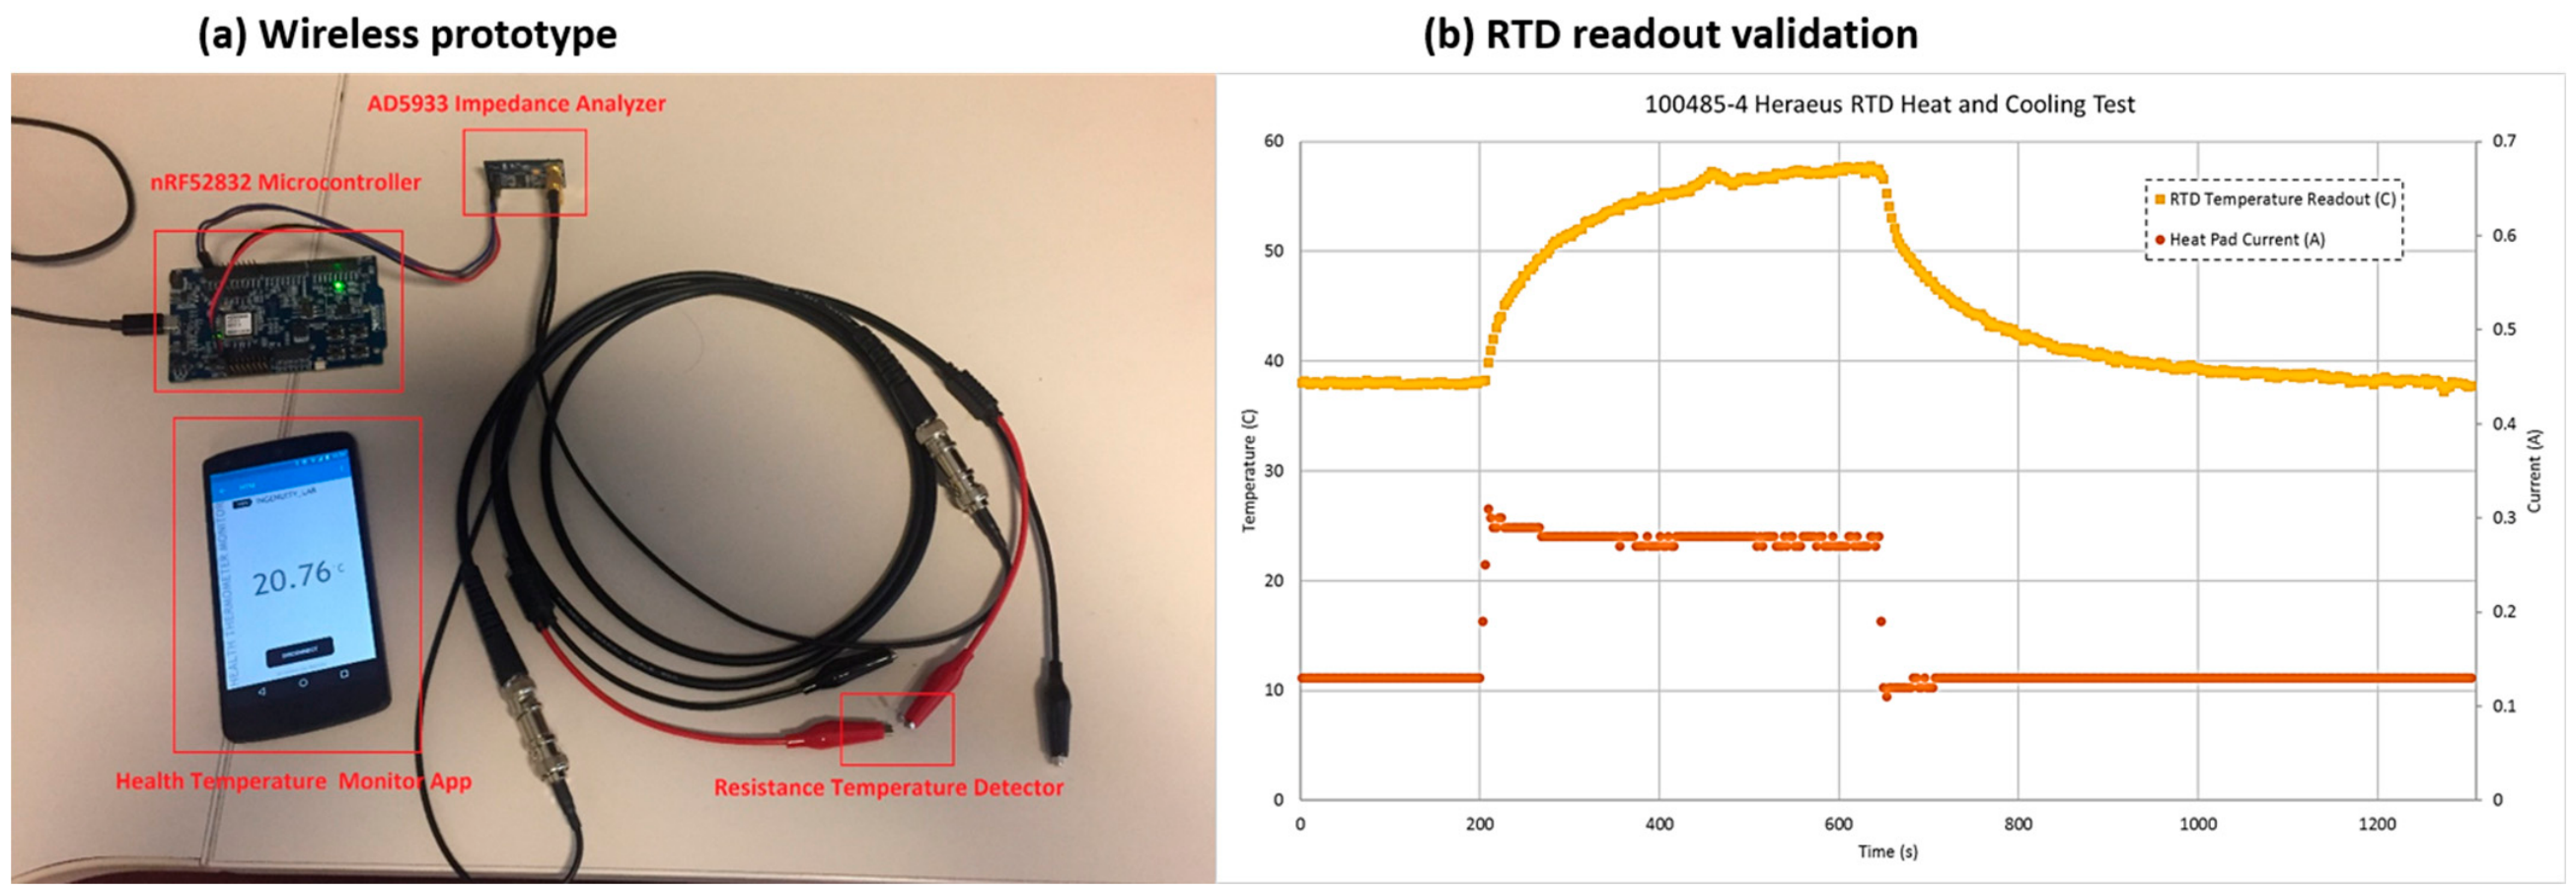
The prototype wireless readout shown in Figure 5 is able to link up the sensor to a very compact measurement chain. The bench testing of the impedance analyzer circuit has shown that it can be calibrated using a 103.9 Ω reference resistor, and then go on to measure up known resistors over 5 min intervals. The difference between the measured resistance and the readings from a digital multimeter for the same known resistors are less than 1% (Table 1). The base current draw of the prototype readout is approximately 6.62 mA. Although this is a first-generation wearable readout, the results are very promising. The main items that need to be included in future software, and then in hardware, are for power management, for packaging up into a small miniaturized package, and for flexible interconnects. These need to be included in order to allow for long-duration use.
Figure 5.
Wireless low-power readout demonstrations. (a) Wireless prototype integrating an impedance analyzer, nRF52 microcontroller, temperature app, and resistance temperature detector (RTD) connection. (b) resistive temperature sensor data captured using the electronics prototype.
Table 1.
Accuracy test for the impedance-analyzer readout prototype after calibration with a 103.9 Ω reference resistor.
3.3. Multi-Criteria Performance Comparison Using the Analytic Hierarchy Process (AHP)
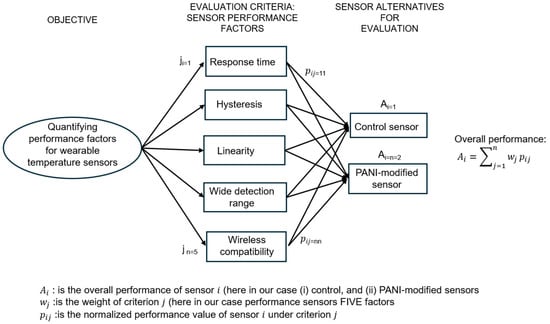
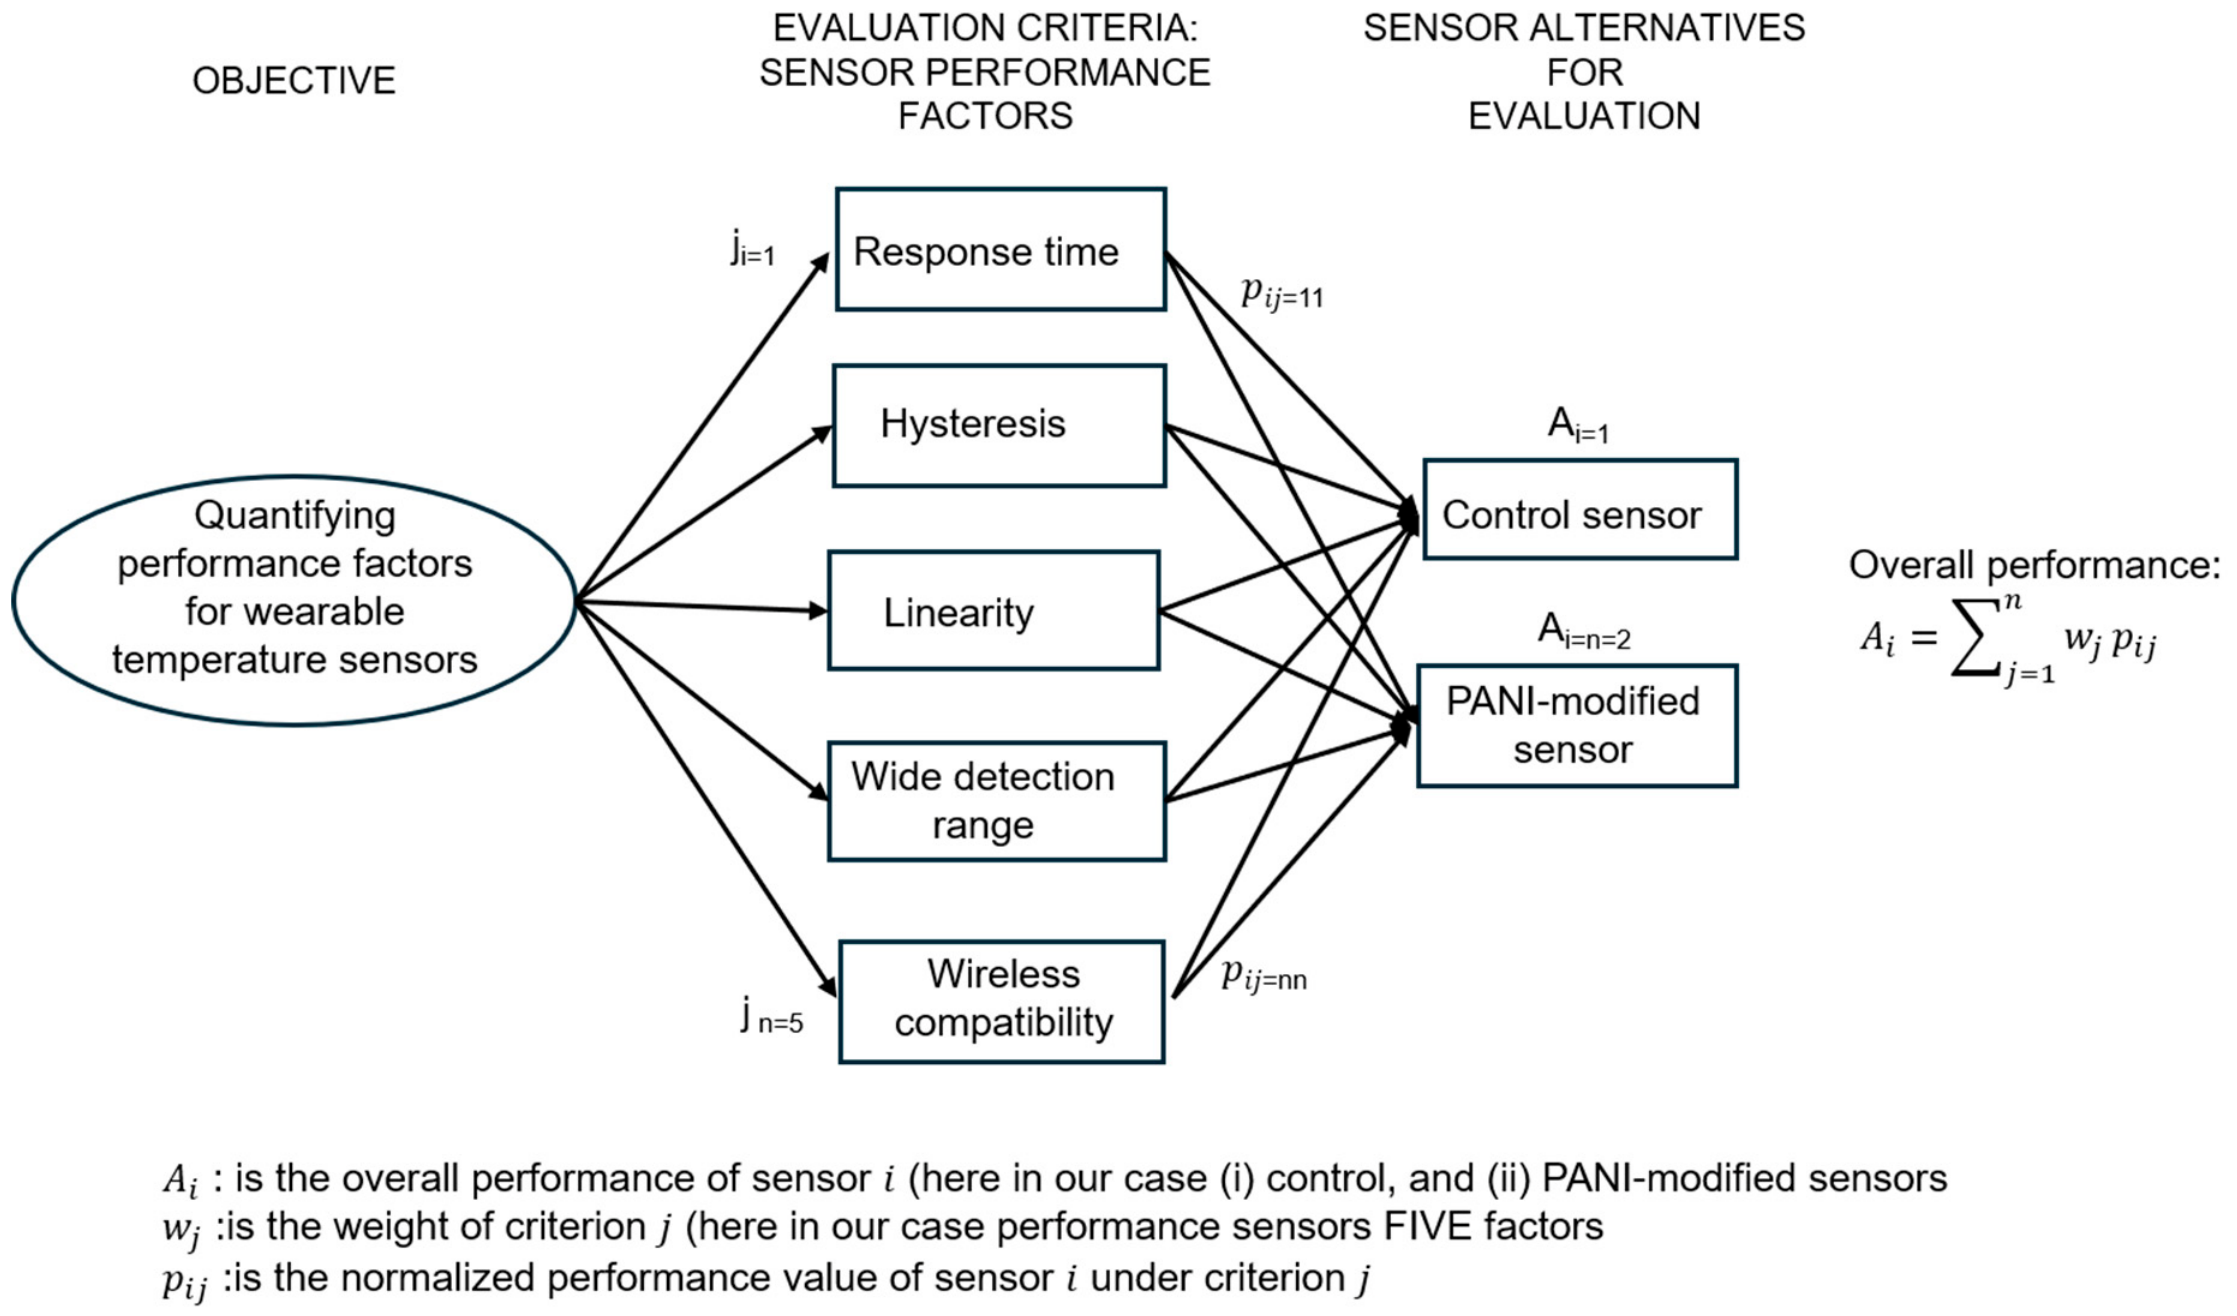
This work extends previous applications of AHP to: (a) flexible CNT-based DNA sensors [8]; (b) validation of a BiFeO3 nanothermometer [11]; (c) risk assessment of a multiplexed CNT biosensor [12]. Here, we used the AHP to quantify five factors that influence the performance of flexible temperature sensors: response time, linearity, hysteresis, wireless compatibility, and wide detection range. Three of these factors (linearity, hysteresis, and wireless compatibility) were evaluated using the experimental results obtained in the present study. The remaining two (response time and detection range) were assessed using historical data from previous projects [8,11,12] together with domain-expert judgment. In order to test the different criteria, two different types of temperature sensors have been created. The first type of sensor consists of regular temperature sensors (see Figure 1a), while the second type of sensor has been modified with the help of PANI (see Figure 1b). By using the AHP system (see Figure 6) and the corresponding mathematical calculations of the two different types of sensors, the best sensor for the purpose of wearable temperature monitoring can be determined. It is very important that the sensor is able to take good quality temperature readings and that it works well and consists of the right features in order to be suitable for wearable monitoring.
Figure 6.
AHP modeling and assessment.
Pairwise comparisons were subsequently performed using the standard AHP methodology to derive the relative importance (priority weights) of each evaluation criterion (sensor performance factors), followed by the calculation of global priority scores for the control and PANI-modified sensors. The resulting criterion priority, weights, and overall AHP weights are presented in Table 2.
Table 2.
AHP model numerical assessment.
The weighted AHP analysis reveals that the PANI-modified sensor consistently achieves a higher overall performance score than the control sensor, demonstrating its superior suitability for flexible and wearable temperature-sensing applications.
4. Conclusions
We have successfully fabricated flexible temperature sensors on a PET substrate using inkjet-printed conductive silver ink. The sensor was then modified with electrospun PANI nanowires, and its temperature sensing is compared against the unmodified sensor. It was found that both the unmodified and PANI-modified temperature sensors showed a positive, nearly linear resistance–temperature relationship over the temperature range of 20–70 °C, indicating positive-temperature-coefficient characteristics. Notably, it was found that the PANI-modified temperature sensor exhibited improved linearity, as the coefficient of determination (R-squared value) during heating was increased from 0.91 to 0.94, and that during cooling, it was increased from 0.90 to 0.98. Moreover, it was found that the maximum gap between the temperature–resistance curves that are measured during the heating cycle and the cooling cycle was halved from 8.4% to 4.0% by using the dispersed PANI nanowires. In addition, a complementary wireless readout prototype, utilizing an AD5933 impedance analyzer and an nRF52832 microcontroller, measured reference resistances with an accuracy within 1% of multimeter readings, drawing a base current of 6.62 mA. A multi-criteria evaluation using the AHP was conducted and the resulting ranking indicated that the PANI-enhanced printed resistive temperature sensor is the optimal wearable temperature sensor, as it is linear and reversible. Note, however, that the comparison was made using a single instance of each type of temperature sensor, and therefore that the results need to be confirmed using multiple instances of each type of temperature sensor in order to establish device-to-device repeatability. Future work includes aligning the dispersed PANI nanowires in the plane of the printed sensor in order to investigate the effect of directional conduction on the sensor sensitivity, encapsulating the printed temperature sensor in order to stabilize the skin contact and to protect it from the environmental humidity and airflow, and implementing onboard drift correction as well as noise reduction in order to enable low-power operation on an extended basis of time.
Author Contributions
Conceptualization, methodology, sensor fabrication, P.K.; validation, P.K. and S.B.; electronics design and software, J.T.; data analysis, P.K., J.T., S.B. and K.M.K.; writing—original draft preparation, P.K.; writing—review and editing, P.K. and K.M.K.; project administration, P.K. All authors have read and agreed to the published version of the manuscript.
Funding
This research was supported by WISEST (University of Alberta) and the Society of Petroleum Engineers Canadian Educational Foundation.
Institutional Review Board Statement
Not applicable.
Informed Consent Statement
Not applicable.
Data Availability Statement
Data supporting the results are contained within this article.
Acknowledgments
The authors thank Richard Hull, Samira Aslanzadeh, and C. D. Montemagno for support and discussions, and acknowledge Ingenuity Lab for access to facilities and instrumentation.
Conflicts of Interest
The authors declare no conflicts of interest.
References
- Nag, A.; Mukhopadhyay, S.C.; Kosel, J. Wearable flexible sensors: A review. IEEE Sens. J. 2017, 17, 3949–3960. [Google Scholar] [CrossRef] [Scilit]
- Su, Y.; Ma, C.; Chen, J.; Wu, H.; Luo, W.; Peng, Y.; Luo, Z.; Li, L.; Tan, Y.; Omisore, O.M.; et al. Printable, highly sensitive flexible temperature sensors for human body temperature monitoring: A review. Nanoscale Res. Lett. 2020, 15, 200. [Google Scholar] [CrossRef] [Scilit] [PubMed]
- Song, E.; Choi, J.-W. Conducting polyaniline nanowire and its applications in chemiresistive sensing. Nanomaterials 2013, 3, 498–523. [Google Scholar] [CrossRef] [Scilit] [PubMed]
- Song, E.; Choi, J.-W. An on-chip chemiresistive polyaniline nanowire-based pH sensor with self-calibration capability. In Proceedings of the 2012 Annual International Conference of the IEEE Engineering in Medicine and Biology Society (EMBC), San Diego, CA, USA, 28 August–1 September 2012; pp. 4018–4021. [Google Scholar] [CrossRef] [Scilit] [PubMed]
- Forzani, E.S.; Zhang, H.; Nagahara, L.A.; Amlani, I.; Tsui, R.; Tao, N. A conducting polymer nanojunction sensor for glucose detection. Nano Lett. 2004, 4, 1785–1788. [Google Scholar] [CrossRef] [Scilit]
- Mondal, D.; Paul, D.; Mukherji, S. Impedance spectroscopy-based detection of cardiac biomarkers on polyaniline coated filter paper. IEEE Sens. J. 2017, 17, 5021–5029. [Google Scholar] [CrossRef] [Scilit]
- Pan, J.; Liu, S.; Zhang, H.; Lu, J. A flexible temperature sensor array with polyaniline/graphene–polyvinyl butyral thin film. Sensors 2019, 19, 4105. [Google Scholar] [CrossRef] [Scilit] [PubMed]
- Cai, L.; Mohan, K.K.; Prashanthi, K.; Montemagno, C.D. Fabrication and quantitative performance analysis of a low-cost, flexible CNT network-based DNA sensors using ink-jet printing. Sens. Bio-Sens. Res. 2022, 36, 100498. [Google Scholar] [CrossRef] [Scilit]
- Zhang, Y.; Rutledge, G.C. Electrical conductivity of electrospun polyaniline and polyaniline-blend fibers and mats. Macromolecules 2012, 45, 4238–4246. [Google Scholar] [CrossRef] [Scilit]
- Saaty, T.L. A scaling method for priorities in hierarchical structures. J. Math. Psychol. 1977, 15, 234–281. [Google Scholar] [CrossRef] [Scilit]
- Prashanthi, K.; Mohan, K.K.; Antić, Ž.; Ahadi, K.; Dramićanin, M.D. Multiple ratiometric nanothermometry using semiconductor BiFeO3 nanowires and quantitative validation of thermal sensitivity. Micro Nano Syst. Lett. 2022, 10, 1. [Google Scholar] [CrossRef] [Scilit]
- Mohan, K.K.; Prashanthi, K.; Hull, R.; Montemagno, C.D. Risk assessment of a multiplexed carbon nanotube network biosensor. IEEE Sens. J. 2018, 18, 4517–4528. [Google Scholar] [CrossRef] [Scilit]

Disclaimer/Publisher’s Note: The statements, opinions and data contained in all publications are solely those of the individual author(s) and contributor(s) and not of MDPI and/or the editor(s). MDPI and/or the editor(s) disclaim responsibility for any injury to people or property resulting from any ideas, methods, instructions or products referred to in the content. |
© 2026 by the authors. Licensee MDPI, Basel, Switzerland. This article is an open access article distributed under the terms and conditions of the Creative Commons Attribution (CC BY) license.