


Abstract
Early detection of sheep pregnancy and litter size (PLS) is crucial for the efficient management of the flock. However, standard ultrasonography for these purposes is not cost-effective for flock testing and requires trained and experienced operators. We have developed a simple handheld, real-time RGB color-sensor system that can measure six PLS candidate biomarkers, namely L-carnitine, glucose, lactate, creatinine, urea, and pyruvate using six in-house colorimetric assays, and a companion tablet application to report sheep PLS results. A benchtop microplate reader was used to obtain the measurements of the six assays using spiked, pooled sheep serum to produce a set of assay-specific weighted “color numbers” which were then used to calibrate the portable sensor system. To facilitate pregnancy testing in sheep during the coldest months of Canadian winter, we have also developed a custom-made temperature-controlled heating chamber so that the colorimetric assays can be incubated at approximately 21 °C. Here, we report on outdoor, on-device calibration of two chemically distinct assays spanning the concentration ranges represented in the panel. Creatinine, measured using the non-enzymatic alkaline 3,5-dinitrobenzoic acid reaction, increased monotonically over a concentration range of 0–200 µM (linear fit, R2 = 0.9469). Urea, measured using the enzyme-coupled Berthelot reaction, increased rapidly up to about 10 mM before saturating (quadratic fit, R2 = 0.9864). Both assays produced repeatable and concentration-dependent color change under the variable outdoor winter conditions experienced on-farm and therefore, hold great promise for the on-farm colorimetric measurement of metabolites of interest for pregnancy and litter size in sheep.
1. Introduction
Reproductive efficiency in sheep production systems can significantly impact profitability and animal welfare. Knowing whether a ewe is pregnant and how many offspring she is carrying allows producers to manage their animals within appropriate production groups to optimize feed utilization and minimize pregnancy-related losses. The economic importance of litter size cannot be overemphasized, since the feed requirements of pregnant ewes carrying single lambs differ markedly from those carrying twin or triplet ewes [1]. Mismatches between litter size and feed allocation to the late pregnant ewe can have substantial and opposing cost consequences [2,3]. While under-allocation to the multiple-bearing ewe can predispose her to pregnancy toxemia with consequent deleterious effects on her lambs’ birth weights and survival, over-allocation to single-bearing ewes can result in unnecessary and substantial feed expenditure, which is generally greater than the majority of other variable costs in production systems [2]. As such, litter size is not a secondary consideration when allocating the feed of the late pregnant ewe for the final third of gestation.
Detection of pregnancy on-farm is currently undertaken by transabdominal ultrasonography to establish whether a ewe is pregnant or not and to give an estimate of litter size in the middle of gestation [4,5]. Whilst accurate for both endpoints, however, detection of pregnancy by ultrasonography requires specific equipment and an experienced person to conduct the scanning, often not available on-farm. A number of methods have been used to confirm pregnancy in the laboratory, such as measurement of progesterone in blood samples from ewes taken at various times throughout the breeding season and detection of pregnancy-associated glycoprotein (PAG) in blood samples using immunoassay methods [5]. However, these methods carry a delay period while samples are sent to a laboratory and processed, which makes their use for triggering fertile synthesis in sufficient time to allow for preparation and application prior to breeding difficult. A simple pen-side test that could be used by any flock owner to test for pregnancy and also to establish litter size at an early stage would be useful for a timely management decision.
Blood metabolites offer an attractive alternative approach to predicting pregnancy and litter size (PLS). Metabolomics, the systematic analysis of small molecules present in biofluids, has become a tool of wide-spread application in animal science for the assessment of nutritional status, for disease recognition, and for the prediction of production traits [6,7]. The study of pregnancy, and in particular of gestation, would benefit from the use of metabolomics, since the metabolic demand on the ewe increases with the number of fetuses in the womb. In general terms, therefore, the concentration of energy metabolites, of amino acids and of products derived from nitrogen metabolism in the blood of pregnant females would enable the detection of pregnancy [8] and, in principle, would also allow the prediction of litter size by distinguishing between females carrying single lambs and those carrying more than one lamb.
In a previous study conducted by our group on sheep serum from multiple flocks at various gestational time points, metabolomics data were generated using liquid chromatography–tandem mass spectrometry (LC–MS/MS) and nuclear magnetic resonance (NMR) spectroscopy [9]. Informational metabolites, such as L-carnitine, glucose, lactate, creatinine, urea, and pyruvate from this work can be measured using colorimetric assays and, thus, can be reconstituted on a farm using simple hardware to obtain numeric values that are then translated to specific data in a barn by the producer.
Quantitative colorimetric assays (or enzyme-coupled assays that yield a colorimetric signal) exist for the six metabolites of interest. Namely, glucose, L-lactate, and L-pyruvate can be quantitatively measured using respective oxidase enzymes followed by Amplex Red reaction products [10]. L-carnitine can be measured using carnitine acetyltransferase with DTNB detection of liberated coenzyme A [11]; creatinine can be measured through alkaline chromogen reactions [12]; and urea can be measured using the urease-coupled Berthelot/indophenol reaction [13,14]. Low-cost optical detection of such reactions is also well established in paper-based and microfluidic colorimetric devices [15,16]. Indeed, smartphone- or sensor-based color quantification [17] has enabled many clinical and food-testing applications to move from centralized laboratories into the field. However, it has not yet been demonstrated is whether this type of readout can perform reliably under the winter conditions of a Canadian sheep operation, where low temperatures, reaction kinetics, reagent instability and variations in ambient light may all compromise measurement accuracy.
Here we extend the application of our point-of-care colorimetric metabolomic sensor platform, already reported for a few biomarkers [18,19], to the prediction of sheep PLS by measuring the levels of six different biomarkers. In this proceedings paper, we present a proof of concept for on-device metabolite quantification of the two representative assays from the six-biomarker panel: creatinine and urea. These metabolites were selected because they span the concentration ranges covered by the panel (micromolar and millimolar) and because they employ chemically distinct reactions that produce stable chromogens. The creatinine assay uses a non-enzymatic reaction with 3,5-dinitrobenzoic acid in alkaline conditions, whereas the urea assay is an enzyme-coupled Berthelot/indophenol assay [13]. Collectively, these assays provide a stringent test of the color-number readout. A full-length paper will be written to describe the calibration and the validation of all the six in-house assays.
2. Experimental Procedure
2.1. Workflow
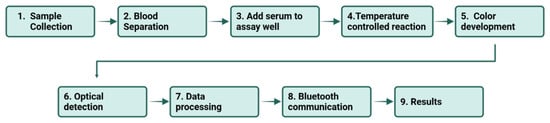
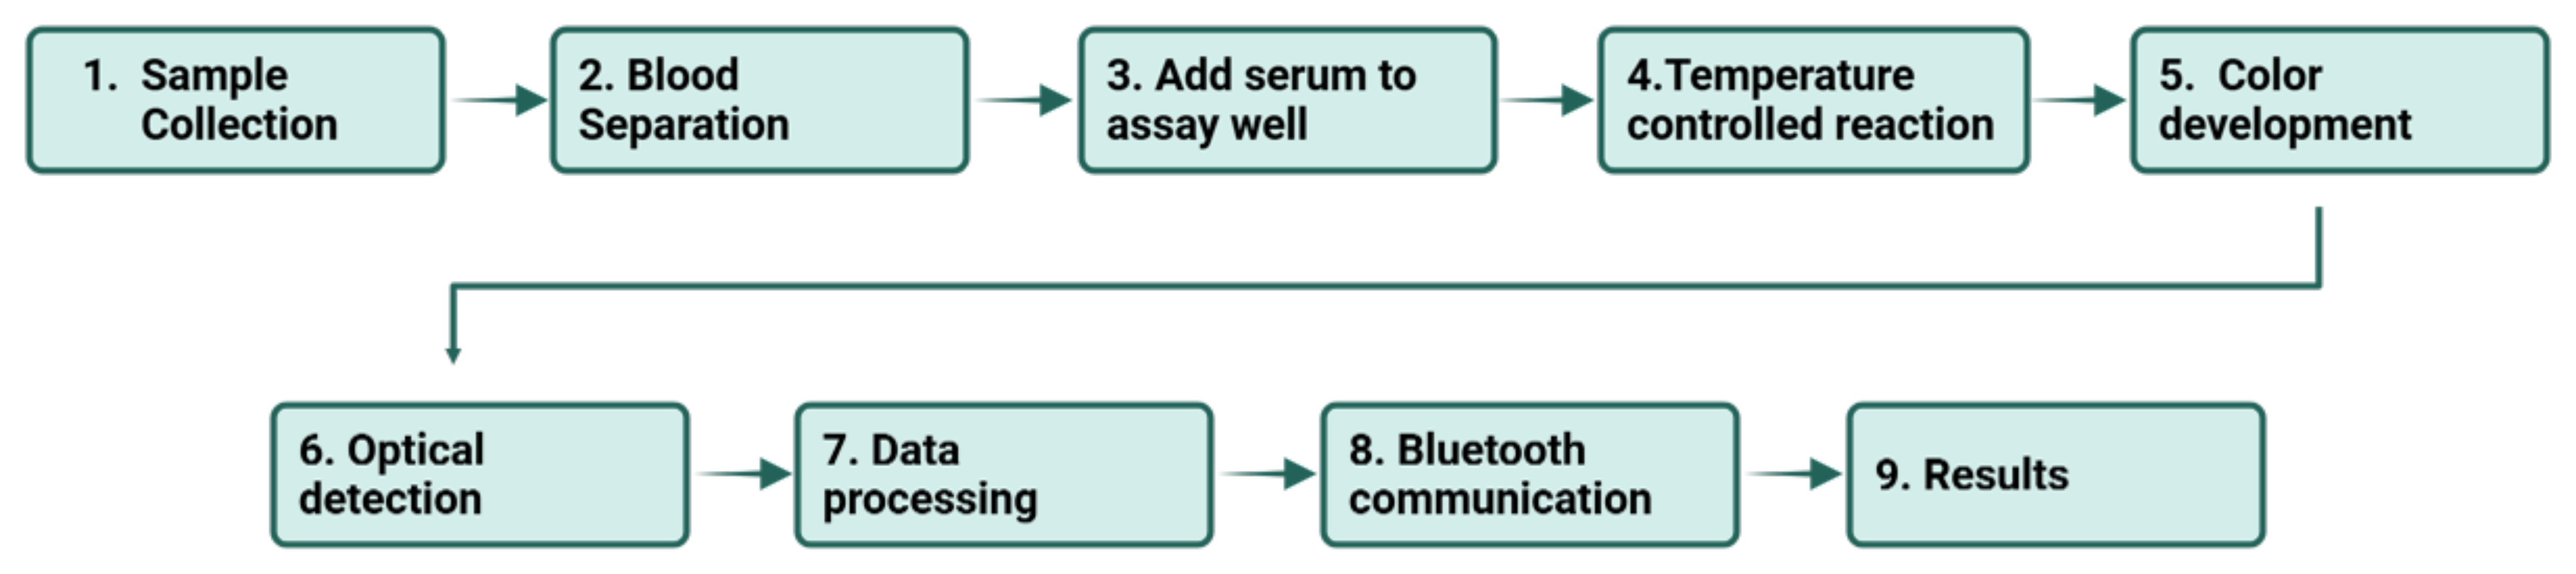
The workflow for assays performed on the platform is illustrated in Figure 1. The assay begins with whole blood which is centrifuged to form serum which can either be deproteinized prior to use in certain assays or left undiluted for others. A known volume of serum is added to a freeze-dried reagent pellet to reconstitute the required reagents for that assay. The resulting solution is placed within a temperature-controlled chamber and left to incubate for a set time period at a temperature of approximately 21 °C. The resulting solution is then transferred to a cuvette and read using the RGB color reader. The color reader uses a white LED to illuminate the solution within the cuvette and reads the reflectance of the resulting-colored solution at the red, green and blue channels. The reflectance values are converted to a weighted color number that is then transmitted to a connected tablet via Bluetooth using the reader. Through the companion application on the connected tablet, the required assay is initiated, the incubation period is timed, and the concentration of the required metabolite is calculated using preprogrammed calibration equations for each individual assay.
Figure 1.
The workflow of the RGB color-sensor. A prepared serum sample is metered and mixed with freeze-dried (FD) reagents and dye, the reaction develops color in a temperature-controlled chamber, and the RGB color-sensor reads the cuvette. The red, green, and blue channel values are combined into a reaction-specific color number, which a smartphone application converts into a metabolite concentration and, ultimately, a pregnancy and litter size (PLS) readout.
2.2. Reagents
All solutions were prepared in ultrapure water. For the creatinine assay, a 0.3 M 3,5-dinitrobenzoic acid (DNBA) solution was prepared in 0.5 M lithium hydroxide immediately before use and protected from light. A 100 µL freeze-dried reaction mixture was prepared containing 50 µL of 0.3 M DNBA solution, 20 µL of 0.25 M LiOH solution, 20 µL of 10% w/v sucrose solution and 10 µL of 2% w/v carboxymethyl cellulose solution, in which the sucrose and carboxymethyl cellulose act as bulking and stabilizing agents during lyophilization. DNBA, lithium hydroxide monohydrate, carboxymethyl cellulose and sucrose were purchased from Sigma-Aldrich (St. Louis, MO, USA). Reaction mixtures were freeze-dried using a Labconco freeze-dryer (Labconco Corporation, Kansas City, MO, USA).
For the urea assay, the reagents were prepared in a two-pellet freeze-dried format. Sodium salicylate, sodium nitroprusside, EDTA and urease were lyophilized together in phosphate buffer as the first pellet, while the alkaline sodium hypochlorite chromogen was lyophilized separately as the second pellet. The two components are lyophilized and stored apart because urease is inactivated at the alkaline pH of the chromogen. Nitroprusside catalyzes indophenol formation and EDTA suppresses interference from divalent cations. Sodium salicylate, sodium nitroprusside, EDTA, urease, sodium hypochlorite and trehalose were purchased from Sigma-Aldrich (St. Louis, MO, USA). Pooled commercial sheep serum (Gibco Sheep Serum, New Zealand origin) was obtained from Thermo Fisher Scientific (Waltham, MA, USA).
Calibrants for both assays were matrix-matched to pooled commercial sheep serum, so that calibrants and unknowns share an identical matrix. The creatinine content of the serum lot used was determined by LC–MS as 65 µM; this endogenous concentration defines the blank of the creatinine calibration.
2.3. Instrumentation
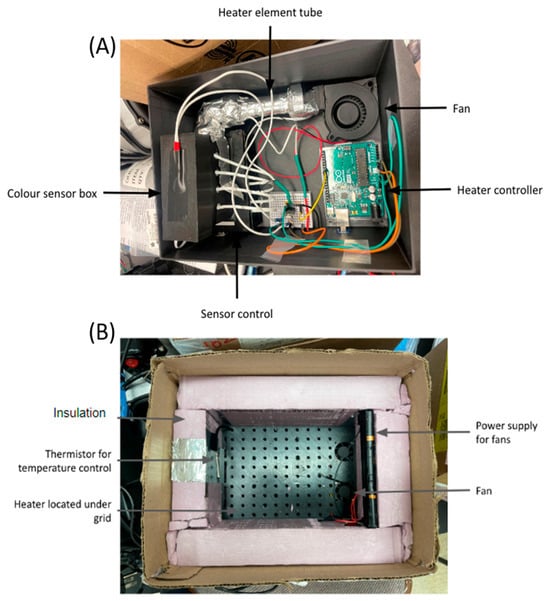
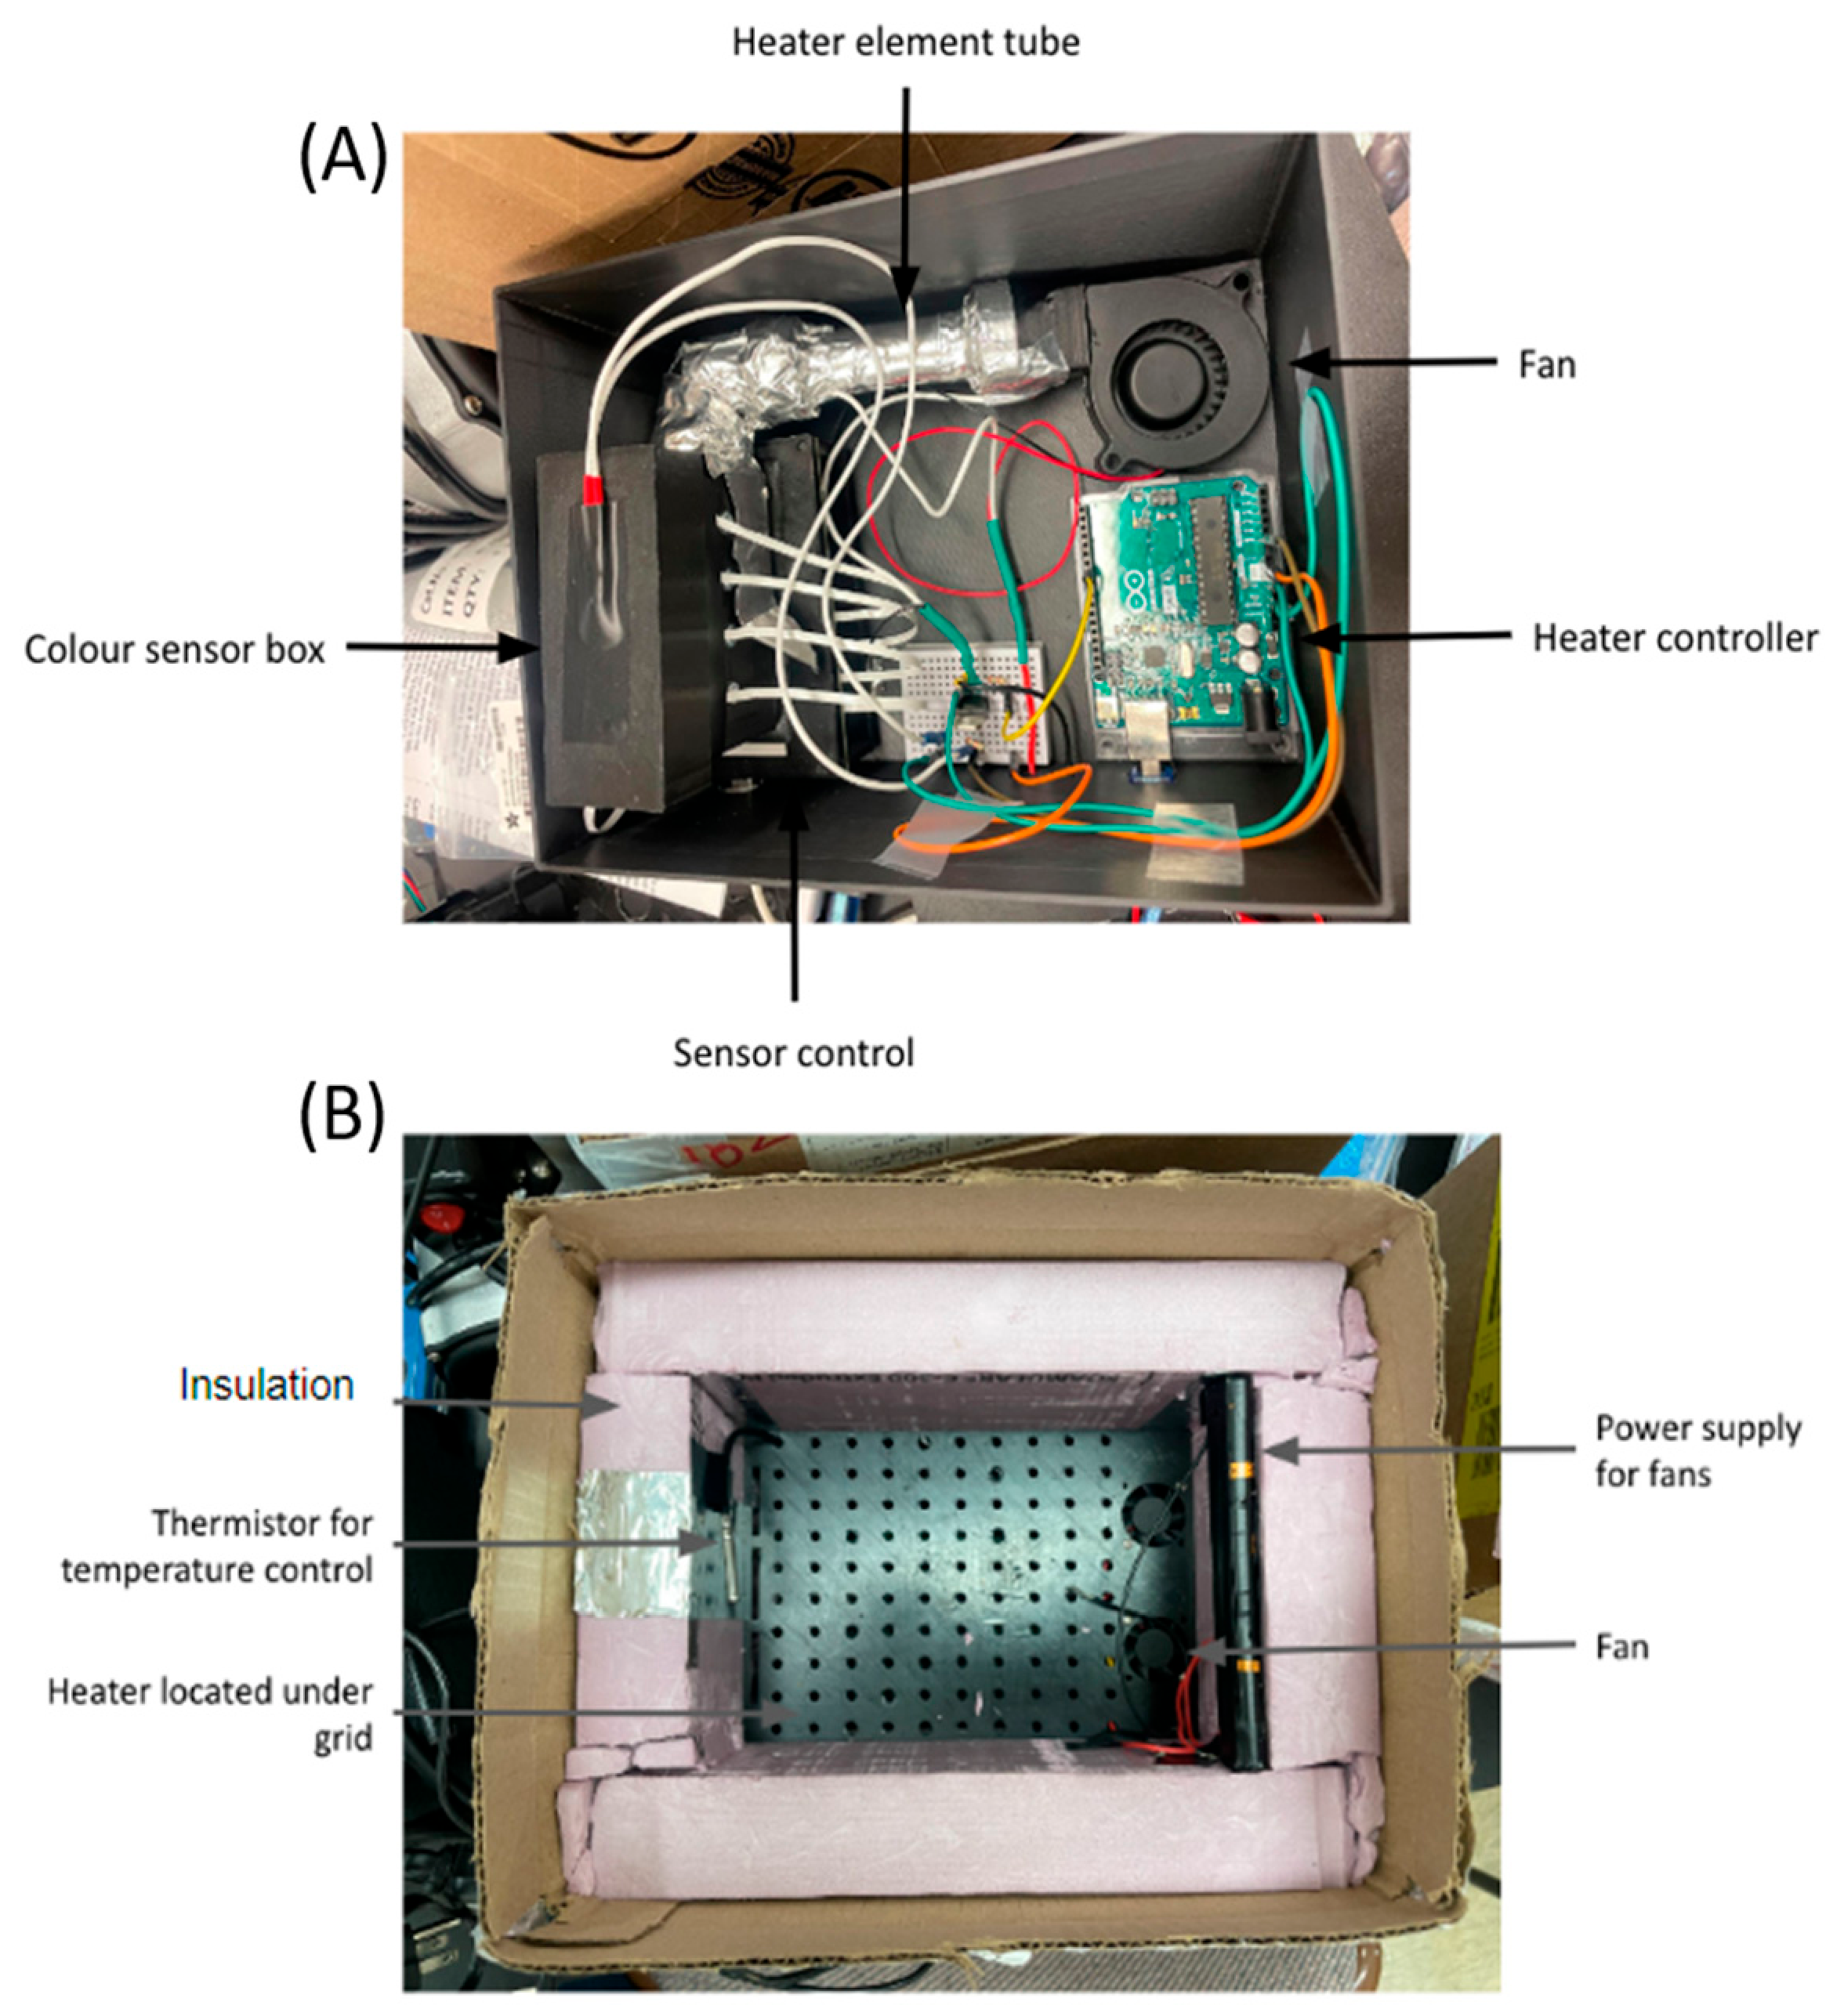
Our measurement system comprises a miniaturized version of our previously reported color sensing multi-channel platform that incorporates temperature control (Figure 2). The sensing part of the system was embedded in a control/Bluetooth board that was controlled by a tablet/smartphone app (Figure 2A). The control/Bluetooth board contained five color-sensor chips that were individually connected to five mini-LED boards. The sensing parts and the corresponding LED parts were placed opposite each other on the top of five cuvette holders that were placed in an insulated box and were heated by a resistive heating element. The cuvette chambers were designed to be as small as possible and were individually surrounded by pieces of foam to minimize temperature fluctuations. The temperature-controlled box, including the cuvettes, was encased in a black 3D-printed plastic casing in order to minimize interference by ambient light. The heating element, thermistor and electric fan were connected to an Arduino Uno board (Arduino, Monza, Italy) that was programmed to maintain a set temperature. The color-sensor chips, LEDs, Bluetooth module and passive components were obtained from Digi-Key (Thief River Falls, MN, USA), and the enclosure was 3D-printed in black polylactic acid filament.. The thermistor was used to continuously monitor the temperature inside the box. If the temperature deviated below the allowed deviation from the set temperature, the heating element was switched on. If the temperature rose above the allowed deviation from the set temperature, the fan was switched on in order to cool down the system. Importantly, the temperature inside the insulated box was maintained at the desired temperature even at outside temperatures below freezing.
Figure 2.
The integrated platform: (A) a labeled diagram of the heated color-sensor box; and (B) a labeled diagram of the heated reaction box.
We kept the reactions and cuvettes in a temperature-controlled chamber at a room temperature (21 °C) during cold weather operation; alternative temperatures of 37 °C as well as 65 °C could also be used if necessary. Assay mixtures that required an incubation step before the final color reaction occurred were placed in a reaction chamber (Figure 2B) equipped with a heating element and a fan that was continuously operating during field testing. The warm air was circulated inside the reaction chamber by the fan. The reaction chamber itself was made of insulating foam.
After each reaction, the RGB values of the cuvette contents were measured using the RGB sensor. The software calculated a reaction-specific color number instead of using the red, green, or blue channel values. The color number is a weighted average of the values of the red, green, and blue channels, and the weights and measurement ranges for each assay were optimized separately as described in our previous publication [18]. Due to the different weights for the same color, the color numbers of different assays cannot be compared, and some of the color numbers may even be negative. There is no meaning to a color number unless the sample calibration information for the assay is used to interpret it. Each sample was measured three times, and the mean value of the three colors was calculated. The software Central-Sensor-Control (custom, in-house software, no formal version numbering; built in Android Studio and deployed for the field testing) ran on a Samsung Galaxy Tab A7 tablet (Samsung Electronics, Suwon, Republic of Korea). It operated the instrument remotely over a wireless link, started each test and converted the acquired color numbers to metabolite concentrations using the stored calibration information.
The creatinine and urea assays were calibrated with RGB sensors in a heated chamber at a constant temperature. In contrast, all assays carried out at ambient temperature in the lab without the heated chamber of the instrument did not produce any color. Thus, for quantitative measurements in the outdoor environment, thermal control is important.
2.4. Experimental Setup and Procedure
In this study, the RGB color-sensor platform was used to collect calibration data for the creatinine and urea assays. For creatinine, the freeze-dried reaction mixture was reconstituted with 100 µL of serum, left to stand for 2 min, and then carefully pipetted into cuvettes and measured for absorbance at 490 nm after a 12 min dark incubation period. Calibration points were prepared at concentrations spanning 0–200 µM of added creatinine above the endogenous concentration of the pooled serum. For urea, deproteinized serum, diluted 1/50, was added to the enzyme containing reagents within the first pellet and gently mixed for 5 min at room temperature. The resulting mixture was then added to the chromogen containing reagents within the second separate pellet and allowed to develop for 10 min, before measurement of the resulting color solution by absorbance at 600 nm. Matrix-matched urea calibrants spanned the range of serum urea concentration from 0 mM to 15 mM. The resulting color solutions from the urea assays were transferred to the cuvettes and measured for RGB values.
3. Results and Discussion
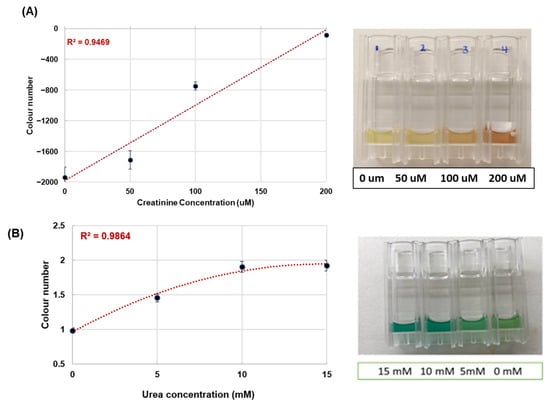
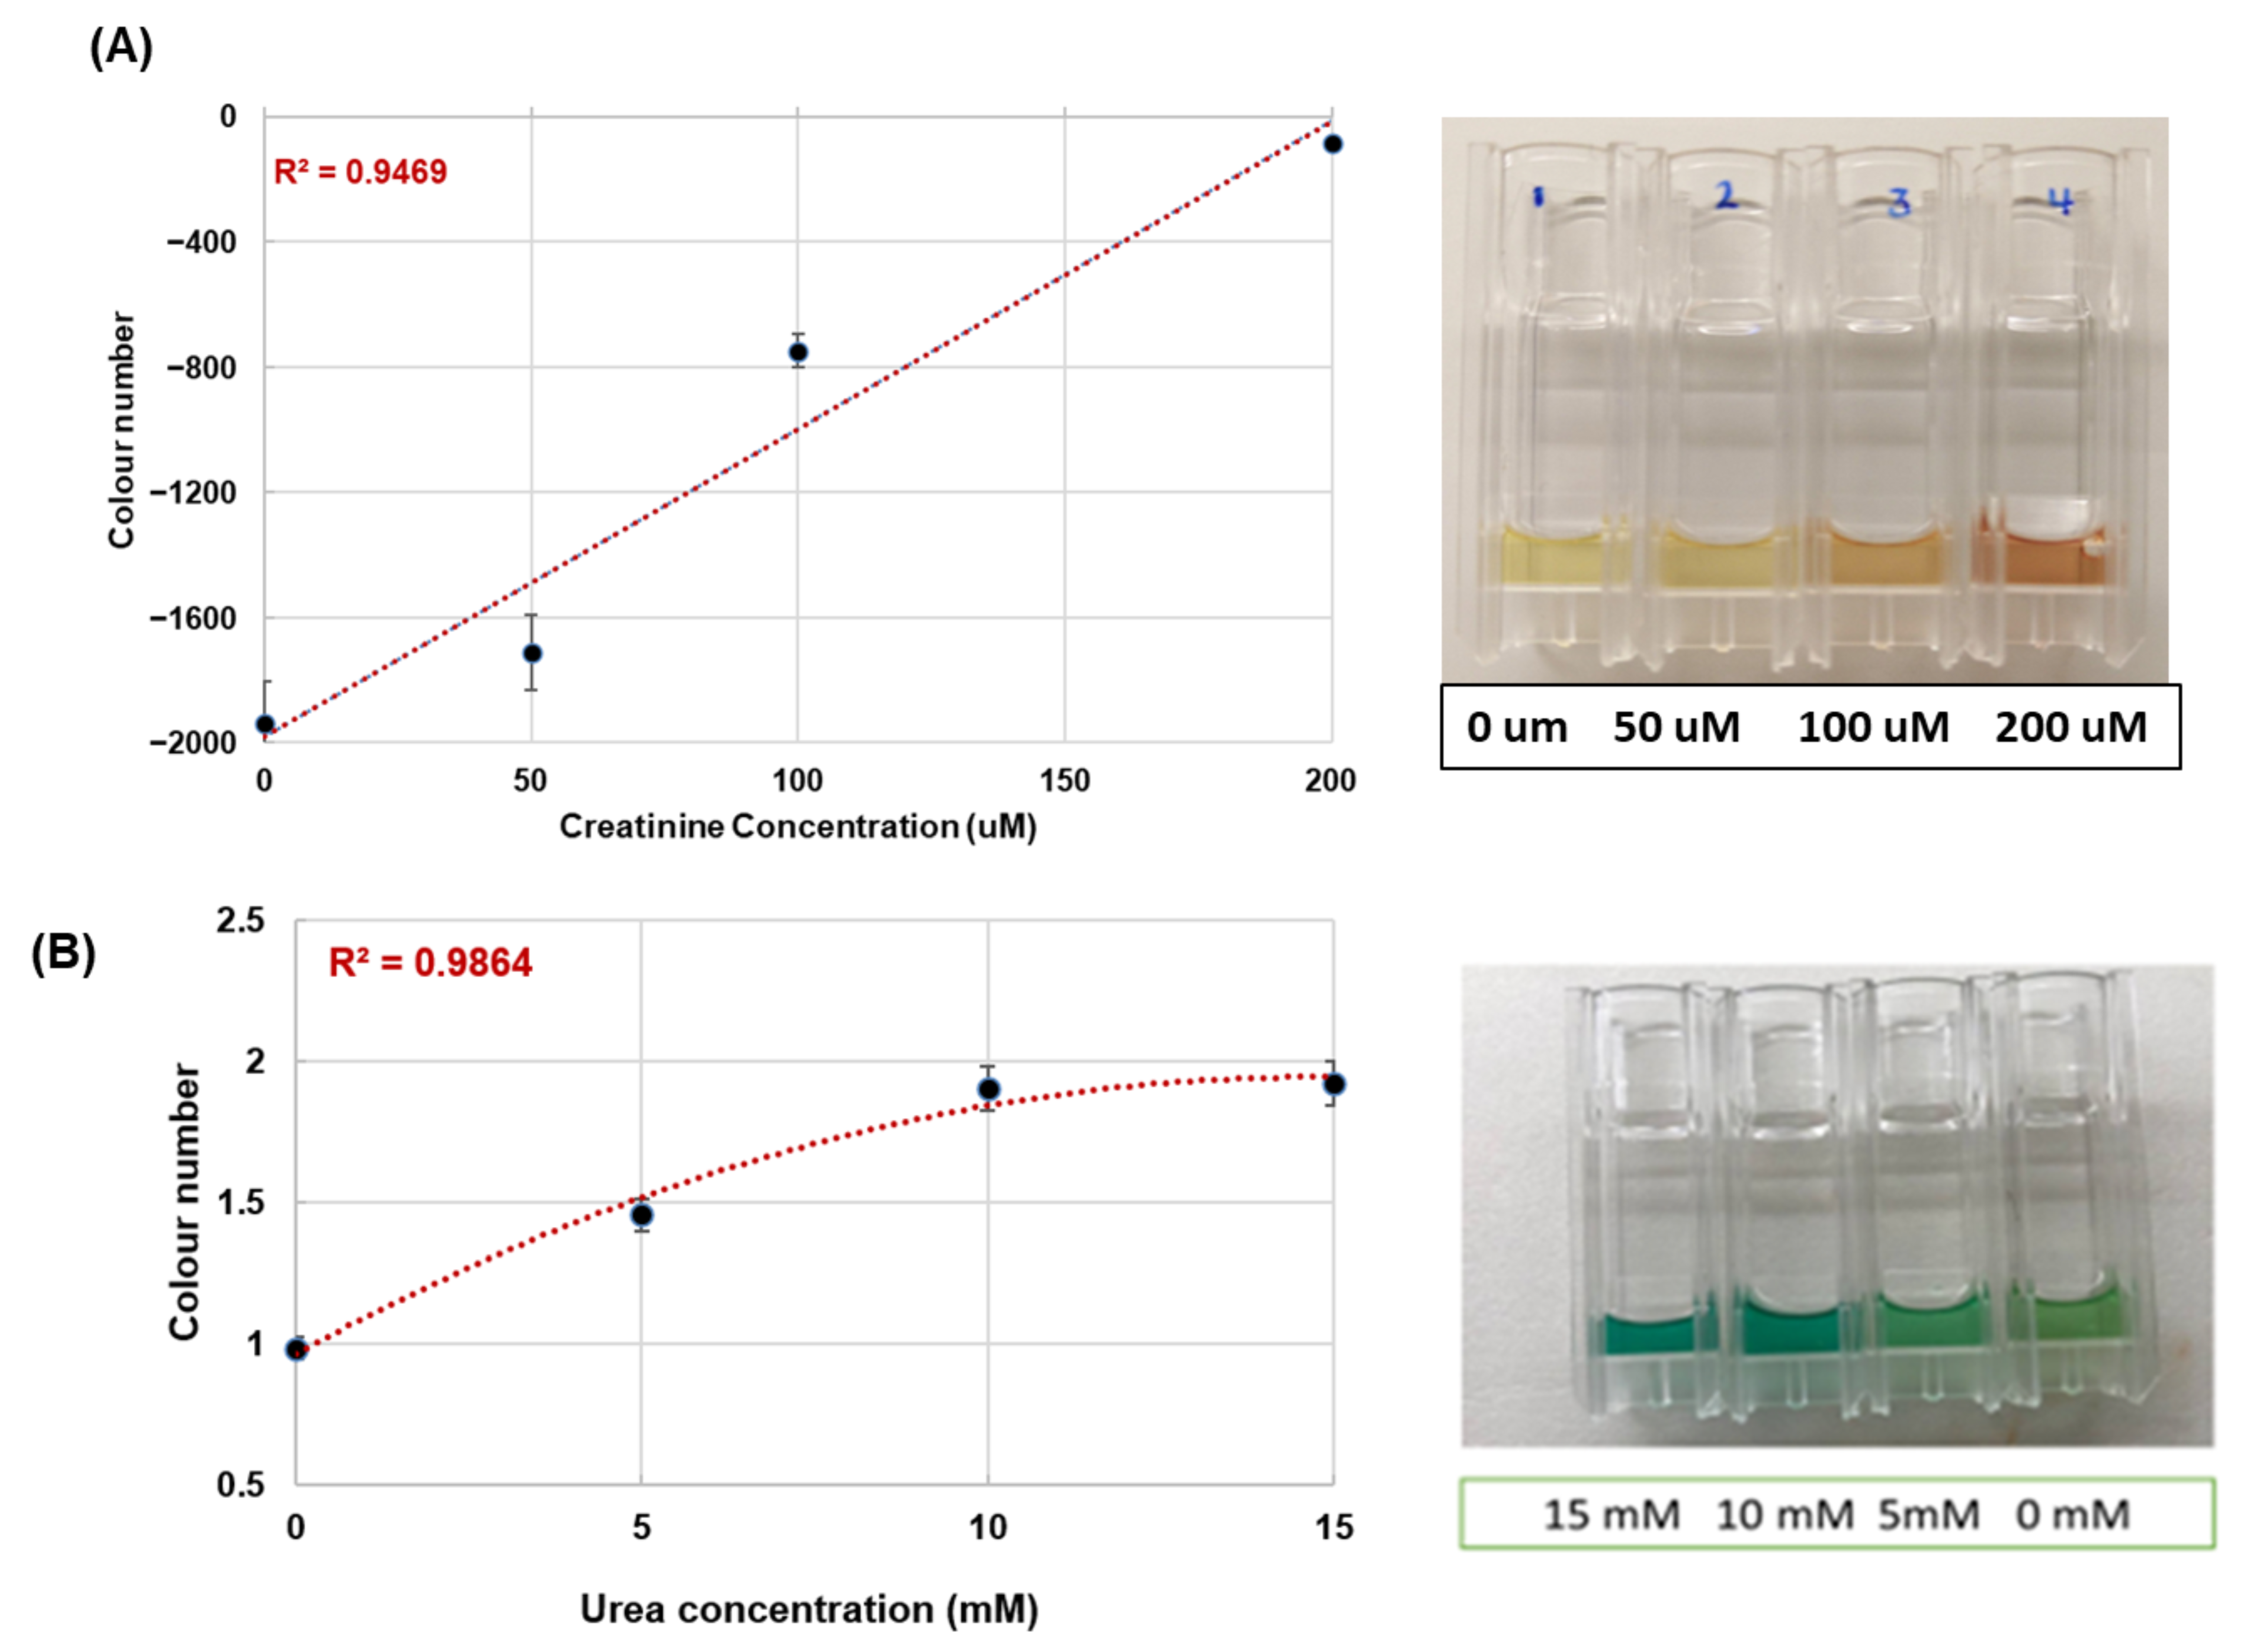
For a field test, the same two assays, creatinine and urea, were performed on the outdoor pad on a winter’s day, and their colors immediately read using the RGB color-sensor of the platform. Instead of running the incubation at ambient temperature, the reactions were kept in the heated chamber of the platform at a constant temperature of about 21 °C. The color numbers for the reaction-specific colors measured on the outdoor pad were plotted against the concentration of the corresponding analytes and are displayed in Figure 3.
Figure 3.
Outdoor RGB color-sensor calibrations for (A) creatinine and (B) urea, run outside in winter with reactions held at ≈21 °C in the heated chamber. Color number versus analyte concentration (spiked pooled sheep serum) with linear/polynomial fits: creatinine (R2 = 0.9469) and urea (R2 = 0.9864). The error bars represent the mean ± standard deviation.
Both creatinine and urea assays produced concentration-dependent calibration curves suitable for quantitative determination in outdoor field assays. The creatinine assay (Figure 3A) was found to produce a linear response within the range of tested creatinine concentrations (R2 = 0.9469) using alkaline DNBA reagent in the field assay. The urea assay (Figure 3B) was found to produce a nonlinear response (R2 = 0.9864) where the color number increased sharply to 10 mM urea and then remained at same value at 15 mM urea. This type of response is typical for the Berthelot/indophenol type of assays and is characterized by a saturation point at certain urea concentration, thus defining the working range of an assay. For the urea assay described here the working range is up to approximately 10 mM, thus covering the range of normal serum urea values in ewes. The outdoor calibration of both assays was successful and it was possible to maintain the temperature of the heated reaction chamber at a constant level during the winter field work. Importantly, the weighted color number generated by two different types of reactions, one non-enzymatic and one enzyme-coupled, produced quantitative outputs over different concentration ranges.
Limits of detection (LOD) and limits of quantitation (LOQ) were determined from the calibration curve using LOD = 3.3 σ/S and LOQ = 10 σ/S, where σ is the standard deviation of the response and S the slope. Both were measured by absorbance on a laboratory microplate reader (BioTek 800 TS, Agilent Technologies Inc., Santa Clara, CA, USA) using matrix-matched calibrants in pooled sheep serum. For creatinine, determined by microplate reader at 490 nm in sheep serum, the LOD was determined to be 21 µM and the LOQ 63 µM. For urea, the corresponding values are LOD = 0.86 mM and LOQ = 2.61 mM. It is important to note that the LOD and LOQ for both assays are a characteristic of the assay chemistry and thus also of the color formation, reagent background and the kinetics of the reaction. They are not intrinsic optical limits of the RGB color-sensor, whose read precision on fixed color standards is high (CV 0.39–0.46%). In both assays the limiting factor is the color-forming chemistry, the reagent background and the reaction kinetics rather than the optical readout, so improvements in low-end sensitivity would be expected to come from optimization of the assay chemistry rather than from changes to the sensor hardware.
The detection limits of the two assays reported here are higher than what is typically seen for automated clinical laboratory methods. For example, Jaffé-type and enzymatic-based clinical creatinine assays have detection limits in the single-digit micromolar range [20]. Urease-coupled assays for urea typically have limits of detection in the few-tenths of a millimolar range [21]. The purpose of the platform described here is to provide a simple, rapid and cost-effective measurement at the point of sampling on the farm that will allow informed on-farm management decisions. It is not intended to replace more accurate clinical laboratory quantitation. Both assays measure within the relevant physiological concentrations for assessing pregnancy and for categorizing litter size in the ewe. In our recent work using the same chemistry on the same sensor architecture (DNBA alkaline), a detection limit of 3.26 mM and a quantitation limit of 9.89 mM were found for the determination of creatinine in human urine samples which were diluted 20-fold in 19 mM phosphate buffer over the concentration range 0–50 mM [19]. In contrast, the serum assays reported here are undiluted and measure over a much narrower concentration range.
All calibration used standard addition into pooled sheep serum rather than buffer, so calibrants and samples share the same matrix and any proportional matrix effect is absorbed into the calibration slope. Endogenous analyte levels in the pooled serum, determined independently, served as a measured baseline. Applying a buffer-derived calibration to serum is precisely what matrix-matched calibration avoids.
A heated reaction chamber with temperature control and air circulation maintained the samples near room temperature, prevented freezing, and enabled normal color development during winter field work. This feature is important because pregnancy detection in Canadian sheep flocks often occurs during the colder months. Overall, under outdoor winter conditions with heated-chamber temperature control, the RGB color-sensor produced quantitative calibration curves for both creatinine and urea, demonstrating the feasibility of colorimetric metabolite quantification in the field. Future studies will extend this approach to the complete six-biomarker panel.
4. Conclusions
In this preliminary study, we have demonstrated the ability to quantify serum colorimetric reactions relevant to PLS prediction in sheep using an RGB color-sensor platform. Initially serum colorimetric reactions were conducted at a range of temperatures in order to establish the required working temperature for quantitative colorimetric readout using the color-sensor. Subsequently, using a custom heated chamber, the creatinine and urea assays were conducted at the required working temperature to provide concentration-dependent calibrations on the device (R2 = 0.9469 and 0.9864 respectively) over a range of concentrations spanning the working range in micromolars and millimolars. This study establishes a credible engineering approach to pen-side biochemical measurement of clinical interest using the color-sensor for rapid, portable and cost-effective diagnosis of veterinary interest in field conditions.
Author Contributions
All authors—investigation. P.K., S.M. (Scott MacKay), A.Z., A.K., C.T.-C., Y.X., and U.S.—methodology, validation, and data curation. D.D., A.M., and S.H.—validation and data curation. A.N., J.C., B.C., and M.W.—validation, data curation, and software. P.K.—writing—original draft preparation, visualization, and project administration. P.K., S.M. (Scott MacKay), C.T.-C. and D.W.—conceptualization and review and editing. S.M. (Susan Markus) and D.W.—methodology, funding acquisition, and supervision. All authors have read and agreed to the published version of the manuscript.
Funding
This research was funded by Results Driven Agriculture Research (RDAR), project number 2022N008R, delivered in part through the Canadian Agricultural Partnership, with additional cash support from Alberta Innovates (project # 212200748) and Mitacs (#IT27217) and cash and in-kind contributions from the Alberta Lamb Producers, the Ontario Sheep Farmers, the University of Alberta/The Metabolomics Innovation Centre, Olds College, and Lakeland College.
Institutional Review Board Statement
The animal study protocol was approved by the Lakeland College animal care (approval #Sheep PLS-05-22).
Data Availability Statement
The metabolite biomarker dataset underlying the predictive models is available in the published study by Goldansaz et al. [9]. Additional data generated during device development and validation are available from the corresponding authors on reasonable request.
Acknowledgments
The authors thank the Alberta Lamb Producers, the Ontario Sheep Farmers, Olds College, and the participating flock owners for in-kind support, animal access, and assistance with on-farm testing, and The Metabolomics Innovation Centre (TMIC) at the University of Alberta for laboratory and instrument support.
Conflicts of Interest
The authors declare no conflicts of interest. The funders had no role in the design of the study; in the collection, analyses, or interpretation of data; in the writing of the manuscript; or in the decision to publish the results.
Abbreviations
The following abbreviations are used in this manuscript:
| DNBA | 3,5-dinitrobenzoic acid |
| DTNB | 5,5′-dithiobis (2-nitrobenzoic acid) |
| FD | freeze-dried |
| LC–MS/MS | liquid chromatography–tandem mass spectrometry |
| NMR | nuclear magnetic resonance |
| PAG | Pregnancy-associated glycoproteins |
| PLS | pregnancy and litter size |
| RGB | red–green–blue |
References
- Cordero, M.O.; Herrera, C.A.M.; García, J.M.V.; Stewart, C.A.; Nieto, C.A.R.; Alfaro, A.E.O.; Purvis, I.W.; Reyes, V.C.; Rangel, H.A.L.; Martin, G.B. Pregnancy and Litter Size, but Not Lamb Sex, Affect Feed Intake and Wool Production by Merino-Type Ewes. Animals 2019, 9, 214. [Google Scholar] [CrossRef] [Scilit] [PubMed]
- Robinson, J.J.; Rooke, J.A.; Mcevoy, T.G. Nutrition for Conception and Pregnancy. In Sheep Nutrition; Freer, M., Dove, H., Eds.; CABI Publishing: Oxford, UK, 2002; pp. 189–211. [Google Scholar]
- Rook, J.S. Pregnancy Toxemia Of Ewes, Does, and Beef Cows. Vet. Clin. North Am. Food Anim. Pract. 2000, 16, 293–317. [Google Scholar] [CrossRef] [Scilit] [PubMed]
- Karen, A.; Kovács, P.; Beckers, J.F.; Szenci, O. Pregnancy Diagnosis in Sheep: Review of the Most Practical Methods. Acta Vet. Brno 2001, 70, 115–126. [Google Scholar] [CrossRef] [Scilit]
- Sousa, N.M.; Ayad, A.; Beckers, J.F.; Gajewski, Z. Pregnancy-Associated Glycoproteins (PAG) As Pregnancy Markers in the Ruminants. J. Physiol. Pharmacol. 2006, 57, 153–171. [Google Scholar] [PubMed]
- Fontanesi, L. Metabolomics and Livestock Genomics: Insights into a Phenotyping Frontier and Its Applications in Animal Breeding. Anim. Front. 2016, 6, 73–79. [Google Scholar] [CrossRef] [Scilit]
- Johnson, C.H.; Ivanisevic, J.; Siuzdak, G. Metabolomics: Beyond Biomarkers and towards Mechanisms. Nat. Rev. Mol. Cell Biol. 2016, 17, 451–459. [Google Scholar] [CrossRef] [Scilit] [PubMed]
- Balikci, E.; Yildiz, A.; Gürdoǧan, F. Blood Metabolite Concentrations during Pregnancy and Postpartum in Akkaraman Ewes. Small Rumin. Res. 2007, 67, 247–251. [Google Scholar] [CrossRef] [Scilit]
- Goldansaz, S.A.; Markus, S.; Plastow, G.; Wishart, D.S. Predictive Blood Biomarkers of Sheep Pregnancy and Litter Size. Sci. Rep. 2022, 12, 10307. [Google Scholar] [CrossRef] [Scilit] [PubMed]
- Zhou, M.; Diwu, Z.; Panchuk-Voloshina, N.; Haugland, R.P. A Stable Nonfluorescent Derivative of Resorufin for the Fluorometric Determination of Trace Hydrogen Peroxide: Applications in Detecting the Activity of Phagocyte NADPH Oxidase and Other Oxidases. Anal. Biochem. 1997, 253, 162–168. [Google Scholar] [CrossRef] [Scilit] [PubMed]
- Ellman, G.L. Tissue Sulfhdryl Groups. Arch. Biochem. Biophys. 1959, 82, 70–77. [Google Scholar] [CrossRef] [Scilit] [PubMed]
- Bolliger, A. The Colorimetric Determination of Creatinine in Urine and Blood With 3,5-Dinitrobenzoic Acid. Med. J. Aust. 1936, 2, 818–821. [Google Scholar] [CrossRef] [Scilit]
- Fawcett, J.K.; Scott, J.E. A Rapid and Precise Method for the Determination of Urea. J. clin. Path 1960, 13, 156–159. [Google Scholar] [CrossRef] [Scilit] [PubMed]
- Searle, P.L. The Berthelot or Indophenol Reaction and Its Use in the Analytical Chemistry of Nitrogen A Review. ANALYST 1984, 109, 549–568. [Google Scholar] [CrossRef] [Scilit]
- Yetisen, A.K.; Akram, M.S.; Lowe, C.R. Paper-Based Microfluidic Point-of-Care Diagnostic Devices. Lab Chip 2013, 13, 2210–2251. [Google Scholar] [CrossRef] [Scilit] [PubMed]
- Martinez, A.W.; Phillips, S.T.; Whitesides, G.M.; Carrilho, E. Diagnostics for the Developing World: Microfluidic Paper-Based Analytical Devices. Anal. Chem. 2010, 82, 3–10. [Google Scholar] [CrossRef] [Scilit] [PubMed]
- Rateni, G.; Dario, P.; Cavallo, F. Smartphone-Based Food Diagnostic Technologies: A Review. Sensors 2017, 17, 1453. [Google Scholar] [CrossRef] [Scilit] [PubMed]
- Bai, S.; Gonzalez-Vasquez, P.; Torres-Calzada, C.; MacKay, S.; Cook, J.; Khaniani, Y.; Davies, G.; Singh, U.; Kovur, P.; Chen, J.; et al. Development of a Point-of-Care Colorimetric Metabolomic Sensor Platform. Biosens. Bioelectron. 2024, 253, 116186. [Google Scholar] [CrossRef] [Scilit] [PubMed]
- Kovur, P.; MacKay, S.; Bai, S.; Cook, J.; Torres-Calzada, C.; Bhattacharyya, D.; Singh, U.; Wishart, D.S. A Portable Colorimetric Biosensor Platform for Urinary Colorectal Cancer Biomarker Testing in Low-Resource Settings. Biosensors 2026, 16, 485. [Google Scholar] [CrossRef] [Scilit] [PubMed]
- Lewińska, I.; Tymecki, Ł.; Michalec, M. An Alternative, Single-Point Method for Creatinine Determination in Urine Samples with Optoelectronic Detector. Critical Comparison to Jaffé Method. Talanta 2019, 195, 865–869. [Google Scholar] [CrossRef] [Scilit] [PubMed]
- Francis, P.S.; Lewis, S.W.; Lim, K.F. Analytical Methodology for the Determination of Urea: Current Practice and Future Trends. TrAC Trends Anal. Chem. 2002, 21, 389–400. [Google Scholar] [CrossRef] [Scilit]
Disclaimer/Publisher’s Note: The statements, opinions and data contained in all publications are solely those of the individual author(s) and contributor(s) and not of MDPI and/or the editor(s). MDPI and/or the editor(s) disclaim responsibility for any injury to people or property resulting from any ideas, methods, instructions or products referred to in the content. |
© 2026 by the authors. Licensee MDPI, Basel, Switzerland. This article is an open access article distributed under the terms and conditions of the Creative Commons Attribution (CC BY) license.