


Abstract
Reinforced concrete frames with masonry infill walls are widely used, and both the RC elements and the infill masonry significantly influence the structural response. Accurate finite element modeling of the interaction between masonry and the RC skeleton requires understanding the independent material and mechanical behavior of the masonry. The reliability of numerical models for masonry depends strongly on the assigned material properties of brick and mortar. However, few sources provide these parameters. To address this issue, we conducted an experimental program and then developed a custom-parameterized numerical model in an identical setup, validated against the test results. We investigated the resistance, deformation, and failure of individual masonry specimens under uniaxial compression applied perpendicular to the bed joints. In the micro-level masonry model, custom, nonlinear material models were employed when defining the constituent and contact elements. The simulation tracked crack formation using a newly developed and parametrized fracture model. Contact elements were used for brick-mortar connections, allowing for load transfer, interface slip, and failure. The resulting numerical model reproduced the actual behavior with acceptable accuracy from an engineering standpoint. Thus, it can be adapted to analyze infill masonry walls and to describe the interaction with the reinforced concrete structural system.
1. Introduction
There is an increasing demand for simulation-based design and a better understanding of masonry mechanical behavior. Most analysis methods use a macro-level approach, which often cannot accurately describe the structural response, especially local failures and interactions with adjacent structural elements, as well as the influence of the bond pattern. Micro-level analysis can more accurately estimate structural behavior; however, a reliable model requires careful parameterization and a systematic validation process based on experimental data. Ultimately, the global response of an assembly is governed by its internal microstructural behavior, necessitating separate modeling of individual elements and their interfaces, despite the significantly higher computational demand of this approach [1,2]. In the recent literature, the number of studies focusing on masonry testing remains limited. While several studies provide thorough experimental investigations of individual units [3,4,5,6], experimental data on the compressive behavior and failure modes of small- to medium-sized masonry specimens remain limited. This study aimed to design and conduct custom experimental tests on solid brick masonry and use the resulting data to develop numerical micro-models using a non-linear finite element approach.
2. Experimental Program
2.1. Materials and Specimen Geometry
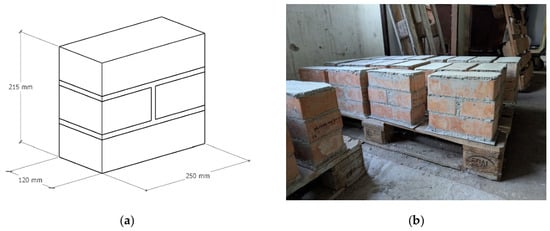
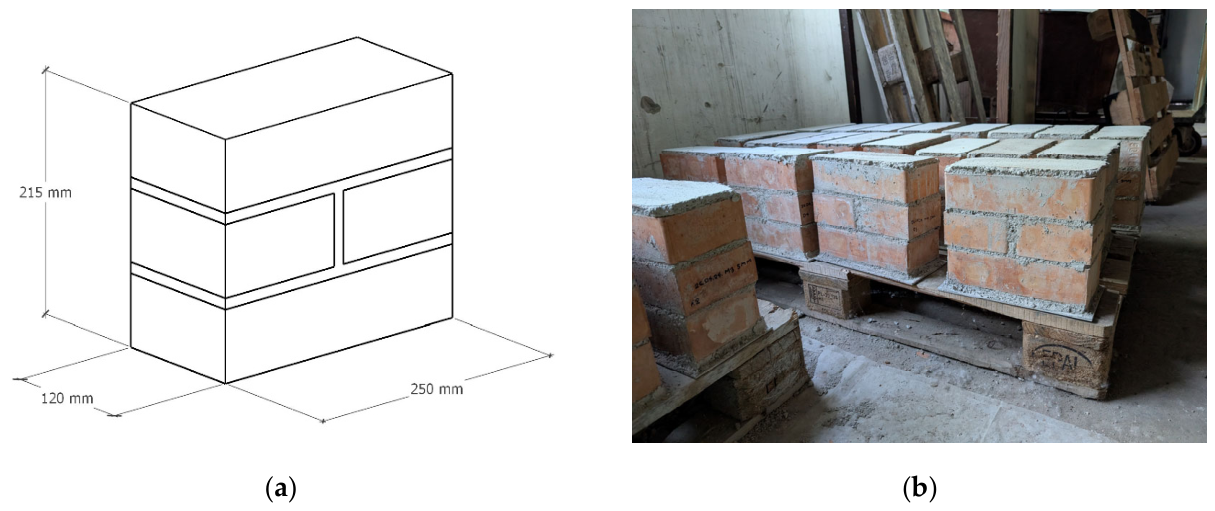
The experimental program included constructing small masonry specimens and testing them under uniaxial compression. Each specimen consisted of 3 courses of standard-size (120 × 250 × 65 mm), solid, fired clay bricks (nominal compressive strength of 18 MPa) laid in a running bond pattern. The bricks were assembled using commercially available, pre-mixed lime-cement mortar, with nominal compressive strengths of 2.5 and 5 MPa. The joint thickness was 10 mm, and mortar capping was used on both the top and bottom surfaces. During testing, this capping evenly distributed the load and ensured parallel, smooth surfaces. Each specimen was laid on top of a 3 mm thick steel plate to facilitate lifting and handling without causing damage.
The mortar was prepared according to the manufacturer’s specifications, where 300 mL of water was added to 1000 mL of dry mortar. Prior to laying, the bricks were briefly submerged in water to mitigate moisture absorption from the mortar, which could weaken the brick-mortar bond. The specimens were left to cure for a minimum of 28 days (Figure 1b).
Figure 1.
(a) Specimen dimensions; (b) masonry specimens, storage, and curing.
2.2. Testing Procedure
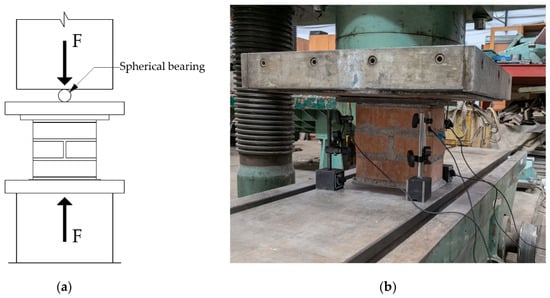
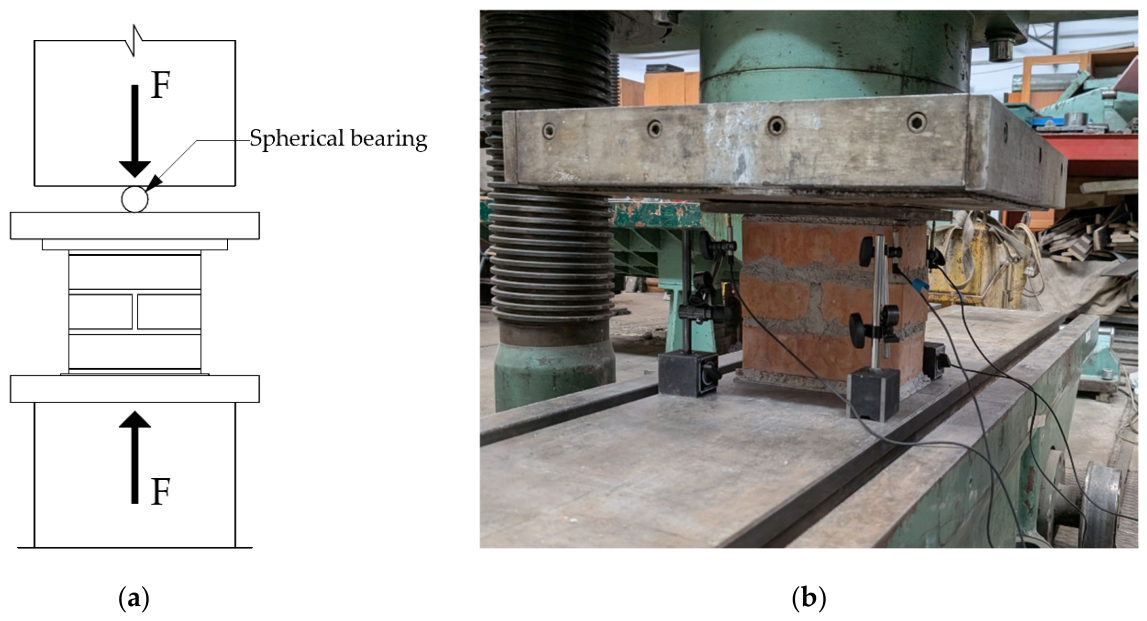
Following curing, the uniaxial compressive tests were conducted using a testing machine with a maximum load capacity of 6000 kN. A lower loading surface was provided by the robust steel construction of the machine. A 20 mm thick steel plate was placed on top of the tested specimen, which was loaded through the spherically seated upper platen (Figure 2a).
Figure 2.
(a) Schematic of the testing arrangement; (b) photo of the testing configuration.
A hardboard sheet was positioned between the steel plate and the loading platen to improve seating and load distribution. The specimens were centered in the machine to prevent eccentric loading. Throughout testing, the compressive load was monitored with the integrated load cell of the testing machine. In addition, linear variable differential transformers (LVDTs) were used to measure the vertical displacements of the 20 mm upper steel plate. Four points were monitored near the corners of the specimen, positioned at a distance of 25 mm from the front and back faces of the specimen.
2.3. Experimental Results
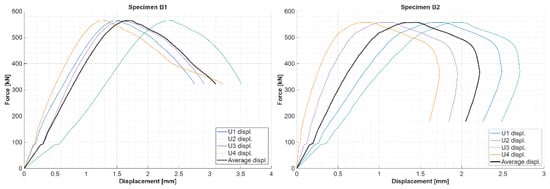
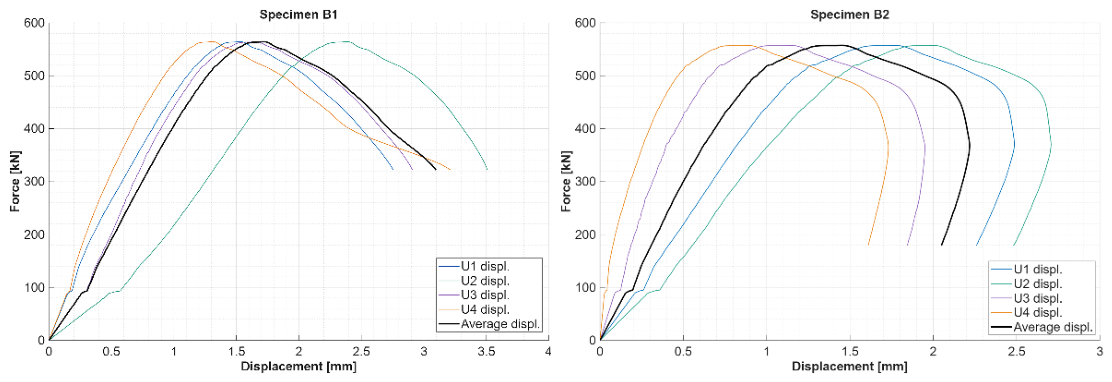
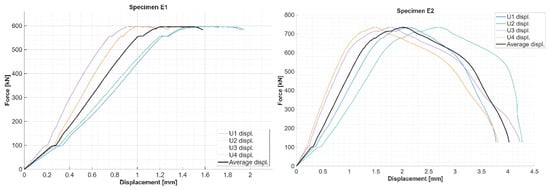
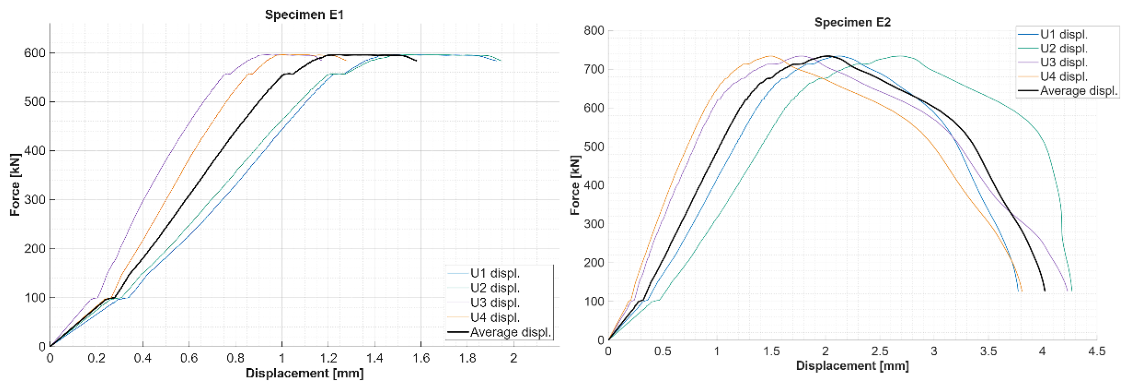
A total of four masonry specimens were tested (B1, B2, E1, E2), where the prefix denotes the nominal strength (B: 2.5 MPa; E: 5 MPa). Table 1 presents the resulting peak load and corresponding displacement values of the tested specimens. The resulting force–displacement curves are presented in Figure 3 and Figure 4.
Table 1.
Ultimate load and corresponding displacement values for specimens with mortar nominal compressive strength of 2.5 MPa (B1, B2) and 5 MPa (E1, E2).
Figure 3.
Experimental force–displacement diagrams for specimens B1 and B2: individual LVDTs (U1–U4), average displacement.
Figure 4.
Experimental force–displacement diagrams for specimens E1 and E2: individual LVDTs (U1–U4), average displacement.
Although the experimental program was limited to a total of four specimens at the time of writing, further testing campaigns are underway to expand the sample size.
2.4. Typical Failure Mode
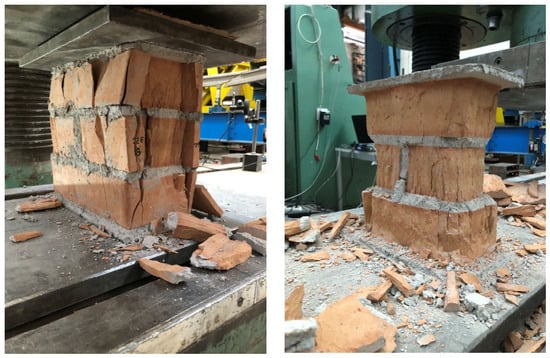
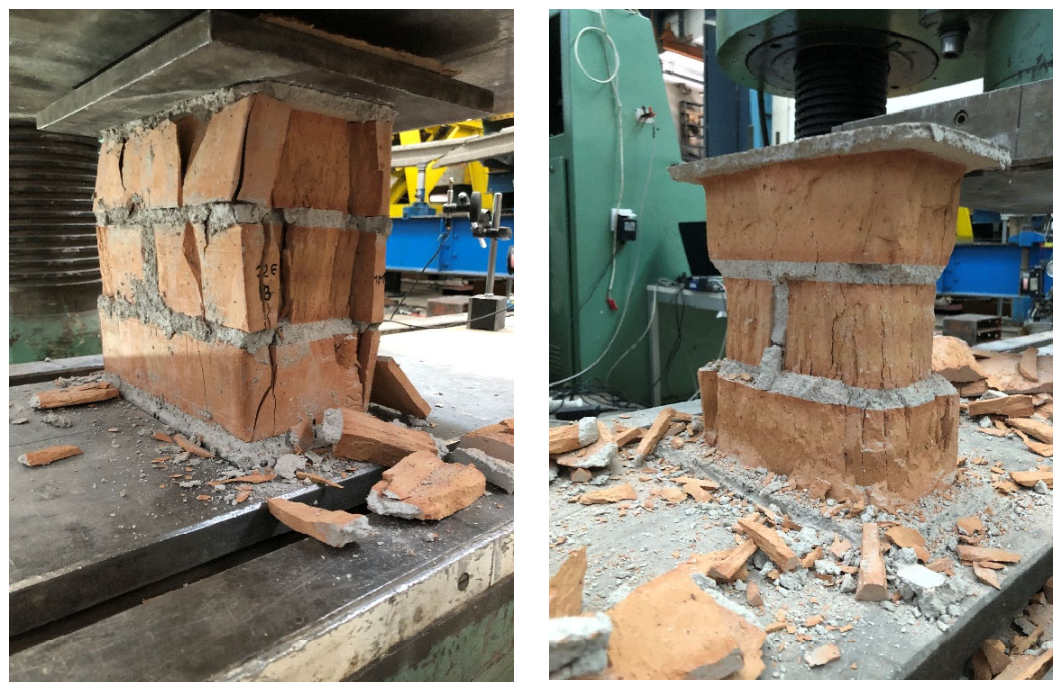
The specimens exhibited a typical brittle compressive failure with progressive vertical crack formation and material degradation. As the loading platen made contact with the specimen, the spherical joint rotated to accommodate angular imperfections in the specimen and the capping material. After an initial seating phase, the force–displacement diagram exhibited a short, linear elastic stage with lower stiffness. This was followed by elastic behavior with an approximately linear slope that continued until the first cracks started to form. The first hairline cracks visible on the outside initiated at approximately 60–70% of the ultimate load. These cracks progressively widened, with new cracks forming and accompanied by sharp popping sounds. The compressive failure was characterized by rapid crack formation, spalling of the material, and a sudden drop in post-peak load. After the removal of loose fragments, the crushed specimens displayed an hourglass shape (Figure 5).
Figure 5.
Specimen after failure.
3. Numerical Model
3.1. Material Models
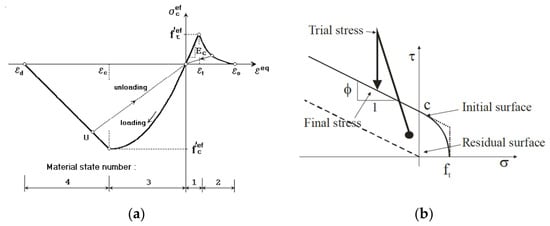
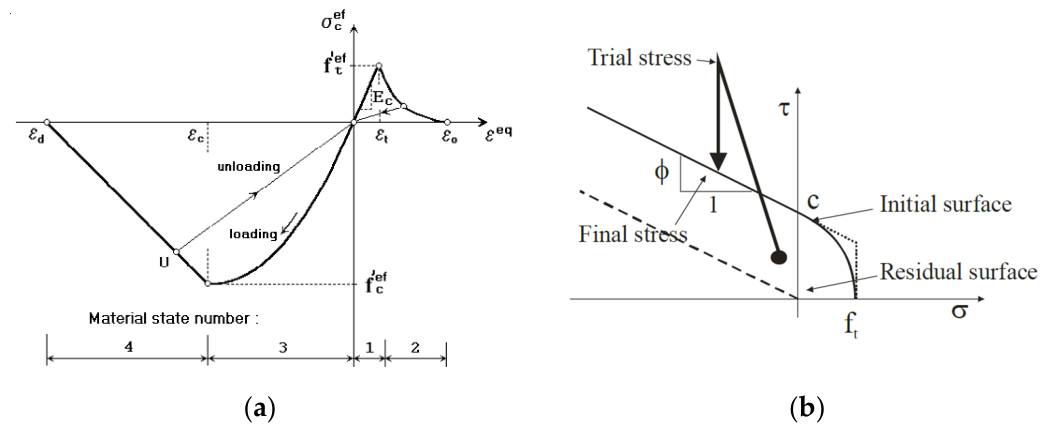
We conducted numerical simulations using the ATENA 3D (version 5.9.0) nonlinear finite element software. The constituents and their contact interfaces were modeled separately—following a micro-modeling approach—employing nonlinear material models. For brick and mortar, the applied fracture-plastic model uses Hordijk’s [7] exponential crack-opening law and a linear elastic behavior for tension. For compression, the model is governed by the nonlinear stress–strain relationship provided by the CEB-FIB Model Code 1990 [8] standard with a linear elastic decreasing branch [9] (see Figure 5). Such nonlinear models and their behavior under various loading conditions have been widely studied [10,11]. Tensile failure is governed by the Rankine failure criterion with exponential softening, while compressive plasticity is governed by the Menétrey-William failure surface [12] with the application of a smeared crack approach [13,14]. Contact elements were used for brick-mortar connections, allowing for load transfer, interface slip, and failure. Figure 6b illustrates the corresponding failure surface, which is based on the Mohr–Coulomb failure criterion.
Figure 6.
(a) Equivalent uniaxial stress–strain relationship; (b) brick–mortar interface failure surface [15].
3.2. Model Geometry and Boundary Conditions
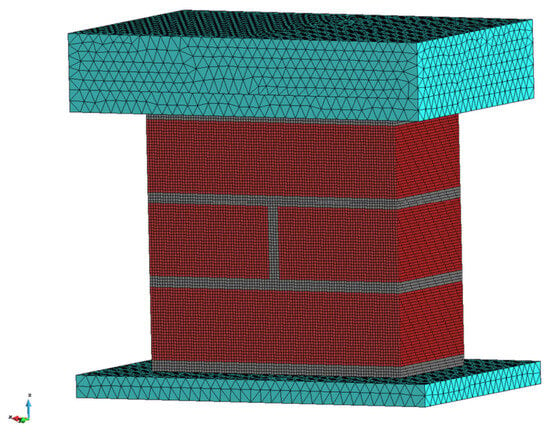
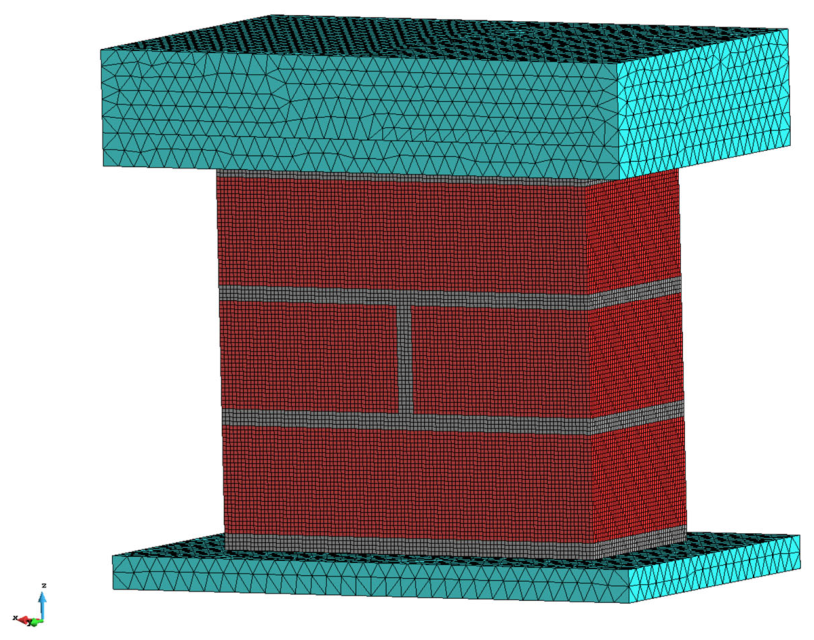
The modeled brick dimensions and mortar joint thicknesses were in accordance with the experimental specimens. On the upper and lower surfaces of the specimen, 20 mm thick panels were positioned with a 50 mm overhang on each side. These panels served to model the steel loading platens. To establish a physically accurate support configuration, the underside of the bottom plate was constrained in all three directions. Furthermore, the center point of the upper capping surface was constrained in the two horizontal directions. This allowed the loading plate to rotate as the load was applied. The loading was modeled as an incrementally increasing point load positioned on top of the upper steel plate at the midpoint. Consequently, preliminary simulations showed significant bending of the upper plate and uneven load distribution; therefore, we added a 50 mm thick secondary plate atop the primary plate to provide sufficient rigidity to evenly distribute the applied force (Figure 7).
Figure 7.
Model geometry and finite element mesh.
For discretization of the brick and mortar, structured solid 20-node hexahedral elements were used, whereas for the steel plates, 10-node tetrahedral finite elements were used. These elements include integration points at the edge midpoints. Quadratic shape functions were employed using the Newton-Raphson solver. The displacement-controlled loading was applied using an increment of 0.1 mm for all simulations. The total number of loading steps varied depending on the mortar strength used in the model to adequately capture the post-peak behavior.
3.3. Adopted Material Parameters
The constitutive material parameters for the finite element model were established with a combination of laboratory tests and values derived from published literature. The compressive strength values for both brick and mortar were determined from experimental tests, while other parameters—such as tensile strength, modulus of elasticity, fracture energy, and interface properties—were adopted based on the reported values measured by Fódi [5,6] for similar solid clay brick masonry. The adopted material parameters are listed in Table 2 for the brick and mortar, and in Table 3 for the contact interfaces.
Table 2.
Model material parameters—brick and mortar.
Table 3.
Model material parameters—contact interface.
4. Numerical Results and Comparison
4.1. Mesh Sensitivity Analysis
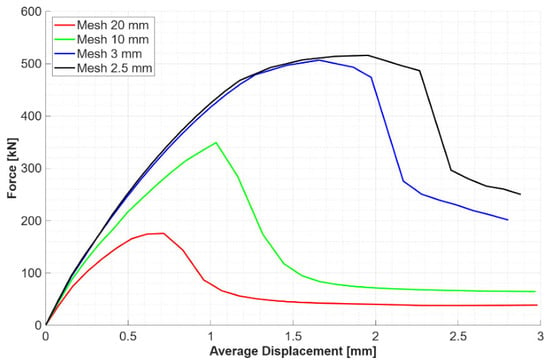
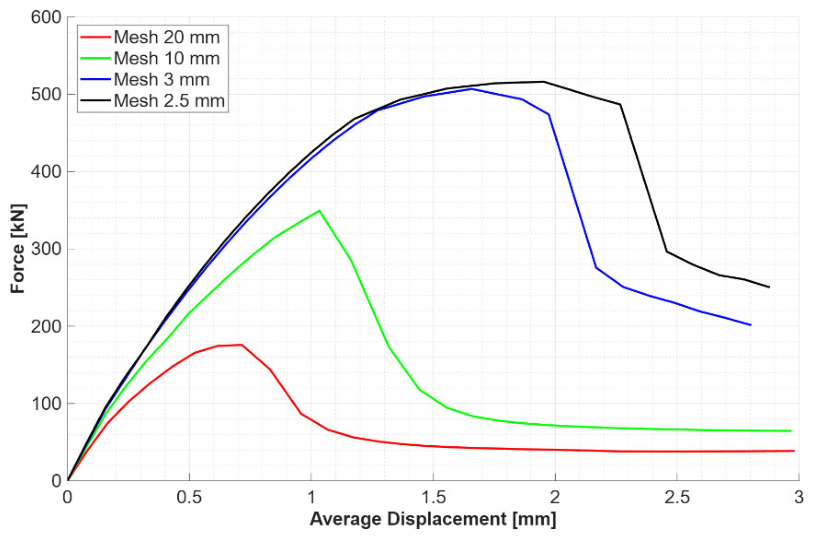
Following model development, the influence of mesh density was analyzed. Multiple simulations were performed, and the force–displacement diagrams for mesh densities of 20, 10, 3, and 2.5 mm are compared in Figure 8. The results showed a significant influence on load-bearing capacity and the displacement corresponding to the ultimate load. For the 20 mm mesh, the numerical model estimated an ultimate load of approximately 175 kN at a displacement of approximately 0.7 mm, whereas for the 2.5 mm mesh, this value was approximately 515 kN at a displacement of approximately 2 mm. Comparing the results of the 3 mm and 2.5 mm mesh sizes reveals that the ultimate load differed by less than 2%, while a deviation of approximately 15% was observed for the corresponding displacement. For subsequent analyses, a mesh density of 2.5 mm was applied.
Figure 8.
Influence of mesh density on the force–displacement behavior.
4.2. Global Behavior
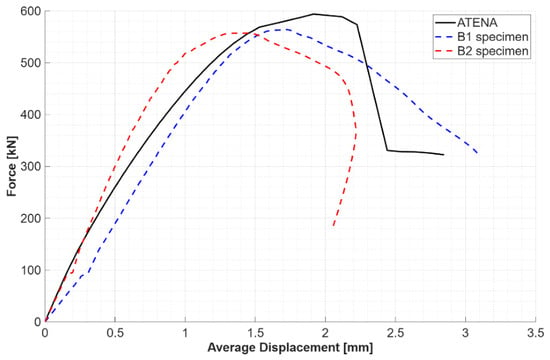
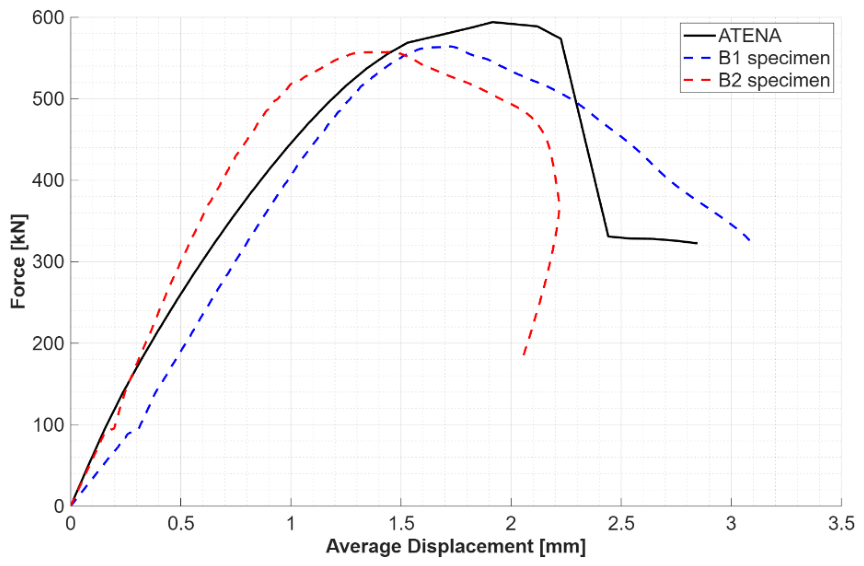
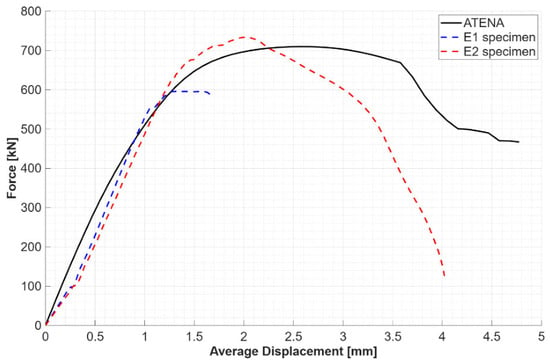
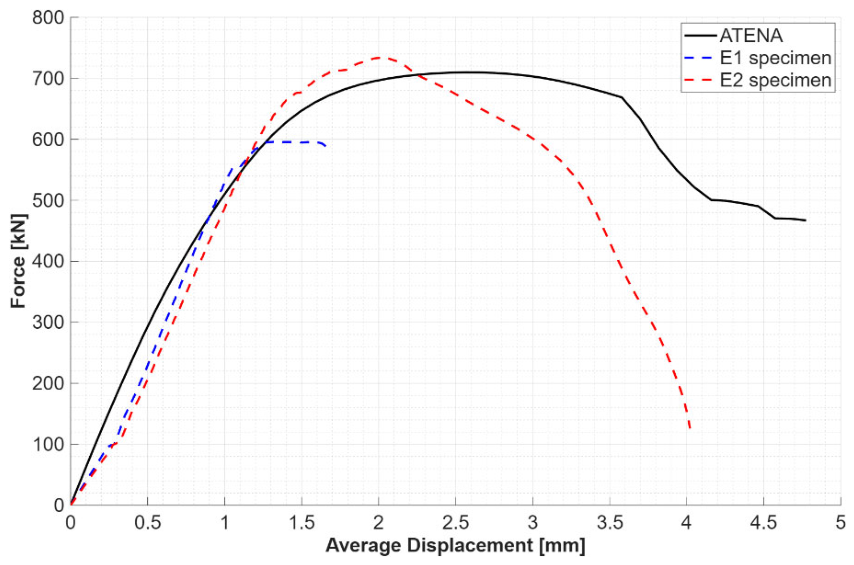
Two simulations were performed for mortar nominal compressive strengths of 2.5 MPa (M3) and 5 MPa (M5). Mortar compressive strengths (M3 and M5) were measured with a universal testing machine (Instron 5989, Norwood, USA) according to MSZ EN 1015-11, alongside laboratory tests on brick units. The measured values (see Table 4) were used to define the material parameters of the model. Displacements were monitored at the four top corners of the specimen at locations identical to those of the LVDTs used in the experiment. The resulting force–average displacement diagrams were compared with the corresponding experimental curves, as shown in Figure 9 and Figure 10. The numerical results are summarized in Table 5.
Table 4.
Material properties of mortar and brick.
Figure 9.
Numerical and experimental force–displacement diagrams for specimens with M3 mortar.
Figure 10.
Numerical and experimental force–displacement diagrams for specimens with M5 mortar.
Table 5.
Numerical results for specimens with M3 and M5 mortar.
In the initial elastic stage, the models show good agreement with the experiments in terms of stiffness and the transition point to nonlinear behavior. However, the numerical results show slight nonlinearity in the elastic stage prior to crack formation. For the M3 mortar specimen, the numerically estimated peak load shows a 5.9% deviation from the experimental average, whereas for the M5 mortar specimen this deviation is 6.8% (Table 6). For displacements at peak load, the numerical model exhibited a 20.1% deviation for the M3 mortar and a 60% deviation for the M5 mortar. In the post-peak regime, after the sudden drop in resistance, the model developed a residual load-bearing capacity with a magnitude of approximately 50–70% of the ultimate load. However, in the experimental tests, no residual capacity was observed, as the specimens underwent complete material disintegration after reaching failure.
Table 6.
Peak load and corresponding displacement values for specimens with mortar compressive strength of 2.5 MPa (M3) and 5 MPa (M5).
4.3. Failure Modes
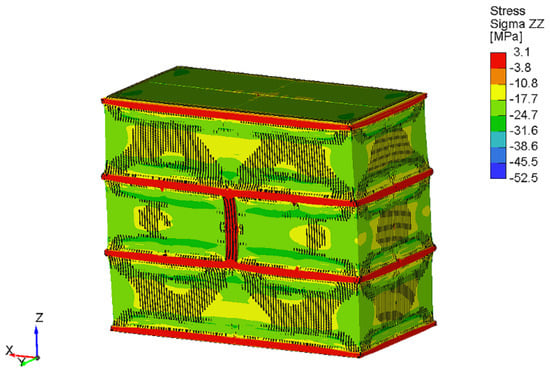
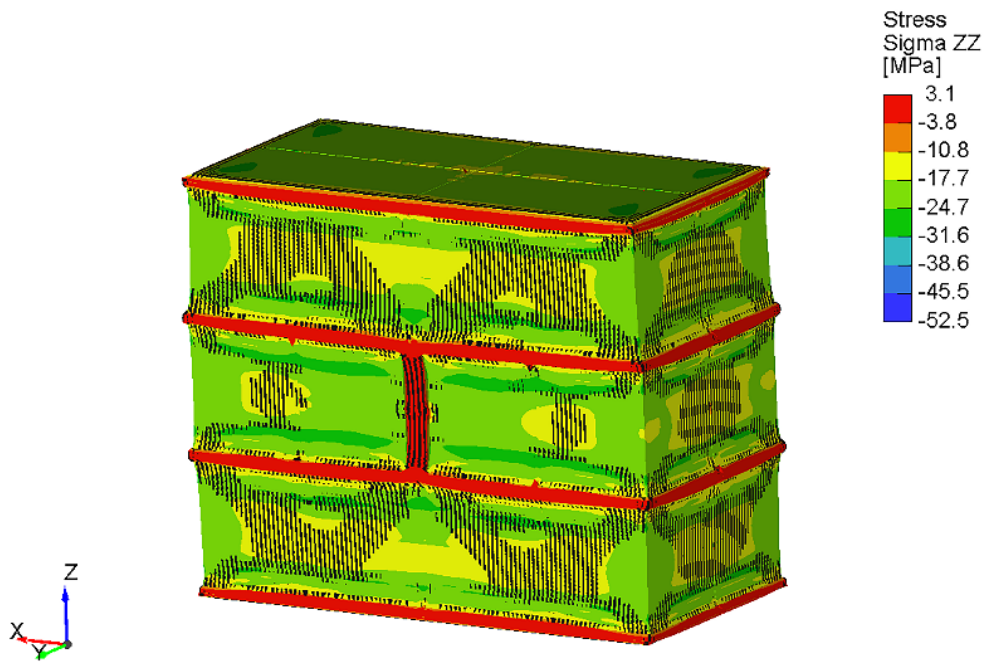
The model exhibited asymmetric deformation and crack formation, which was accompanied by rotations of the upper loading plate about both the X and Y horizontal axes. These rotations progressed continuously as the load increased. Asymmetrical failure developed regardless of mesh density and symmetry. Furthermore, up to peak load, the upper plate rotation rate remained approximately the same across all mesh sizes. However, in the post-peak regime, finer mesh sizes showed considerably larger rotations. Crack formation and stress distribution also showed slight asymmetry (Figure 11).
Figure 11.
Deformation and stress distribution at the peak load for specimen with M3 mortar.
5. Conclusions
This study presents and discusses an experimental testing method for small masonry specimens and a numerical micro-modeling framework. The three-course high specimens, built from solid, fired clay bricks, were compressed perpendicular to the bed joints until failure, and the force–displacement behavior was monitored. A nonlinear finite element model was developed in an identical setup, and the results were compared against the experimental data.
The mesh sensitivity analysis revealed that choosing an adequate finite element size is critical to the reliability of the numerical results. Larger mesh densities (e.g., 20 mm and 10 mm) significantly underestimated the ultimate load. Refining the mesh to 3 mm and 2.5 mm allowed the results to converge to a more accurate estimate of the physical behavior, indicating that a systematic parameter sensitivity analysis is recommended for future work. Regarding stiffness and load-bearing capacity, the numerical models showed good agreement—from an engineering standpoint—with the physical behavior, with the peak-load deviation below 7%. The displacement corresponding to the ultimate load displayed a higher deviation, either around 20% or 60%, depending on mortar strength. A further limitation of the model appeared with the estimation of a physically unrealistic residual strength in the post-peak regime.
With the proposed micro-level analysis method, the model was able to follow the physical behavior and asymmetric failure. Although the experimental dataset was limited to four specimens at the time of writing, the results demonstrate the capability of the approach. In future studies, the established numerical framework is intended to serve as the foundation for a reliable, virtual testing methodology. This approach can obtain specific, experimentally unmeasurable material parameters required to develop a more accurate macro-modeling method, with the utilization of complex failure criteria.
Author Contributions
Conceptualization, I.H. and T.S.F.; methodology, I.H. and T.S.F.; software, T.S.F.; validation T.S.F.; formal analysis, T.S.F.; investigation, T.S.F.; resources, T.S.F.; data curation, T.S.F.; writing—original draft preparation, T.S.F.; writing—review and editing, I.H. and T.S.F.; visualization, T.S.F.; supervision, I.H.; project administration, I.H. and T.S.F.; funding acquisition, I.H. and T.S.F. All authors have read and agreed to the published version of the manuscript.
Funding
The project supported by the Doctoral Excellence Fellowship Programme (DCEP) is funded by the National Research Development and Innovation Fund of the Ministry of Culture and Innovation and the Budapest University of Technology and Economics.
Data Availability Statement
The data supporting the findings of this study are available from the corresponding author upon request.
Acknowledgments
Technical support provided by the laboratory staff at the Szerkezetvizsgáló Laboratórium [Structural Testing Laboratory] at the Budapest University of Technology and Economics during the experimental phase of this study is gratefully acknowledged. During the preparation of this manuscript/study, the authors used Gemini 3.5 Flash, a large language model, to improve the English language and grammar of the paper. The authors have reviewed and edited the output and take full responsibility for the content of this publication.
Conflicts of Interest
The authors declare no conflicts of interest. The funders had no role in the design of the study; in the collection, analyses, or interpretation of data; in the writing of the manuscript; or in the decision to publish the results.
References
- Bagi, K.; Bojtár, I. Numerical Analysis of State-Changing Processes in Granular Assemblies. Period. Polytech. Civ. Eng. 1989, 33, 183–196. [Google Scholar]
- D’altri, A.M.; Sarhosis, V.; Milani, G.; Rots, J.; Cattari, S.; Lagomarsino, S.; Sacco, E.; Tralli, A.; Castellazzi, G.; Miranda, S.D. Modeling strategies for the computational analysis of unreinforced masonry structures. Arch. Comput. Methods Eng. 2020, 27, 1153–1185. [Google Scholar] [CrossRef] [Scilit]
- Cañas, A.C. Mechanical Characterisation of Masonry in Existing Structures by Means of Laboratory and In-Situ Experimental Techniques. Ph.D. Thesis, Universitat Politècnica de Catalunya, Barcelona, Spain, 2023. [Google Scholar] [CrossRef] [Scilit]
- Pelà, L.; Canella, E.; Aprile, A.; Roca, P. Compression Test of Masonry Core Samples Extracted from Existing Brickwork. Constr. Build. Mater. 2016, 119, 230–240. [Google Scholar] [CrossRef] [Scilit]
- Fódi, A. Effects influencing the compressive strength of a solid, fired clay brick. Period. Polytech. Civ. Eng. 2011, 55, 117–128. [Google Scholar] [CrossRef] [Scilit]
- Fódi, A. Experimental and Numerical Investigation of Reinforced and Plain Masonry Walls. Ph.D. Thesis, Budapest University of Technology and Economics, Budapest, Spain, 2011. [Google Scholar]
- Hordijk, D.A. Local Approach to Fatigue of Concrete. Ph.D. Thesis, Delft University of Technology, Delft, The Netherlands, 1991. [Google Scholar]
- Euro, C.C. International du Beton CEB-FIP Model Code 1990, First Draft; Emerald Publishing Limited: Leeds, UK, 2008. [Google Scholar]
- Van Mier, J.G.M. Multiaxial strain-softening of concrete. Mater. Struct. 1986, 19, 190–200. [Google Scholar] [CrossRef] [Scilit]
- Koris, K.; Bódi, I. Long-term analysis of bending moment resistance on pre-cast concrete beams. Period. Polytech. Civ. Eng. 2009, 53, 53–60. [Google Scholar] [CrossRef] [Scilit]
- Ther, P.P.; Sajtos, I. Historical Shear Experiments of RC Beams in Hungary and their Effect on Change of Shear Design. Period. Polytech. Civ. Eng. 2023, 67, 647–658. [Google Scholar] [CrossRef] [Scilit]
- Roszevák, Z. Numerical and Experimental Analyses of Different Cast-In-Situ Reinforced Concrete Connections Under Spatial Cyclic Loads. Ph.D. Thesis, Budapest University of Technology and Economics, Budapest, Hungary, 2023. [Google Scholar]
- Cervenka, V. Constitutive Model for Cracked Reinforced Concrete. ACI J. Proc. 1985, 82, 877–882. [Google Scholar] [CrossRef] [Scilit]
- Vecchio, F.J.; Collins, M.P. Modified Compression-Field Theory for Reinforced Concrete Beams Subjected to Shear. ACI J. Proc. 1986, 83, 219–231. [Google Scholar] [CrossRef] [Scilit]
- Červenka, V.; Jendele, L.; Červenka, J. ATENA Program Documentation Part 1, Theory; Červenka Consulting s.r.o: Prague, Czech Republic, 2022. [Google Scholar]

Disclaimer/Publisher’s Note: The statements, opinions and data contained in all publications are solely those of the individual author(s) and contributor(s) and not of MDPI and/or the editor(s). MDPI and/or the editor(s) disclaim responsibility for any injury to people or property resulting from any ideas, methods, instructions or products referred to in the content. |
© 2026 by the authors. Licensee MDPI, Basel, Switzerland. This article is an open access article distributed under the terms and conditions of the Creative Commons Attribution (CC BY) license.