


Abstract
Post-tensioned reinforcement can be used in different structural arrangements. Bonded internal tendons are usually grouted with cement mortar, whereas internal or external unbonded tendons use wax or grease. This selection significantly affects cracking, deflection development, and load-carrying capacity. An experimental programme—3 series of beams—investigated the structural behaviour of prestressed beams with or without bond under short- and long-term four-point bending tests. All 3 series had identical prestressing but different mild steel reinforcement. Series 1 had bonded prestressing and no mild reinforcement. Series 2 used unbonded prestressing without mild reinforcement. Series 3 combined unbonded prestressing with mild steel reinforcement, which guarantees reasonable crack distribution and improves structural performance.
1. Introduction
The aim of the experiment is to compare the influence of tendon bond on the behaviour of beams. The type of prestressing reinforcement in terms of bonding has a fundamental impact on the initiation and development of cracks. In elements reinforced with bonded tendons, the bond between the reinforcement and concrete leads to the formation of a higher number of smaller cracks. On the contrary, structures reinforced with unbonded tendons develop fewer cracks with larger widths; therefore, unbonded reinforcement cannot be considered for crack width control. Since the formation of large cracks after the loss of compression reserve is undesirable, unbonded systems are typically supplemented with bonded non-prestressed reinforcement, which can be designed to limit crack widths under a given load.
To evaluate these effects, three series of beams were designed:
- Series S01: Beams prestressed with bonded tendons (grouted with cement grout).
- Series S02: An extreme case reinforced only with unbonded tendons (grouted with viscous gel) without any additional bonded reinforcement. This configuration would not be feasible for real structural designs.
- Series S03: Beams reinforced with unbonded tendons (grouted with viscous gel) and supplemented with bonded mild steel reinforcement to ensure proper crack distribution.
All beams feature the same cross-sectional area of prestressing steel, and the same tendon profile geometry, and were prestressed with an identical initial prestressing force. Each series contained 4 identical beams [1,2].
Three beams from each series were subjected to short-term four-point bending tests until reaching the ultimate limit state and following collapse. From each series, one beam was selected for long-term testing. It was first loaded to the cracking point, and after 14 days, a permanent load was applied to monitor the long-term cracks and deflection development.
Short-term tests were conducted approximately 30 days after casting. The long-term load consisted of concrete blocks weighing 4.7 tonnes and it was applied 6 weeks after casting of the beams.
2. Description of the Beams
2.1. Materials
The beams were designed using concrete grade C35/45, with B500B reinforcing steel and Y1860S7-15.7 prestressing tendons. To ensure the accuracy of the structural analysis, the calculations incorporate the actual measured properties of the materials rather than just the nominal design values.
The compressive strength of the concrete was determined through cylindrical tests. The measured values for each series are as follows:
- Series S01: 45 MPa;
- Series S02: 46 MPa;
- Series S03: 49 MPa.
The tensile strength of the concrete was measured for the second and third variants, yielding the identical value of 2.5 MPa for both series.
For the structural calculations and analytical verification, the following characteristic values of steel were adopted: a characteristic yield strength of fyk = 500 MPa for the reinforcement and a characteristic tensile strength of fpk = 1860 MPa for the prestressing reinforcement [3].
2.2. Geometric Characteristics
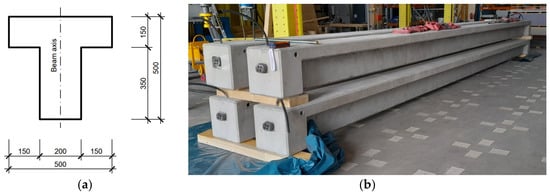
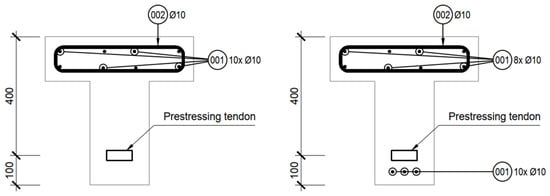
The test beams were designed with a span of L = 10.8 m. The cross-sectional dimensions were defined as follows:
- Section depth d = 0.5 m;
- Top flange width b = 0.5 m;
- Top flange thickness td = 0.15 m;
- Web thickness ts = 0.2 m.
The cross-sectional dimensions and the overall geometry of the T-section are detailed in Figure 1a, while the actual beams positioned in the laboratory environment prior to testing are displayed in Figure 1b.
Figure 1.
(a) Geometry of the T-section concrete beam; (b) Concrete beams prior to testing.
2.3. Design of the Beams
The beams were designed to ensure that the ultimate limit state could be reached within the maximum loading capacity of the testing equipment. Furthermore, the design allowed for the production of concrete blocks for long-term testing of a specific size, capable of inducing both the initiation and development of cracks.
The critical moment Mcr at the crack initiation limit was calculated for an effective cross-section unaffected by cracking, in which the tensile strength of concrete was considered. First, the position of the neutral axis x was determined from the equilibrium condition of forces acting on the cross-section, and subsequently the sectional characteristics of the ideal cross-section were calculated (moment of inertia Ii). The crack initiation moment Mcr was calculated according to Equation (1), including the acting normal stress due to prestressing in absolute value σP,bot and the tensile strength of concrete fctm [4].
The ultimate moment capacity of the individual beams was determined according to the theory of ultimate strains, including the initial stresses in the concrete cross-section and in the prestressing reinforcement. For concrete, the measured strength values were used (Section 2.1). A bilinear stress–strain diagram was adopted for concrete. For the prestressing reinforcement, tensile hardening was considered, with failure of the reinforcement occurring at a relative strain in the prestressing steel εuk = 20.0 ‰. The maximum stress in unbonded prestressing tendons was taken as the stress in the tendon after deduction of losses, increased by 100 MPa in accordance with Eurocode 2. The calculations were performed manually. Prestressing losses, including both short-term effects and long-term effects (creep, shrinkage, and relaxation), were calculated to find the effective prestressing force at the time of testing [5].
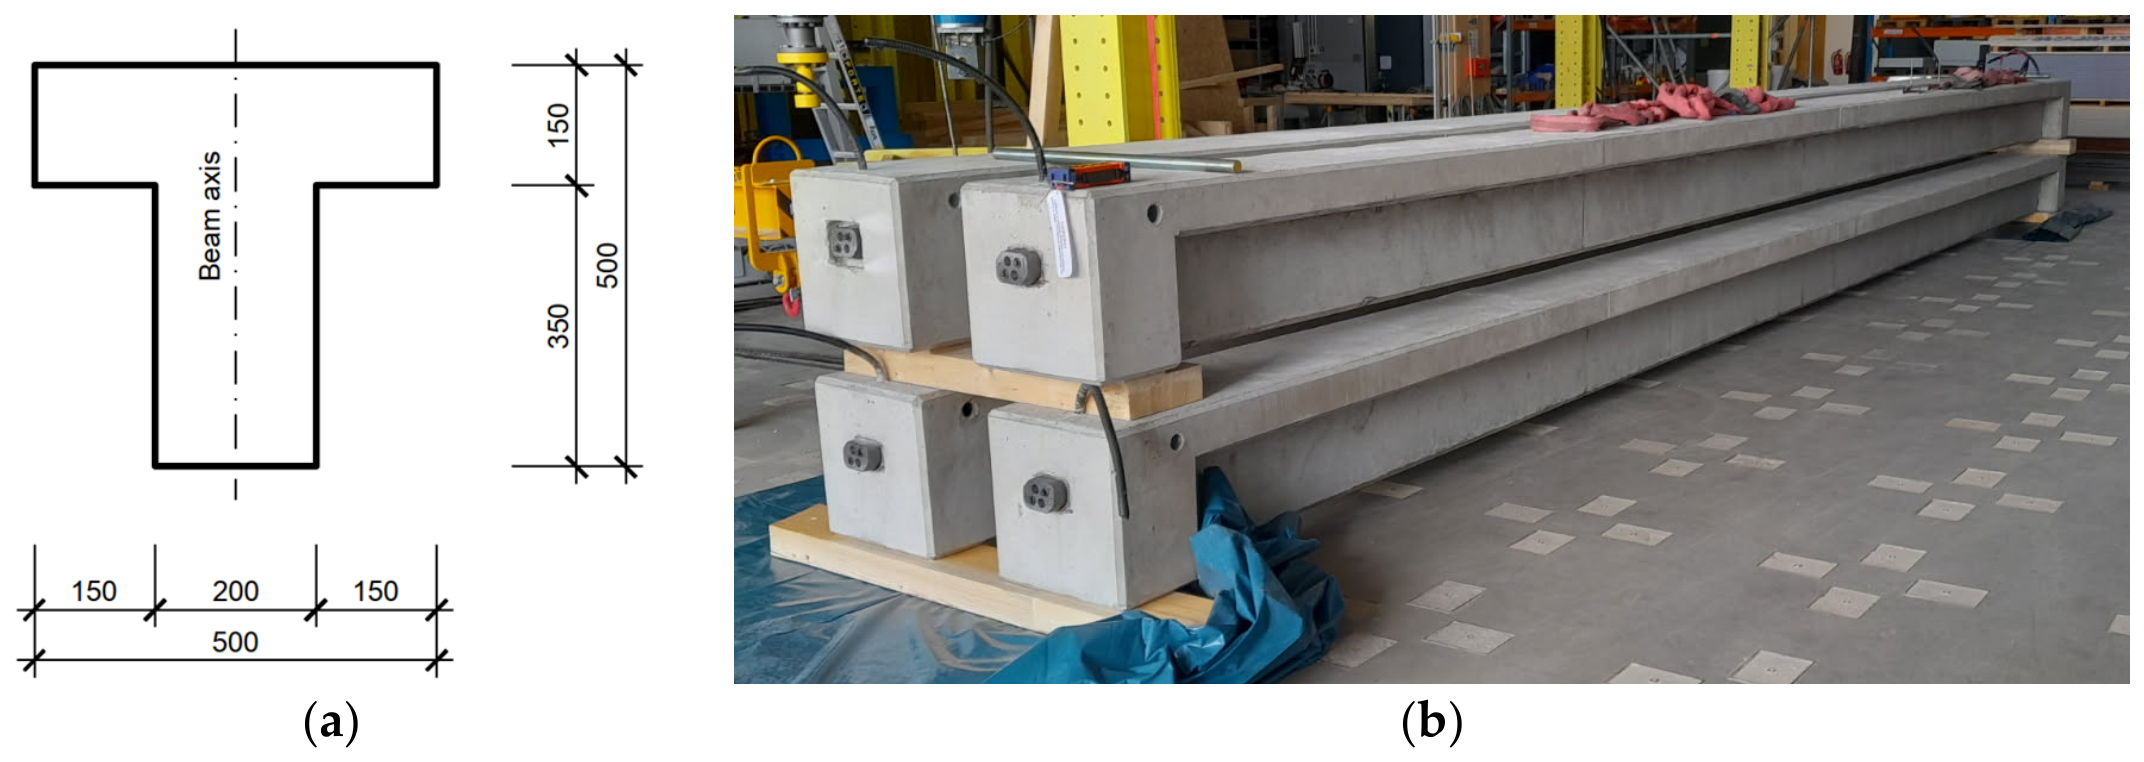
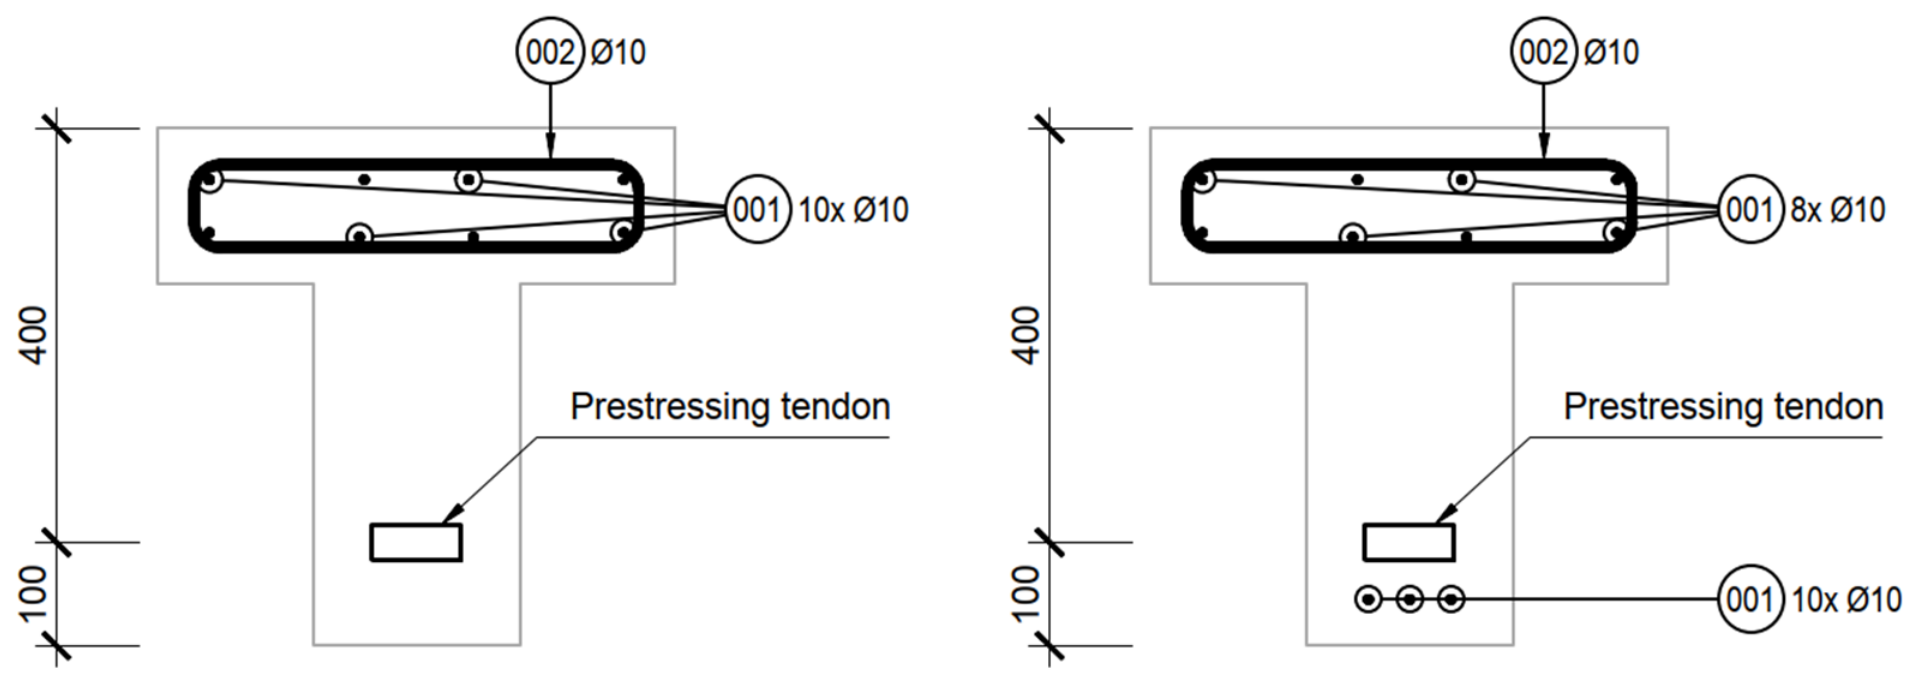
The prestressing reinforcement was designed as two strands (Ap1 = 150 mm2) with an initial stress of 1300 MPa after anchorage. The prestressing tendons are designed in the distance of 100 mm from the bottom fibres in the central part of the beams. In beams with unbonded tendons and with non-prestressed reinforcement, longitudinal reinforcement consisting of 3× Ø10 bars was designed at the bottom fibres. This reinforcement is designed to ensure that the crack width is appropriate for the given load level at the serviceability limit state (SLS) and is displayed in Figure 2.
Figure 2.
Reinforcement layout at mid-span—Series 1 and 2 (left), Series 3 (right).
3. Experimental Programme
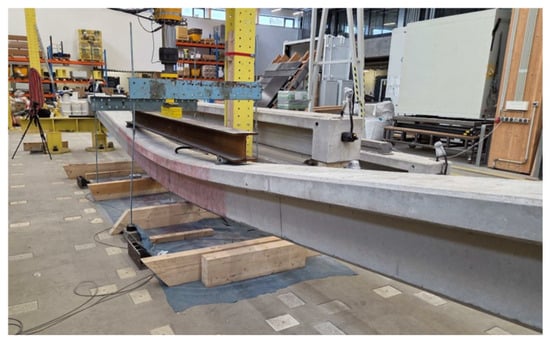
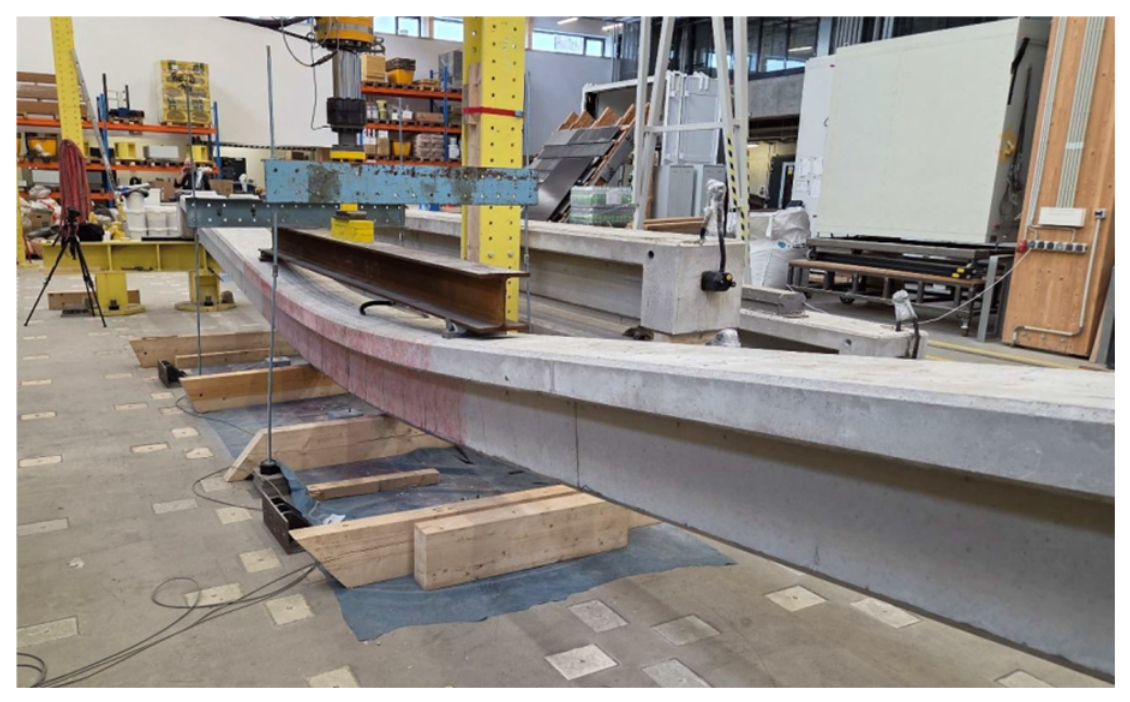
Within the short-term static testing, the response of prestressed concrete beams subjected to four-point bending was investigated under loads increasing continuously up to structural collapse. The experimental procedure comprised an initial loading cycle implemented approximately up to the cracking limit, followed by complete unloading and subsequent reloading (Figure 3) until the ultimate limit state was reached. Throughout the testing, deformation development, particularly beam deflection, was continuously recorded, while the initiation, width, and overall distribution of cracks within the pure bending region were closely monitored.
Figure 3.
The short-term static loading test conducted at the CTU UCEEB Experimental Centre.
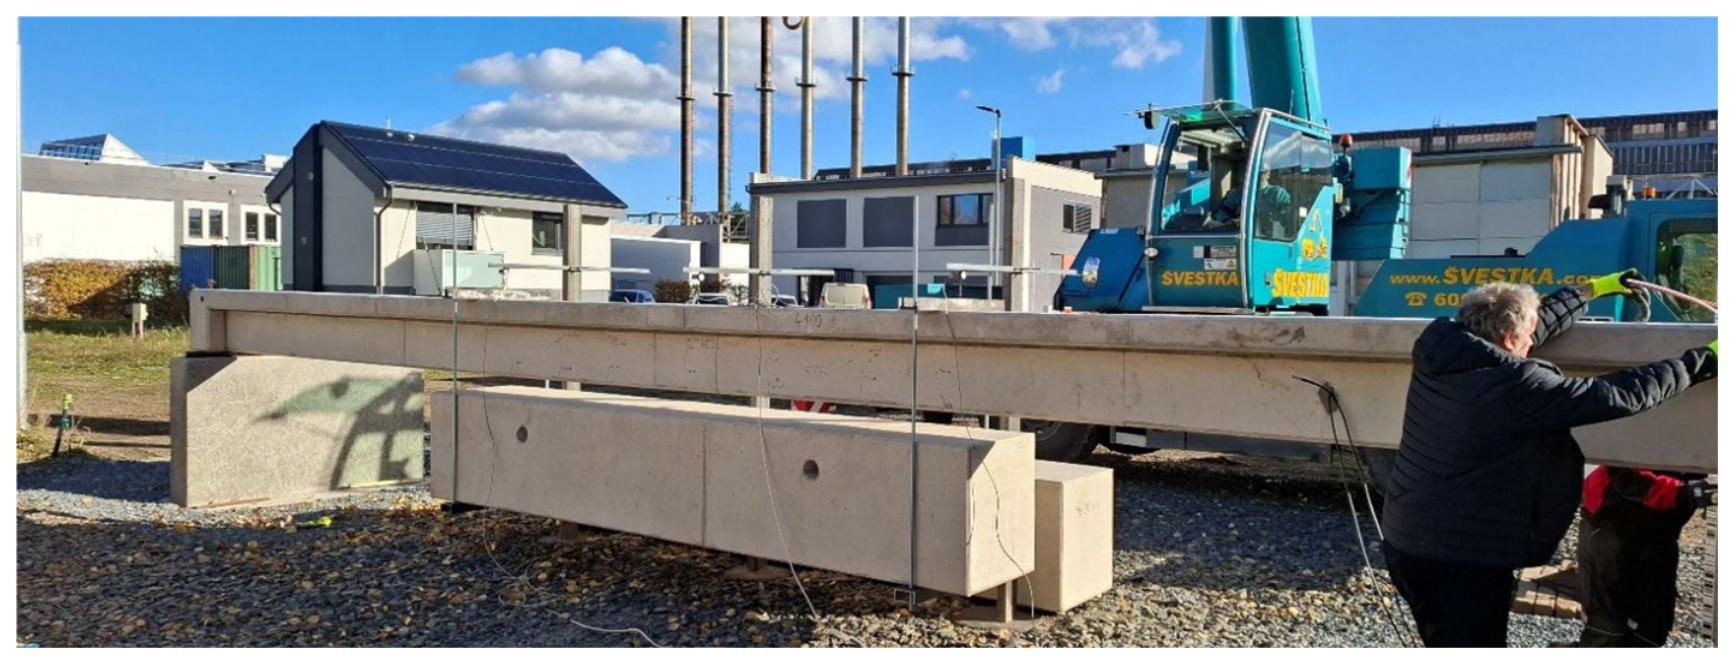
The long-term tests were designed to acquire experimental data for the verification of numerical models predicting time-dependent deflections. One beam from each series was initially loaded in laboratory conditions slightly beyond the cracking limit and subsequently unloaded. This controlled pre-cracking was intentionally performed to eliminate the theoretical uncertainty of whether the beams would reach the cracking limit solely under the effects of sustained service loads. Afterwards, the beams were transferred to an outdoor testing area and subjected to a constant long-term gravitational load of approximately 47 kN for a minimum duration of three years (Figure 4), during which long-term deflections are continuously registered.
Figure 4.
Long-term static loading test, suspended weights.
4. Calculations Methods
4.1. Crack Width and Crack Spacing
The calculation of the characteristic crack width wk and the maximum crack spacing sr,max was performed strictly according to the methodology in EN 1992-1-1 [5]. The calculation model accounts for the cross-sectional geometry, reinforcement layout, and bond properties in the concrete tension zone. It is important to note that this analytical procedure relies entirely on bond-slip mechanisms and therefore incorporates only bonded reinforcement (mild reinforcing steel or bonded prestressing tendons).
4.2. Deflections
To predict the deformation response of the beam, an advanced numerical analysis was implemented in compliance with the general section method and non-linear curvature integration outlined in EN 1992-1-1. The beam was longitudinally discretized into 12 identical segments. For each specific load level, the local cross-sectional curvature was evaluated from the extreme fibre strains within each segment, and the total mid-span deflection was subsequently obtained through the numerical integration of these curvature contributions along the member axis. The calculation accurately accounts for the intermediate stiffness state of the cracked sections by adopting the standard distribution coefficient. When the acting bending moment exceeded the cracking moment Mcr, the curvature was determined via interpolation between the uncracked state (State I) and the fully cracked state (State II). This approach explicitly incorporates the tension-stiffening effect, representing the structural contribution of the concrete in tension between cracks.
5. Results
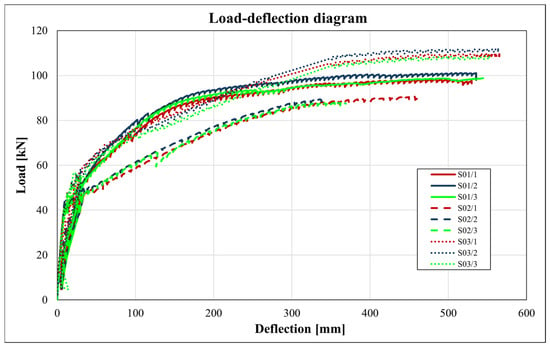
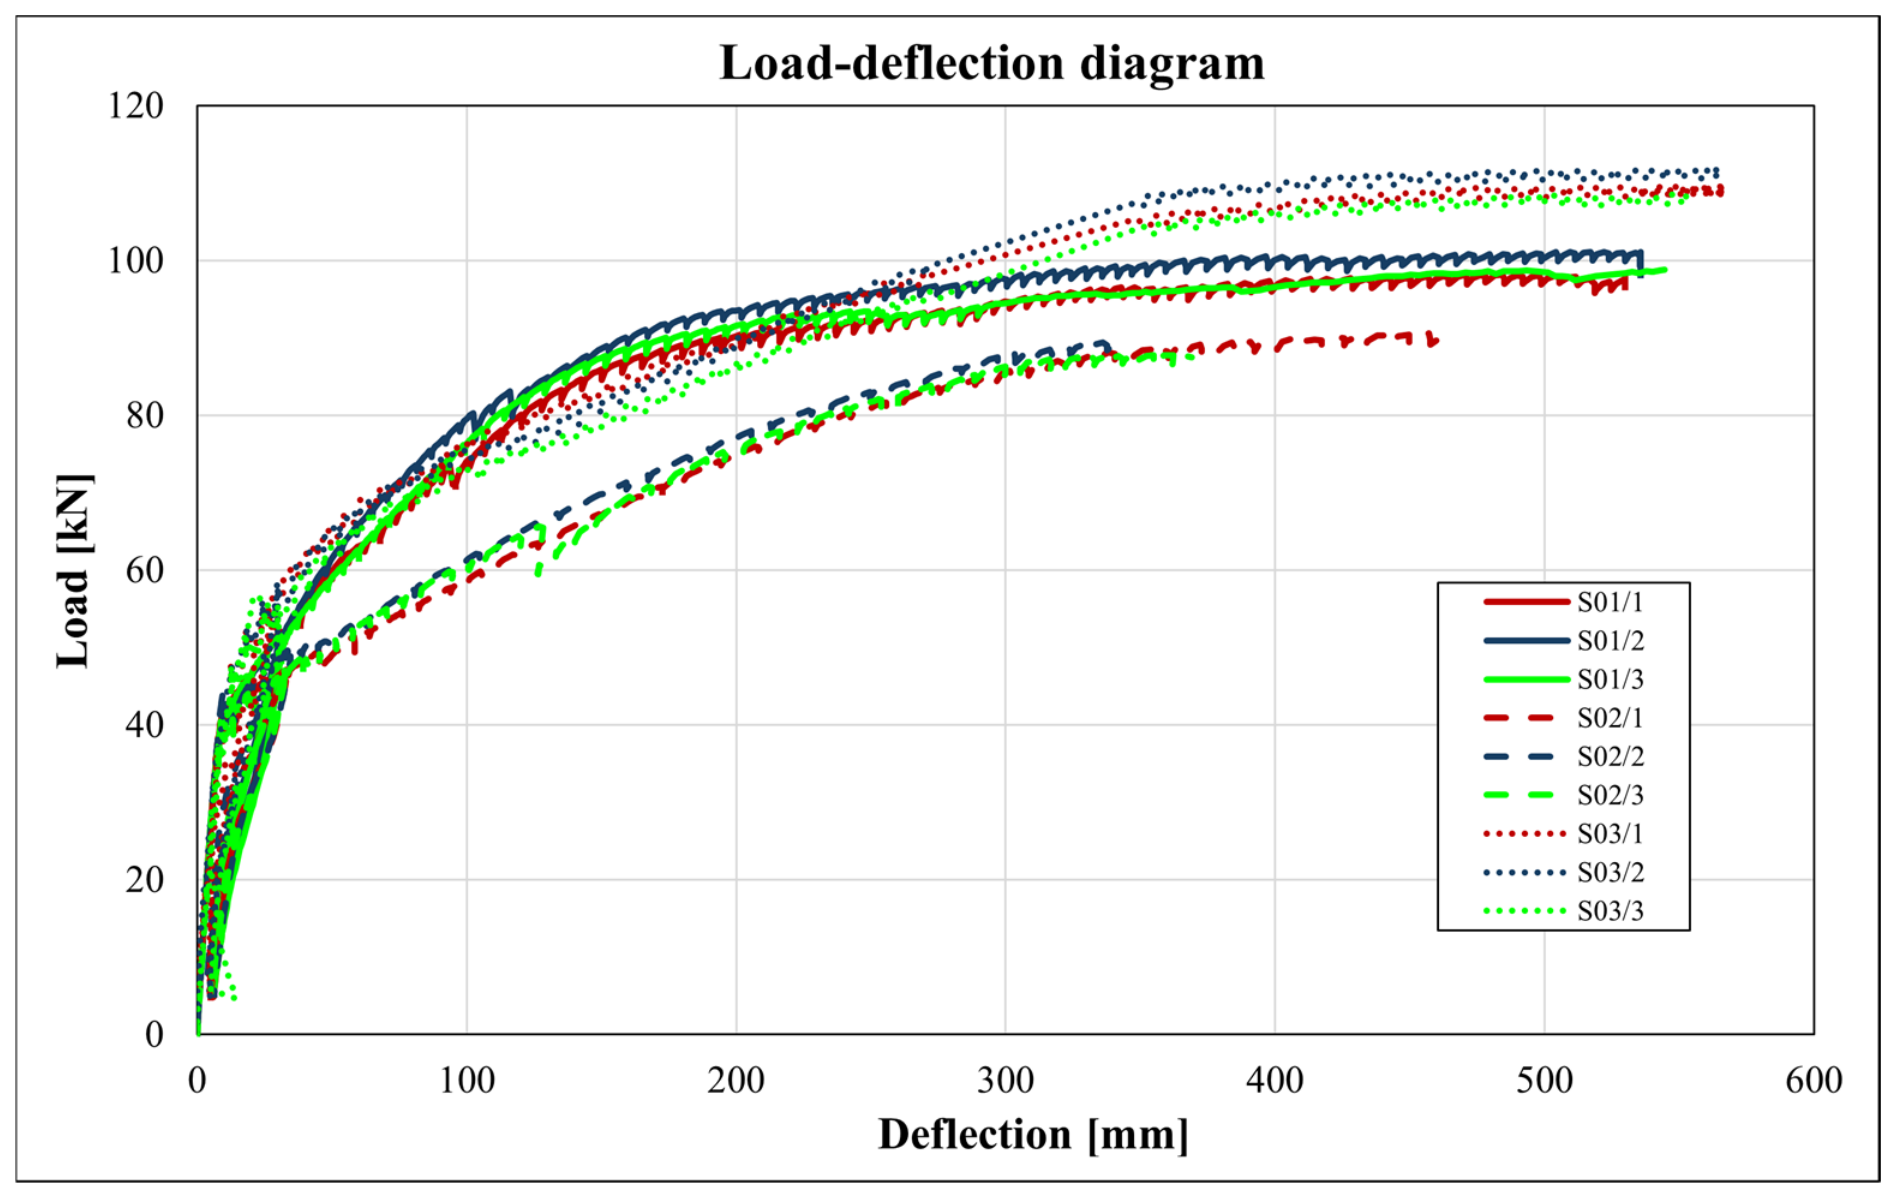
Figure 5 illustrates the load-deflection diagrams for all nine prestressed concrete beams tested under short-term static loading up to collapse. The highly consistent load–displacement paths within each series demonstrate a very low statistical scatter among the identical specimens. In the initial phase of loading, all beams exhibit a significantly high stiffness up to a load level of approximately 40 kN. Within this linear-elastic stage, the full concrete cross-section remains effective in compression, meaning that the cracking limit has not been reached and the internal reinforcement layout does not play a prominent role.
Figure 5.
Comparison of load–displacement diagrams for individual series.
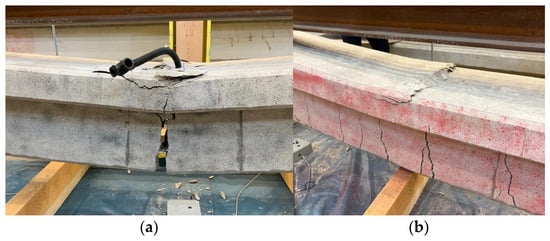
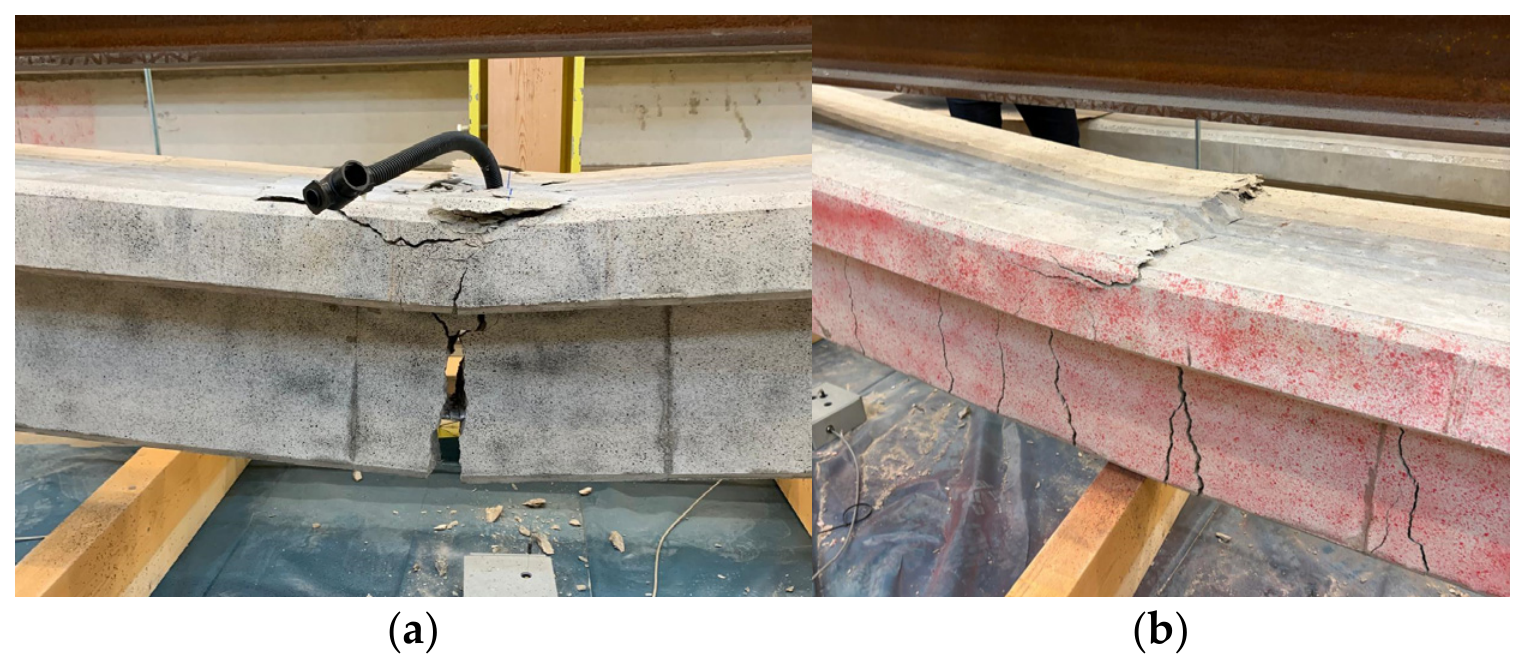
Following the formation of the first flexural cracks, the load-deflection behaviour begins to deviate substantially between the individual series. Series S01 (bonded tendons without mild steel) displays a continuous decrease in stiffness due to progressive cracking, ultimately failing at an average load of 97.0 kN while exhibiting severe deflections exceeding 500 mm. In contrast, Series S02 (unbonded tendons without mild steel) shows an abrupt loss of stiffness immediately after cracking, leading to a nearly linear behaviour followed by an early plastic collapse at the lowest load-bearing capacity of 89.7 kN and a significantly smaller mid-span deflection (average 350 mm). This premature failure is primarily caused by large crack widths that induce compression failure via concrete crushing due to high stress concentration near the top surface before the reinforcement can yield.
The best structural performance is observed in Series S03, which combines unbonded prestressing tendons with supplementary bonded mild steel reinforcement. Immediately after the cracking limit is exceeded, Series S03 exhibits the least reduction in stiffness, followed by an extended plastic plateau. These specimens achieved the highest ultimate load-bearing capacity at an average force of 110.3 kN and the greatest ultimate mid-span deflection at collapse, reaching approximately 560 mm. Interestingly, while Series S01 shows a slightly more efficient load response at a specific intermediate stage of loading, the experimental outcomes explicitly confirm that the presence of conventional mild steel reinforcement effectively counterbalances the missing bond of the post-tensioned tendons by ensuring proper crack distribution, thereby optimizing both the ultimate strength and ductility of the structure.
Table 1 presents the crack development for each individual series. The load at the origin of the first crack is a mean value measured on the 3 identical beams. The crack width in Table 1 (col. 3 and 4) shows the maximum crack width of all three beams of the series. The initiation of the first crack was observed visually during the tests. This method introduces a degree of uncertainty, further compounded by the inherent statistical variability of concrete properties, which resulted in relatively significant differences in the cracking loads. The observed crack behaviour confirms that the bond between the reinforcement and the concrete is a decisive factor in controlling crack spacing and width. While Series S01 (bonded tendons) relies solely on the bond of the prestressing steel to limit crack widths, Series S02 (unbonded tendons) lacks this mechanism, leading to larger, more widely spaced cracks that compromise the effective crack control under serviceability limit state (SLS) conditions. In Series S03, the inclusion of mild steel reinforcement compensates for the lack of tendon bond, as the mild reinforcement effectively governs the crack pattern through superior bond characteristics, consistent with the principles of crack width control for prestressed structures where unbonded systems are employed.
Table 1.
Crack development for individual series.
The results presented in Table 1 also confirm the trends regarding the average crack spacing, which are summarized in Table 2. The crack spacings in Table 2 represent mean values measured in the central area of all three beams of the series. In Series S02, where the cracks are widest, the crack spacing is also at its maximum. Conversely, in Series S03, where the crack widths are smallest, the corresponding crack spacing is minimized.
Table 2.
Average crack spacing.
Table 3 provides a comparison between the experimentally measured crack widths and crack spacing and those calculated in accordance with the Eurocode 2 in dependence on the deflection u. It is evident that at lower load levels, the calculated and measured values show closer agreement.
Table 3.
Calculated crack width and crack spacing.
The measured crack widths are larger than the calculated values, which shows that the Eurocode underestimates the crack widths. The crack spacing depends on the type of reinforcement. When only bonded prestressed reinforcement is applied, the calculated crack spacing is slightly larger than that which was measured, while when mild reinforcement is applied, the calculated crack spacing is significantly smaller than that which was measured.
Crack width at Series S02, where there is no bonded reinforcement, cannot be calculated according to the Eurocode. The calculation method is based on the bond of reinforcement, which is not applicable in the case of the Series S02.
Table 4 provides a comparison between the calculated deflections and those measured experimentally at corresponding load levels. For the elastic analysis considering the gross cross-section, the calculated values show good agreement with the experimental results. Conversely, when the plastic behaviour of cracked concrete is considered, the calculated deflections are lower than those observed experimentally. However, this result is consistent with the assumptions, since the deflection analysis is intended for serviceability limit states (approximately 50% of the ultimate load) and not for capturing the plastic behaviour of materials near the ultimate limit state.
Table 4.
Calculated deflection.
In all series, the collapse was caused by concrete crushing, which represents a compression failure of the concrete. Figure 6 illustrates the beam’s failure.
Figure 6.
(a) Failure of Series S02; (b) failure of Series S03.
The ultimate limit state was calculated for each series. A simple approach according to the Eurocode was applied; however, the measured strength of concrete and the characteristic strength of steel were used. For Series S01, the calculated moment of resistance was MRd,S01 = 209.3 kNm, which corresponds to a hydraulic cylinder force of FS01 = 86.9 kN. The average measured force at failure was FS01 = 97.0 kN. For Series S02, the calculated moment was MRd,S02 = 162.0 kNm with a corresponding force of FS02 = 60.6 kN, while the average measured force was FS02 = 89.7 kN. For Series S03, the calculated moment of resistance was MRd,S03 = 210.0 kNm, corresponding to a force of FS03 = 87.3 kN; the average measured force at the point of concrete failure was FS03 = 110.3 kN. The results show that the load at the first crack was estimated by a simple analysis rather accurately; the ultimate load was significantly underestimated by a simple analysis, in the case of Series 2, in particular.
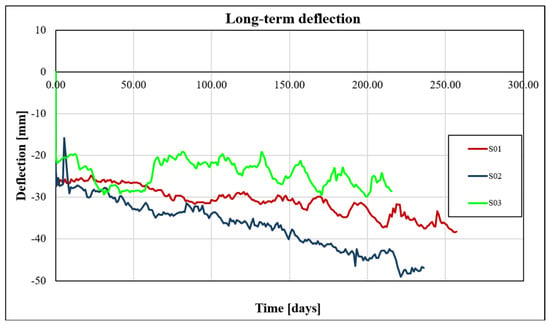
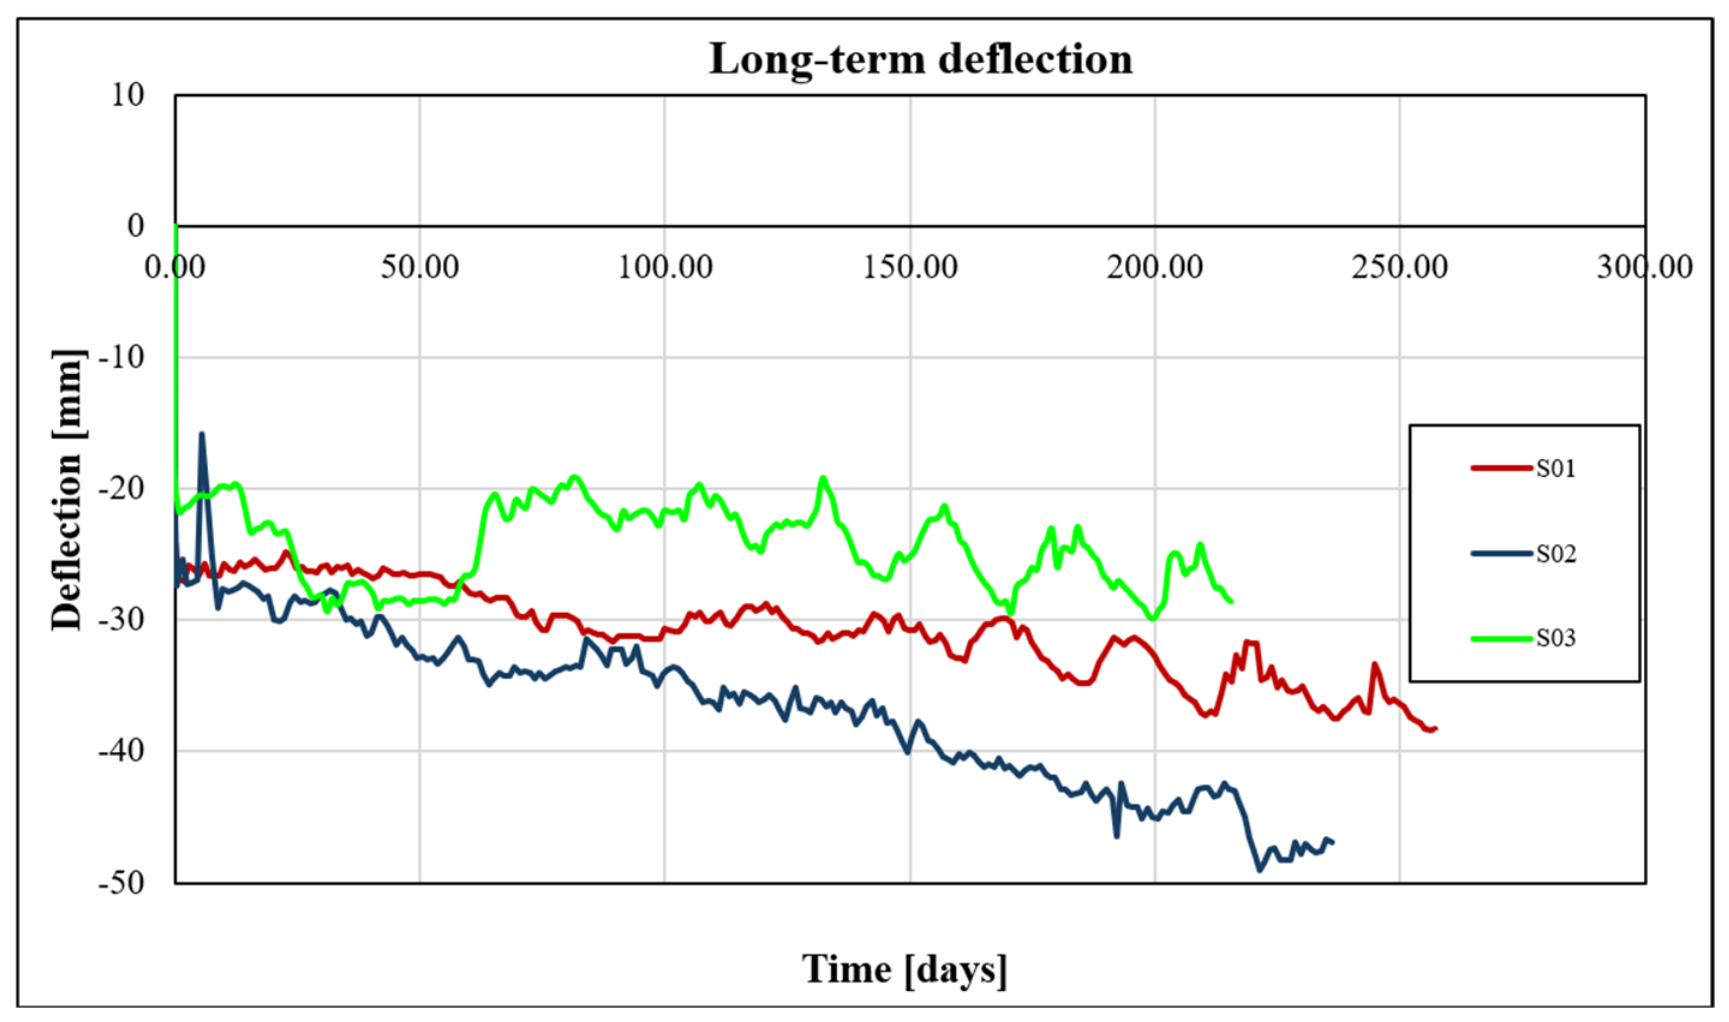
Figure 7 displays a graph illustrating the initial development of long-term deflections in time for individual beams. The age of concrete is designated on the horizontal axis. The beams of individual series were subsequently loaded at different times, but at the same age of concrete. Therefore, the effects of variable temperature and moisture appear in different parts of the curves, since all three beams are located in an open outdoor environment. The beam from Series S02 exhibits the highest deflection values from the very beginning of the loading period. For all series, a clear increase in deflection over time is evident. Additional evaluation is necessary to assess the climatic loads on the deflections of the beams.
Figure 7.
Development of long-term deflection over time.
6. Conclusions
In all tested series, prestressing tendons with two strands with identical prestressing levels were designed, differing only in their bond conditions. Series S03 was further supplemented with non-prestressed reinforcement.
When comparing crack spacings, the expected results were confirmed. The largest crack spacing was observed in the beams of Series S02; the bond of prestressed steel contributed to a reduction in the crack spacing (Series S01) but the application of mild reinforcement resulted in a significant reduction in the crack spacing (more than 50%). It clearly demonstrates that mild steel reinforcement is always necessary to ensure optimal crack distribution. In Series S02, only a small number of cracks with large widths formed. This indicates that current cracks open significantly before a subsequent crack can initiate.
Due to the bond effects in Series S01 and S03, cracks form uniformly with small increments in force. The primary difference between these series lies in the absence of mild steel reinforcement in S01, resulting in a smaller overall reinforcement area.
In Series S02, collapse occurred during a steady increase in the loading force, suggesting that the reinforcement did not reach a plastic state. This is likely because the large crack widths caused premature concrete crushing in the compression zone.
The greatest discrepancy between the calculated load-bearing capacity and the values achieved during testing was observed in Series S03. This is because, according to Eurocode, the calculation of cross-sectional capacity with unbonded tendons assumes a stress increase in the tendon of only 100 MPa. This does not reflect reality, as the stress in the tendon increases significantly more due to the large deflection of the beam close to failure.
Based on the results, Series S03 (unbonded tendons with supplementary mild steel reinforcement) appears to be the most optimal design among those which were tested. However, in a real-world design, a design with bonded tendons would also include mild steel reinforcement, and such a configuration would likely achieve the highest load-bearing capacity and the smallest crack widths.
The initial findings from this experiment can be utilized in the design of prestressed concrete structures with respect to their durability and safety. Furthermore, the experiment has contributed to a better understanding of how the bond of prestressing reinforcement influences the initiation and propagation of cracks. The long-term tests will continue and both short-term and long-term tests will be evaluated in more detail, and experimental results will be compared with the results of different numerical analyses.
The study confirmed that the beams with unbonded prestressed tendons with sufficient mild reinforcement exhibit favourable performance. If the amount of prestressed reinforcement is specified, the amount of mild reinforcement should be designed on the basis of two criteria. 1. The crack width in the serviceability limit state should satisfy the code requirements and 2. The ultimate load-carrying capacity condition must be satisfied.
Author Contributions
Concept of the research, J.L.V., Evaluation of experiments and analysis, T.V. All authors have read and agreed to the published version of the manuscript.
Funding
Technological Agency of the Czech Republic (Project No. TS01030114 Quality Management System for the Construction of New Nuclear Power Sources under local conditions in the Czech Republic).
Informed Consent Statement
Not applicable.
Data Availability Statement
In case of interest, the authors provide the required data, if possible.
Acknowledgments
The support of the Technological Agency of the Czech Republic is gratefully acknowledged.
Conflicts of Interest
Author Jan L. Vítek was employed by the company Metrostav CZ, s.r.o. The remaining authors declare that the research was conducted in the absence of any commercial or financial relationships that could be construed as a potential conflict of interest.
References
- EN 1991-1-1; Eurocode 1: Actions on Structures—Part 1-1: General Actions—Densities, Self-Weight, Imposed Loads for Buildings. CEN: Brussels, Belgium, 2006.
- EN 1992-1-1; Eurocode 2: Design of Concrete Structures—Part 1-1: General Rules and Rules for Buildings. CEN: Brussels, Belgium, 2006.
- EN 1990; Eurocode: Basis of Structural Design. CEN: Brussels, Belgium, 2011.
- Bílý, P. Examples of Designing Reinforced Concrete Structures According to the Second Generation of Eurocode; Czech Technical University in Prague: Prague, Czech Republic, 2025. (In Czech) [Google Scholar]
- EN 1992-2; Eurocode 2: Design of Concrete Structures—Part 2: Concrete Bridges—Design and Detailing Rules. CEN: Brussels, Belgium, 2007.


Disclaimer/Publisher’s Note: The statements, opinions and data contained in all publications are solely those of the individual author(s) and contributor(s) and not of MDPI and/or the editor(s). MDPI and/or the editor(s) disclaim responsibility for any injury to people or property resulting from any ideas, methods, instructions or products referred to in the content. |
© 2026 by the authors. Licensee MDPI, Basel, Switzerland. This article is an open access article distributed under the terms and conditions of the Creative Commons Attribution (CC BY) license.