


Abstract
Thermoradiative diodes (TRDs) generate electrical power by emitting infrared radiation toward a cold radiative sink, making them promising for nighttime energy harvesting. TRD performance is evaluated under realistic atmospheric conditions using two radiative transfer models—Line-By-Line (LBLRTM) and Rapid Radiative Transfer Model for GCMs (RRTMG)—driven by ERA5 reanalysis data. The models agree within 5.43% at the surface, confirming RRTMG as a reliable and computationally efficient alternative for large-scale studies. A sensitivity analysis covers altitude, column water vapour (CWV), cloud cover, aerosol optical properties, tropospheric lapse rate, and CO2 concentration. CWV and low-level cloud cover are the primary limiting factors: stratus clouds at 40% fractional cover reduce TRD output by ≈90%, while increasing altitude from sea level to 5 km yields a ≈15-fold power increase. Absorbing soot aerosols raises the effective sky temperature and reduces TRD performance more than scattering sulphate aerosols. Dry, high-altitude, and extra-terrestrial environments are found to be the most favourable for TRD deployment.
1. Introduction
The Earth’s surface (≈290 K [1]) continuously emits longwave infrared radiation toward outer space at ≈2.7 K [2]. Thermoradiative diodes (TRDs) exploit this gradient by emitting mid-infrared photons toward a colder sink and extracting electrical work through “negative luminescence” [3,4,5]. Unlike photovoltaic cells, TRDs operate through net photon emission.
Early theoretical studies predicted strong performance: Santhanam and Fan [6] re-ported a Carnot-limit power density of 48.4 W m−2, and Hsu et al. [7] predicted efficiencies near 20.4% with outputs up to 327 W m−2 for an ideal InSb device. Experimental performance remains significantly lower; the HgCdTe prototype of Sazzad et al. [4] produced only 2.26 mW m−2 at a 12.5 °C temperature difference, and Wang et al. [8] confirmed the reversed I–V characteristics of TRDs. Under clear-sky conditions, the effective sky temperature is ≈200 K rather than 2.7 K, limiting realistic power to 0.34–6.5 W m−2 [3].
This work presents a multi-parameter atmospheric analysis using LBLRTM and RRTMG driven by ERA5 data, examining the impact of altitude, CWV, cloud type and fraction, aerosol loading, tropospheric lapse rate, seasonal variation, and CO2 concentration on TRD performance.
2. Methodology
2.1. Radiative Transfer Models and Atmospheric Data
LBLRTM [9] computes high-resolution spectral radiance using detailed molecular line parameters and is used as the high-fidelity reference. Alvarado et al. [10] validated LBLRTM version12.1 against 120 nighttime IASI spectra, reporting mean temperature-profile residuals of ≈0.5 K up to 10 hPa. RRTMG [11,12] applies the correlated-k method across ≈14 longwave and 16 shortwave bands, with reported longwave accuracy ≤ 1.0 W m−2 total flux error and ≤0.07 K day−1 tropospheric heating-rate error. Cloud and aerosol effects are handled via the Monte Carlo Independent Column Approximation (MCICA) [13].
Atmospheric profiles (temperature, specific humidity, ozone, and cloud fraction) are taken from ERA5 reanalysis at 37 pressure levels. The net TRD power output is:
where and is obtained from the radiative transfer models. The effective sky temperature is:
2.2. Model Cross-Validation
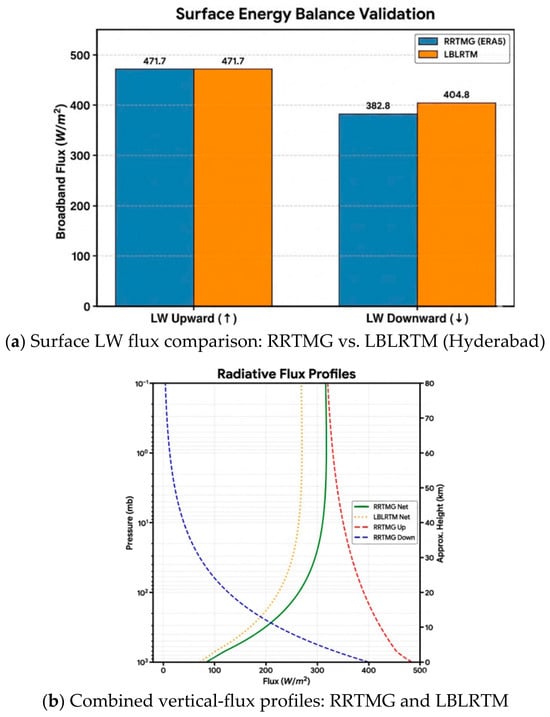
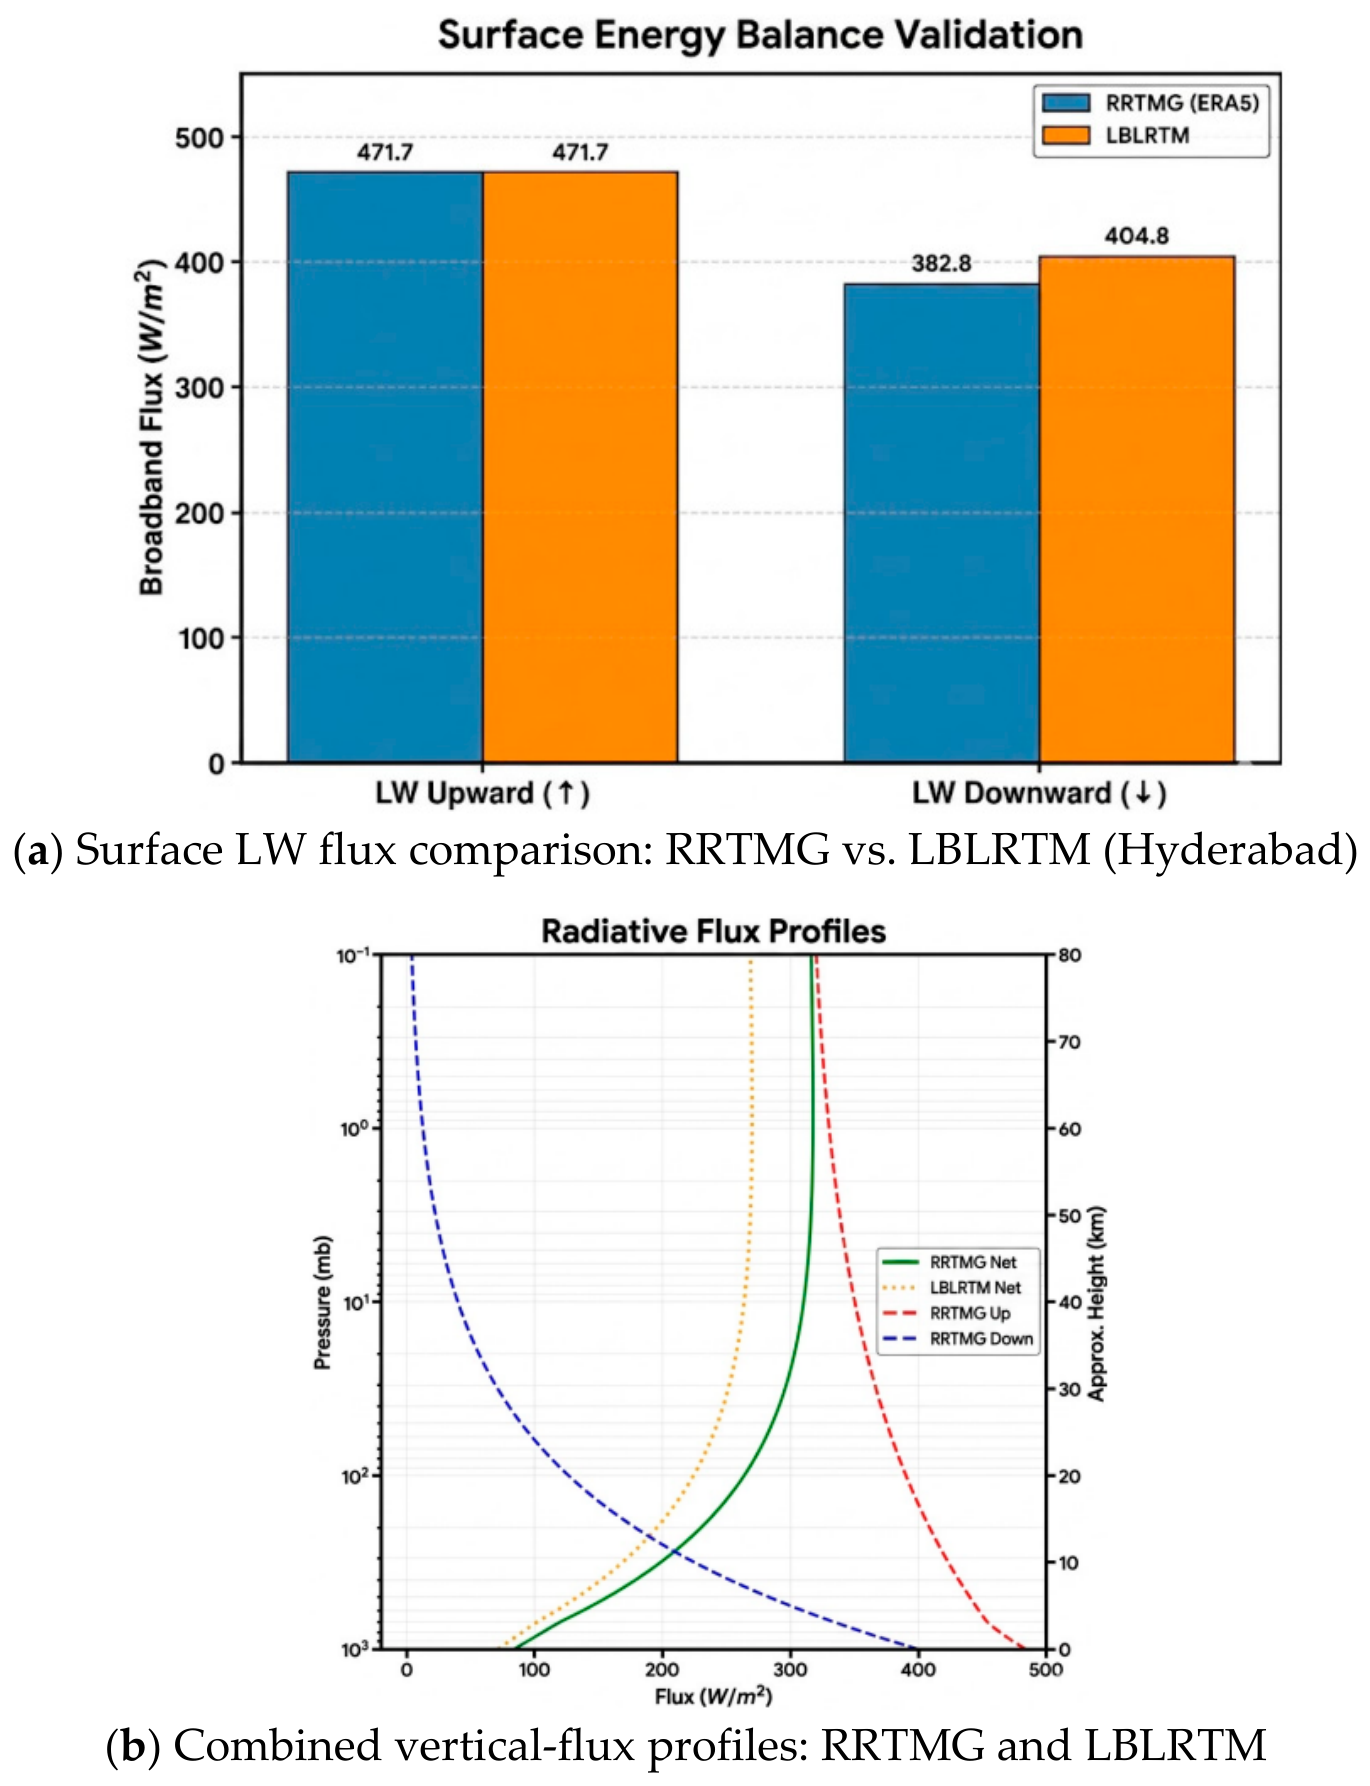
For a Hyderabad ERA5 profile, both models yield identical upwelling flux (471.7 W m−2). For downwelling flux, RRTMG gives 382.8 W m−2 versus LBLRTM’s 404.8 W m−2:
The discrepancy stems from broadband treatment of the water-vapour continuum in RRTMG [9]. Both models agree within 15–22% through most of the troposphere, with deviations up to ≈30% near the surface where net flux is the difference in two large opposing terms. Overall trend and gradient are maintained, confirming RRTMG as a faster alternative for parametric studies.
2.3. Aerosol Optical Property Computation
Aerosol single-particle optical properties are computed via Mie theory (PyMieScatt) following the OPAC framework [14,15]:
These are integrated over a lognormal size distribution to obtain bulk extinction σext and scattering σsca coefficients, giving single-scattering albedo ω0 = σsca/σext and asymmetry parameter g = ⟨cos θ⟩. Hygroscopic growth is included as r = rdry(1 − RH/100)−1/3, and layer-wise aerosol optical depth is computed to conserve a prescribed column aerosol optical depth (τtotal = 0.2) via a surface-weighted vertical profile. The resulting (τ, ω0, g) values are passed to RRTMG-LW/SW via MCICA.
3. Results and Discussion
3.1. Model Validation and Altitude Effects
Figure 1 shows surface and vertical flux agreement between LBLRTM and RRTMG.
Figure 1.
Model validation for the Hyderabad ERA5 profile: (a) surface LW fluxes and (b) vertical radiative flux profiles.
ERA5 profiles truncated at 700 hPa (≈3 km) and 500 hPa (≈5 km) represent higher-altitude cases; removing moisture-laden lower layers reduces downwelling longwave radiation, increasing net radiative cooling. As shown in Table 1, power increases from 0.8 W m−2 at sea level to 12.3 W m−2 at 5 km (≈15-fold), driven by reduced atmospheric optical depth and lower Tsky.
Table 1.
TRD power vs. altitude (LBLRTM, Hyderabad profile).
3.2. Effects of Water Vapour and Cloud Cover
Column water vapour (CWV) is varied by scaling the ERA5 specific-humidity profile for Mumbai at fixed temperature:
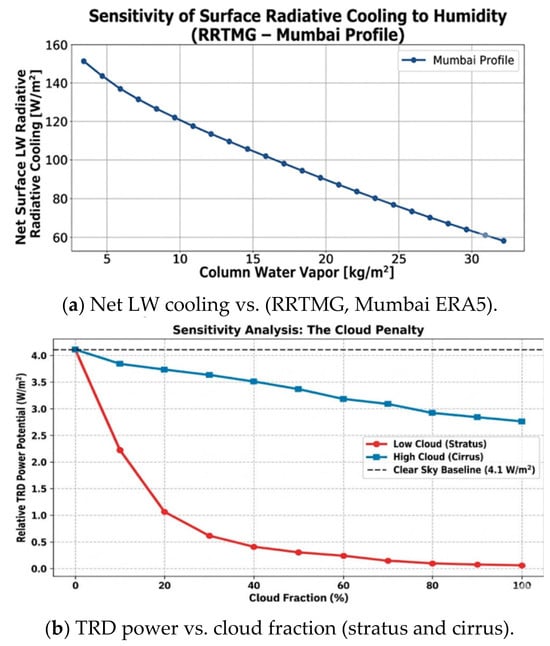
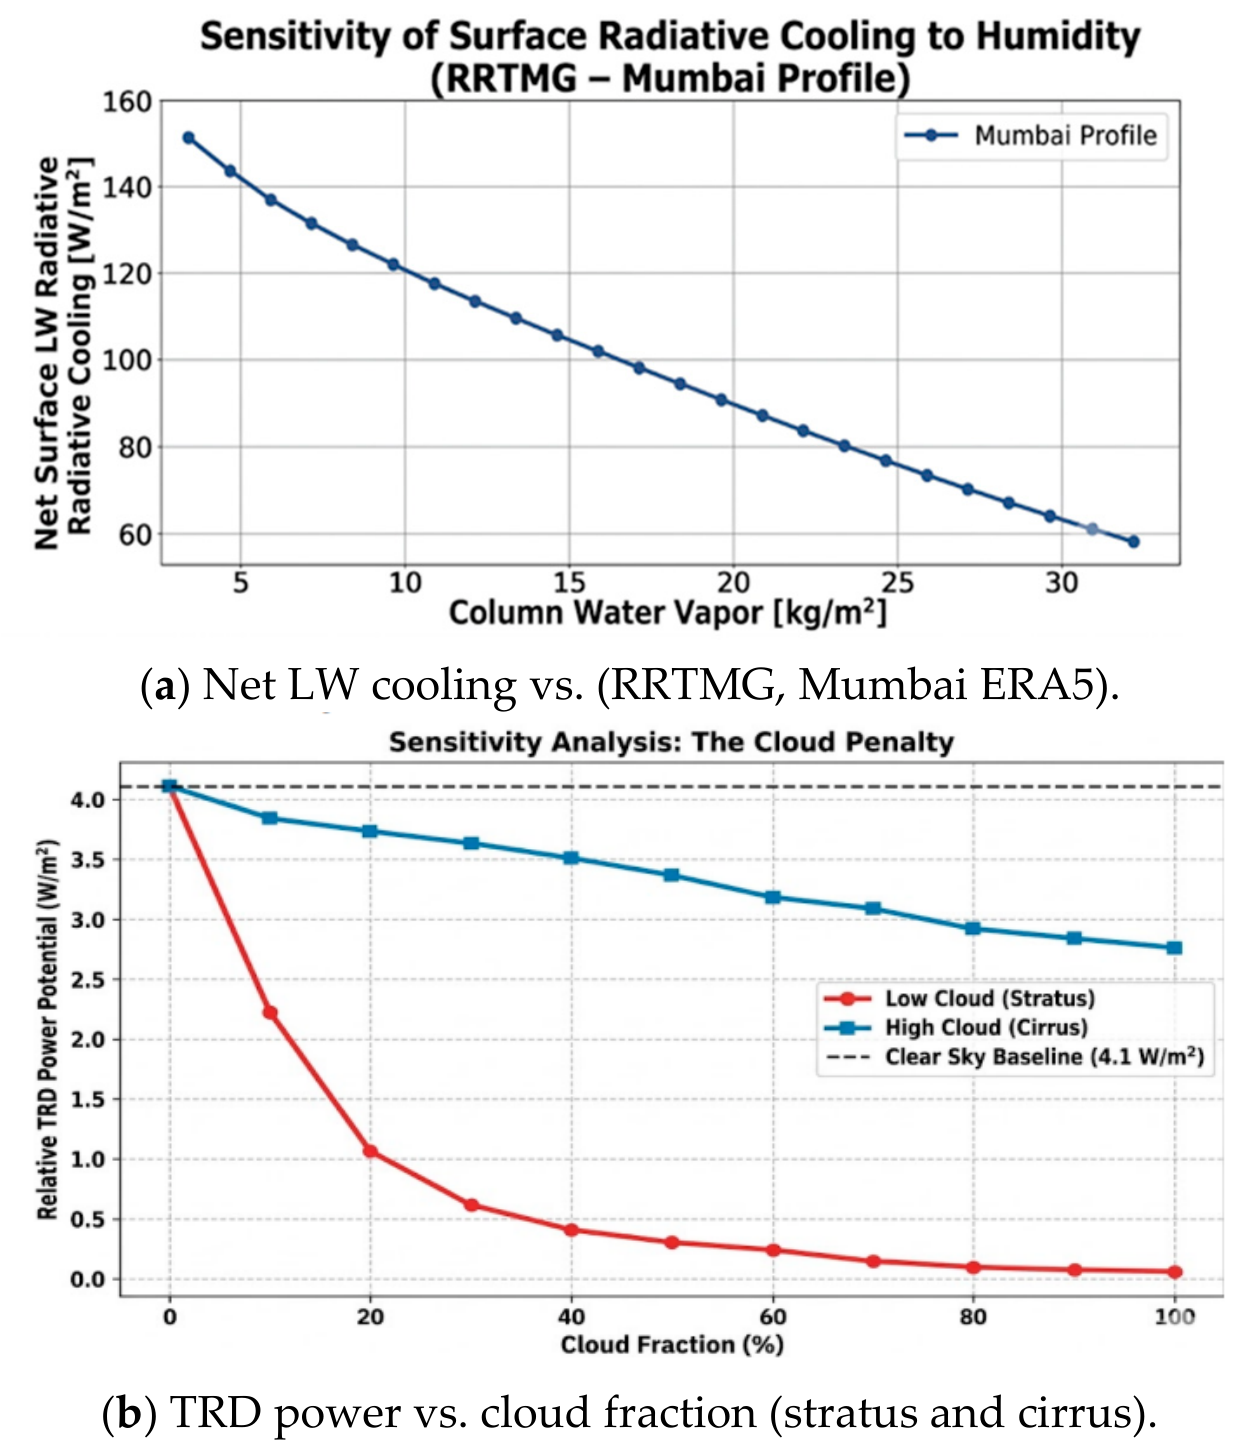
As CWV increases, net longwave cooling drops from ≈160 to below 60 W m−2 (Figure 2a), because water vapour gradually closes the 8–12 µm atmospheric window and raises Tsky [3]. Among all parameters studied, CWV is the most limiting factor at the surface.
Figure 2.
Humidity and cloud effects. (a) Net surface longwave cooling decreases steadily with increasing column water vapour. (b) Low-level stratus clouds cause a sharp drop in output at 40% cover, while cirrus has a much smaller impact.
Cloud effects are modelled via MCICA, considering low-level stratus (≈900 hPa) and high-level cirrus (≈250 hPa). The clear-sky baseline is ≈4.1 W m−2. At 40% stratus cover, output drops below 0.5 W m−2 (≈90% reduction; Figure 2b), as warm, optically thick stratus strongly increases back-radiation. Even full cirrus coverage retains ≈67% of clear-sky output, since cold and optically thin cirrus remains partly transparent in the 8–13 µm window.
3.3. Aerosol, Lapse Rate, Seasonal, and CO2 Effects
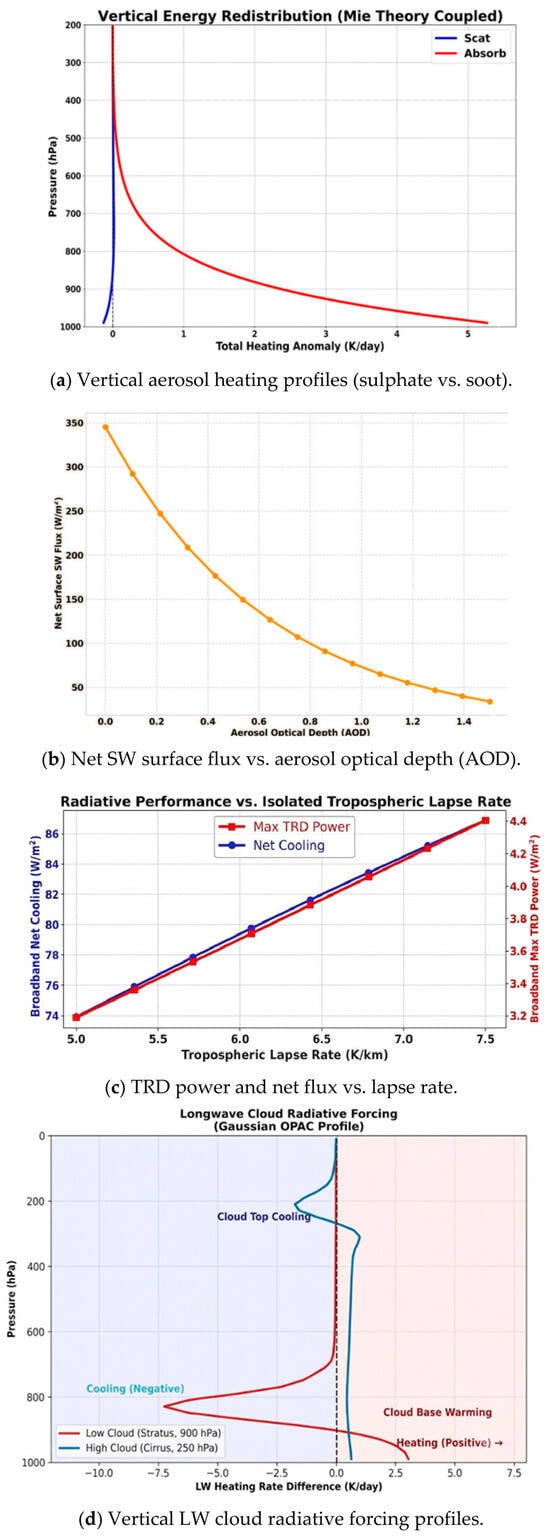
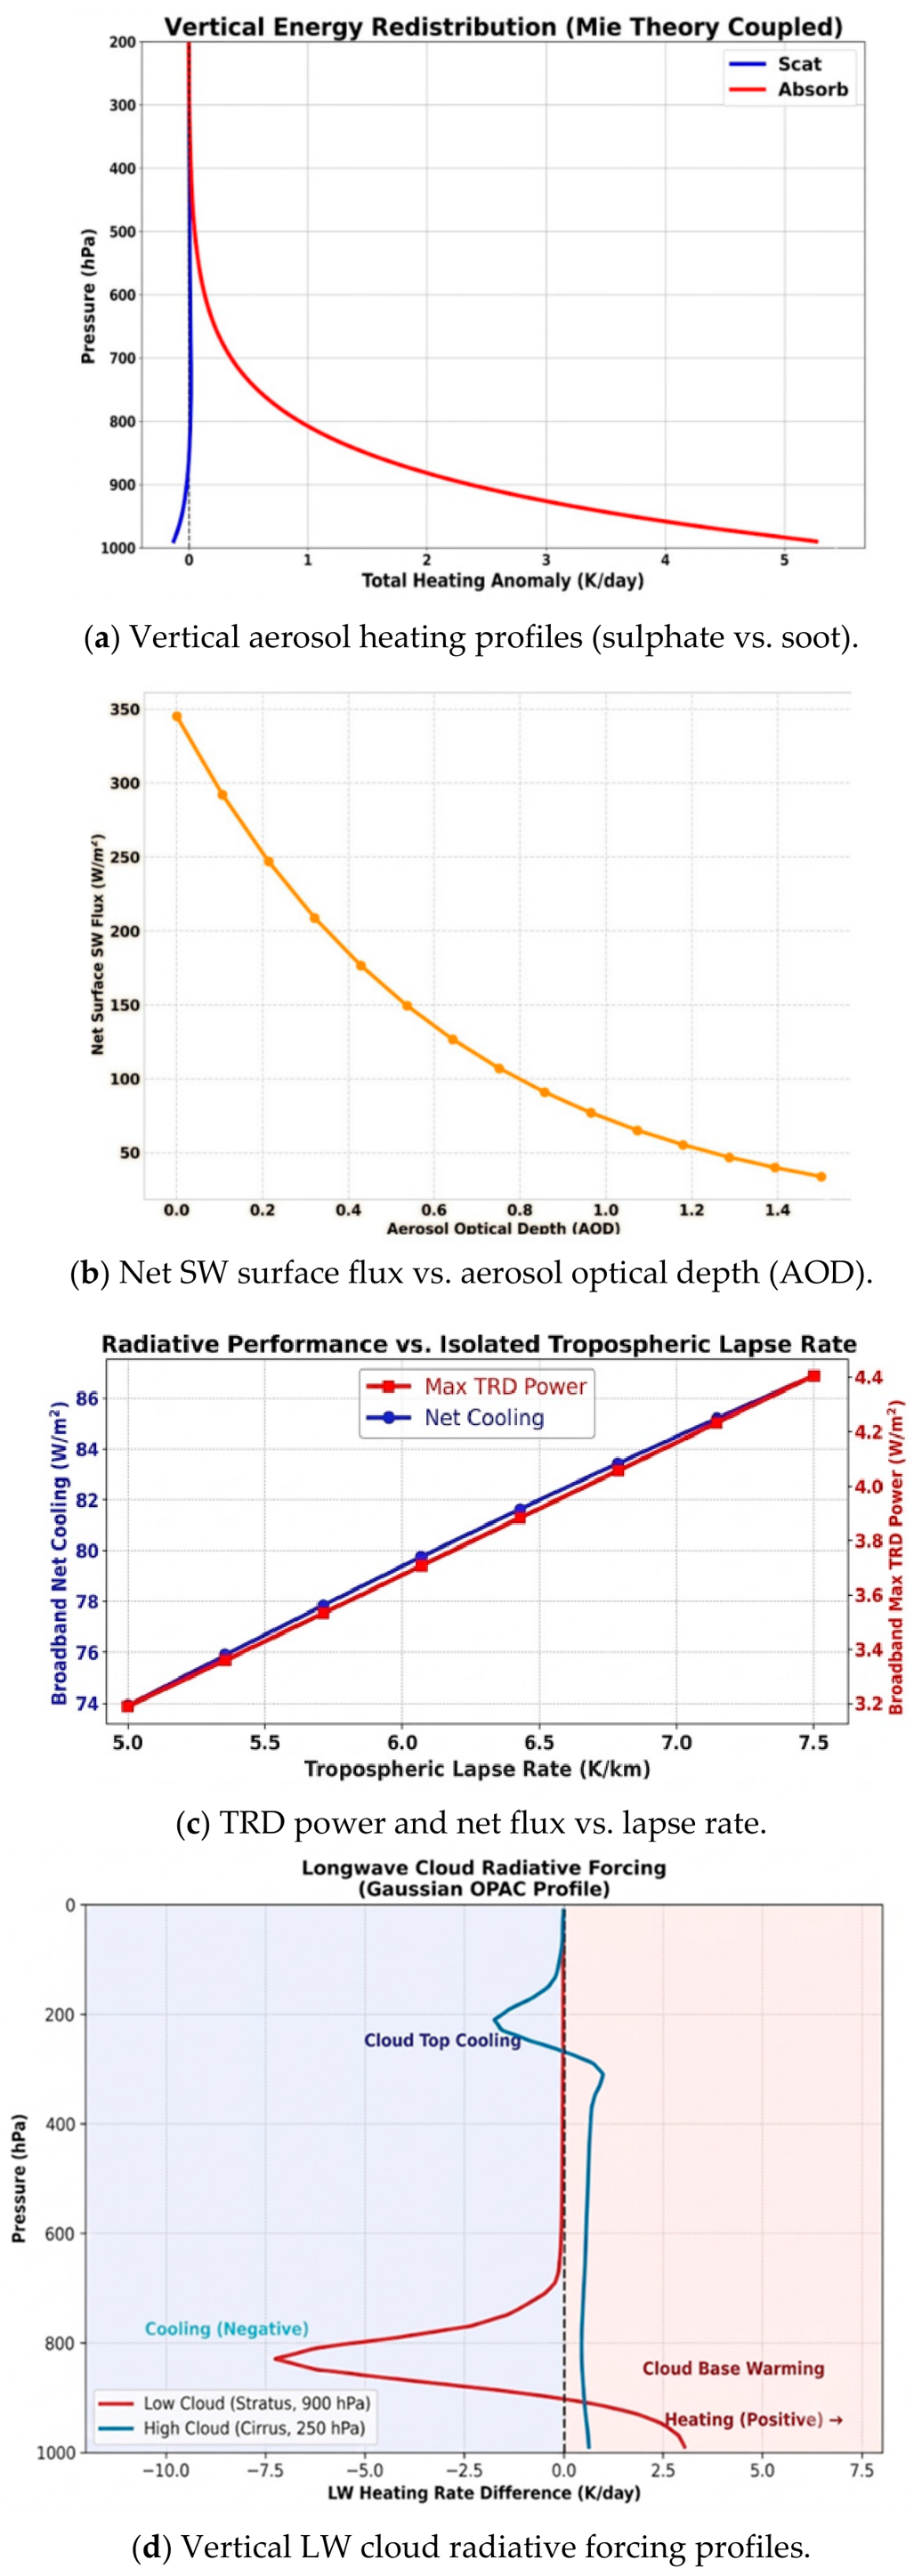
Aerosols. Sulphate aerosols are scattering-dominated (high single-scattering albedo, negligible absorption), contributing little atmospheric heating. Soot (black carbon) strongly absorbs radiation due to its complex refractive index, warming the lower troposphere (Figure 3a), increasing downwelling longwave radiation, raising Tsky, and thereby reducing the TRD temperature differential. Although TRDs operate at night, daytime soot heating persists into nighttime conditions.
Figure 3.
Aerosol and lapse-rate effects. (a) Soot (black carbon) aerosols produce strong lower-troposphere heating absent in scattering-dominated sulphate aerosols, elevating nighttime downwelling longwave radiation and reducing TRD performance. (b) Net shortwave flux decreases exponentially with AOD due to combined scattering and absorption. (c) Increasing the tropospheric lapse rate from 5.0 to 7.5 K km−1 raises TRD power by ≈40% at fixed surface temperature, as the upper atmosphere cools and Tsky drops. (d) Longwave heating-rate anomaly profiles for stratus and cirrus clouds, illustrating the dominant cloud-base warming from low-level clouds.
Lapse rate. A sensitivity sweep from 5.0 to 7.5 K km−1 (Figure 3c) shows maximum TRD power increases by ≈40%. A steeper lapse rate cools the upper atmosphere, reducing its longwave emission and lowering Tsky (Equation (2)), explaining why arid regions—where lapse rates approach the dry-adiabatic value of 9.8 K km−1 [16]—outperform humid tropical regions. The diffusivity approximation (θ0 ≈ 53°, f ≈ 1.66) used for angular flux integration was independently verified by running LBLRTM across zenith angles 0–89°; the flux at θ ≈ 53° matches the hemispherically integrated result within 1.4% [17].
Cloud heating-rate profiles (Figure 3d) confirm strong stratus cloud-base warming (+3 K day−1) and cloud-top cooling (−7.5 K day−1), while cirrus effects stay within ±2 K day−1.
Seasonal variation. Four months (January, May, August, and December) were analysed for Hyderabad (RRTMG-LW, ERA5 midnight profiles). Despite May having the highest surface temperature (≈305 K), elevated humidity (≈12 g kg−1) limits output to 2.35 W m −2.
December gives the highest output (8.59 W m−2) at lower surface temperature (≈296 K) due to lowest humidity (≈7.2 g kg−1). During the monsoon (August), humidity peaks (≈19 g kg−1) and output drops to 1.06 W m−2, confirming that Tsky is governed more by atmospheric moisture than surface temperature (Table 2).
Table 2.
Seasonal TRD Performance—Hyderabad (RRTMG-LW, Clear Sky).
CO2 concentration. Simulations from year-2000 (369 ppm) to the SSP5-8.5 2100 scenario (1135 ppm [18]) show TRD power decreasing from 5.321 to 4.773 W m−2, a ≈10% drop (Table 3). CO2 absorbs mainly outside the 8–13 µm window, so its direct impact on surface cooling is limited compared to water vapour and clouds.
Table 3.
TRD power vs. CO2 concentration (LBLRTM).
4. Conclusions
TRD performance under realistic atmospheric conditions was analysed using LBLRTM and RRTMG driven by ERA5 data. Altitude is the dominant factor, with power increasing ≈15-fold from sea level to 5 km due to reduced atmospheric optical depth. At the surface, CWV is the primary limiting factor, with cloud cover especially low-level stratus also strongly suppressing output; cirrus has a comparatively mild effect. Absorbing soot aerosols reduces performance more than scattering sulphate aerosols through enhanced tropospheric heating. Steeper lapse rates favour higher TRD output, and seasonal results confirm that atmospheric moisture dominates over surface temperature in setting Tsky. CO2 concentration has a comparatively small effect (≈10% change over 2000–2100). RRTMG agrees with LBLRTM within 5.43%, confirming its suitability for efficient large-scale analysis. Dry, high-altitude, and extra-terrestrial environments remain the most favourable for TRD deployment.
Author Contributions
Conceptualization, K.K.J.; methodology, K.K.J.; software, K.K.J.; validation, K.S.R.; formal analysis, K.K.J.; resources, K.K.J.; data curation, K.K.J.; writing—original draft preparation, K.K.J.; writing—review and editing, K.K.J.; visualization, K.K.J.; supervision, K.S.R. All authors have read and agreed to the published version of the manuscript.
Funding
This research received no external funding.
Institutional Review Board Statement
Not applicable.
Informed Consent Statement
Not applicable.
Data Availability Statement
ERA5 reanalysis data are publicly available from the Copernicus Climate Data Store. Additional processed data are available from the corresponding author upon reasonable request.
Conflicts of Interest
The authors declare no conflicts of interest.
Abbreviations
| TRD | Thermoradiative Diode |
| LBLRTM | Line-By-Line Radiative Transfer Model |
| RRTMG | Rapid Radiative Transfer Model for GCMs |
| CWV | Column Water Vapour |
| AOD | Aerosol Optical Depth |
| MCICA | Monte Carlo Independent Column Approximation |
| ERA5 | Fifth Generation ECMWF Reanalysis |
| SSP | Shared Socioeconomic Pathway |
References
- Copernicus Climate Change Service. Global Climate Highlights. 2024. Available online: https://climate.copernicus.eu/global-climate-highlights-2024 (accessed on 23 April 2026).
- Fixsen, D.J. The temperature of the cosmic microwave background. arXiv 2009. [Google Scholar] [CrossRef] [Scilit]
- Harrison, J.A.; Pearce, P.M.; Yang, F.; Nielsen, M.P.; Brindley, H.E.; Ekins-Daukes, N.J. Evaluating potential power output of terrestrial thermoradiative diodes with atmospheric modeling. iScience 2024, 27, 111346. [Google Scholar] [CrossRef] [Scilit]
- Nielsen, M.P.; Pusch, A.; Sazzad, M.H.; Pearce, P.M.; Reece, P.J.; Ekins-Daukes, N.J. Thermoradiative power conversion from HgCdTe photodiodes and their current–voltage characteristics. ACS Photonics 2022, 9, 1535–1540. [Google Scholar] [CrossRef] [Scilit]
- Landis, G. Thermoradiative arrays: A new technology for conversion of heat into electrical power. In Proceedings of the Nuclear and Emerging Technologies for Space (NETS-2022), Cleveland, OH, USA, 8–12 May 2022; pp. 57–62. [Google Scholar]
- Santhanam, P.; Fan, S. Thermal-to-electrical energy conversion by diodes under negative illumination. Phys. Rev. B 2016, 93, 161410. [Google Scholar] [CrossRef] [Scilit]
- Hsu, W.C.; Tong, J.K.; Liao, B.; Huang, Y.; Boriskina, S.V.; Chen, G. Entropic and near-field improvements of thermoradiative cells. Sci. Rep. 2016, 6, 34837. [Google Scholar] [CrossRef] [Scilit]
- Wang, J.; Chen, C.-H.; Bonner, R.; Anderson, W.G. Thermo-radiative cell—A new waste heat recovery technology for space power applications. In Proceedings of the AIAA Propulsion and Energy 2019 Forum, Indianapolis, IN, USA, 19–22 August 2019. [Google Scholar]
- Clough, S.; Shephard, M.; Mlawer, E.; Delamere, J.; Iacono, M.; Cady-Pereira, K.; Boukabara, S.; Brown, P. Atmospheric radiative transfer modeling: A summary of the AER codes. J. Quant. Spectrosc. Radiat. Transf. 2005, 91, 233–244. [Google Scholar] [CrossRef] [Scilit]
- Alvarado, M.J.; Payne, V.H.; Mlawer, E.J.; Uymin, G.; Shephard, M.W.; Cady-Pereira, K.E.; Delamere, J.S.; Moncet, J.-L. Performance of LBLRTM for temperature, water vapor, and trace gas retrievals: Recent updates evaluated with IASI case studies. Atmos. Chem. Phys. 2013, 13, 6687–6711. [Google Scholar] [CrossRef] [Scilit]
- Mlawer, E.J.; Taubman, S.J.; Brown, P.D.; Iacono, M.J.; Clough, S.A. Radiative transfer for inhomogeneous atmospheres: RRTM, a validated correlated-k model for the longwave. J. Geophys. Res. Atmos. 1997, 102, 16663–16682. [Google Scholar] [CrossRef] [Scilit]
- Iacono, M.J.; Delamere, J.S.; Mlawer, E.J.; Shephard, M.W.; Clough, S.A.; Collins, W.D. Radiative forcing by long-lived greenhouse gases: Calculations with the AER radiative transfer models. J. Geophys. Res. Atmos. 2008, 113, D13. [Google Scholar] [CrossRef] [Scilit]
- Norris, P.; Takacs, L.L.; Putman, W.; Coy, L.; Pawson, S.; Mlawer, E.; Iacono, M. Transition to the RRTMG Shortwave Radiation Code in GEOS Models; Technical Report; NASA: Washington, DC, USA, 2015.
- Hess, M.; Koepke, P.; Schult, I. Optical properties of aerosols and clouds: The software package OPAC. Bull. Am. Meteorol. Soc. 1998, 79, 831–844. [Google Scholar] [CrossRef] [Scilit]
- Gupta, M.C.; Ungaro, C.; Foley, J.J.; Gray, S.K. Optical nanostructures design, fabrication, and applications for solar/thermal energy conversion. Sol. Energy 2018, 165, 100–114. [Google Scholar] [CrossRef] [Scilit]
- Pierrehumbert, R.T. Principles of Planetary Climate; Cambridge University Press: Cambridge, UK, 2010. [Google Scholar]
- Feng, J.; Huang, Y. Diffusivity-factor approximation for spectral outgoing longwave radiation. J. Atmos. Sci. 2019, 76, 2171–2180. [Google Scholar] [CrossRef] [Scilit]
- Meinshausen, M.; Nicholls, Z.R.J.; Lewis, J.; Gidden, M.J.; Vogel, E.; Freund, M.; Beyerle, U.; Gessner, C.; Nauels, A.; Bauer, N.; et al. The shared socio-economic pathway (SSP) greenhouse gas concentrations and their extensions to 2500. Geosci. Model Dev. 2020, 13, 3571–3605. [Google Scholar] [CrossRef] [Scilit]

Disclaimer/Publisher’s Note: The statements, opinions and data contained in all publications are solely those of the individual author(s) and contributor(s) and not of MDPI and/or the editor(s). MDPI and/or the editor(s) disclaim responsibility for any injury to people or property resulting from any ideas, methods, instructions or products referred to in the content. |
© 2026 by the authors. Licensee MDPI, Basel, Switzerland. This article is an open access article distributed under the terms and conditions of the Creative Commons Attribution (CC BY) license.