


Abstract
This study employed Large Eddy Simulation (LES) based on the WALE model to study the complex flow within a 5 × 5 fuel rod bundle channel with a spacer grid. The numerical simulation was validated through turbulent kinetic spectrum analysis and comparison of axial and radial velocity distributions with experiments. Furthermore, a reduced-order surrogate model was constructed based on the Proper Orthogonal Decomposition (POD) for geometric optimization of the spacer grid mixing vanes. Results show that the optimized structure improves lateral mixing and heat transfer efficiency, and exhibits a more uniform temperature distribution downstream of the spacer grid. This study validates the feasibility of combining LES and POD for efficient optimization of fuel assembly structural design.
1. Introduction
The coolant flow in fuel rod bundle channels is extremely complex, particularly in the region downstream of spacer grids, where strong vortex shedding, cross-flow, and turbulent mixing phenomena occur. To accurately reveal the detailed flow within fuel rod bundle channels and ensure data accuracy, this paper employs Large Eddy Simulation (LES) to perform high-fidelity simulation and validation of coolant flow in the 5 × 5 fuel rod bundle channel with a spacer grid. The results are validated through analysis of the turbulent kinetic energy spectrum, full development in the entrance region, and comparison of velocity with experimental data.
Mixing vanes on the spacer grid are among the most important components of both the grid and the entire reactor fuel assembly. Their performance directly influences the efficiency of turbulence, making the geometric optimization of mixing vanes a decisive factor in enhancing overall flow performance. Integrating Proper Orthogonal Decomposition (POD) into the computational framework enables effective dimensionality reduction while preserving numerical accuracy. Accordingly, this study combines POD with optimization of the mixing vanes on the spacer grid, thereby validating the feasibility of utilizing POD-based surrogate models for design optimization.
2. Methodology
2.1. Large Eddy Simulation
LES [1] is a numerical method for turbulence modeling that occupies an intermediate position between Direct Numerical Simulation (DNS) and Reynolds-Averaged Navier–Stokes (RANS). It also directly simulates turbulence, but unlike DNS, LES establishes a filtering function in the solution process. The purpose is to remove small-scale vortex in the flow field and retain only large-scale vortex. The large-scale structures are directly simulated by the Navier–Stokes equations, and the small-scale structures are simulated by establishing a subgrid-scale (SGS) model. This method can achieve a balance between computational accuracy and computational cost, and provides an effective means of turbulence simulation for many engineering and scientific fields.
The actual process of LES modeling is to achieve the closure of the SGS stress tensor through modeling, ultimately realizing LES. There are many computational models in LES, called subgrid models, with common ones including the Smagorinsky model, the dynamic Smagorinsky model, the Wall-Adapting Local Eddy-viscosity (WALE) model, and so on. This study utilizes the WALE model in LES for calculations, taking advantage of its superior near-wall handling.
2.2. Proper Orthogonal Decomposition
POD was first proposed by Lumley [2] to identify coherent structures in turbulence. The core idea of this method is to decompose a complex flow field into a set of orthogonal basis functions. By ranking these modes in descending order according to their energy contribution, only the first few high energy modes are retained to describe the core dynamic characteristics of the flow field.
By performing Singular Value Decomposition (SVD) on the pulsating values of the instantaneous flow field data, snapshot X is collected during unsteady flow, that is:
SVD(X′) = [U, V, W]
To achieve order reduction, energy contribution rate is introduced as a screening criterion, and then an M dimensional space is constructed to approximate the original system:
E(M) = (λ1 + λ2 + … + λM)/(λ1 + λ2 + … + λN)
Let E(M) ≥ σ, where σ is a value less than but close to 1, to ensure that the retained flow features account for the vast majority of the energy. Based on the M POD basis modes obtained through truncation according to E(M), the original flow field can be reconstructed in the reduced-order method.
Thus, a reduced-order subspace constructed based on the M POD basis modes, and the subsequent solution process, is projected into this space. Since the POD only requires a few low-order modes to capture the core features of the flow field and achieve flow field reconstruction, the research focus shifts from analyzing the flow field data at each time step to analyzing only the first few dominant modes, thus significantly reducing the complexity of data processing and analysis.
3. Results and Analysis
3.1. Geometry and Meshing
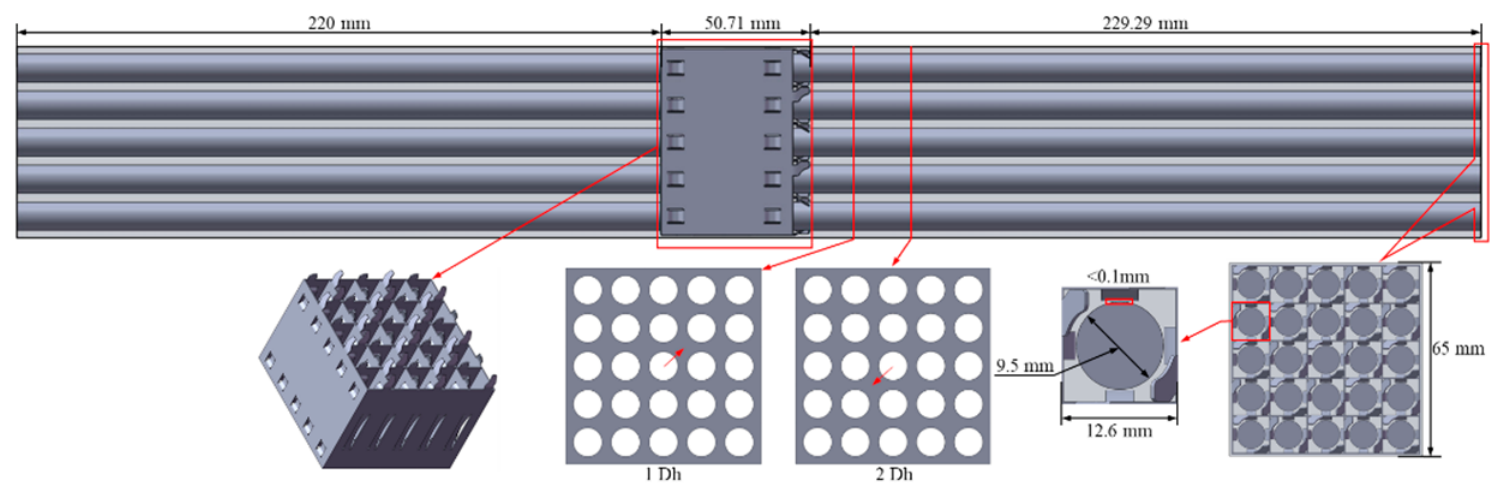
This study relies on the experiments of the 5 × 5 fuel rod bundle channel already conducted within the group. The relevant experiments can be found in Reference [3], which are used to determine the computational fluid domain and to make overall assumptions and simplifications for the relevant components. Based on the empirical formula for calculating the fully developed length proposed by Munson et al. [4], the inlet section length is set to 220 mm, which is sufficient to meet the requirements for the fully developed length. Thus, the geometric model and related parameters are shown in Figure 1.
Figure 1.
Geometric model of the 5 × 5 fuel rod bundle.
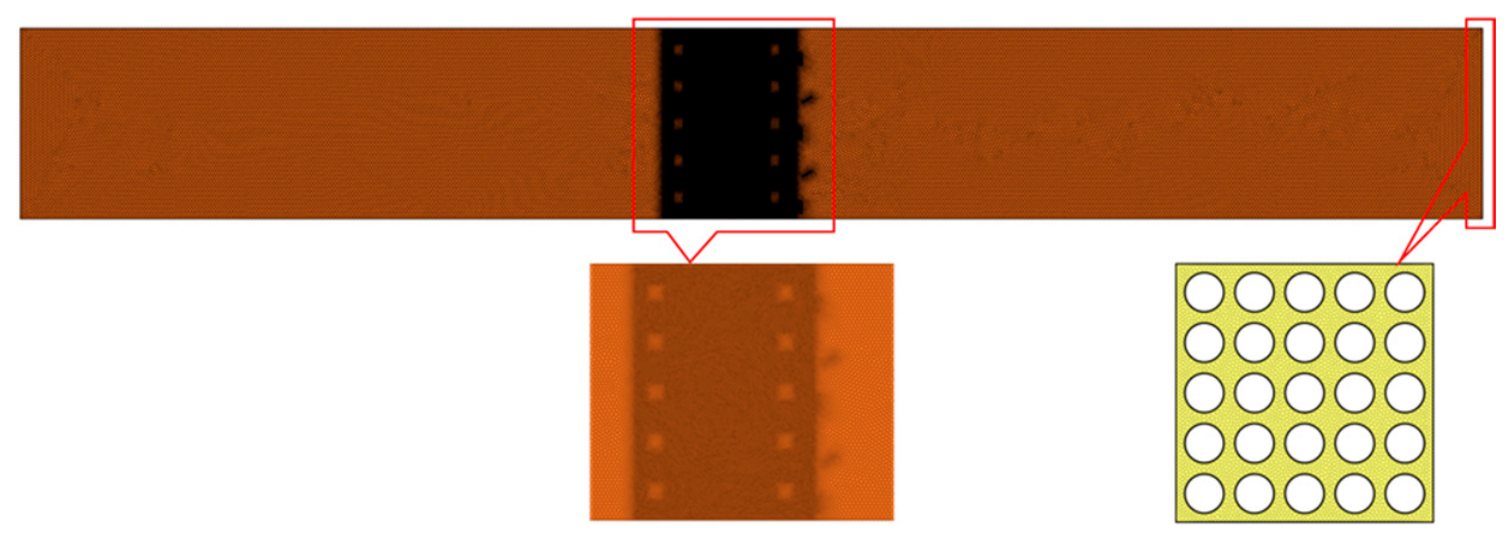
Meshing is an important step in the simulation. To meet the strict requirements of LES for the size of the grid, the mesh resolution was determined to be 0.01 mm based on the comprehensive verification and analysis of Choi et al. [5] on the minimum solvable scale and computational cost of LES. In order to improve the computational accuracy and accurately analyze the flow field in the near-wall region, the target y+ < 1 was set. At the same time, the local grid was refined in the spacer grid. The total number of computational grids generated was 116 million. The mesh generation results are shown in Figure 2.
Figure 2.
Meshing.
3.2. Validation of Results
3.2.1. Verification of Meshing
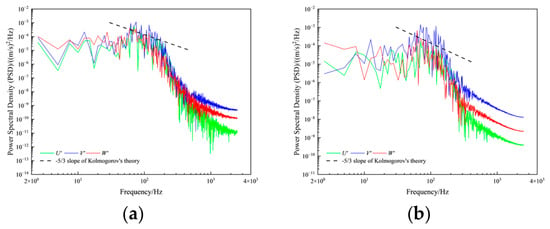
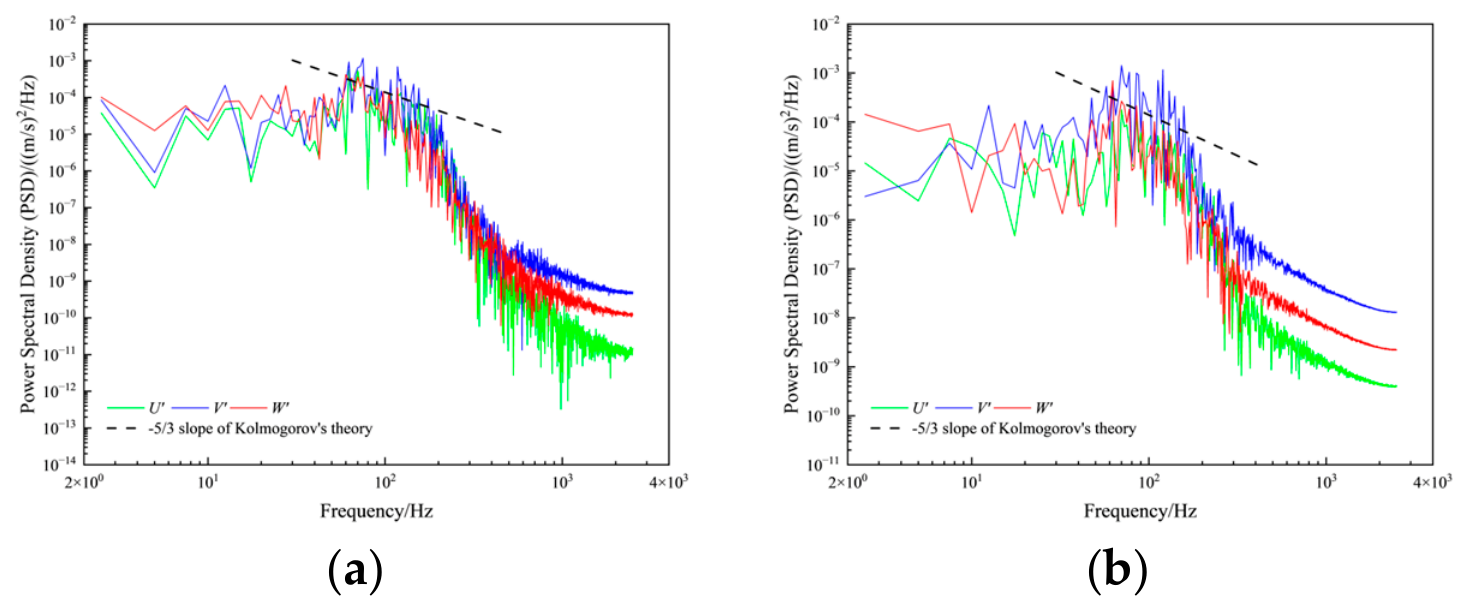
According to classical turbulence theory [6], the uniform isotropic turbulent energy spectrum can be divided into three typical regions: the energy-containing range, the inertial subrange, and the dissipation range. LES can explicitly resolve the large-scale motions in the energy-containing range and inertial subrange, while the dissipative effects at SGS are accounted for through model closure. Therefore, a reasonable mesh should ensure that the adopted filter scale lies within the inertial subrange. Accordingly, mesh independence verification for LES often adopts turbulent kinetic energy dissipation spectrum analysis as a criterion. This method directly examines from the fluid physics perspective whether the computation resolves down to the inertial subrange. According to Kolmogorov theory, within the inertial subrange, turbulent energy decays with wavenumber to the power of −5/3. Therefore, Kolmogorov theory can be used to verify the rationality of the grid division. The typical points selected in this study are shown in Figure 1, and the power spectral density (PSD) of velocity fluctuations in three directions are presented in Figure 3. It can be seen from the figures that the grid conforms to the −5/3 slope of Kolmogorov theory, that is, it meets the LES requirement for the grid and can be used for subsequent calculations.
Figure 3.
PSD of pulsation velocity at monitoring points. (a) PSD of sampling point at 1 DH; (b) PSD of sampling point at 5 DH.
3.2.2. Verification of Calculation Results
To evaluate the ability of LES to perform simulations of the flow field within the fuel rod bundle channel, two lines from two cross-sections downstream of the spacer grid were taken, as shown in Figure 1. The velocity distribution was extracted along the lines and compared with the experimental data on which it was based.
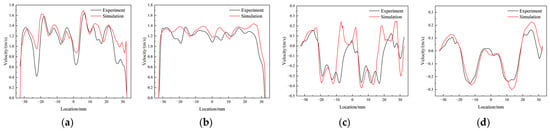
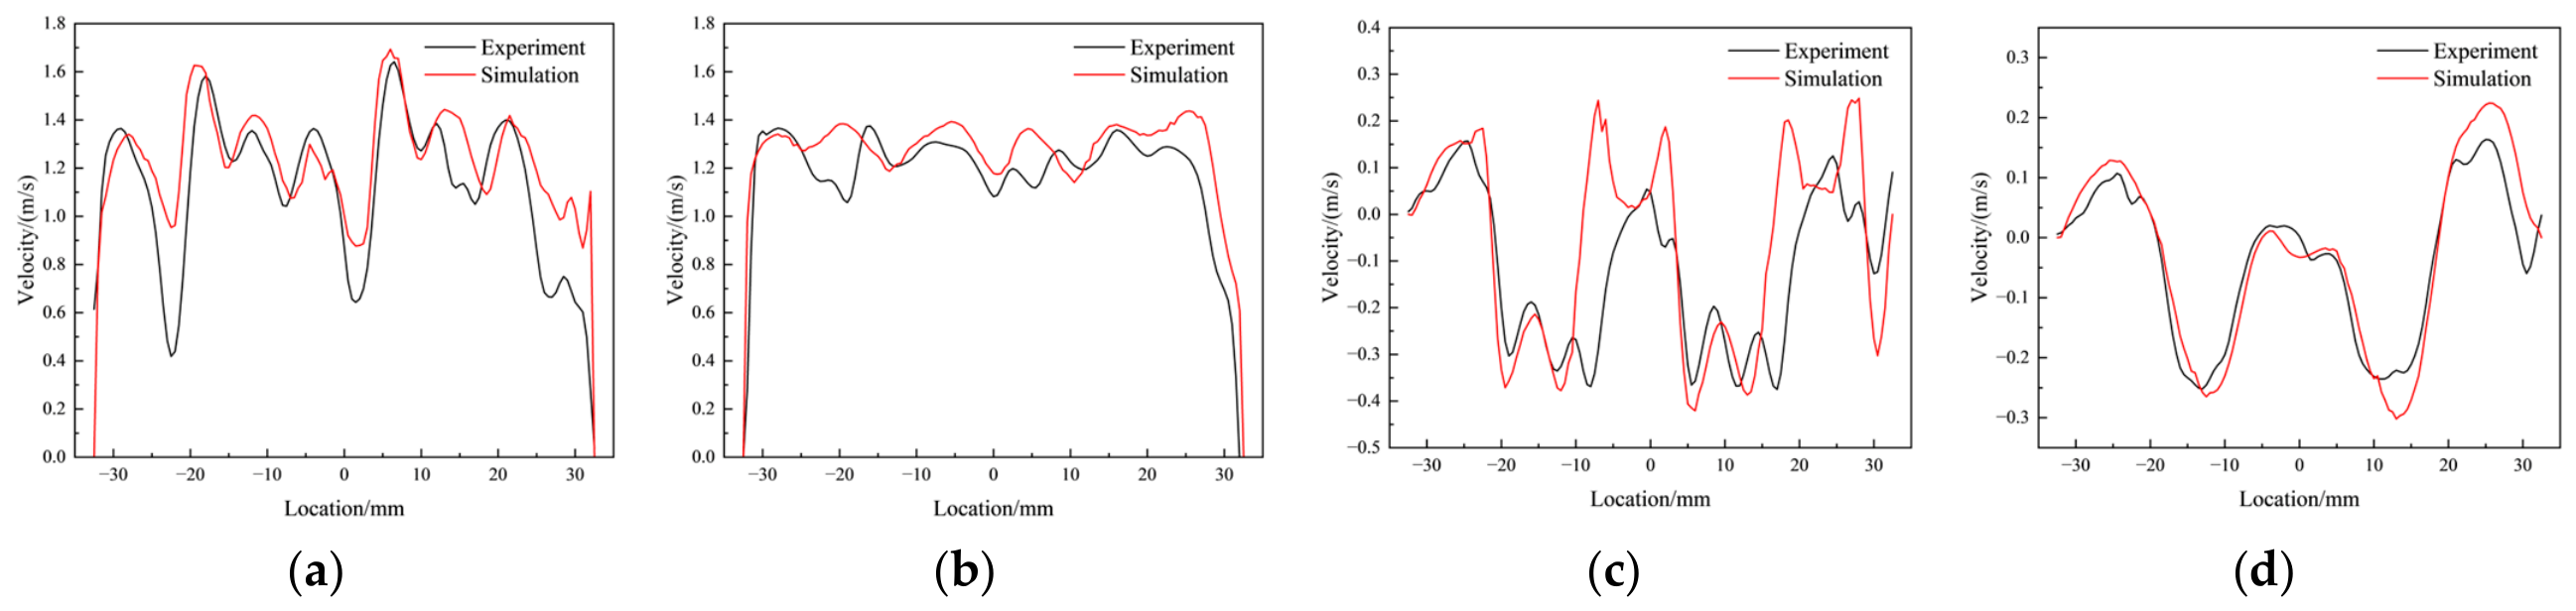
As shown in Figure 4, the simulated axial velocity results are basically consistent with the experimental values. Due to the strong disturbance caused by the mixing vanes, the simulation results can accurately describe the multiple waves observed in the experiment. As the flow progresses downstream to the cross-section at 5 DH, the velocity profile tends to flatten, and the simulation and experimental results show a higher degree of consistency. Since the radial velocity is a secondary flow component, its order of magnitude is much smaller than that of the axial velocity, but its spatial distribution has a key influence on transverse mixing. As can be seen from the figure, the simulation results can reasonably reproduce the alternating positive and negative structures observed in the experiment, and the difference in peak position and the error of velocity is small. Especially in the cross-section at 5 DH, the radial velocity distribution tends to stabilize, and the simulation and experimental results match well. In summary, the simulation results obtained from the fuel rod bundle model constructed based on LES show good consistency with the experimental results in both the mainstream direction and transverse disturbances.
Figure 4.
Validation of velocity. (a) Comparison of axial velocity on the line at 1 DH; (b) Comparison of axial velocity on the line at 5 DH; (c) Comparison of radial velocity on the line at 1 DH; (d) Comparison of radial velocity on the line at 5 DH.
3.3. Numerical Results
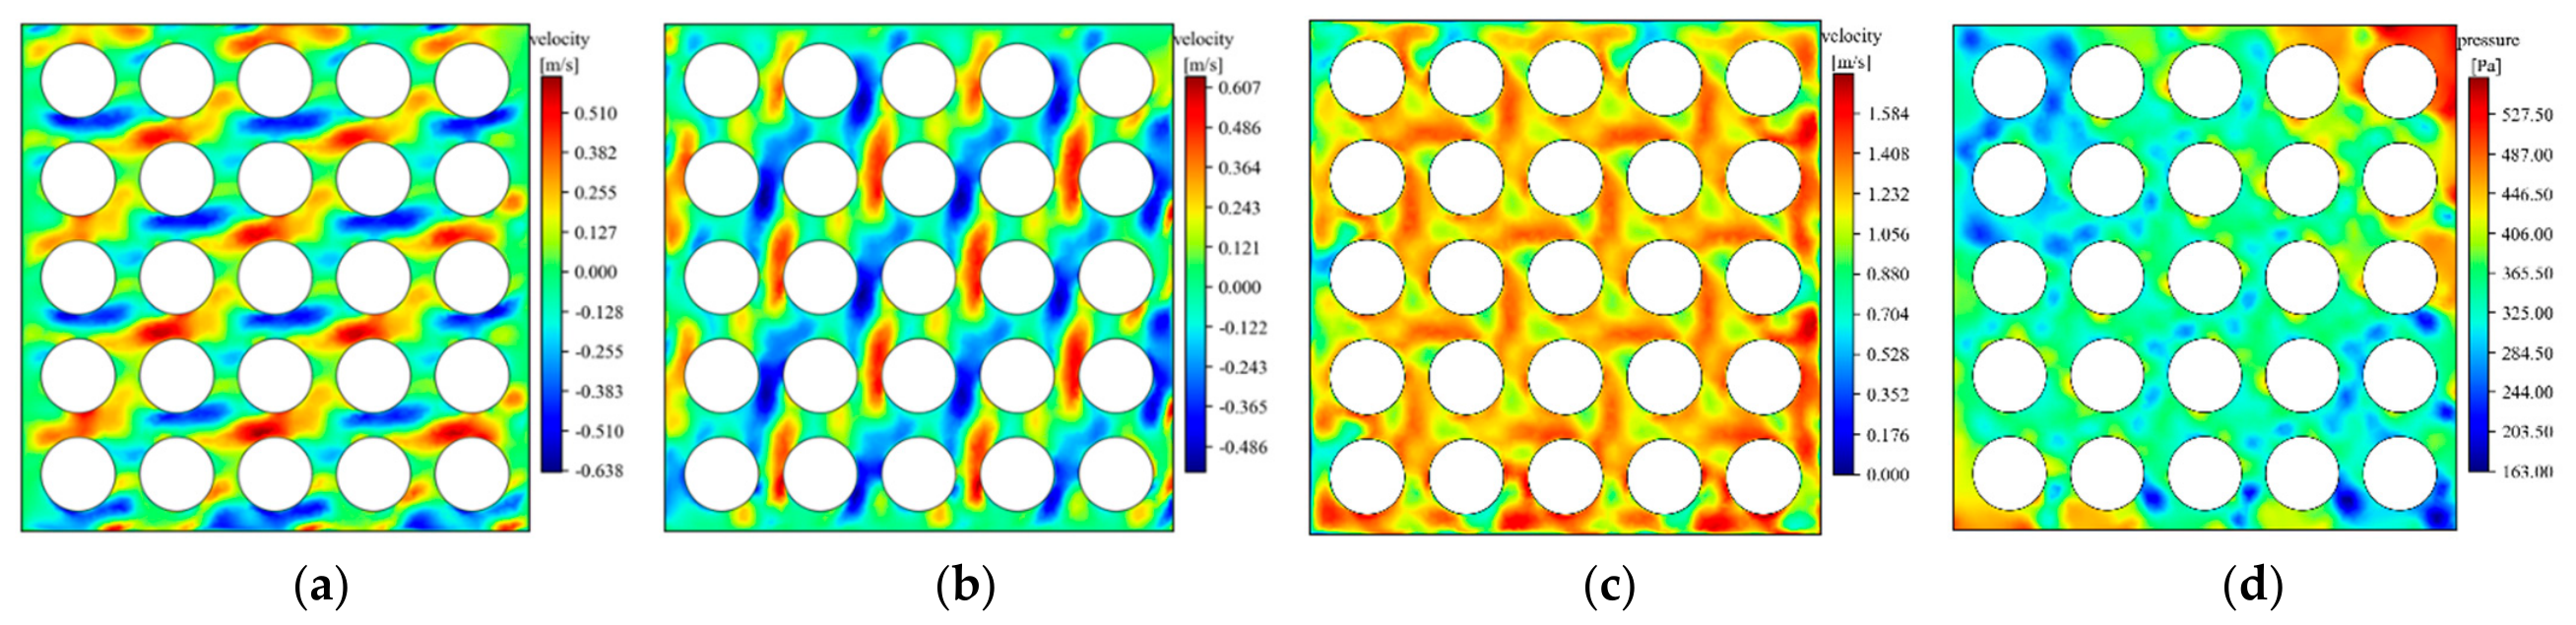
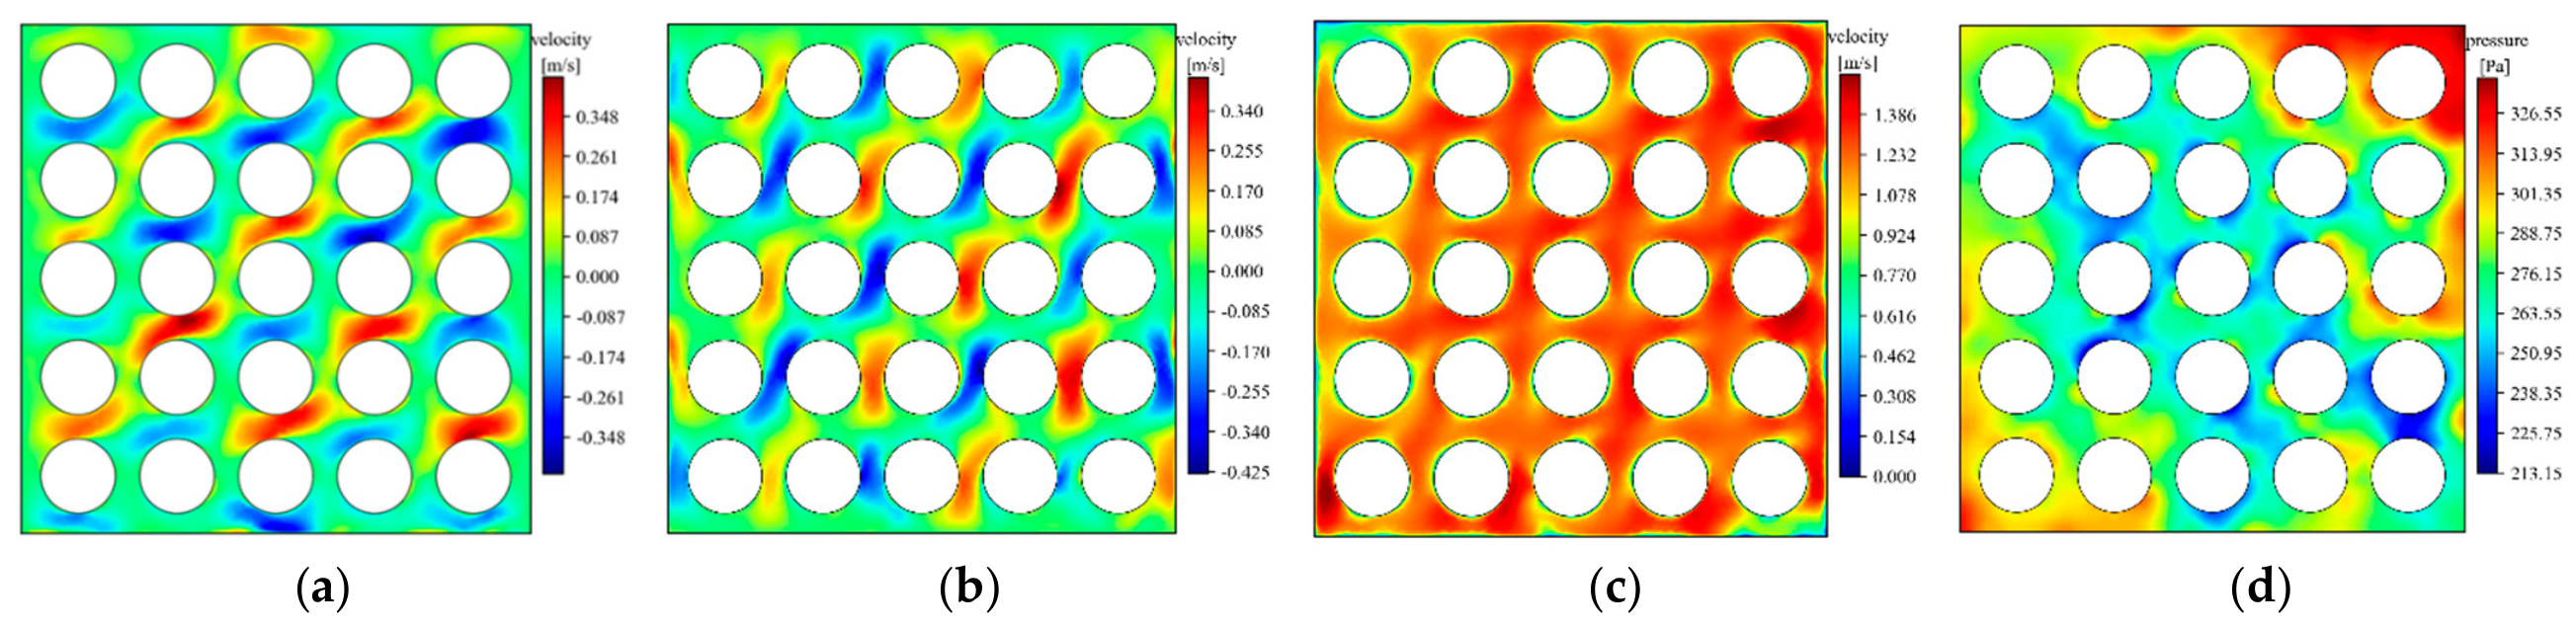
Figure 5 shows the velocity and pressure distribution on the cross-section at 1 DH. Under the perturbation of the spacer grid, the velocities in the X and Y directions alternate between positive and negative in the fuel rod bundle gaps, exhibiting regularity, but clearly showing structural irregularities. From the Z-direction velocity, using LES, some regularity can still be observed in the axial velocity. That is, the pattern of each fuel rod bundle gap is roughly consistent, but similar to the velocity distribution in the other two directions, clearly showing the presence of a small vortex. Figure 5d shows the pressure distribution on the cross-section at 1 DH. It can be seen that the pressure distribution is uneven, mainly due to the random pulsations generated by the flow, which are already shown in the velocity field, but relatively less obvious. Random pulsations in the flow field are clearly visible in the pressure field. Figure 6 shows the velocity and pressure distribution on the cross-section at 5 DH. Comparing the parameters with those of at 1 DH, it can be seen that the flow field pattern on the cross-section at 5 DH is basically similar to that at 1 DH, but the physical parameters of at 5 DH are more regular, indicating that the small-scale vortex gradually dissipate as the flow field evolves, and the flow field gradually returns to stable flow.
Figure 5.
Distribution of velocity and pressure on the cross-section at 1 DH. (a) Velocity in the X-direction; (b) Velocity in the Y-direction; (c) Velocity in the Z-direction; (d) pressure.
Figure 6.
Distribution of velocity and pressure on the cross-section at 5 DH. (a) Velocity in the X-direction; (b) Velocity in the Y-direction; (c) Velocity in the Z-direction; (d) Pressure.
3.4. Structural Optimization
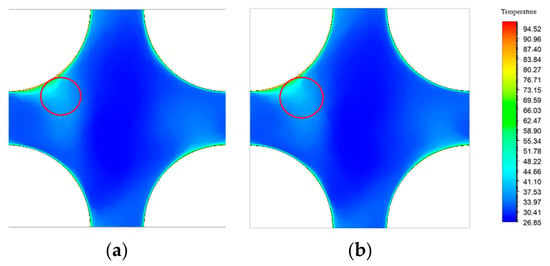
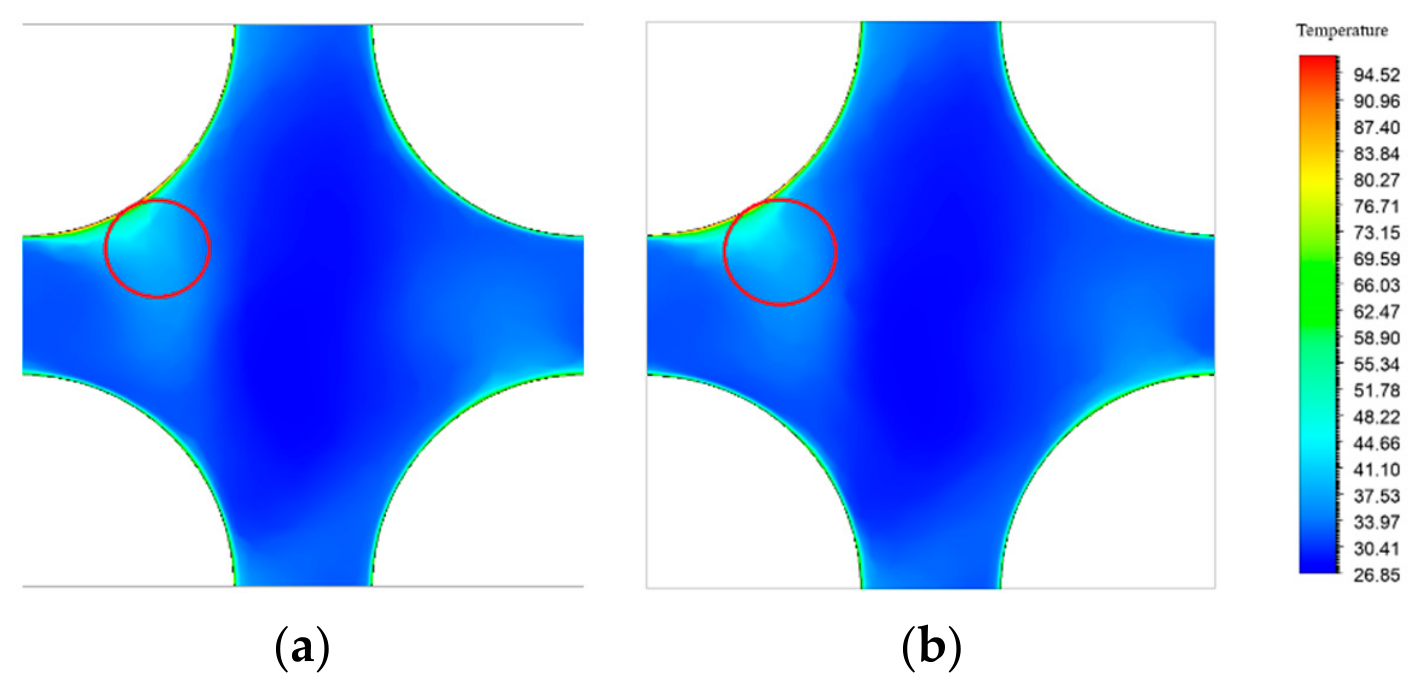
This study combines POD to optimize the structure of the mixing vanes of the simplified 1 × 1 model. Figure 7 shows the temperature distribution on the cross-section at approximately 0.5 DH behind the spacer grid before and after optimization. As can be seen from the figure, both models exhibit heat transfer capacity. However, compared to the optimized model, the disturbance introduced by the optimized spacer grid model can better exchange heat with the mainstream region, allowing more heat to enter the mainstream region. This indicates that the optimized model’s mixing vanes can induce a better heat transfer level and capacity.
Figure 7.
Temperature distribution on the cross-section at 0.5 DH downstream of the spacer grid. (a) Before optimization; (b) After optimization.
4. Conclusions
This study uses a fuel rod bundle with a spacer grid as the research object and conducts a high-precision LES of coolant flow within the fluid domain channel. The results are validated in the following ways: First, turbulent kinetic energy spectrum analysis demonstrates that the grid resolution meets the LES requirements for the size of grid. Second, the axial velocity and radial velocity distributions of the simulated data are compared with experimental data, verifying that the simulation results are in good agreement with the experimental results, thus validating the rationality and accuracy of the constructed model. Finally, based on the above model, the mixing vanes of the spacer grid are structurally optimized, and the temperature distribution after optimization is significantly better than that before optimization.
Author Contributions
Conceptualization, J.L. and H.W.; methodology, J.L. and H.W.; software, J.L. and H.W.; validation, J.L. and H.W.; investigation, J.L. and H.W.; resources, H.W. and S.T.; data curation, J.L.; writing—original draft preparation, J.L.; writing—review and editing, J.L., P.G. and H.W.; visualization, J.L.; supervision, S.T., P.G., H.W., and M.A.; project administration, H.W.; funding acquisition, H.W. All authors have read and agreed to the published version of the manuscript.
Funding
This research received no external funding.
Institutional Review Board Statement
Not applicable.
Informed Consent Statement
Not applicable.
Data Availability Statement
The data are available upon reasonable request.
Conflicts of Interest
The authors declare no conflicts of interest.
References
- Pope, S.B. Turbulent flows. Meas. Sci. Technol. 2001, 12, 2020–2021. [Google Scholar] [CrossRef] [Scilit]
- Lumley, J.L. The structure of inhomogeneous turbulent flows. In Atmospheric Turbulence and Radio Wave Propagation; Springer: Berlin/Heidelberg, Germany, 1967; pp. 166–178. [Google Scholar]
- Qi, P.; Li, X.; Qiao, S.; Tan, S.; Du, S.; Chen, Y. Experimental investigation of the turbulent flow in a rod bundle channel with spacer grids. Ann. Nucl. Energy 2019, 130, 142–156. [Google Scholar] [CrossRef] [Scilit]
- Munson, B.R.; Okiishi, T.H.; Huebsch, W.W. Fundamentals of Fluid Mechanics, 7th ed.; John Wiley & Sons: Hoboken, NJ, USA, 2012. [Google Scholar]
- Choi, H.; Moin, P. Grid-point requirements for large eddy simulation: Chapman’s estimates revisited. Phys. Fluids 2012, 24, 011702. [Google Scholar] [CrossRef] [Scilit]
- Kolmogorov, A.N. Dissipation of energy in the locally isotropic turbulence. Proc. R. Soc. Lond. A 1991, 434, 15–17. [Google Scholar] [CrossRef] [Scilit]
Disclaimer/Publisher’s Note: The statements, opinions and data contained in all publications are solely those of the individual author(s) and contributor(s) and not of MDPI and/or the editor(s). MDPI and/or the editor(s) disclaim responsibility for any injury to people or property resulting from any ideas, methods, instructions or products referred to in the content. |
© 2026 by the authors. Licensee MDPI, Basel, Switzerland. This article is an open access article distributed under the terms and conditions of the Creative Commons Attribution (CC BY) license.