


Abstract
With the increasing global demand for renewable energy, micro-hydropower has gained attention due to its low environmental impact and suitability for decentralized deployment. Successful installation, however, requires sufficient hydraulic head and stable water flow. Water drop structures in irrigation canals provide elevation differences, making them promising sites for micro-hydropower generation. Yet their large quantity and wide spatial distribution render traditional manual surveys inefficient and labor-intensive, limiting comprehensive planning and assessment. To address this challenge, this study proposes an automated identification framework that integrates a quantum geographic information system (QGIS) and YOLO with image recognition technology. Nationwide irrigation canal spatial data are first imported into QGIS to establish a canal database. Canal imagery is then extracted and preprocessed to construct a dataset for object detection. The YOLO model is applied to automatically identify drop structures from the exported images. The results are converted into geospatial data with spatial coordinates and reintegrated into QGIS for visualization and spatial management. The results show that the proposed approach significantly improves the efficiency and positional accuracy of drop structure identification. The automated workflow reduces labor costs and operational risks associated with manual field surveys and provides reliable spatial references for preliminary micro-hydropower site selection. This framework supports the reuse of existing water infrastructure and enhances sustainable energy planning. Future work may incorporate power generation potential evaluation models or integrate UAV imagery to further improve assessment precision and practical applicability.
1. Introduction
Under the global energy transition and the promotion of renewable energy policies, low-carbon, decentralized, and environmentally friendly energy technologies have gained increasing attention. Compared with large-scale hydropower projects, micro-hydropower systems offer several advantages, including lower ecological impact, the ability to integrate with existing hydraulic infrastructures, and the avoidance of large-scale construction. As a result, micro-hydropower has become an important direction in recent renewable energy development.
In agricultural irrigation systems, various drop structures are commonly installed within canals to regulate water levels and flow velocities, creating stable hydraulic head differences. These drop structures possess structural characteristics suitable for micro-hydropower applications. However, irrigation canal systems are widely distributed, and drop structures are numerous and spatially dispersed. Relying solely on manual inventory and field investigation is both time-consuming and labor-intensive, making it difficult to rapidly establish a comprehensive spatial database and consequently limiting subsequent planning and application. With the advancement of quantum geographic information systems (QGIS) and YOLO, integrating spatial data management with image analysis has become an effective approach for improving the efficiency of hydraulic infrastructure inventory and management. QGIS enables the integration of spatial location, attribute data, and visualization analysis, while YOLO facilitates automated object detection based on image features, reducing manual interpretation workload.
Therefore, this study aims to develop an automated identification workflow for irrigation canal drop structures by integrating QGIS and YOLO, using micro-hydropower applications as the research context. The workflow integrates nationwide canal and drop structure data, constructs a drop structure detection model, and converts recognition results into georeferenced spatial data for visualization and management within the QGIS platform. Through practical case analysis, this study verifies the feasibility of the proposed automated identification process and evaluates its effectiveness in improving operational efficiency and reducing labor costs in drop structure inventory, thereby providing a foundational database for future micro-hydropower site selection and planning.
2. Literature Review
Recent advances in geospatial image analysis have increasingly integrated GIS with computer vision and deep learning techniques. Among available GIS platforms, QGIS has become one of the most widely adopted open-source tools for spatial data processing and visualization [1]. Rosas-Chavoya et al. described QGIS as a continuously growing geospatial software ecosystem supported by an active developer community and extensible plugin architecture [2]. Their bibliometric analysis further demonstrated the rapid growth of scientific publications using QGIS, highlighting its importance in spatial analysis and geospatial research. GIS platforms are commonly used to construct spatial base layers such as terrain models, drainage networks, and environmental monitoring datasets, which serve as foundational data for subsequent image analysis.
To integrate GIS data with computer vision frameworks, raster datasets such as Geo-tagged image file format (TIFF) images are typically converted into matrix representations. Warmerdam introduced the geospatial data abstraction library, which provides efficient mechanisms for accessing and transforming raster datasets into numerical arrays for computational processing [3]. This raster-to-matrix transformation allows geospatial imagery to be processed using scientific computing libraries and deep learning models, and it is particularly important when handling high-resolution aerial or satellite imagery.
Before applying deep learning models, image preprocessing techniques are often used to enhance feature visibility and reduce noise. Open Source Computer Vision Library (OpenCV) is one of the most widely used open-source computer vision libraries for image processing and analysis [4]. The library provides functions such as thresholding, edge detection, filtering, and morphological operations. These preprocessing techniques are frequently applied in remote sensing studies to improve object contrast and highlight structural patterns within imagery. However, traditional image processing methods alone are often insufficient for extracting complex spatial features from large-scale geospatial datasets.
In recent years, deep learning–based object detection models have significantly improved automated feature extraction capabilities. Redmon et al. proposed the YOLO framework [5], which performs object localization and classification simultaneously within a single neural network architecture. Compared with traditional region-proposal approaches, YOLO enables real-time detection while maintaining competitive accuracy. Later improvements such as YOLOv4 enhanced detection performance and computational efficiency under complex environmental conditions [6]. To train YOLO models, annotated datasets are required, and tools such as LabelImg are commonly used to generate bounding box annotations for supervised object detection tasks. However, bounding box detection may not accurately capture the precise boundaries of narrow or irregular structures such as drainage ditches.
To address this limitation, segmentation-based models have gained increasing attention. The Segment Anything Model (SAM) represents a foundation segmentation model capable of generalizing across multiple image domains [7]. SAM generates high-quality segmentation masks from simple prompts, significantly reducing manual annotation efforts. In remote sensing research, deep learning segmentation models have demonstrated strong capabilities for extracting fine spatial structures from high-resolution imagery [8].
Although previous studies have explored GIS processing, image preprocessing, object detection, and segmentation independently, few studies have integrated these technologies into a unified geospatial analysis framework. Therefore, this study proposes an integrated workflow that combines QGIS-based ditch baseline construction, GeoTIFF raster-to-matrix transformation, OpenCV image preprocessing, YOLO object detection with LabelImg annotation, and SAM segmentation. By integrating these technologies, the proposed framework aims to improve ditch detection accuracy and enhance spatial interpretation within GIS environments.
3. Methods
This study aims to develop an automated analysis framework by integrating QGIS and deep learning–based image recognition techniques to identify drop structures within irrigation canals. Because irrigation systems are widely distributed, traditional methods that rely on manual surveys or visual inspection of images are inefficient for large-scale analysis. Therefore, this study integrates QGIS spatial analysis and image recognition techniques to construct an automated drop-structure detection method.
First, QGIS was used to establish the spatial dataset of irrigation canals. Sampling points are then generated along the canal centerline at fixed intervals. Satellite images centered at each sampling point are exported as TIFF images, which serve as the input for the deep learning model. The YOLO object detection model is then used to identify objects in the images. Finally, spatial constraints are applied to determine potential drop locations, and the detected results are converted into geographic coordinates and exported as CSV files.
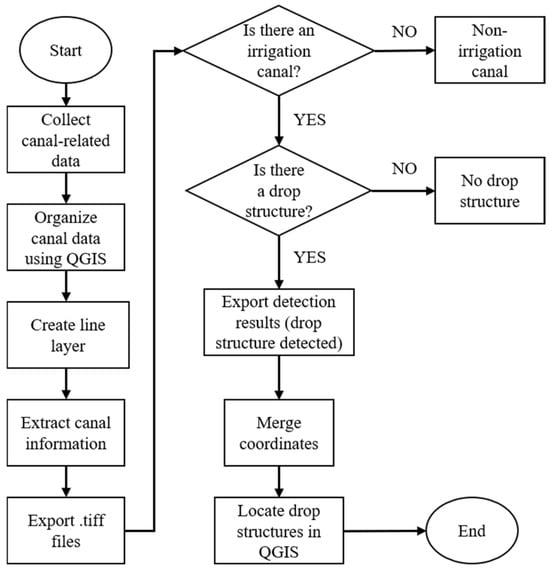
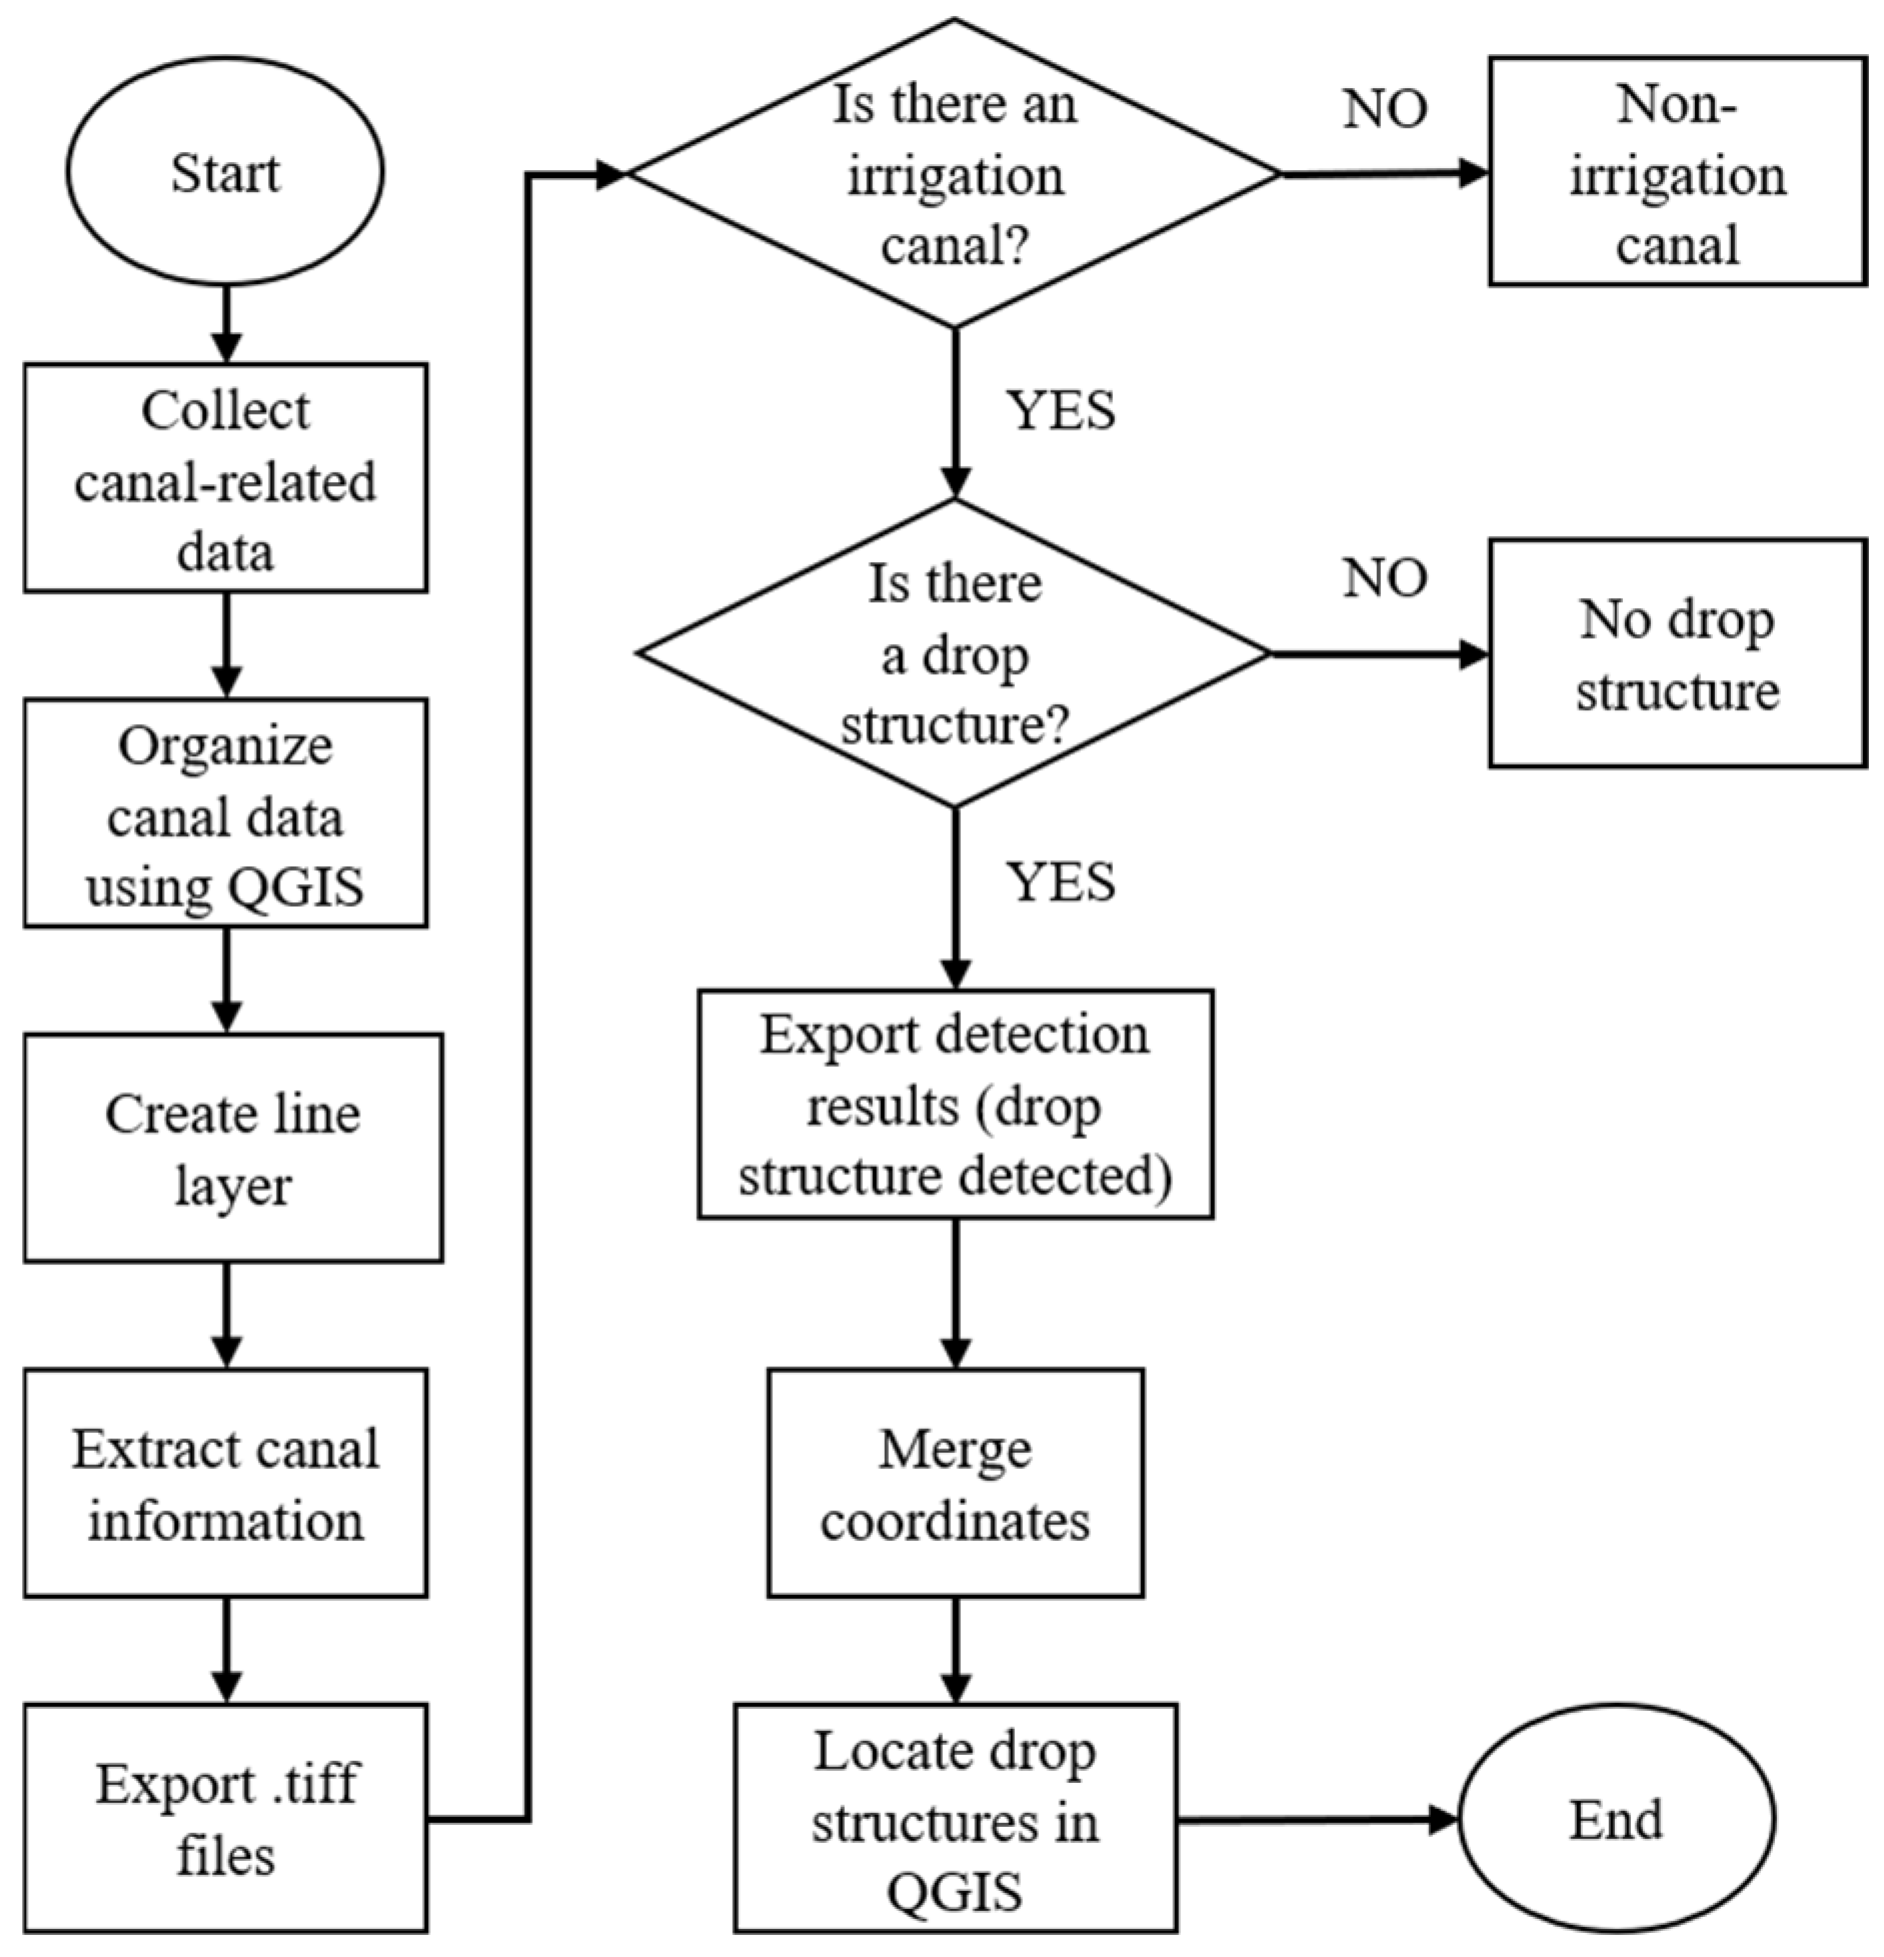
The overall research workflow of this study is shown in Figure 1. The process begins with collecting irrigation canal data and organizing the spatial information using QGIS. The canal centerline is then generated and used to extract canal segments for image export. The exported TIFF images are subsequently analyzed using the YOLO object detection model. Based on the detection results and spatial constraints, potential drop locations are identified and converted into geographic coordinates. Finally, the detected drop locations are integrated back into QGIS for further spatial analysis.
Figure 1.
Overall research workflow.
3.1. Canal Centerline and Sampling Point Generation
At the initial stage, irrigation canal data provided by the Water Resources Agency are imported into QGIS as the primary spatial dataset. For analytical purposes, the canal centerline is represented as a parameterized curve:
where represents the spatial position on the canal centerline, denotes the arc-length parameter along the canal, and is the total length of the canal. To analyze the canal, sampling points are generated along the canal centerline at a fixed interval Δ. When the sampling interval is defined as:
The set of sampling points is defined as
where the total number of sampling points is
The position along the canal for each sampling point is
Therefore, the geographic coordinate of each sampling point is
3.2. Canal Buffer Region
Drop structures usually occur near irrigation canals. Therefore, a buffer region is established around the canal centerline to constrain the detection area. The buffer distance is defined as
The canal buffer region is expressed as
If the center point of a detected object satisfies
the object is considered to be within 5 m of the canal.
3.3. SAM-Based Image Segmentation
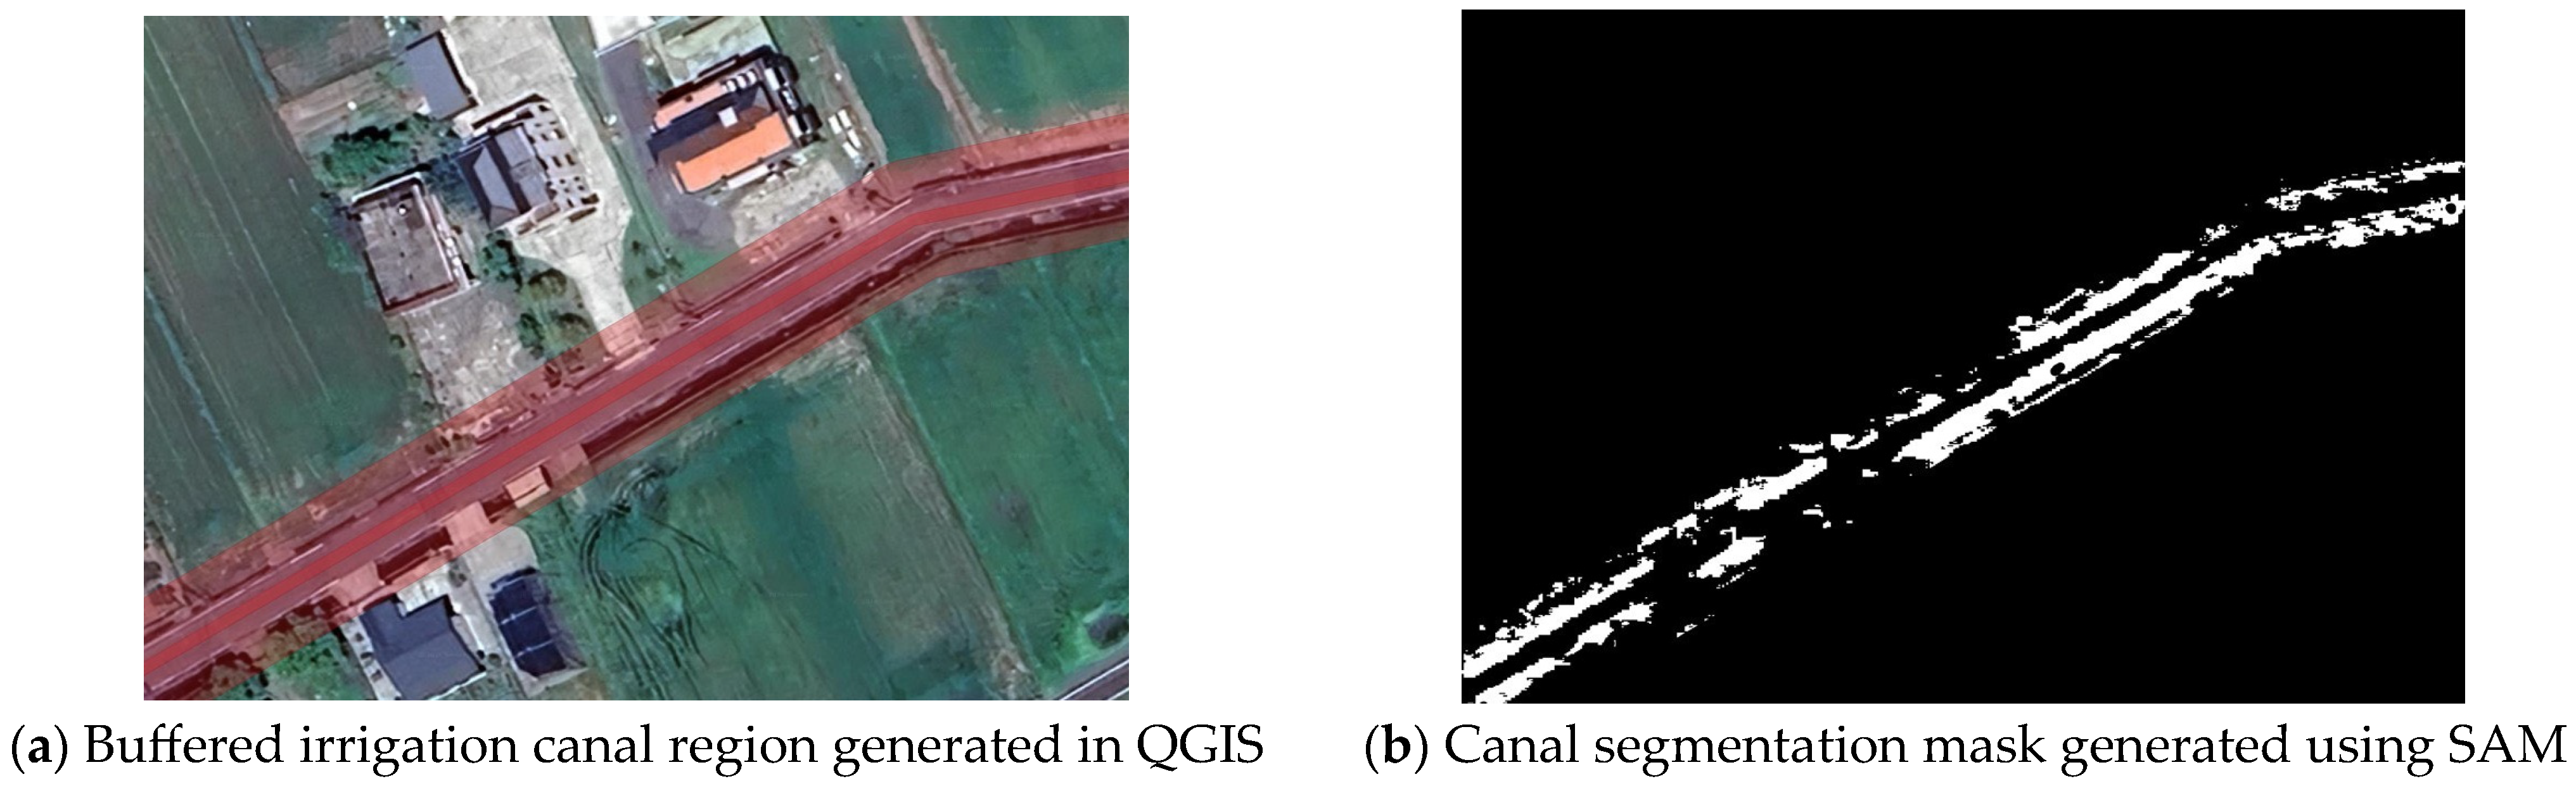
To improve the reliability of canal feature extraction from satellite imagery, this study incorporates SAM (version 1) as an image segmentation technique before object detection as shown in Figure 2. In the preprocessing stage, the irrigation canal region is first expanded in QGIS to create a buffer zone around the canal centerline. This buffer zone represents the potential area where drop structures may occur and serves as the primary spatial constraint in this study. The buffered canal region is then exported as a TIFF image and used as the input for the SAM segmentation process. SAM is applied to segment the canal-related regions from the surrounding background. Through this segmentation process, a binary mask image is generated, where the canal and water-related structures are highlighted while irrelevant background areas are suppressed. This mask helps to reduce visual noise caused by farmland textures, buildings, and other land-cover features. By combining the GIS-based buffer region with SAM segmentation results, a refined region of interest (ROI) is obtained. ROI focuses the subsequent YOLO object detection process on canal-related areas only. This preprocessing step enhances the robustness of the detection workflow by reducing false detections and improving the spatial consistency between detected objects and the actual canal structure.
Figure 2.
(a) An example of the buffered canal region generated in QGIS; (b) illustrates the segmentation mask produced by the SAM.
3.4. YOLO Object Detection
After exporting the images, the YOLO deep learning model is used to perform object detection on the TIFF images. The YOLO model can detect multiple objects in a single image and outputs bounding boxes for each detected object. Let the bounding Box of the -th detected object in image be
The model primarily detects objects that may be associated with drop structures, including farmland, houses, and bridges.
3.5. Spatial Constraints for Drop Detection
After object detection, spatial constraints are applied to determine potential drop locations. Since drop structures typically occur across the canal, the area around the canal is divided into two regions:
Two indicator variables are defined:
The drop detection variable is defined as with the following constraints:
which ensures
3.6. Drop Location Output
When , the object is identified as a valid drop structure. The center point of the YOLO bounding box is used as the drop location:
The image coordinate is then transformed into geographic coordinates using
Finally, the set of detected drop locations is exported as a CSV file for further processing.
4. Results
The TIFF images exported from QGIS were used as the input dataset for the YOLO object detection model. The model was used to identify objects around irrigation canals that may be related to drop structures, such as farmland, houses, and bridges. In the detection process, the YOLO model outputs the bounding box location and confidence score for each detected object. Based on the spatial constraints, potential drop structures are identified when the detected object satisfies the following conditions: (1) the center point of the object is located within a 5 m buffer zone from the central line of the canal and (2) the bounding box intersects both sides of the canal.
When these conditions are satisfied, the detected object is considered a potential drop structure. All valid detection results are recorded as coordinate data and exported into a comma-separated values (CSV) file. The CSV file contains the coordinate information of each potential drop location as well as the corresponding image index, which serves as the basis for further spatial analysis.
4.1. Drop Location Backtracking and Spatial Analysis
After obtaining the coordinate data from the CSV file, the drop location coordinates are imported back into QGIS for spatial referencing. Through this process, each detected coordinate can be mapped back to its corresponding location in the original imagery. Using the spatial positioning capability of QGIS, the corresponding areas in the images can be examined, and the actual drop structures can be manually selected and confirmed. This step allows the detected coordinates generated from the YOLO model to be compared with the actual irrigation canal structures visible in the images. Through this backtracking process, the detected coordinates are used to identify and mark the actual drop structure locations within the study area. Once all drop locations are confirmed, they can be visualized and analyzed within QGIS to observe the spatial distribution of drop structures across the entire irrigation canal network.
4.2. Spatial Distribution of Drop Structures
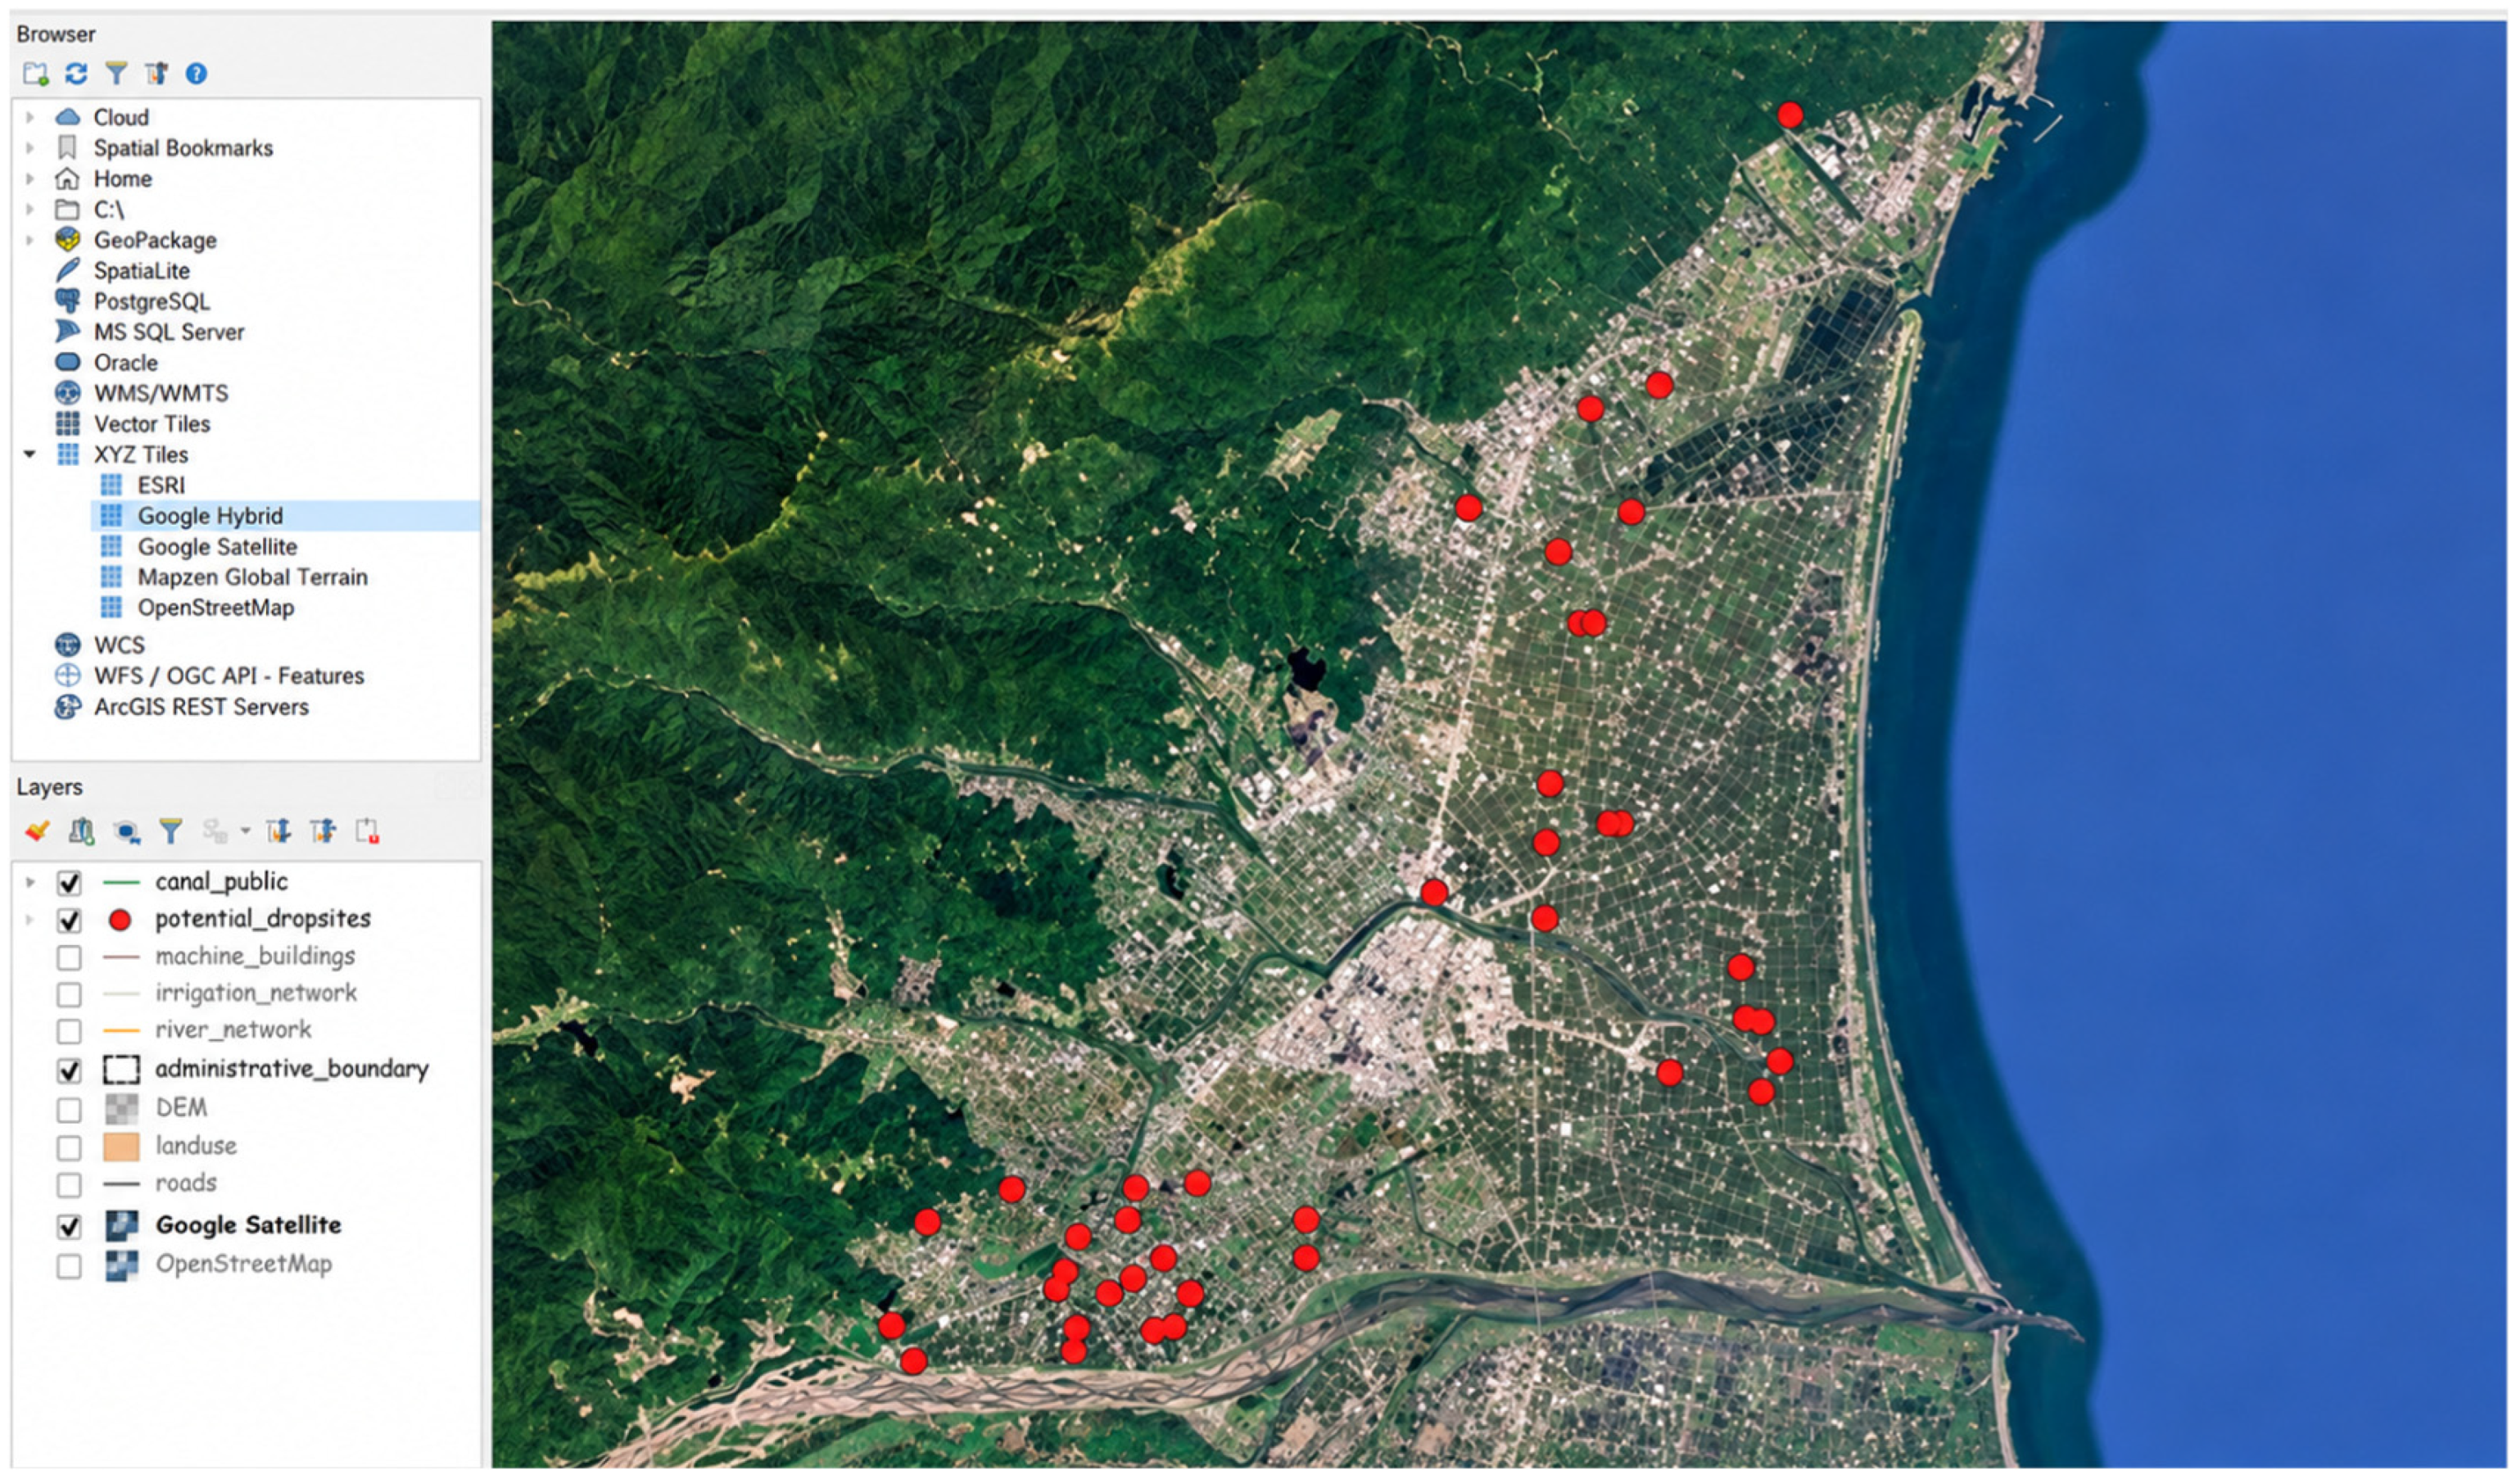
After importing the detected drop coordinates from the CSV file back into QGIS and completing the spatial selection process, the spatial distribution of drop structures across the study area can be visualized. Figure 3 shows the overall distribution of detected drop structures along the irrigation canal network. The results show that drop structures are mainly concentrated along major canal segments and intersections with surrounding infrastructure. This distribution pattern indicates that the proposed detection framework is capable of identifying potential drop locations over a large spatial extent.
Figure 3.
Spatial distribution of detected drop structures in the study area.
5. Conclusions
We proposed an automated approach for detecting drop structures in irrigation canals by integrating QGIS spatial analysis with YOLO deep learning object detection. Irrigation canal data were first processed in QGIS, and sampling points were generated along the canal centerline at fixed intervals. TIFF images centered on these sampling points were then exported and used as the input dataset for the YOLO model to detect objects related to canal infrastructure, such as farmland, houses, and bridges. Spatial constraints were applied so that only detected objects located within a 5 m buffer zone of the canal and intersecting both sides of the canal were considered potential drop structures. The detection results were exported as CSV coordinate data and imported back into QGIS to identify and mark the corresponding drop structure locations, allowing the overall spatial distribution of drop structures in the study area to be visualized. The results demonstrate that the proposed framework can effectively combine image recognition and spatial analysis to automatically identify potential drop locations within irrigation canals, significantly improving the efficiency of large-scale canal analysis. In future research, higher-resolution imagery obtained from unmanned aerial vehicles can be incorporated to improve detection accuracy and provide more detailed information about canal structures and terrain conditions.
Author Contributions
Conceptualization, K.-C.H., J.-Y.F. and C.-Y.C.; methodology, K.-C.H. and J.-Y.F.; software, J.-Y.F. and S.-J.H.; validation, K.-C.H., J.-Y.F. and S.-J.H.; formal analysis, K.-C.H., J.-Y.F. and S.-J.H.; investigation, W.-N.H.; data curation, J.-Y.F. and S.-J.H.; writing—original draft preparation, J.-Y.F.; writing—review and editing, K.-C.H.; visualization, J.-Y.F.; supervision, K.-C.H.; project administration, K.-C.H.; funding acquisition, K.-C.H. All authors have read and agreed to the published version of the manuscript.
Funding
This work was supported by the National Science and Technology Council (NSTC), Taiwan. [grant number: 114-2622-E-033-002-].
Institutional Review Board Statement
Not applicable.
Informed Consent Statement
Not applicable.
Data Availability Statement
The data presented in this study are not publicly available due to institutional and proprietary restrictions.
Conflicts of Interest
Author Chung-Yu Chen was employed by the company GuangTai Green Co., Ltd. The remaining authors declare that the research was conducted in the absence of any commercial or financial relationships that could be construed as a potential conflict of interest.
References
- Team, Q.D. QGIS Geographic Information System; Open Source Geospatial Foundation: Beaverton, OR, USA, 2025. [Google Scholar]
- Rosas-Chavoya, M.; Gallardo-Salazar, J.L.; López-Serrano, P.M.; Alcántara-Concepción, P.C.; León-Miranda, A.K. QGIS a constantly growing free and open-source geospatial software contributing to scientific development. Cuad. Investig. Geogr. 2022, 48, 197–213. [Google Scholar] [CrossRef] [Scilit]
- Warmerdam, F. The geospatial data abstraction library. In Open Source Approaches in Spatial Data Handling; Springer: Heidelberg, Germany, 2008; pp. 87–104. [Google Scholar]
- Bradski, G. The OpenCV Library. Dr. Dobb’s J. Softw. Tools 2000, 25, 120–125. [Google Scholar] [CrossRef] [Scilit]
- Redmon, J.; Divvala, S.; Girshick, R.; Farhadi, A. You only look once: Unified, real-time object detection. In Proceedings of the 2016 IEEE Conference on Computer Vision and Pattern Recognition, Las Vegas, NV, USA, 27–30 June 2016. [Google Scholar]
- Bochkovskiy, A.; Wang, C.-Y.; Liao, H.-Y.M. Yolov4: Optimal speed and accuracy of object detection. arXiv 2020. [Google Scholar] [CrossRef] [Scilit]
- Kirillov, A.; Mintun, E.; Ravi, N.; Mao, H.; Rolland, C.; Gustafson, L.; Xiao, T.; Whitehead, S.; Berg, A.C.; Lo, W.-Y. Segment anything. In Proceedings of the 2023 IEEE/CVF International Conference on Computer Vision, Paris, France, 1–6 October 2023. [Google Scholar]
- Ma, L.; Liu, Y.; Zhang, X.; Ye, Y.; Yin, G.; Johnson, B.A. Deep learning in remote sensing applications: A meta-analysis and review. ISPRS J. Photogramm. Remote Sens. 2019, 152, 166–177. [Google Scholar] [CrossRef] [Scilit]
Disclaimer/Publisher’s Note: The statements, opinions and data contained in all publications are solely those of the individual author(s) and contributor(s) and not of MDPI and/or the editor(s). MDPI and/or the editor(s) disclaim responsibility for any injury to people or property resulting from any ideas, methods, instructions or products referred to in the content. |
© 2026 by the authors. Licensee MDPI, Basel, Switzerland. This article is an open access article distributed under the terms and conditions of the Creative Commons Attribution (CC BY) license.