


Abstract
Voltage distortion and unbalance can increase induction-motor power losses, but their combined effect across load must be distinguished from time-based energy consumption. We reanalyzed 440 simultaneous electrical and mechanical measurements of a 1.1 kW three-phase motor under four supply regimes and eleven torque levels (0.50–3.00 N·m; approximately 16.5–98.8% of rated torque). Loss trajectories were described using cell means and 95% confidence intervals; a two-factor model was retained only as an exploratory within-dataset summary, because one motor was tested and the residual assumptions were violated. Mean voltage-unbalance factors were 0.74%, 0.26%, 9.00%, and 7.69% for balanced sinusoidal, balanced harmonic, unbalanced sinusoidal, and unbalanced harmonic supplies, respectively. Relative to balanced sinusoidal operation, the uniformly torque-weighted Simpson load-range loss index was 16.35% higher under balanced harmonic, 18.58% higher under unbalanced sinusoidal, and 33.11% higher under unbalanced harmonic supply. These percentages describe separation among loss curves over the tested torque interval, not an energy penalty for a field duty cycle.
1. Introduction
Three-phase induction motors are central to industrial drive systems; consequently, even modest reductions in operating efficiency can accumulate into substantial energy and cost penalties when exposure duration is considered. IEC 60034-2-1 specifies test methods for determining motor losses and efficiency, including input–output accounting for mains-fed machines [1]. In service, however, motors may operate away from rated load and under distorted or unbalanced voltages. These conditions alter phase currents, negative-sequence fields, rotor slip, and harmonic flux components, thereby increasing copper, iron, and stray-load losses and reducing useful shaft output [2,3,4,5].
Load and power quality must therefore be considered jointly when experimental efficiency is assessed. Sousa Santos et al. compared real-time efficiency-estimation methods under balanced and unbalanced, sinusoidal and harmonic supply conditions and showed that estimator performance depends on both load and supply quality [6]. Their open dataset contains simultaneous electrical and mechanical measurements from a 1.1 kW induction motor at eleven torque settings, with ten repetitions per setting [7,8]. Although the dataset was developed to assess efficiency-estimation methods, its paired input- and output-power measurements also permit a transparent reanalysis of total measured power loss.
Parametric identification, finite-element decomposition and efficiency maps have been used in previous loss studies [4,9,10,11,12]. These approaches address machine behavior in ways not covered by the present dataset. Here, numerical quadrature serves a narrower purpose: to summarize the separation among mean loss curves over a common torque interval. The integration variable is torque, so the resulting unit is W·N·m, not energy. The agreement between trapezoidal and Simpson estimates is employed only as a check of numerical stability.
The analysis is motivated by two further considerations. Voltage unbalance modifies the negative-sequence impedance and introduces load-dependent losses [13], whereas in situ estimators for unbalanced or simultaneously distorted and unbalanced supplies require machine parameters, symmetrical components, pretested data or additional signal processing [14,15,16]. Derating recommendations are also a function of the motor and the unbalance [17,18]. Direct measurements on the shaft decrease model dependence, but comparisons between loads still need to be explicitly defined and carefully interpreted.
This study presents a reproducible framework to (i) calculate total measured power loss and efficiency, (ii) describe how loss trajectories vary with supply condition and torque, (iii) compare trapezoidal and Simpson summaries of the eleven observed cell means, and (iv) examine descriptive associations between harmonic distortion and loss. The contribution is not a new motor test, a decomposition of individual loss mechanisms, or an estimate of field energy consumption. It is an auditable reanalysis of open measurements across four power-quality regimes. The source observations and reproducibility materials are provided in the Supplementary Materials.
2. Materials and Methods
2.1. Experimental Dataset
The analysis used the open dataset reported by Sousa Santos et al. [7] and archived by Sousa Santos [8]. The original experiments were conducted at Universidad de la Costa using a De Lorenzo DL 1021 three-phase induction motor (De Lorenzo S.p.A., Rozzano, Italy). The reported rated data were 1.1 kW, 220/380 V (Δ/Y), 4.4/2.6 A (Δ/Y), 3460 r/min, 60 Hz, and a power factor of 0.89 [7]. Electrical quantities were measured with a Fluke 435 power-quality and energy analyzer (Fluke Corporation, Everett, WA, USA). Torque and speed were measured with a De Lorenzo DL 1054TT brake-control unit and a DL 1019P magnetic-powder brake [7]. Electrical and mechanical measurements were recorded simultaneously after thermal stabilization. The source article reports that the test bench also included an adjustable voltage source, a variable-frequency drive, and a resistor, and that the four supply regimes were produced with this equipment; it does not state which device generated each individual regime [7]. The present study did not generate the supply regimes; it reanalyzed the measured values and experimental labels provided in the public source.
The dataset comprises balanced sinusoidal (BS), balanced harmonic (BH), unbalanced sinusoidal (US), and unbalanced harmonic (UH) regimes. Torque ranged from 0.50 to 3.00 N·m in 0.25 N·m increments. Using the rated power and speed reported in [7], the rated torque is approximately 3.04 N·m; thus, the tested range corresponds to approximately 16.5–98.8% of rated torque. Ten repetitions were available for each of the 44 regime–torque cells, yielding 440 observations. The voltage-unbalance factor (VUF) was computed from the line-to-line voltage phasors as 100|V2|/|V1|. Mean VUF values (observed ranges) were 0.74% (0.33–1.15%) for BS, 0.26% (0.03–0.59%) for BH, 9.00% (5.34–13.71%) for US, and 7.69% (4.42–12.32%) for UH. For the harmonic regimes, mean voltage THD was 2.86% (2.29–3.85%) for BH and 3.88% (3.09–5.35%) for UH; mean current THD was 9.88% and 16.02%, respectively. THD was not reported for BS or US in the source spreadsheet and was therefore not assigned a value of zero. These measured indices characterize the four labeled regimes and permit comparison with the unbalance considerations in IEC 60034-26 [18]. Figure 1 summarizes the analysis.
Figure 1.
Reproducible workflow from published measurements to power balance, descriptive cell summaries, exploratory factorial modeling, numerical quadrature, and engineering interpretation.
2.2. Power-Loss and Efficiency Calculations
For measurement i, total measured power loss was calculated directly from the input–output power balance:
where Pin and Pout are the measured electrical input and mechanical shaft output powers, respectively, in watts. Equation (1) is a direct input–output balance applied to the published measurements; it is not an IEC 60034-2-1 conformity test and yields no standardized efficiency classification. Efficiency was independently recalculated as
Ploss,i = Pin,i − Pout,i,
As a quality-control check, the published shaft power was compared with
where n is rotational speed in r/min and T is torque in N·m. The published Pout values were retained as authoritative because the torque column reports nominal set points with only two decimal places.
2.3. Statistical and Numerical Analysis
Means, standard deviations, and two-sided 95% t confidence intervals were calculated for every regime–torque cell. A balanced two-factor fixed-effects model was used only to summarize within-dataset variation associated with supply regime, torque category, and their interaction; partial η2 values were retained as descriptive effect-size measures. Because all observations came from one motor and Shapiro–Wilk and median-centered Levene diagnostics rejected residual normality and homoscedasticity, the model was not used for population-level inference. Interpretation therefore emphasizes cell means, confidence intervals, effect sizes, and physical trajectory consistency rather than p values.
For visualization only, we fitted a cubic polynomial to the mean loss curve of each regime. The fitted curves were not employed for numerical integrations. Instead, the composite trapezoidal and Simpson rules were used to directly summarize the eleven equally spaced observed means:
where h = 0.25 N·m, m = 10 subintervals, and yj is the mean loss at torque Tj. The resulting load-range loss index has units of W·N·m. It is not energy and does not incorporate operating time. Equal integration across torque implicitly gives equal weight to the tested torque interval; consequently, percentage differences between indices must not be interpreted as field energy penalties without a duty-cycle distribution. Spearman coefficients were used as descriptive measures of association between phase-averaged THD and loss within the harmonic observations.
3. Results
3.1. Descriptive Patterns
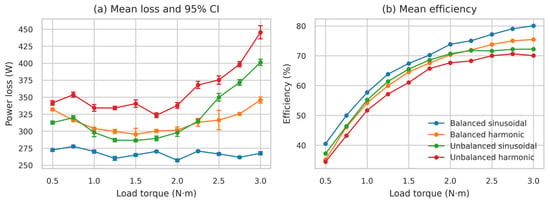
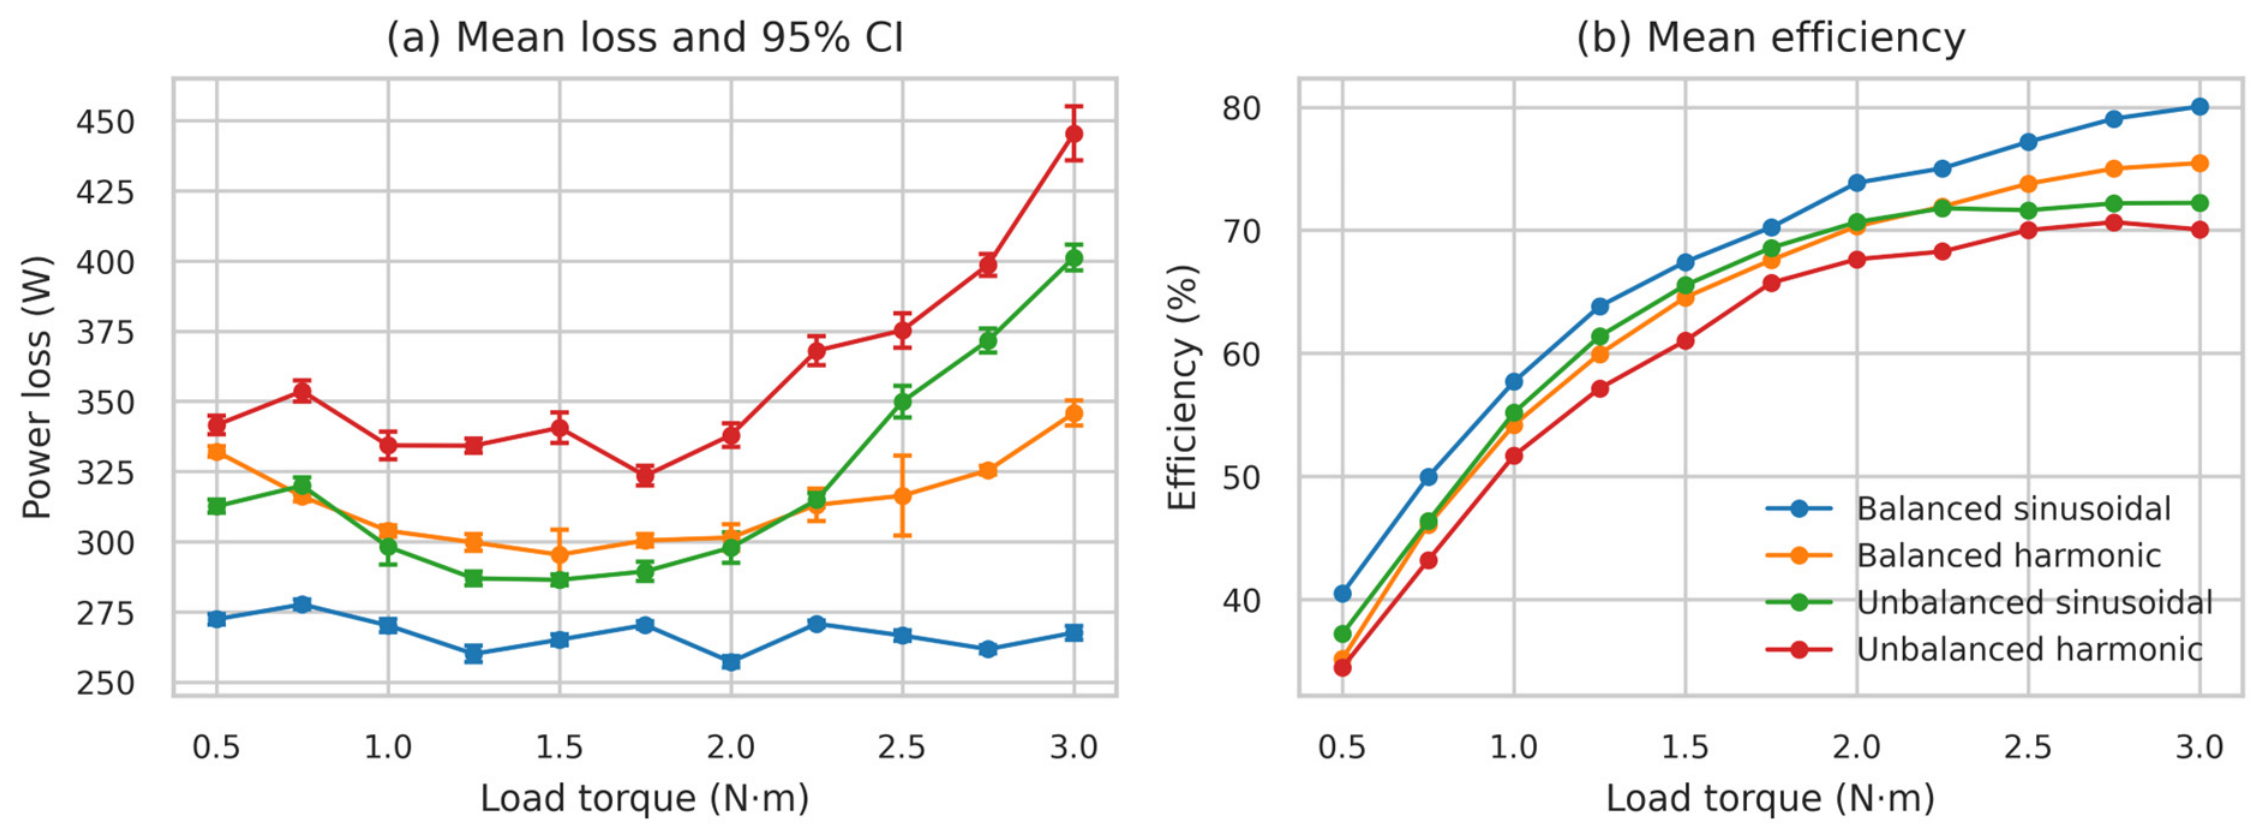
Power loss and efficiency separated progressively across the four supply regimes as torque increased (Figure 2). BS consistently produced the lowest losses and highest efficiency. At 3.00 N·m, mean loss increased from 267.58 W under BS to 345.77 W under BH, 401.17 W under US, and 445.41 W under UH. Relative to BS, the UH loss was 66.46% higher. Mean efficiency at the same torque decreased from 80.06% under BS to 75.46%, 72.22%, and 70.05% under BH, US, and UH, respectively. These maximum-torque values are summarized in Table 1.
Figure 2.
Performance across load torque. (a) Mean total power loss with 95% confidence intervals. (b) Mean efficiency from measured input and output power. Each point represents ten repetitions.
Table 1.
Mean performance at the maximum tested torque (3.00 N·m).
3.2. Factorial Effects
The exploratory factorial model attributed large proportions of within-dataset variation to supply regime (partial η2 = 0.968), torque (partial η2 = 0.924), and their interaction (partial η2 = 0.875). The interaction is consistent with the visibly different slopes of the loss trajectories across torque. However, residual normality and homoscedasticity were rejected, and the ten repetitions were obtained from a single motor. These results therefore describe the analyzed grid only; they do not establish between-motor or population-level significance. The cell means and 95% confidence intervals in Figure 2 provide the primary evidence.
3.3. Numerical Integration and THD
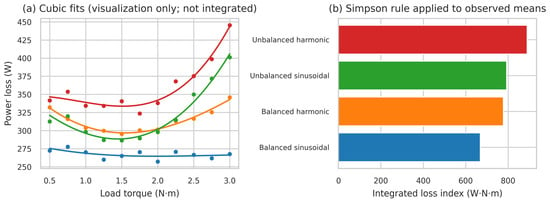
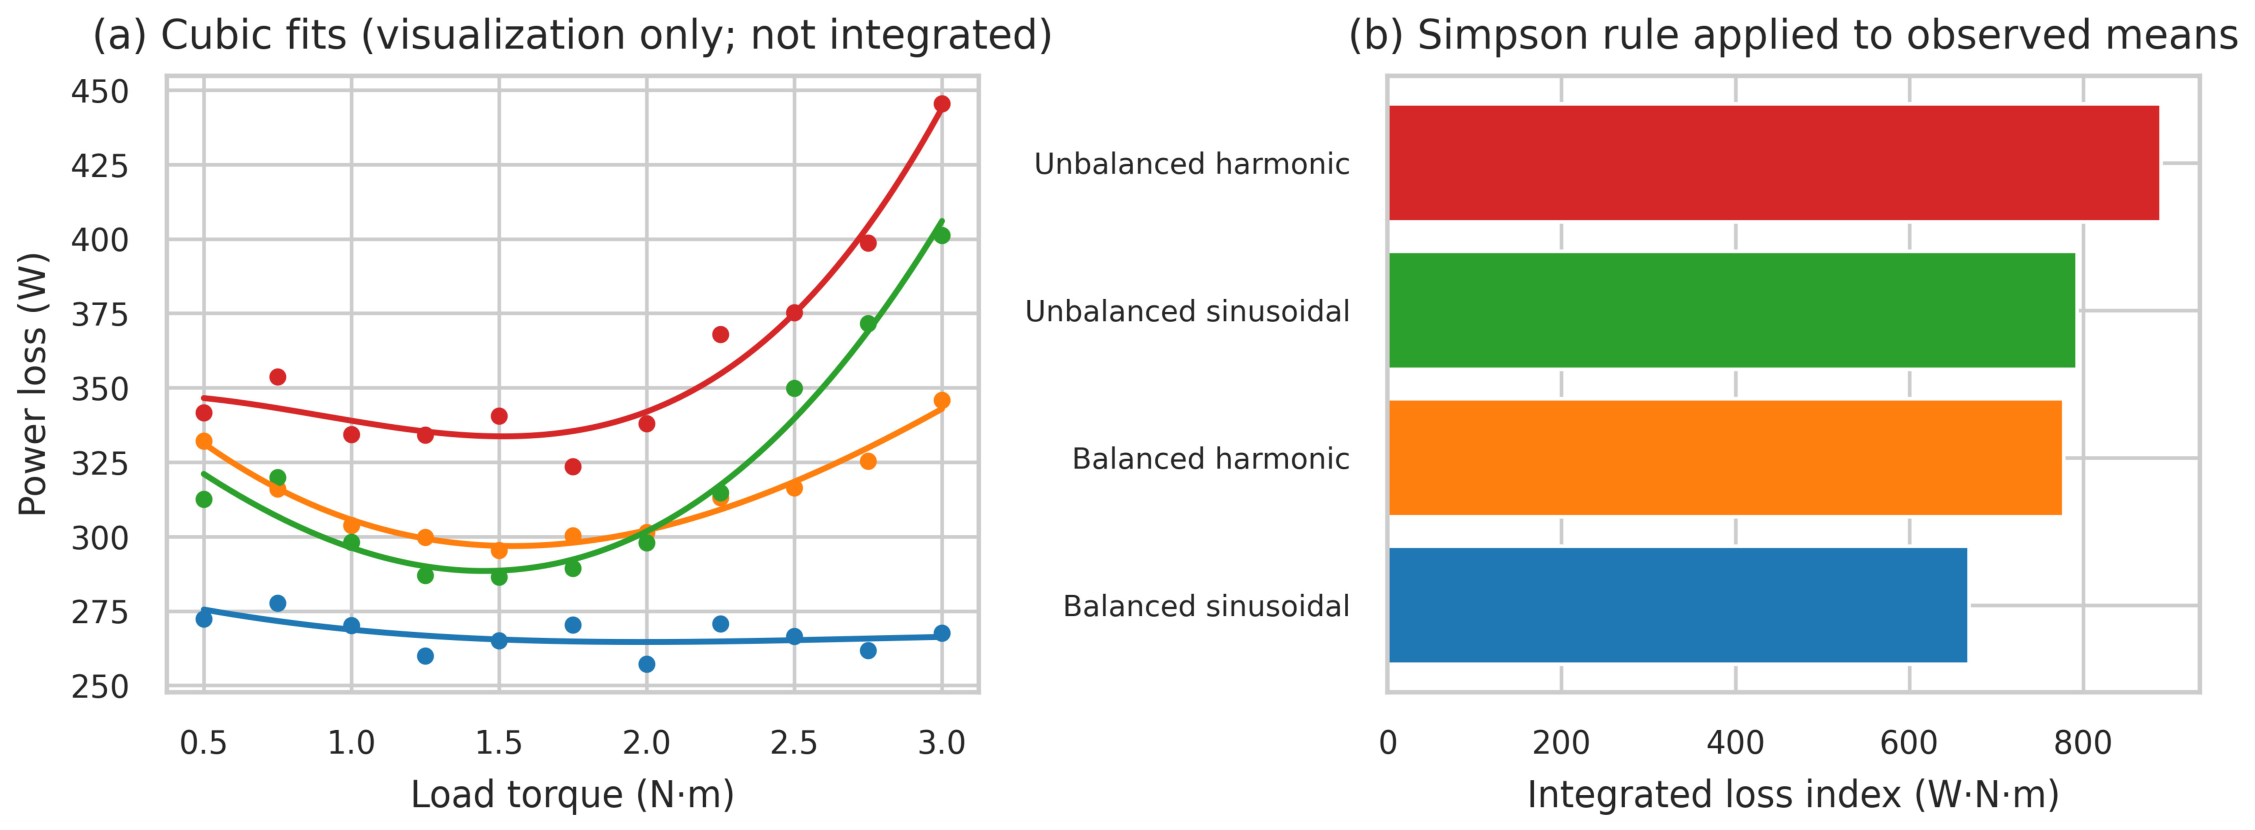
The trapezoidal and Simpson estimates differed in magnitude by no more than 0.14%, showing that the numerical summary was insensitive to the selected quadrature rule. The Simpson BS index was 668.30 W·N·m. Relative to BS, the uniformly torque-weighted index was 16.35% higher for BH, 18.58% higher for US, and 33.11% higher for UH (Table 2 and Figure 3). These percentages quantify separation among the measured loss trajectories over 0.50–3.00 N·m; they do not represent energy consumption under an observed duty cycle.
Table 2.
Numerically integrated loss indices over 0.50–3.00 N·m. Rule Δ (%) = 100 × (Simpson − trapezoid)/Simpson; vs. BS (%) uses the Simpson estimate.
Figure 3.
Numerical loss representation. (a) Cubic curves fitted to the eleven observed means for visualization only; the cubic curves were not integrated. (b) Uniformly torque-weighted Simpson load-range loss index calculated from the observed means.
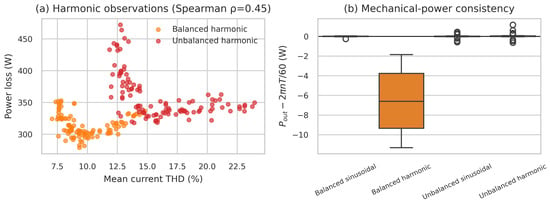
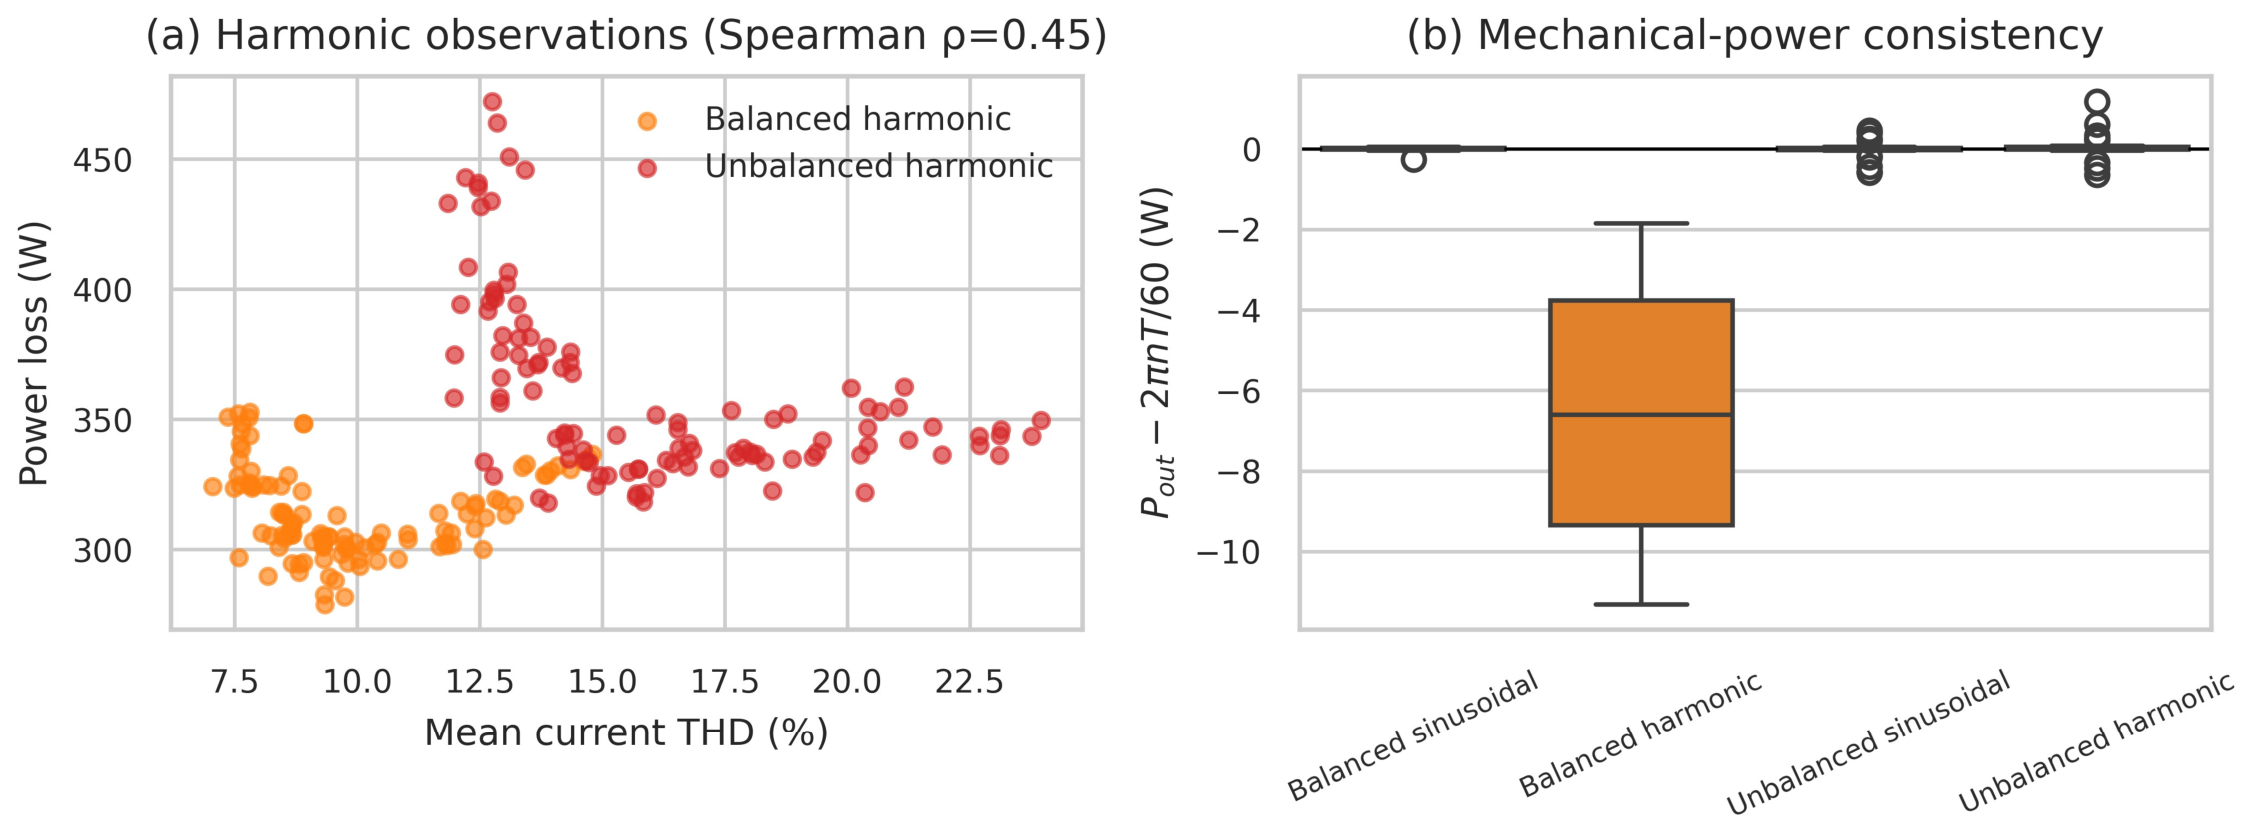
In harmonic observations, loss was positively correlated with mean current THD (Spearman ρ = 0.448) and mean voltage THD (ρ = 0.741). These coefficients are descriptive because torque and supply regime were varied together. The mechanical-power reconstruction agreed with the published Pout values to within 1.18 W for BS, US, and UH. For BH, the two quantities differed systematically: the ratio of published to reconstructed shaft power was 0.9896 with a standard deviation of 0.0001 across all 110 BH observations, whereas the same ratio was unity to within 0.01% for the other three regimes. The BH offset is therefore proportional to torque rather than constant, growing from 1.89 W at 0.50 N·m to 11.30 W at 3.00 N·m. It is not attributable to the two-decimal resolution of the displayed torque set point, which would produce a torque-independent deviation of at most 1.8 W. The origin of the offset cannot be established from the published variables. The directly measured Pout values were retained as authoritative, and Section 4.3 reports the sensitivity of the BH index to this choice (Figure 4).
Figure 4.
Secondary analyses. (a) Current THD versus total loss for harmonic regimes. (b) Difference between published shaft power and the value reconstructed from displayed torque and speed.
4. Discussion
4.1. Physical and Numerical Interpretation
The loss trajectories cannot be represented by a single load-independent derating factor. Supply regime explained much of the variation within the dataset, and the regime–torque interaction showed that deterioration accelerated differently across the tested range. At 3.00 N·m, UH increased the mean loss by 177.83 W compared with BS and reduced the efficiency by 10.00 percentage points. Mean speed under BS at the same nominal torque was 3419.3 r/min, while under UH it was 3315.7 r/min. At the same nominal torque, the lower measured speed contributes mathematically to the lower reconstructed mechanical output under the unbalanced regimes through Pout = 2πnT/60; however, causality cannot be established from this reanalysis. The pattern is consistent with harmonic-frequency-dependent losses and negative-sequence fields caused by voltage unbalance [2,3,4,5,13,17,18].
The load-range loss index is a numerical summary, not an energy metric. Pointwise comparisons describe individual operating conditions, whereas the integral summarizes the observed mean trajectory over a common torque interval. The 33.11% UH result therefore means that the uniformly torque-weighted loss index was 33.11% higher than the BS index; it does not mean that a motor would consume 33.11% more energy in service. An energy comparison would require the time spent at each load. The close BH and US indices (777.59 and 792.44 W·N·m) arise through different mechanisms: BH had low mean VUF (0.26%) but measurable voltage THD (2.86%), whereas US had no reported THD but a substantially higher mean VUF (9.00%). Their integrated losses were numerically similar even though their measured power-quality signatures were not equivalent. The proximity of the two indices also reflects a crossing. Mean US loss was below mean BH loss at most torques between 0.50 and 2.00 N·m, by up to 19.52 W, and rose above it from 2.25 N·m onward, exceeding it by 55.40 W at 3.00 N·m. Uniform weighting over the tested interval therefore offsets the two segments, which is why the indices differ by only 2.23 percentage points (16.35% versus 18.58%) while the pointwise increases at 3.00 N·m differ by more than 20 (29.22% versus 49.93%).
The ordering of the regimes agrees with evidence that unbalance penalties depend on negative-sequence impedance and load [13,17,18]. Efficiency estimators for unbalanced or distorted supplies may combine machine models, symmetrical components, or pretested motor data [14,15,16]. In the present reanalysis, measured input and shaft powers serve the narrower purpose of quantifying trajectory separation over the observed torque range. The index complements, rather than replaces, pointwise efficiency and motor-specific derating assessments.
4.2. Engineering Implications
Table 3 translates the numerical results into evidence-bounded engineering interpretations. UH had the highest pointwise loss and the highest uniformly weighted load-range index. Nevertheless, the analysis does not define a universal alarm threshold or prescribe a specific correction solely from the regime label. The dataset contains four categorical experimental conditions rather than continuous sweeps of VUF and THD, and it provides no operating-time distribution. Field application therefore requires measured power-quality indices, the actual duty cycle, and motor-specific thermal and acceptance limits.
Table 3.
Engineering interpretation of the four tested supply regimes.
4.3. Limitations and Reproducibility
Several limitations bound the interpretation. Ploss is total measured loss; the dataset does not resolve stator copper, rotor copper, core, mechanical, and stray-load components separately. Integration with respect to torque produces W·N·m, not energy. Conversion to Wh would require an operating-time distribution. The equal torque spacing imposes uniform weighting over the tested interval, which may not represent a field duty cycle. THD associations are confounded by torque and regime. In addition, the failed residual assumptions and the BH power-reconstruction discrepancy preclude claims of high inferential precision. Recomputing the BH loss curve from reconstructed rather than published shaft power lowers its Simpson index from 777.59 to 761.14 W·N·m and its increase relative to BS from 16.35% to 13.89%; the BS, US, and UH indices are unaffected. The replicated measurements, narrow cell intervals, large descriptive effects, and coherent trajectories nevertheless support the within-dataset comparison.
This balanced experimental grid is summarized by the fixed-effects model, but between-motor variability was not quantified because only one motor was tested. The cubic fits were used only for visualization; all quadrature calculations used the observed cell means. The analysis can be reproduced from the public spreadsheet, with explicit formulas, intermediate tables, and accompanying notebook. Generalization will require measurements from multiple motors and models that take into account variability at the motor level.
5. Conclusions
A reproducible reanalysis of 440 measurements from a single 1.1 kW motor showed that its power loss varied with both supply quality and load; the findings are not generalized to induction motors as a class. The Simpson load-range index with uniform torque weighting was 16.35% greater than BS under BH, 18.58% greater under US and 33.11% greater under UH. At 3.00 N·m, the mean loss increased by 66.46% and the efficiency decreased by 10.00 percentage points for UH. The trapezoidal and Simpson estimates differed by no more than 0.14%. These results summarize the torque interval tested and are not energy penalties for a field duty cycle. The index should therefore be used alongside pointwise efficiency, measured VUF and THD, motor-specific limits, and an actual operating-time distribution when energy implications are required.
Supplementary Materials
The following supporting information can be downloaded at https://www.mdpi.com/article/10.3390/engproc2026158009/s1, Supplementary Materials File S1.xlsx contains the 440 source observations used in the reanalysis. The accompanying Google Colab notebook reproduces data cleaning, descriptive statistics, exploratory modeling, numerical integration, tables, and figures.
Author Contributions
Conceptualization, C.D.Q.-P., E.L.G.-L., W.A.H.-O. and P.J.V.-C.; methodology, C.D.Q.-P. and E.L.G.-L.; software, C.D.Q.-P.; validation, E.L.G.-L., W.A.H.-O. and P.J.V.-C.; formal analysis, C.D.Q.-P.; investigation (limited to reanalysis and curation of the published dataset [7,8]), C.D.Q.-P.; writing—original draft preparation, C.D.Q.-P.; writing—review and editing, E.L.G.-L., W.A.H.-O. and P.J.V.-C.; visualization, C.D.Q.-P.; supervision, E.L.G.-L., W.A.H.-O. and P.J.V.-C. All authors have read and agreed to the published version of the manuscript.
Funding
This research received no external funding.
Institutional Review Board Statement
Not applicable.
Informed Consent Statement
Not applicable.
Data Availability Statement
The analyzed dataset is publicly available at https://doi.org/10.17632/t4p2wxmm5j.1. No new experimental data were generated.
Acknowledgments
The authors acknowledge the original dataset contributors for making the experimental measurements openly available.
Conflicts of Interest
The authors declare no conflicts of interest.
References
- IEC 60034-2-1:2024; Rotating Electrical Machines—Part 2-1: Standard Methods for Determining Losses and Efficiency from Tests (Excluding Machines for Traction Vehicles). International Electrotechnical Commission: Geneva, Switzerland, 2024.
- Hsu, J.S.; Kueck, J.D.; Olszewski, M.; Casada, D.A.; Otaduy, P.J.; Tolbert, L.M. Comparison of induction motor field efficiency evaluation methods. IEEE Trans. Ind. Appl. 1998, 34, 117–125. [Google Scholar] [CrossRef] [Scilit]
- Lu, B.; Habetler, T.G.; Harley, R.G. A nonintrusive and in-service motor-efficiency estimation method using air-gap torque with considerations of condition monitoring. IEEE Trans. Ind. Appl. 2008, 44, 1666–1674. [Google Scholar] [CrossRef] [Scilit]
- Jiang, M.; Tian, J.; Goh, H.H.; Yi, J.; Li, S.; Zhang, D.; Wu, T. Experimental study on the influence of high-frequency PWM harmonics on the losses of induction motor. Energy Rep. 2022, 8, 332–342. [Google Scholar] [CrossRef] [Scilit]
- Nasir, B. Determination of the harmonic losses in an induction motor fed by an inverter. Eng. Technol. Appl. Sci. Res. 2022, 12, 9536–9545. [Google Scholar] [CrossRef] [Scilit]
- Sousa Santos, V.; Cabello Eras, J.J.; Sagastume Gutiérrez, A.; Cabello Ulloa, M.J. Assessment of the energy efficiency estimation methods on induction motors considering real-time monitoring. Measurement 2019, 136, 237–247. [Google Scholar] [CrossRef] [Scilit]
- Sousa Santos, V.; Cabello Eras, J.J.; Sagastume Gutiérrez, A.; Cabello Ulloa, M.J. Data to support the assessment of the energy efficiency estimation methods on induction motors considering real-time monitoring. Data Brief 2020, 30, 105512. [Google Scholar] [CrossRef] [Scilit] [PubMed]
- Sousa Santos, V. Data for: Data to Support the Assessment of the Energy Efficiency Estimation Methods on Induction Motors Considering Real-Time Monitoring; Mendeley Data; Elsevier B.V.: Amsterdam, The Netherlands, 2020; Version 1. [Google Scholar] [CrossRef]
- Stiscia, O.; Rubino, S.; Vaschetto, S.; Cavagnino, A.; Tenconi, A. Accurate induction machines efficiency mapping computed by standard test parameters. IEEE Trans. Ind. Appl. 2022, 58, 3522–3532. [Google Scholar] [CrossRef] [Scilit]
- Roshandel, E.; Mahmoudi, A.; Kahourzade, S.; Soong, W.L. Efficiency maps of electrical machines: A tutorial review. IEEE Trans. Ind. Appl. 2023, 59, 1263–1272. [Google Scholar] [CrossRef] [Scilit]
- Zhang, D.; Yi, J.; Li, X.; Liu, T.; Zhao, H.; Zhang, Y.; Wu, T. Core loss equivalent resistance modeling of small- and medium-sized converter-fed induction motors considering supply and spatial harmonics. IEEE Trans. Ind. Electron. 2023, 70, 8768–8776. [Google Scholar] [CrossRef] [Scilit]
- Kumar, R.; Sah, B.; Kumar, P. Stray loss formulation for inverter-driven induction motors for a wide range of switching frequency and motor’s loading. IEEE Trans. Ind. Electron. 2024, 71, 2385–2394. [Google Scholar] [CrossRef] [Scilit]
- Donolo, P.D.; Bossio, G.R.; De Angelo, C.H. Analysis of voltage unbalance effects on induction motors with open and closed slots. Energy Convers. Manag. 2011, 52, 2024–2030. [Google Scholar] [CrossRef] [Scilit]
- Siraki, A.G.; Pillay, P. An in situ efficiency estimation technique for induction machines working with unbalanced supplies. IEEE Trans. Energy Convers. 2012, 27, 85–95. [Google Scholar] [CrossRef] [Scilit]
- Siraki, A.G.; Gajjar, C.S.; Khan, M.A.; Barendse, P.; Pillay, P. An algorithm for nonintrusive in situ efficiency estimation of induction machines operating with unbalanced supply conditions. IEEE Trans. Ind. Appl. 2012, 48, 1890–1900. [Google Scholar] [CrossRef] [Scilit]
- Al-Badri, M.; Pillay, P.; Angers, P. A novel in situ efficiency estimation algorithm for three-phase induction motors operating with distorted unbalanced voltages. IEEE Trans. Ind. Appl. 2017, 53, 5338–5347. [Google Scholar] [CrossRef] [Scilit]
- Faiz, J.; Ebrahimpour, H. Precise derating of three-phase induction motors with unbalanced voltages. Energy Convers. Manag. 2007, 48, 2579–2586. [Google Scholar] [CrossRef] [Scilit]
- IEC 60034-26:2006; Rotating Electrical Machines—Part 26: Effects of Unbalanced Voltages on the Performance of Three-Phase Cage Induction Motors. International Electrotechnical Commission: Geneva, Switzerland, 2006.



Disclaimer/Publisher’s Note: The statements, opinions and data contained in all publications are solely those of the individual author(s) and contributor(s) and not of MDPI and/or the editor(s). MDPI and/or the editor(s) disclaim responsibility for any injury to people or property resulting from any ideas, methods, instructions or products referred to in the content. |
© 2026 by the authors. Licensee MDPI, Basel, Switzerland. This article is an open access article distributed under the terms and conditions of the Creative Commons Attribution (CC BY) license.