


Abstract
Higher-education assessment combines heterogeneous indicators whose interactions are difficult to interpret using a single deterministic score. This study develops an interpretable artificial intelligence (AI) workflow that integrates Pearson correlation analysis, a study-specified Bayesian network, and multiple linear regression to infer a composite institutional score from faculty qualifications, infrastructure, research output, and student outcomes. Data from Latin American universities included in the QS World University Rankings, Times Higher Education (THE) World University Rankings, and Academic Ranking of World Universities (ARWU) between 2013 and 2023 were harmonized at the conceptual-dimension level by grouping semantically related provider fields without treating their definitions or weights as equivalent. The correlation matrix showed that the institutional score was most strongly associated with faculty qualifications () and research output (), whereas infrastructure and student outcomes both exhibited correlations of . The directed acyclic graph represented two complementary pathways toward institutional performance: a research pathway and a student-outcomes pathway, while preserving the conditional dependencies specified among the upstream indicators. On the held-out test set, the regression model achieved a coefficient of determination of , a mean squared error (MSE) of 10.1330, and a root mean squared error (RMSE) of 3.1832 score points. The supporting literature search provides the methodological basis for indicator selection and model interpretation, while the empirical workflow assigns distinct roles to probabilistic inference and numerical prediction. These results support probabilistic and auditable decision support for analyzing complex higher-education indicators, without establishing causal effects.
1. Introduction
Higher-education institutions are evaluated through indicator systems that combine research, teaching, resources, international visibility, and student-related outcomes. Global rankings such as the QS World University Rankings, Times Higher Education (THE), and the Academic Ranking of World Universities (ARWU) summarize selected dimensions through provider-specific indicators and aggregate scores. Because the indicators are correlated and are produced under different measurement rules, a final score is not merely the sum of independent observations. It is a complex indicator whose interpretation requires models that represent predictive relationships and uncertainty [1,2,3].
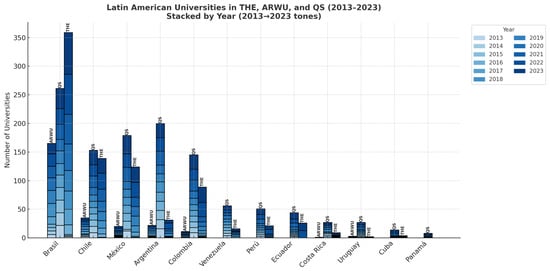
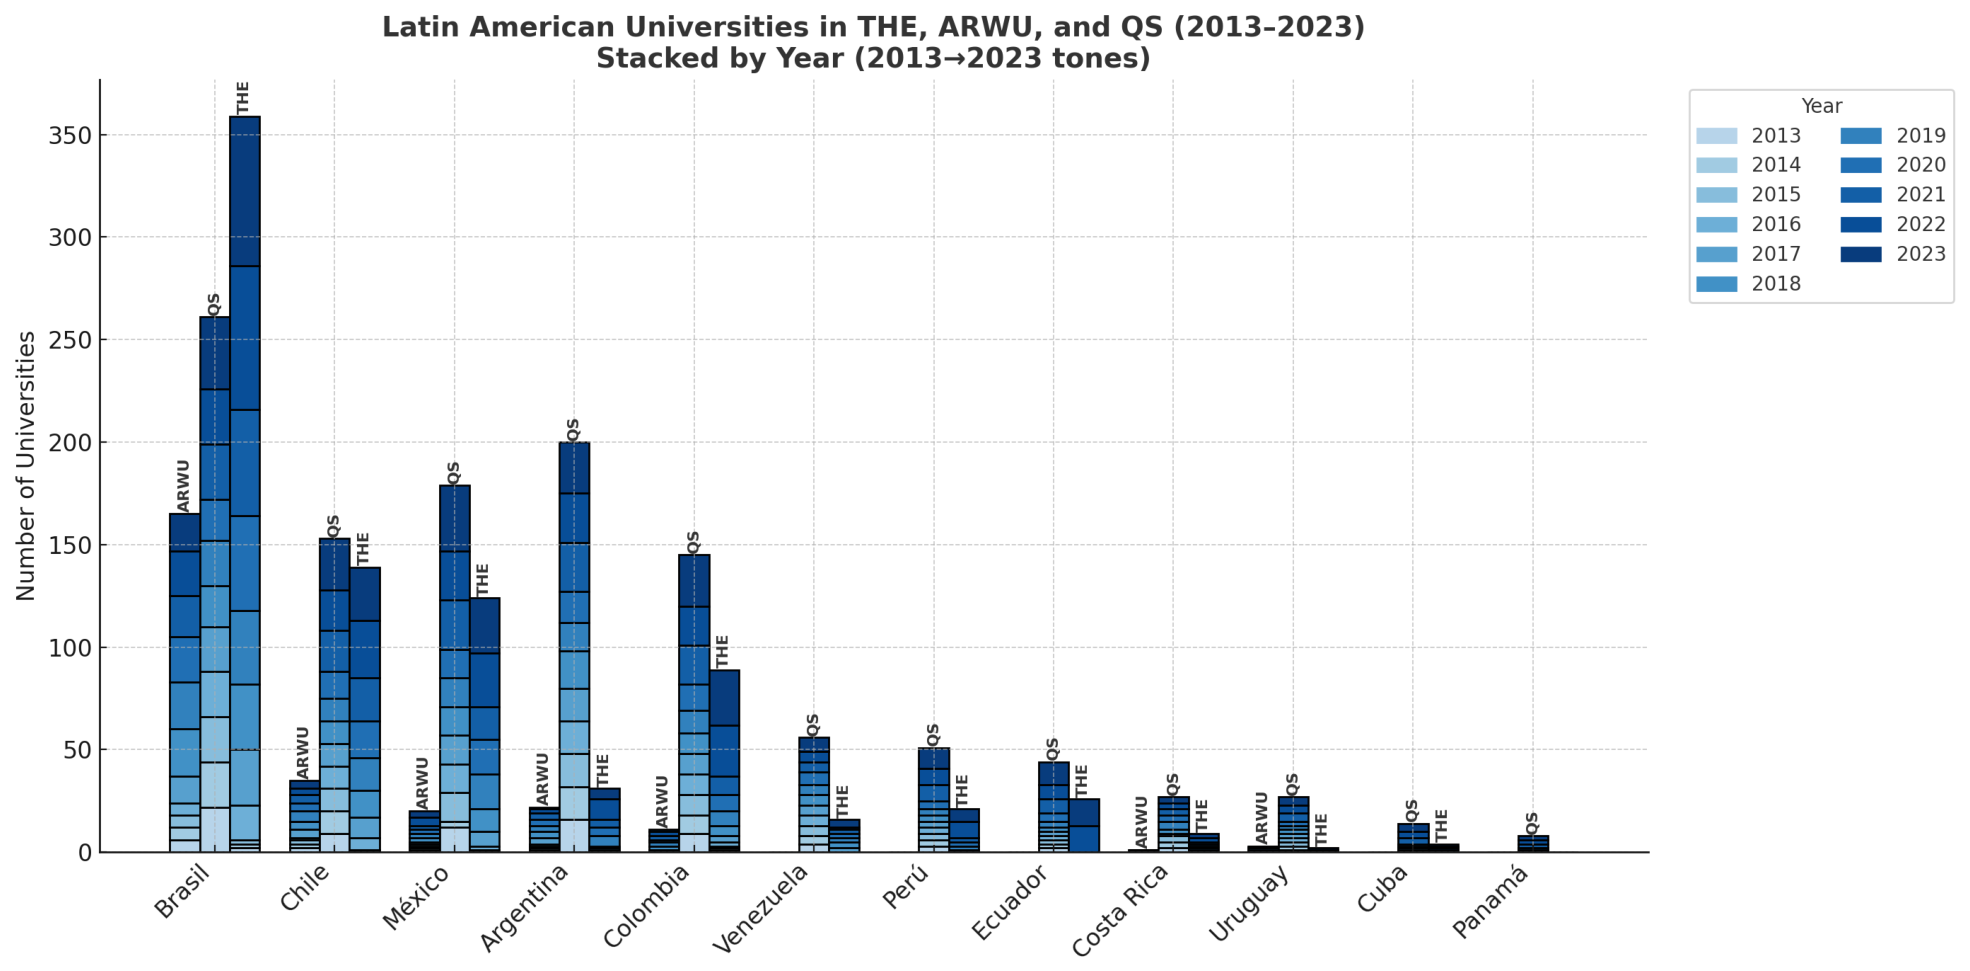
This problem is particularly relevant in Latin America. Figure 1 summarizes university appearances accumulated by country and year in THE, ARWU, and QS from 2013 to 2023. The distribution is strongly unbalanced: Brazil dominates all three systems, while Mexico, Argentina, Chile, and Colombia form a second group and Ecuador has substantially fewer observations. The bars represent university–year appearances rather than a count of unique institutions. Consequently, regional modeling must address not only heterogeneous indicators but also an uneven observational base. This imbalance motivates a method that is interpretable at the variable level and cautious about generalization across national contexts.
Figure 1.
Latin American university appearances in THE, ARWU, and QS by country and year, 2013–2023. Each colored segment represents one year.
Machine learning offers tools for extracting structure from multivariate educational data, but a purely predictive model can obscure the mechanism by which indicators are related. Bayesian networks address this limitation by representing a joint probability distribution as a directed acyclic graph (DAG). The graph makes conditional-dependence assumptions explicit and supports inference after evidence is observed [4,5,6]. Their use for relevance analysis and composite indicators in higher education has shown that probabilistic graphical models can support transparent institutional decision making [7]. Linear regression, in turn, provides a directly testable numerical baseline, interpretable coefficients, and established error metrics. Keeping explanation, probabilistic dependence, and out-of-sample prediction conceptually distinct is essential when evaluating such models [8].
The technical contribution is an auditable integration of association analysis, probabilistic graphical modeling, and out-of-sample prediction. Unlike an undifferentiated combination of predictive models, the workflow assigns a separate analytical role to each component: correlation describes marginal association, the Bayesian network states conditional-dependence assumptions and supports evidence updating, and regression provides a held-out numerical benchmark. The study asks how these complementary methods can clarify the relationships among complex higher-education indicators while preserving a clear distinction between predictive association and causality.
2. Materials and Methods
2.1. Data Sources and Literature Selection
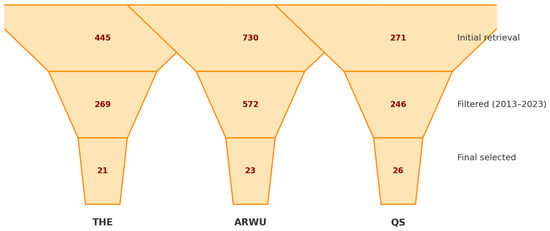
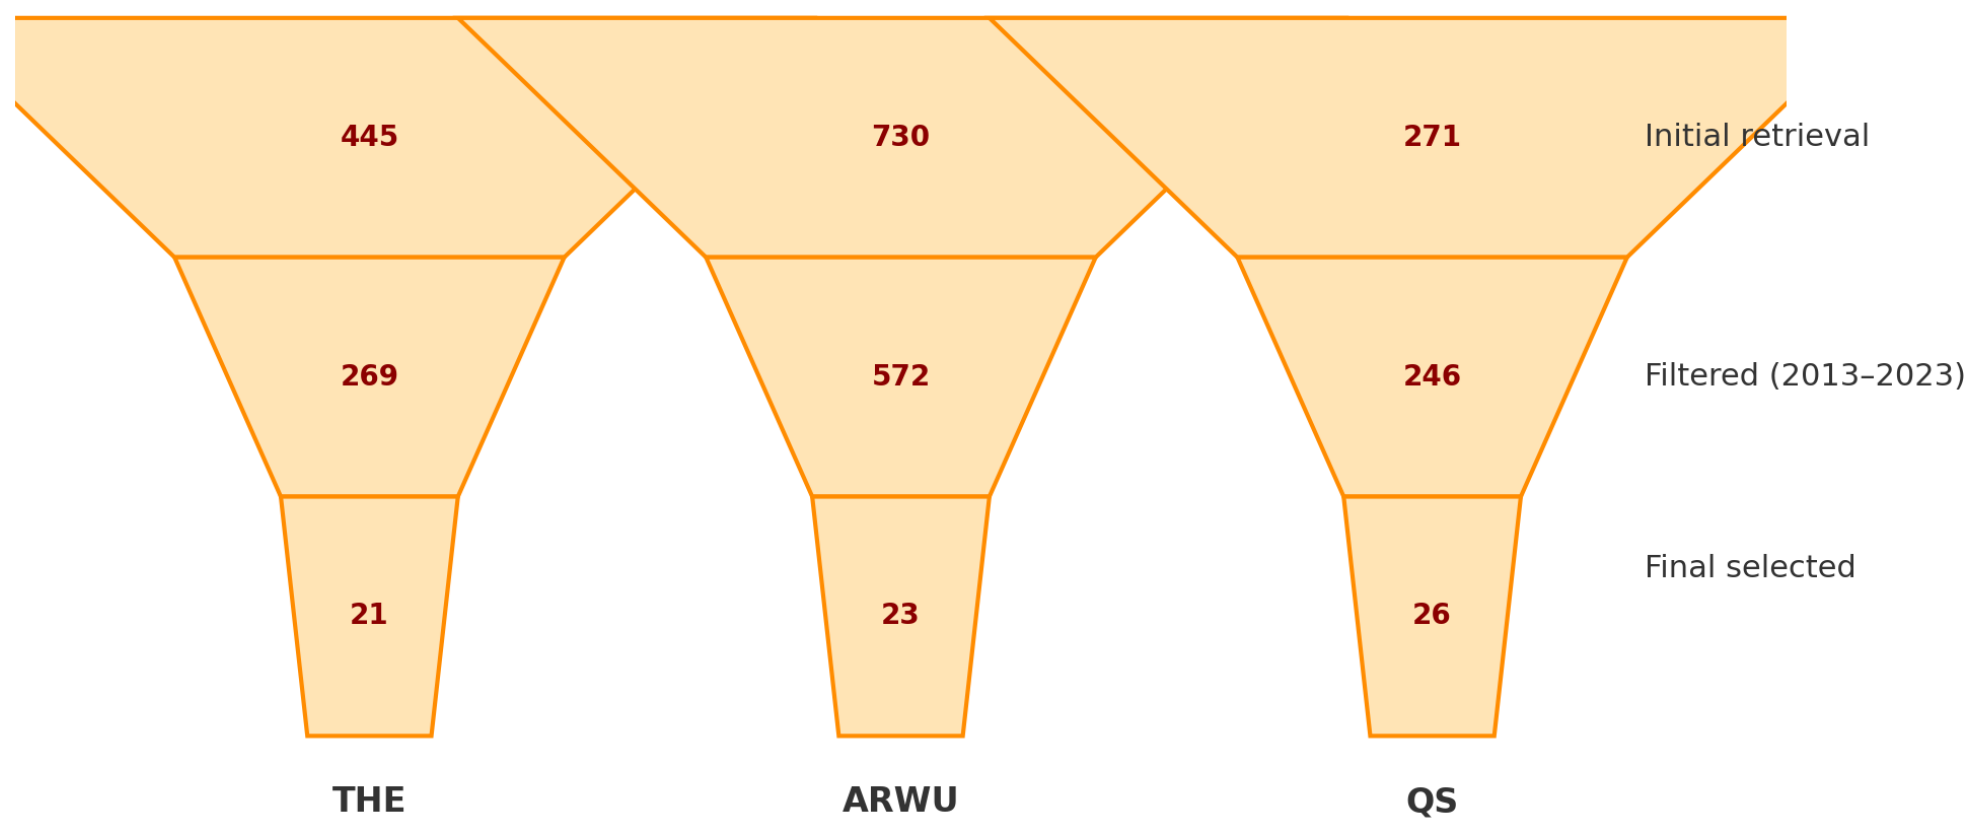
The empirical corpus comprised public ranking records for Latin American universities in QS, THE, and ARWU during 2013–2023, interpreted according to the corresponding published methodologies [9,10,11]. Ranking tables were manually consolidated into source-specific staging files. A complementary Scopus search identified literature on ranking indicators, higher-education evaluation, and analytical methods. The screening process is reported in Figure 2. Initial retrieval produced 445 THE-related, 730 ARWU-related, and 271 QS-related records. After the temporal filter, 269, 572, and 246 records remained, respectively. Full relevance screening retained 21 THE, 23 ARWU, and 26 QS publications, for a final corpus of 70 studies from 1446 initial records. Thus, the overall retention rate was 4.84%; the source-specific rates were 4.72% for THE, 3.15% for ARWU, and 9.59% for QS. The funnel is used to document selection transparency, following the logic of reproducible evidence screening [12].
Figure 2.
Funnel for selecting literature associated with the three ranking systems, 2013–2023.
This was a structured supporting literature search rather than a systematic review used for evidence synthesis or meta-analysis. The selected studies provided methodological context for defining the analytical dimensions, distinguishing probabilistic inference from prediction, and interpreting the limitations of composite indicators. The review did not provide empirical observations, determine numerical weights, or estimate model parameters; those functions were performed by the ranking-data workflow.
2.2. Preprocessing and Indicator Harmonization
The ranking tables were loaded into Python 3 (Google Colab) and processed with pandas and numpy. The pipeline removed duplicated institution–year records, standardized country and institution labels, stripped nonnumeric symbols from score fields, converted compatible variables to numeric form, and retained Latin American observations. Records missing essential response or identifier fields were excluded; remaining numeric gaps were imputed with the median calculated within the corresponding source dataset. These operations prevented score scales and missing-value codes from being interpreted as valid measurements.
Because QS, THE, and ARWU use different names and weights, semantically related fields were grouped into four harmonized dimensions available in the processed dataset: Faculty Qualifications, Infrastructure Score, Research Output, and Student Outcomes. The response variable, Institutional Score, represents the integrated institutional-performance indicator. The harmonized variables permit a common computational experiment; they do not imply that the original ranking methodologies are equivalent. Normalization choices can alter composite rankings even when the underlying data and explicit weights remain unchanged [13,14].
The harmonization was performed at the conceptual-dimension level rather than by treating provider scores as identical. Faculty-related indicators were assigned to Faculty Qualifications; resource and capacity indicators to Infrastructure Score; publication and citation indicators to Research Output; and student progression or outcome indicators to Student Outcomes. Provider-specific definitions and weights were preserved during preprocessing, and the common dimensions were used only for the integrated analytical experiment.
2.3. Correlation Analysis
Pearson’s coefficient was calculated for every pair of harmonized variables:
The matrix was used as exploratory evidence for association strength and potential redundancy among predictors. No correlation was interpreted as a causal effect, and statistical significance was not inferred from the heatmap because confidence intervals and p-values were not part of the reported output.
2.4. Bayesian-Network Model
Let F, I, R, S, and Y denote faculty qualifications, infrastructure, research output, student outcomes, and institutional score, respectively. The study specified the Bayesian structure from the literature-derived roles of the harmonized dimensions and checked it against the observed association pattern. Its factorization is
The DAG was implemented with pgmpy and visualized with networkx [15]. Equation (2) enables posterior queries such as after evidence is entered. In this study, the network is evaluated as an interpretable dependency structure. Since the topology was study-specified rather than learned from intervention data, edge directions must not be interpreted as identified causal relationships.
The study specified the six-edge structure by combining the literature-derived roles of the four dimensions with the observed association pattern. Faculty qualifications and infrastructure were placed upstream as institutional-capacity dimensions; research output and student outcomes were placed as the immediate parents of the institutional score. The structure is intended for transparent conditional inference, not causal identification. A practical evidence-update query is : once research-output and student-outcome evidence is entered, the network updates the probability distribution of the institutional score.
2.5. Multiple Linear Regression and Evaluation
The numerical predictor was defined as
where the coefficients were estimated by ordinary least squares. The cleaned observations were divided into 80% training data and 20% test data. Model performance was computed only on the held-out subset using
The implementation used scikit-learn [16]. The predicted-versus-observed plot and the reference line were used to inspect agreement across the score range.
3. Results
3.1. Multivariate Association Structure
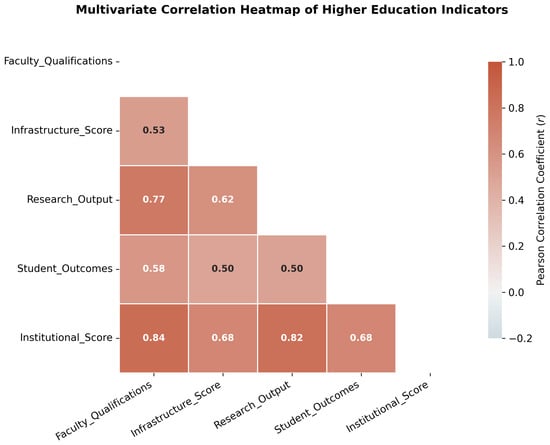
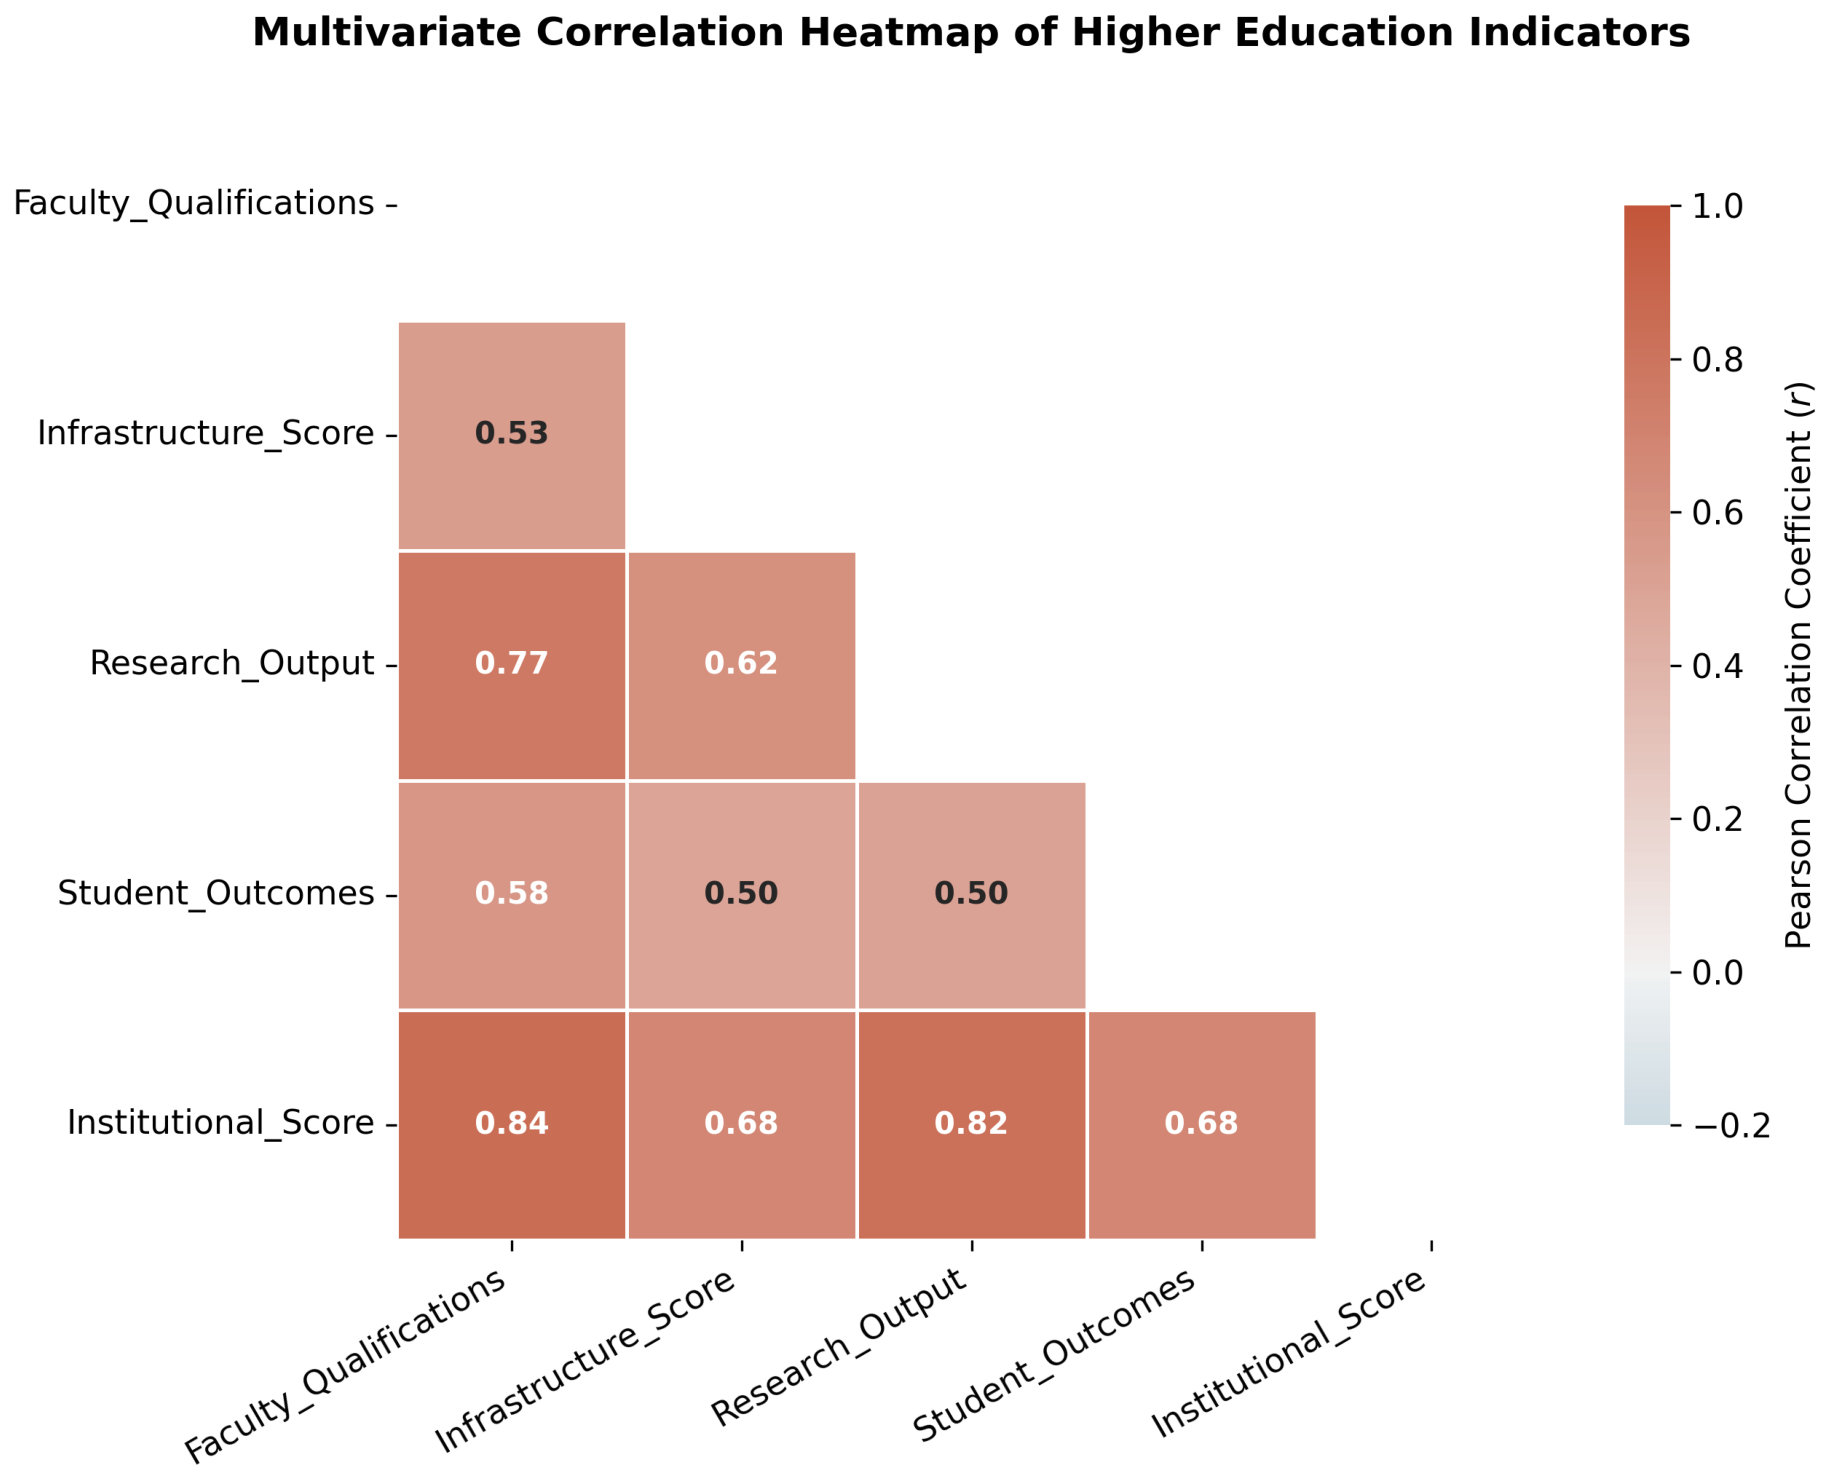
Figure 3 shows a uniformly positive correlation structure. Faculty qualifications had the strongest association with the institutional score (), closely followed by research output (). Infrastructure and student outcomes each reached . These values indicate that the response variable shows substantial linear association with all four predictors, with faculty and research dimensions providing the strongest marginal associations.
Figure 3.
Pearson correlation matrix for the harmonized higher-education indicators.
The predictor–predictor correlations clarify why a multivariate rather than a univariate model is required. Faculty qualifications and research output were strongly associated (), suggesting that part of their predictive information is shared. Research and infrastructure also exhibited a substantial relationship (). Faculty qualifications were moderately correlated with student outcomes () and infrastructure (), whereas infrastructure–student outcomes and research–student outcomes were both . Therefore, none of the dimensions behaves as an isolated input. At the same time, no pair reached near-perfect correlation, so each may retain complementary information. The faculty–research relationship also signals a possible coefficient-instability risk: a high does not guarantee that individual regression coefficients are causally or uniquely attributable.
3.2. Bayesian Dependency Topology
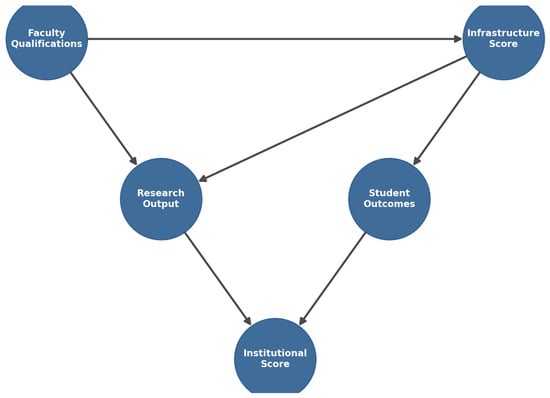
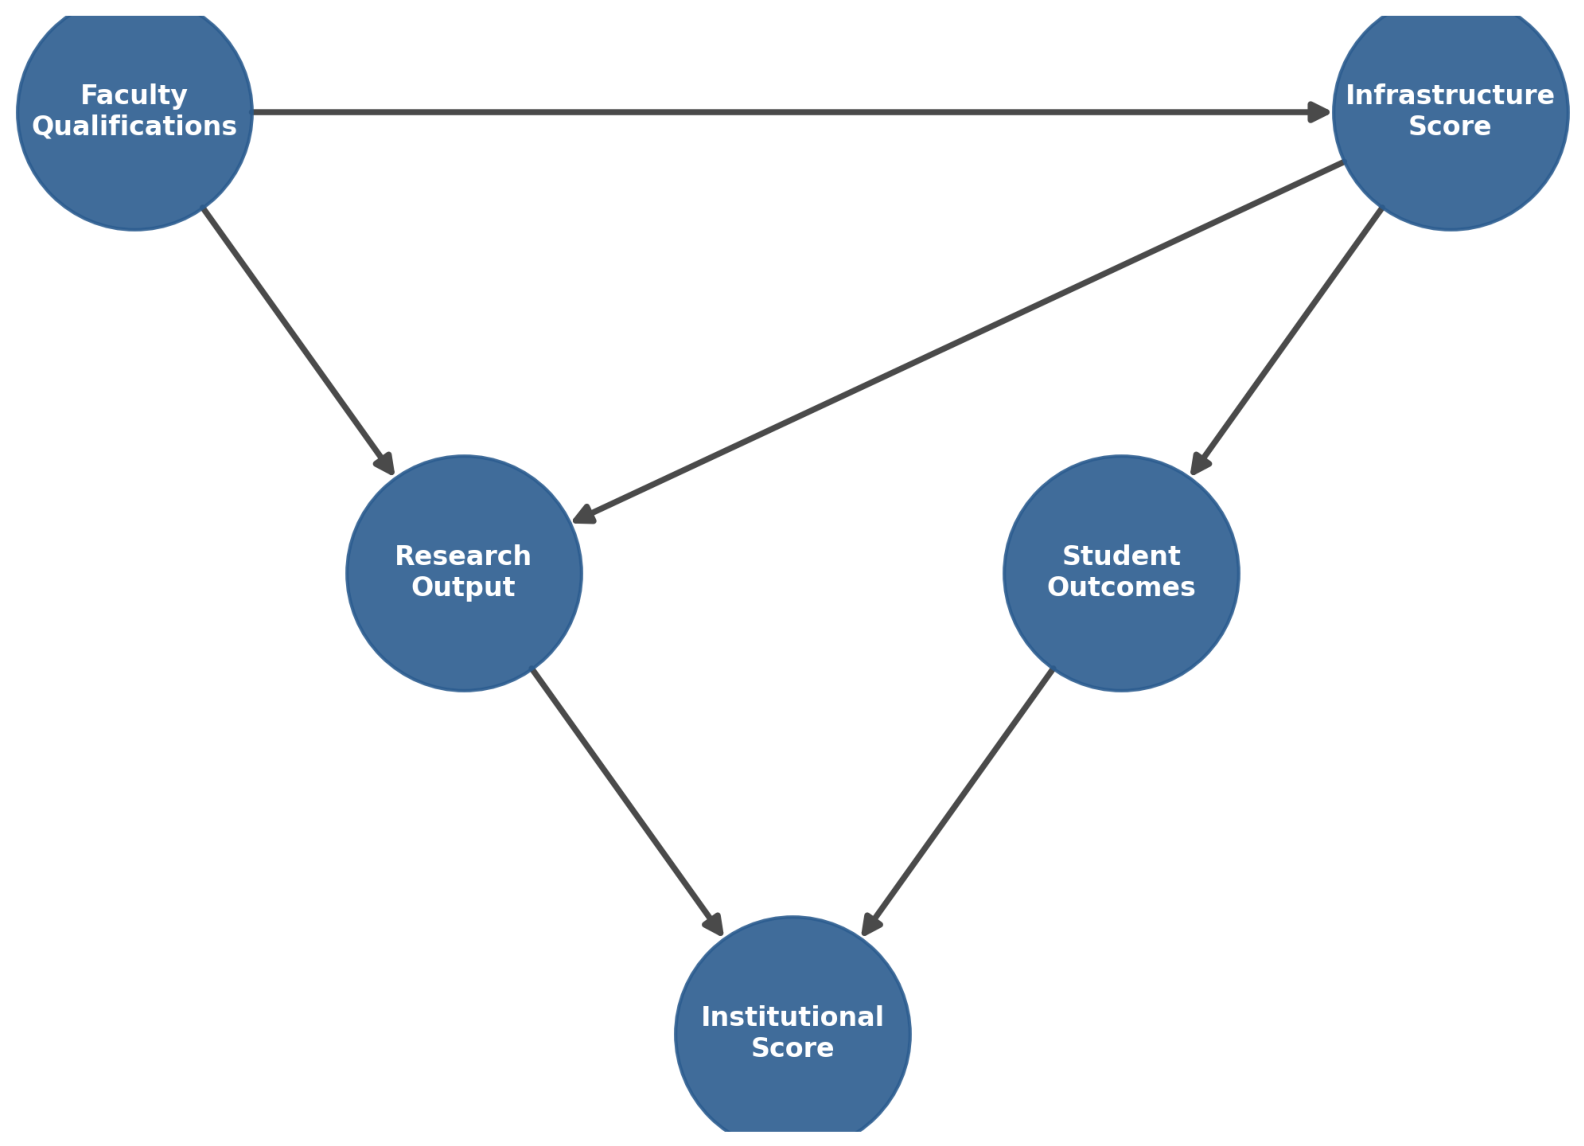
The DAG in Figure 4 organizes the same variables into an upstream layer (F), an intermediate institutional-capacity layer (I), two performance channels (R and S), and the final score (Y). Faculty qualifications connect directly to both infrastructure and research output. Infrastructure has outgoing links to research output and student outcomes. Research output and student outcomes then converge on the institutional score.
Figure 4.
Study-specified Bayesian-network topology for the harmonized indicators. Arrows encode conditional-dependence assumptions, not demonstrated causality.
This topology yields several analytical consequences. First, the model does not connect faculty qualifications or infrastructure directly to the final score. Their information is propagated through research output and student outcomes; under the graph assumptions, Y is conditionally independent of F and I given R and S. Second, research output has two parents, allowing the network to represent the joint information associated with faculty and infrastructure rather than treating research as an exogenous quantity. Third, the two terminal parents separate a research-intensive route from a student-centered route. This is consistent with the heatmap: research has a stronger direct association with Y (), while student outcomes contribute an additional, moderately strong association ().
The six-edge graph provides a compact representation of the assumed dependencies. Its sparse parent sets can simplify conditional-distribution parameterization. Nevertheless, the edge and the direction of other links cannot be validated from correlation alone. Equivalent DAGs can encode the same observational independencies, and omitted variables such as reputation, internationalization, institutional size, or country-level investment may confound the represented relationships. The network should consequently be viewed as a testable structural hypothesis and an inference interface, not as proof of a causal hierarchy.
3.3. Regression Performance
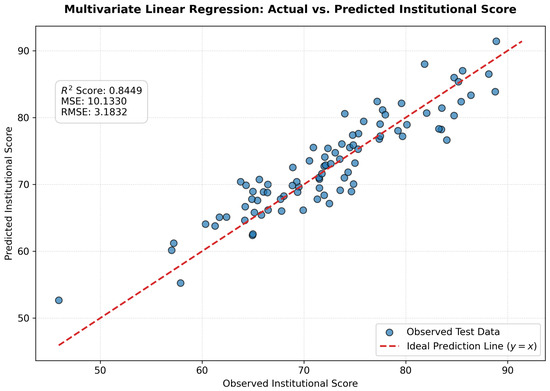
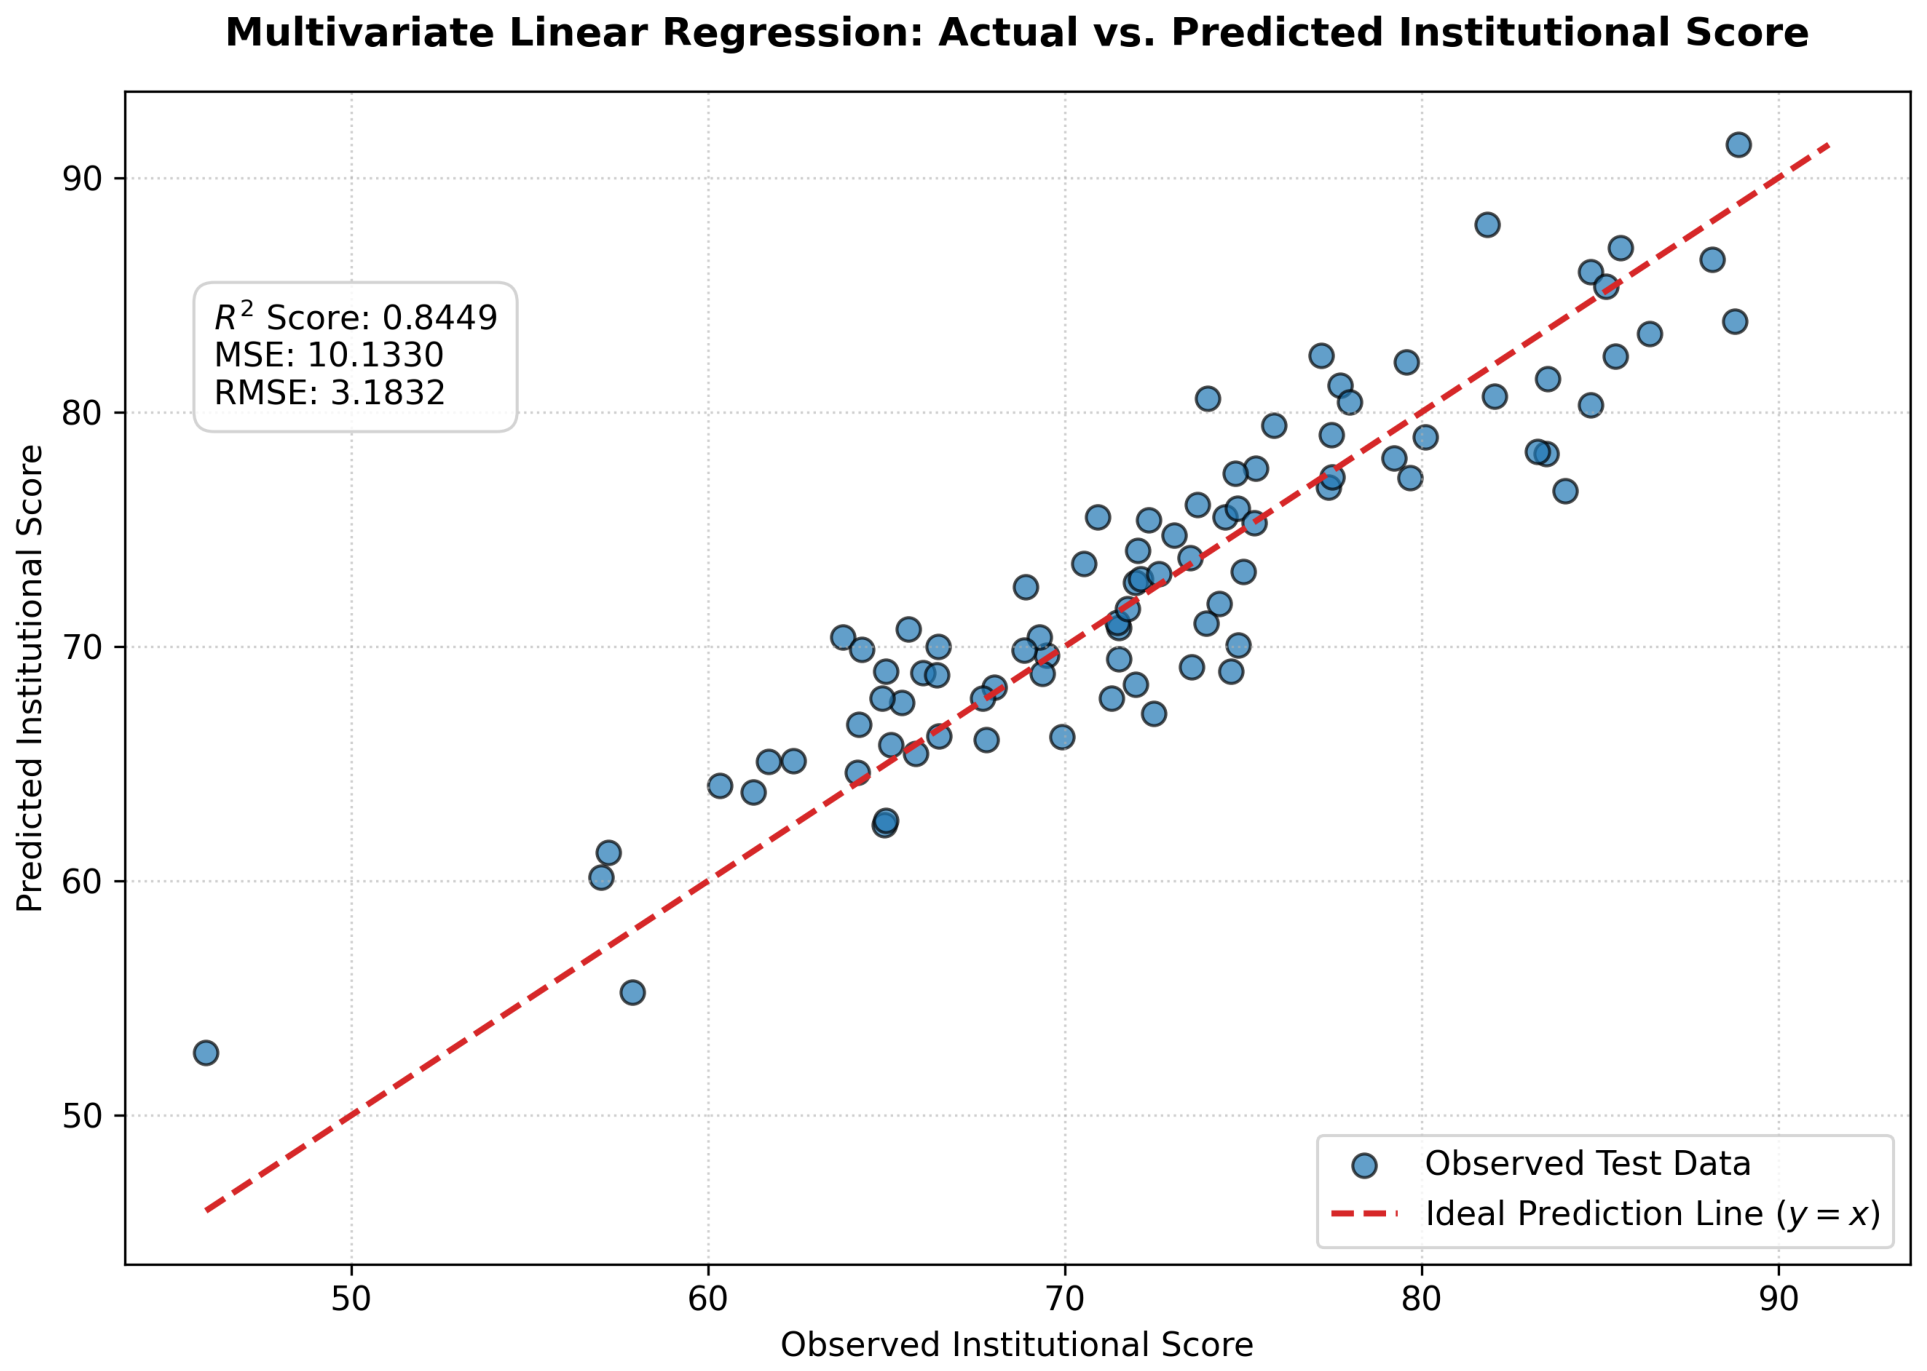
The held-out results in Figure 5 show that most predictions lie close to the identity line. The model achieved , explaining 84.49% of the test-set variance. The MSE was 10.1330 and the RMSE was 3.1832, so the typical error magnitude was approximately 3.18 points on the institutional-score scale.
Figure 5.
Observed versus predicted institutional scores for the held-out test data. The dashed line denotes perfect prediction.
The cloud follows the diagonal over most of the observed range, supporting the use of a linear baseline. The central score band contains the greatest concentration of observations and generally small residuals. The extremes reveal a mild shrinkage pattern: some low observed scores are overpredicted, while several high scores are underpredicted. Dispersion also appears larger in parts of the upper range. These deviations do not invalidate the global fit, but they show that a single deterministic line cannot reproduce all institutional profiles.
The performance metrics answer a predictive question, not a causal one. An of 0.8449 indicates strong agreement on the reported test partition, but it does not establish temporal stability across ranking editions or transportability to countries with sparse representation. Likewise, the RMSE is an aggregate measure and does not reveal whether errors are systematically larger for Ecuadorian institutions or for a particular ranking system. Source-stratified residuals and repeated cross-validation are therefore necessary before operational deployment.
3.4. Integrated Interpretation
The three outputs answer different questions. Correlation summarizes pairwise associations; the DAG makes a proposed conditional-dependence structure inspectable and permits evidence-update queries; and regression quantifies held-out numerical agreement. The network therefore adds a transparent inference interface that regression alone does not provide, whereas regression supplies an error scale that the graph alone does not establish. Faculty qualifications and research output dominate the marginal association pattern, yet the DAG specifies research output and student outcomes as the immediate parents of the institutional score. A variable may consequently be strongly correlated with the target while connecting to it indirectly in the specified graph.
The regional coverage in Figure 1 adds an important boundary condition. Because Brazil contributes far more university–year appearances than Ecuador and several smaller systems, pooled accuracy can be driven by better-represented countries. The reported test performance does not establish equal accuracy across countries. The Bayesian layer describes assumed dependencies, while regression provides score predictions and an aggregate error scale.
4. Discussion
The results illustrate how complementary analytical methods characterize relationships among higher-education indicators without collapsing association, probabilistic inference, and prediction into a single claim. Faculty qualifications and research output showed the strongest associations with the institutional score, reflecting the research-intensive orientation of global rankings. However, their correlation of 0.77 indicates that composite models may amplify the apparent importance of related dimensions. The Bayesian network improves structural interpretability by explicitly representing how evidence updates intermediate variables. Nevertheless, its topology was specified from the literature-informed analytical roles and observed associations rather than learned through interventions or causal-discovery methods; therefore, the identified relationships must not be interpreted as causal effects.
Hooshyar and Druzdzel [17] evaluated dynamic Bayesian networks for learner-performance prediction using cross-validation and holdout tests. Their learner-level temporal analysis complements the present institution-level dependency model; the different outcomes preclude direct performance comparisons. Kelemen et al. [14] demonstrated that normalization thresholds can change composite rankings without changing the underlying data or explicit weights. Accordingly, the reported regression fit characterizes the constructed score, whereas robustness to indicator construction requires separate assessment.
The multiple linear regression model achieved strong agreement on the reported test partition. However, the random row-level split permits observations from the same university in different years to enter both training and test sets. The reported performance therefore does not establish generalization to unseen institutions or future ranking editions. The residual pattern at the score extremes warrants further examination of nonlinearities, interactions, and ranking-specific differences. Future experiments should incorporate grouped cross-validation, temporal holdout, bootstrapped confidence intervals, and source-specific error analysis.
Unequal country representation also limits the model because countries with sustained ranking participation dominate the dataset, whereas Ecuador contributes fewer observations. Future work should report country-level errors, reweight training observations, compare hierarchical, regularized, tree-based, and nonlinear models, and incorporate Bayesian posterior predictive checks and sensitivity analysis. The proposed framework should consequently be used as an auditable decision-support tool rather than an automatic policy mechanism. Human oversight remains necessary because ranking variables reflect source definitions, historical prestige, data availability, and methodological changes; thus, predictive accuracy must not be confused with educational validity or converted directly into institutional prescriptions.
In practice, university analysts can use the graph to examine which dependency assumptions underlie an institutional-score interpretation and use regression residuals to identify profiles for which the numerical benchmark performs poorly. Institutional managers can then treat disagreement between these views as a prompt for data review or contextual investigation, not as an automatic ranking or resource-allocation rule. This division of roles makes the workflow useful for transparent diagnostic discussion while keeping consequential decisions under human oversight.
5. Conclusions
This paper reformulated the analysis of Latin American higher-education indicators as an interpretable machine-learning problem. The strongest pairwise relationships with the institutional score involved faculty qualifications () and research output (), followed by infrastructure and student outcomes ( each). The study-specified Bayesian DAG represented a compact dependency hypothesis in which research output and student outcomes form the immediate inference layer for institutional performance. The multiple linear model achieved , MSE , and RMSE on the held-out test data.
The main contribution is the coordinated use of three interpretable analytical views: pairwise association, conditional-dependence structure, and held-out numerical prediction. Their joint use supports transparent examination of complex indicators while making the assumptions and limitations of each method explicit.
The framework is intended to support analytical interpretation and structured institutional discussion rather than automated decision making.
Together, these results show that the four harmonized dimensions provide substantial predictive information while the Bayesian structure makes dependency assumptions explicit. The main technical limitation is that neither the correlations nor the DAG establish causality. In addition, uneven country representation, possible institution–year dependence, a single train–test split, and the absence of uncertainty intervals restrict external validity. The next stage should use grouped and temporal validation, posterior calibration, source- and country-stratified errors, and nonlinear benchmark models. Under these safeguards, the proposed framework can support auditable inference of complex educational indicators and enable transparent comparison without reducing institutional performance to an unexplained score.
Author Contributions
Conceptualization, M.G.G.E., X.R.-L. and A.R.L.; methodology, M.G.G.E. and X.R.-L.; software, M.G.G.E.; validation, X.R.-L. and A.R.L.; formal analysis, M.G.G.E.; investigation, M.G.G.E., X.R.-L. and A.R.L.; data curation, M.G.G.E.; writing—original draft preparation, M.G.G.E.; writing—review and editing, X.R.-L. and A.R.L.; visualization, M.G.G.E.; supervision, X.R.-L. and A.R.L. All authors have read and agreed to the published version of the manuscript.
Funding
This research was funded by Escuela Politécnica Nacional (EPN), Ecuador, through Scholarship No. VIIV-BM-022-2021, under the “Academic Master’s Degree with a Research Track” (Maestría Académica con Trayectoria de Investigación) program.
Institutional Review Board Statement
Not applicable.
Informed Consent Statement
Not applicable.
Data Availability Statement
The original contributions presented in this study are included in the article. Further inquiries can be directed to the corresponding author.
Acknowledgments
During the preparation of this manuscript, the authors used OpenAI ChatGPT GPT-5 for language and structural editing. The authors reviewed and edited the output and take full responsibility for the content of this publication.
Conflicts of Interest
The authors declare no conflicts of interest.
References
- Hazelkorn, E. Rankings and the Reshaping of Higher Education: The Battle for World-Class Excellence, 2nd ed.; Palgrave Macmillan: London, UK, 2015. [Google Scholar] [CrossRef] [Scilit]
- Marginson, S.; van der Wende, M. Globalisation and Higher Education; Technical Report OECD Education Working Papers No. 8; OECD Publishing: Paris, France, 2007. [Google Scholar] [CrossRef]
- OECD; European Union; Joint Research Centre. Handbook on Constructing Composite Indicators: Methodology and User Guide; OECD Publishing: Paris, France, 2008. [Google Scholar] [CrossRef] [Scilit]
- Koller, D.; Friedman, N. Probabilistic Graphical Models: Principles and Techniques; MIT Press: Cambridge, MA, USA, 2009. [Google Scholar]
- Pearl, J. Probabilistic Reasoning in Intelligent Systems: Networks of Plausible Inference; Morgan Kaufmann: San Mateo, CA, USA, 1988. [Google Scholar] [CrossRef] [Scilit]
- Mihaljević, B.; Bielza, C.; Larrañaga, P. Bayesian Networks for Interpretable Machine Learning and Optimization. Neurocomputing 2021, 456, 648–665. [Google Scholar] [CrossRef] [Scilit]
- Fernández, A.; Morales, M.; Rodríguez, C.; Salmerón, A. A System for Relevance Analysis of Performance Indicators in Higher Education Using Bayesian Networks. Knowl. Inf. Syst. 2011, 27, 327–344. [Google Scholar] [CrossRef] [Scilit]
- Shmueli, G. To Explain or to Predict? Stat. Sci. 2010, 25, 289–310. [Google Scholar] [CrossRef] [Scilit]
- Quacquarelli Symonds. QS World University Rankings: Methodology. 2023. Available online: https://www.topuniversities.com/qs-world-university-rankings/methodology (accessed on 2 August 2026).
- Times Higher Education. World University Rankings 2023: Methodology. 2022. Available online: https://www.timeshighereducation.com/world-university-rankings/world-university-rankings-2023-methodology (accessed on 2 August 2026).
- ShanghaiRanking Consultancy. Academic Ranking of World Universities 2023: Methodology. 2023. Available online: https://www.shanghairanking.com/methodology/arwu/2023 (accessed on 2 August 2026).
- Page, M.J.; McKenzie, J.E.; Bossuyt, P.M.; Boutron, I.; Hoffmann, T.C.; Mulrow, C.D.; Shamseer, L.; Tetzlaff, J.M.; Akl, E.A.; Brennan, S.E.; et al. The PRISMA 2020 Statement: An Updated Guideline for Reporting Systematic Reviews. BMJ 2021, 372, n71. [Google Scholar] [CrossRef] [Scilit] [PubMed]
- Saisana, M.; Saltelli, A.; Tarantola, S. Uncertainty and Sensitivity Analysis Techniques as Tools for the Quality Assessment of Composite Indicators. J. R. Stat. Soc. Ser. A (Stat. Soc.) 2005, 168, 307–323. [Google Scholar] [CrossRef] [Scilit]
- Kelemen, A.; Szabó, Z.K.; Bozóki, S.; Szádoczki, Z.; Hartvig, Á.D. A sensitivity analysis of composite indicators: Min/max thresholds. Environ. Sustain. Indic. 2024, 23, 100453. [Google Scholar] [CrossRef] [Scilit]
- Ankan, A.; Panda, A. pgmpy: Probabilistic Graphical Models Using Python. In Proceedings of the 14th Python in Science Conference, Austin, TX, USA, 6–12 July 2015; pp. 6–11. [Google Scholar] [CrossRef] [Scilit]
- Pedregosa, F.; Varoquaux, G.; Gramfort, A.; Michel, V.; Thirion, B.; Grisel, O.; Blondel, M.; Prettenhofer, P.; Weiss, R.; Dubourg, V.; et al. Scikit-learn: Machine Learning in Python. J. Mach. Learn. Res. 2011, 12, 2825–2830. [Google Scholar]
- Hooshyar, D.; Druzdzel, M.J. Memory-Based Dynamic Bayesian Networks for Learner Modeling: Towards Early Prediction of Learners’ Performance in Computational Thinking. Educ. Sci. 2024, 14, 917. [Google Scholar] [CrossRef] [Scilit]
Disclaimer/Publisher’s Note: The statements, opinions and data contained in all publications are solely those of the individual author(s) and contributor(s) and not of MDPI and/or the editor(s). MDPI and/or the editor(s) disclaim responsibility for any injury to people or property resulting from any ideas, methods, instructions or products referred to in the content. |
© 2026 by the authors. Licensee MDPI, Basel, Switzerland. This article is an open access article distributed under the terms and conditions of the Creative Commons Attribution (CC BY) license.