


Abstract
Solar and wind variability can limit renewable generation under contrasting regional conditions. This study evaluates a solar–wind–biomass hybrid system for Puerto Quito, Valencia, and Tena, Ecuador, using MATLAB/Simulink R2024b with NASA POWER meteorological inputs, PVGIS as a complementary solar reference, and biomass assumptions informed by the Ecuadorian Bioenergy Atlas. Under a controlled biomass scenario of 1500 t/year, the biomass subsystem supplied 87.7 kW. Mean hybrid outputs were 137, 130, and 128 kW, equivalent to 1200.1, 1138.8, and 1121.3 MWh/year, respectively. Adding the common biomass contribution reduced the relative regional spread from 22.3% to 7.0%, while the absolute Puerto Quito–Tena difference remained 9 kW. Biomass sensitivity and analytical uncertainty screening further characterized the influence of resource and model assumptions on the comparative results.
1. Introduction
The transition toward low-carbon energy systems requires greater deployment and diversification of renewable electricity technologies [1]. Solar photovoltaic (PV) and wind generation offer modularity, scalability, and low operational emissions, but their dependence on meteorological conditions produces variable output. Combining resources with different availability patterns can reduce dependence on a single source, although complementarity remains strongly location-dependent [2].
Solar–wind systems have been widely studied to exploit daily and seasonal complementarity [3]. Their assessment requires subsystem modeling and combined-output evaluation [4], while architecture, sizing, and control also influence performance [5]. Optimization has been investigated under specific resource and operating conditions [6], including heuristic and multi-objective approaches [7], while recent work emphasizes forecasting, uncertainty, location-specific sizing, and multiresource integration [8].
Agricultural biomass can complement weather-dependent generation because residues may be stored and converted independently of instantaneous solar and wind conditions. Its use can support circular-bioeconomy strategies and reduce uncontrolled disposal [9], although deployment depends on seasonality, moisture, transport, storage, and competing uses [10]. Gasification converts biomass into combustible gas through partial oxidation [11]; performance depends on feedstock, reactor conditions, equivalence ratio, and gas cleaning [12], while tar formation, feedstock heterogeneity, and conversion efficiency remain important challenges [13].
PV–wind–biomass systems combine variable and comparatively controllable renewable sources [14]. Previous studies have mainly focused on optimal sizing [15] and cost–environmental trade-offs [16], while cross-regional comparisons of the same three-source architecture under controlled biomass assumptions remain limited.
Ecuador provides a relevant case because its geographic diversity produces marked renewable-resource differences. Autonomous solar–wind systems have been modeled nationally [17], whereas biomass integration remains comparatively underexplored. The Ecuadorian Bioenergy Atlas provides residue and energy parameters [18], PVGIS provides solar resource and PV performance information [19], and NASA POWER supplies meteorological data for energy applications [20], with reproducible computational access documented in [21]. Accordingly, this study evaluates Puerto Quito, Valencia, and Tena using a unified MATLAB/Simulink R2024b framework to (1) integrate solar, wind, and biomass at the energy level; (2) compare mean power and equivalent annual energy under a common controlled biomass scenario; and (3) assess relative regional dispersion, biomass sensitivity, and analytical uncertainty.
2. Methodology
2.1. Study Framework
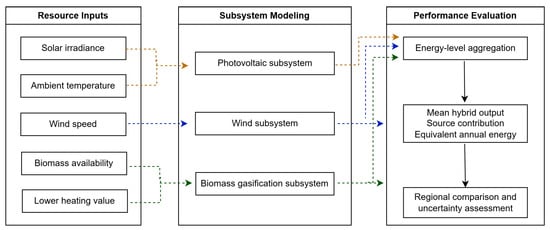
A comparative simulation methodology was applied to the solar–wind–biomass system under contrasting Ecuadorian conditions. The workflow comprised resource data preprocessing, independent subsystem modeling, and energy-signal aggregation, and regional assessment of mean power, equivalent annual energy, relative dispersion, sensitivity, and uncertainty. Puerto Quito, Valencia, and Tena represented humid subtropical, coastal, and Amazon conditions, respectively. A common architecture and controlled biomass assumptions isolated regional solar and wind differences. Figure 1 summarizes the workflow using NASA POWER meteorological inputs, PVGIS as a complementary solar reference, and biomass assumptions informed by the Ecuadorian Bioenergy Atlas.
Figure 1.
Workflow for resource processing, subsystem modeling, energy-level integration, regional comparison, and sensitivity and uncertainty assessment.
2.2. Resource Data and Model Inputs
Daily 2024 meteorological inputs were obtained for Puerto Quito ( N, W), Valencia ( S, W), and Tena ( S, W). NASA POWER supplied global horizontal irradiation (ALLSKY_SFC_SW_DWN), ambient temperature (T2M, 2 m), and wind speed (WS10M, 10 m), with native spatial resolutions of for solar radiation parameters and for meteorological parameters. PVGIS was used as a complementary solar resource reference. Before MATLAB/Simulink R2024b import, records were chronologically ordered and screened for missing or non-numeric values. Daily solar irradiation (kWh/m2/day) was converted to equivalent mean irradiance (W/m2); temperature and wind speed retained daily mean resolution. The annual series were simulated in January–June and July–December intervals without temporal disaggregation and therefore represent mean daily conditions rather than subdaily variability.
The PV array comprised 600 Jinko Solar Swan 60H modules (192 kWp), and the wind subsystem used four 50 kW Aeolos-H turbines (200 kW total). Biomass was defined as a controlled reference scenario based on generic agricultural residues rather than location-specific inventories. A common availability of 1500 t/year, effective LHV of 9.00 MJ/kg, and adopted conversion efficiency of 20.5% were applied to all locations, yielding approximately 87.7 kW. Moisture was not modeled separately and was implicitly represented by the effective LHV. Biomass scenarios of 1200, 1500, and 1800 t/year were assessed. Table 1 summarizes the principal parameters and assumptions.
Table 1.
Main system parameters and modeling assumptions.
2.3. Subsystem Models
The photovoltaic subsystem estimated electrical output from irradiance and cell temperature as
where is rated power, and are incident and reference irradiance, is the temperature coefficient, and is estimated from ambient temperature and irradiance ( W/m2, °C). Additional inverter, wiring, soiling, shading, and degradation losses were not modeled separately. Wind power was represented by
where was treated as constant, A is swept area, is the power coefficient, and is wind speed. The Aeolos-H turbine model included non-generating, variable-power, and rated power regions; site-specific air-density corrections were not applied. Because daily mean wind speed was used, Weibull-based temporal uncertainty was assessed: for –3, = 1.40–1.91, indicating a potential 40–91% underestimation of the unconstrained cubic term. This range is an uncertainty indicator rather than a correction of turbine output.
The continuous biomass mass flow was calculated as
and the corresponding electrical output as
where is annual biomass supply, is the adopted effective lower heating value, and is the adopted overall conversion efficiency. The reference assumptions produced approximately 87.7 kW.
2.4. Hybrid Integration and Assessment Criteria
The hybrid output was obtained by aggregating the three generation signals:
Integration was performed at the energy-signal level without synchronization on a common AC bus. Accordingly, the model assesses generation performance and source contributions, but not voltage or frequency regulation, transient behavior, power quality, or grid stability. The contribution of each source was calculated as
where represents the photovoltaic, wind, or biomass output. The representative output for each location was the mean of the simulated daily power series over 2024. Equivalent annual energy was calculated as
where is the representative mean power in kW and is expressed in kWh/year.
Regional output spread was quantified as
where and denote the highest and lowest regional mean outputs. The indicator was applied to both the combined PV–wind output and the complete hybrid system. Biomass availability was varied by ±20% around 1500 t/year. Additional analytical screening considered effective LHV, conversion efficiency, operational availability, PV losses, and wind resource uncertainty.
3. Implementation and Results
3.1. Model Implementation and Biomass Performance
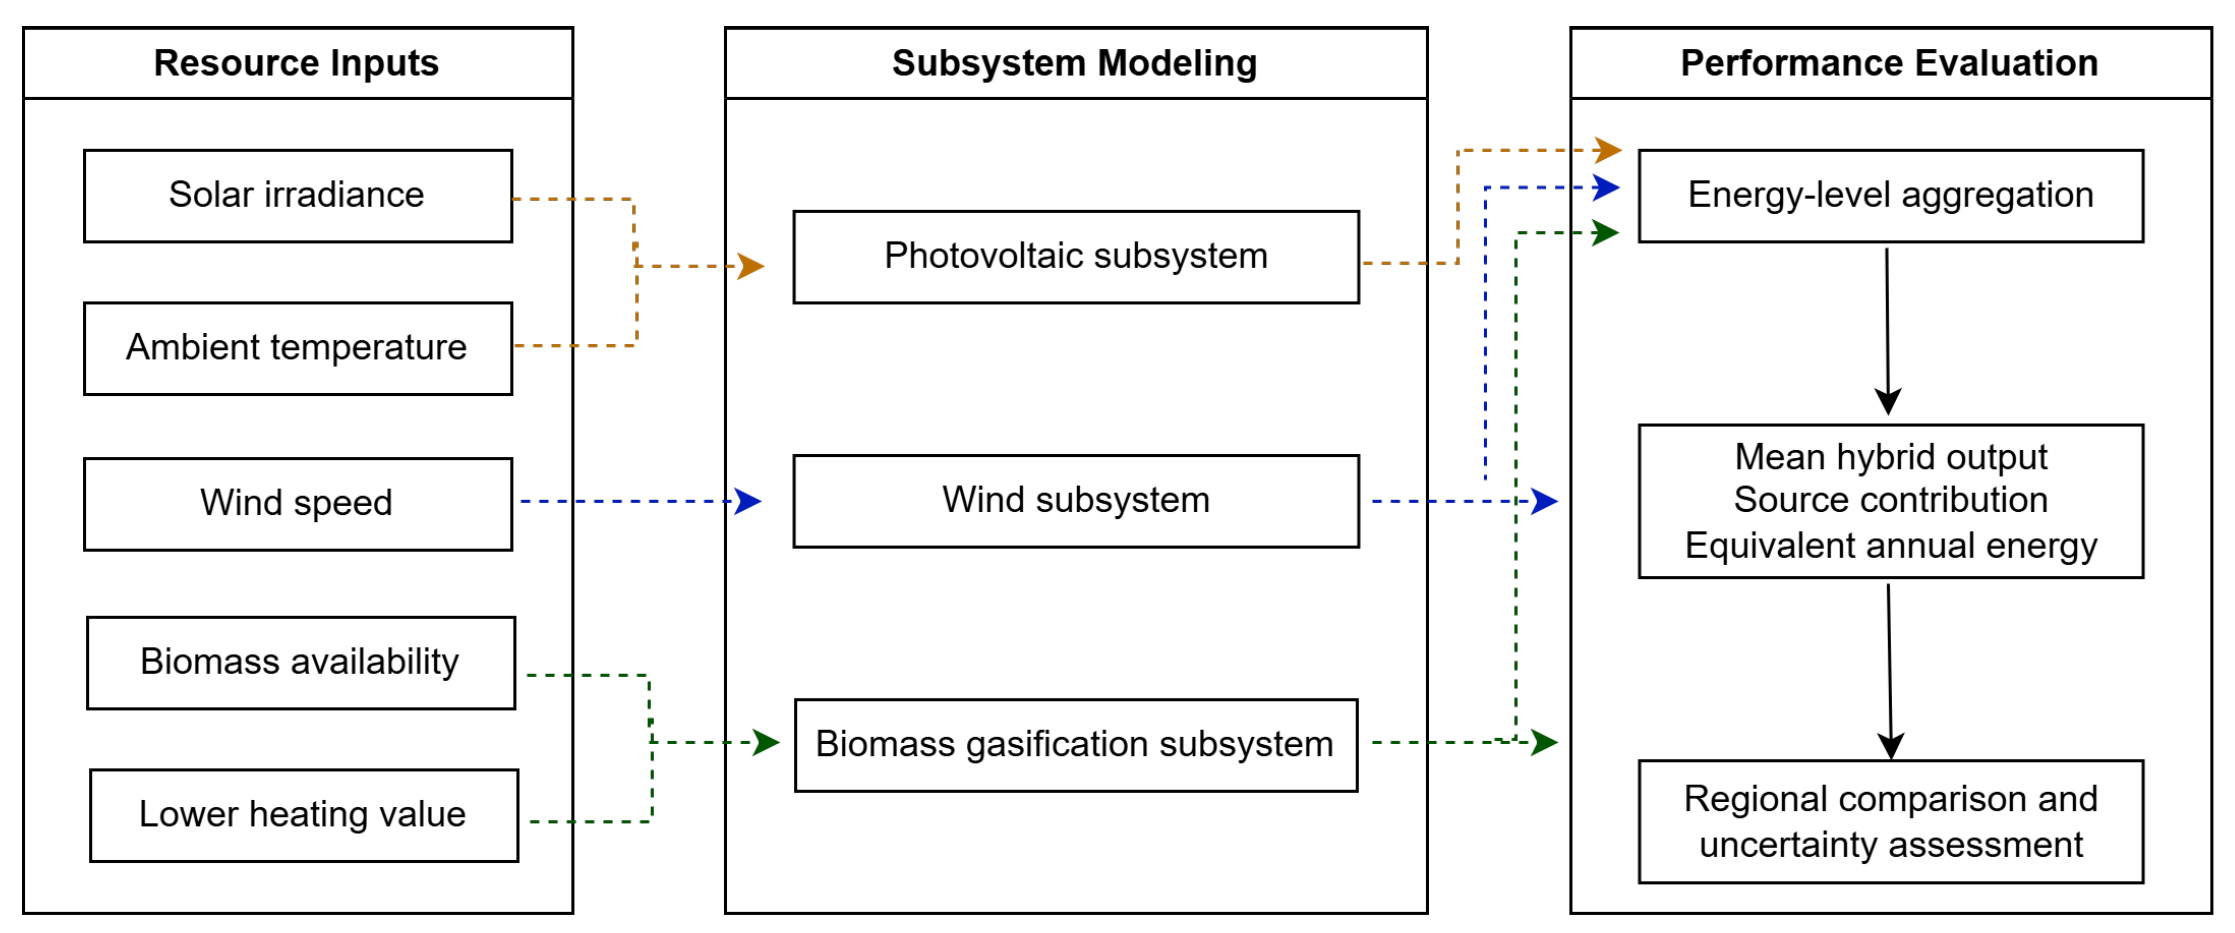
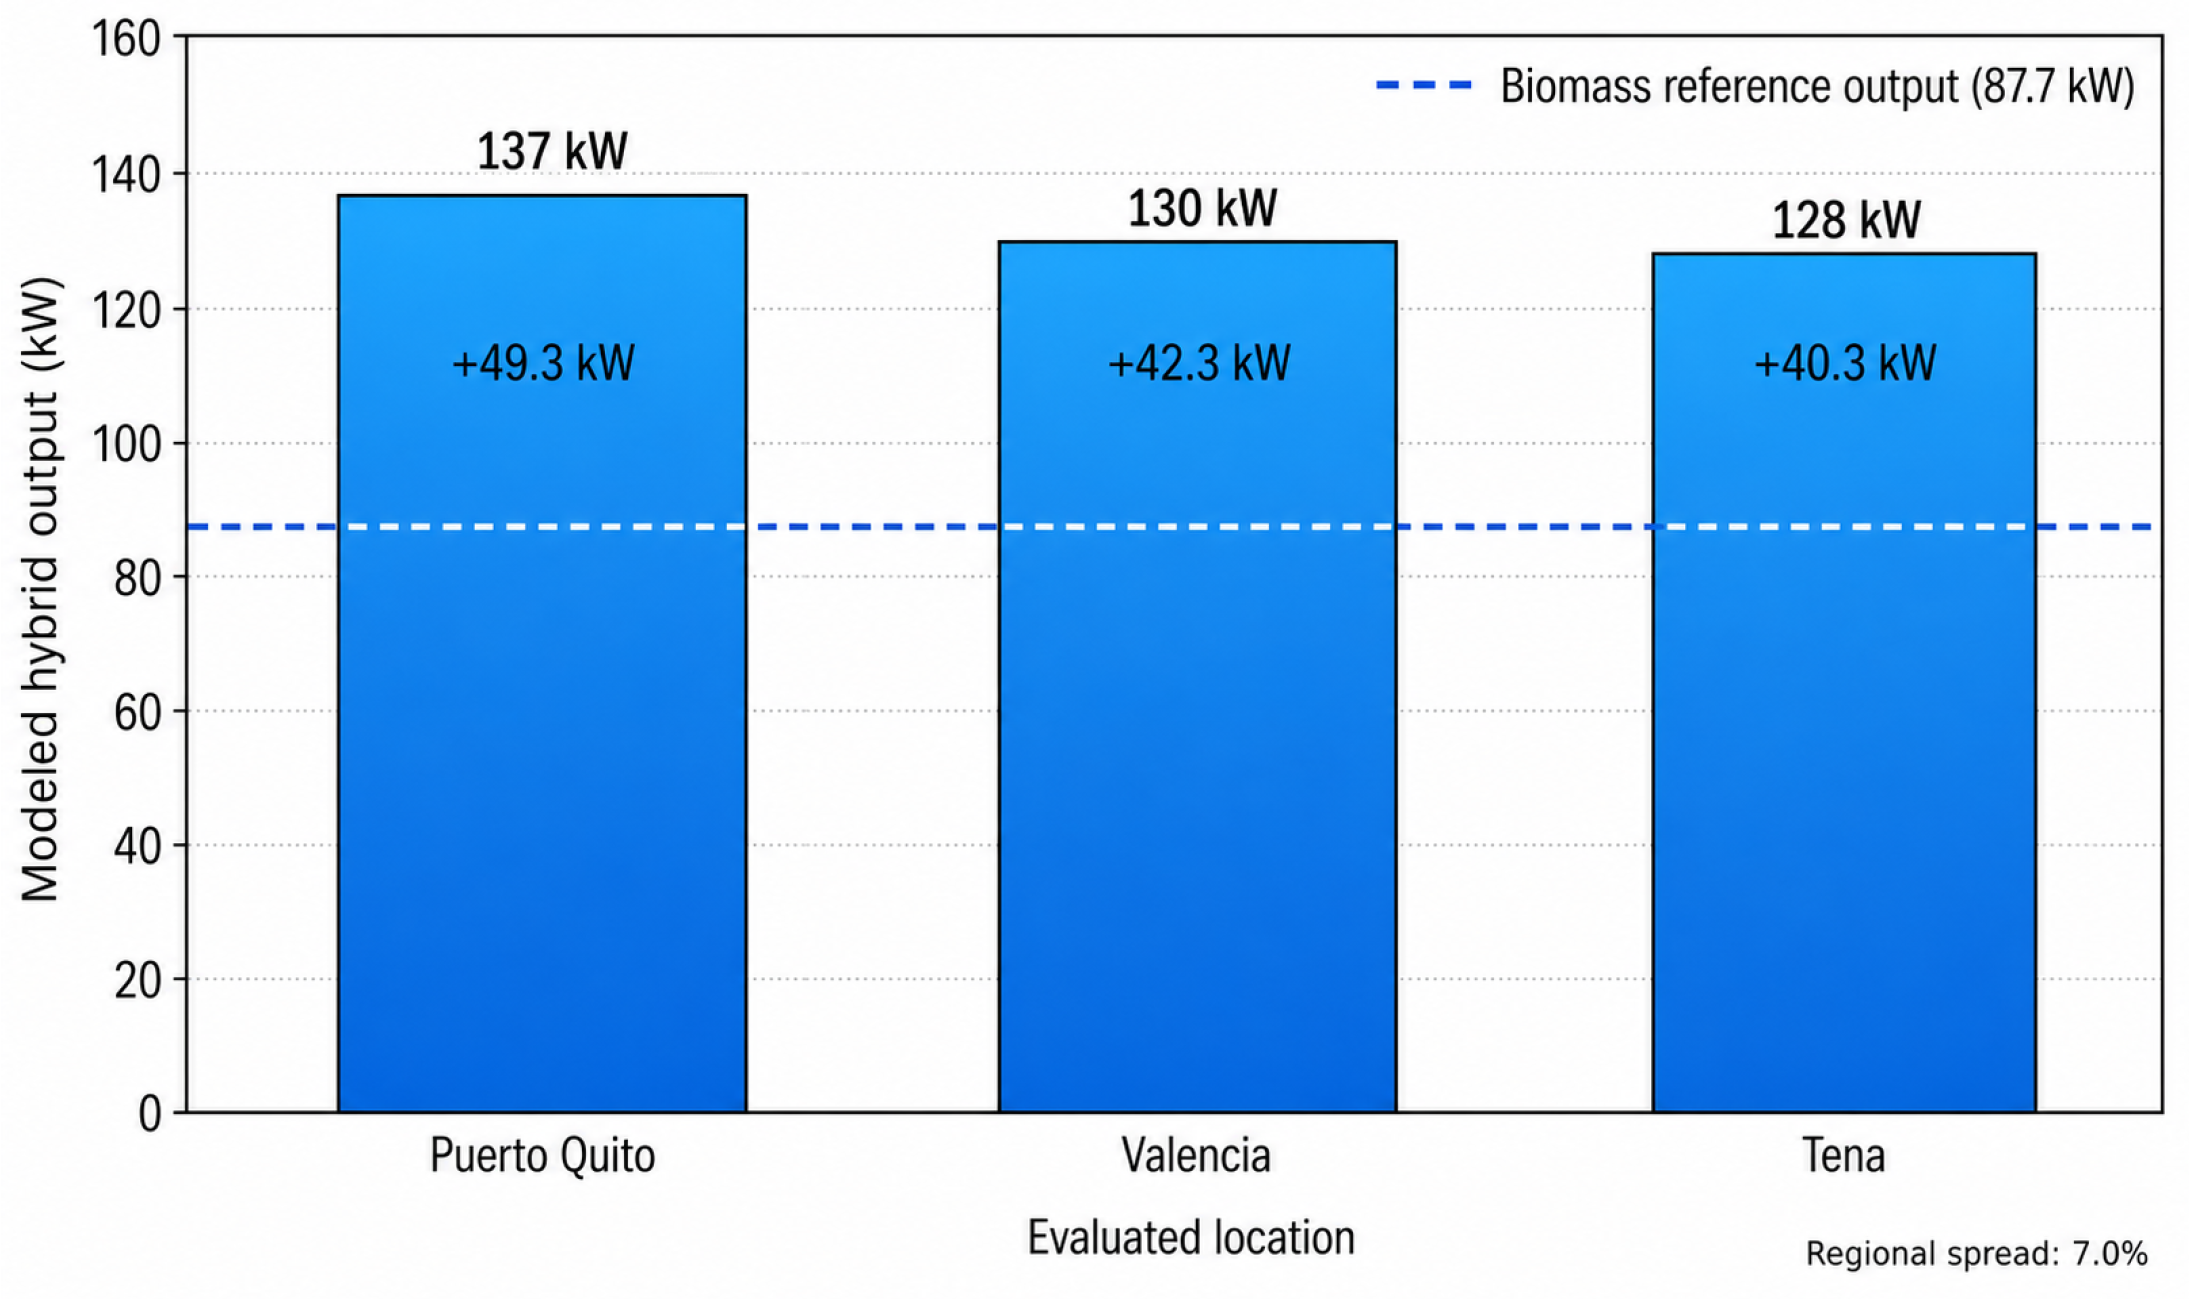
The solar–wind–biomass framework was implemented in MATLAB/Simulink R2024b using regional PV and wind inputs and a controlled biomass reference. Independent subsystem implementation checks preceded energy-level aggregation; no experimental subsystem validation was conducted. Figure 2 shows the model structure.
Figure 2.
Functional architecture of the solar–wind–biomass model, including subsystem modeling, energy-level aggregation, regional comparison, and sensitivity and uncertainty assessment. Dashed arrows indicate the signal paths for solar inputs (orange), wind (blue), and biomass (green).
The biomass branch was held identical across locations to isolate regional solar and wind differences. Under the reference scenario (1500 t/year, 9.00 MJ/kg effective LHV, 20.5% conversion efficiency), it supplied approximately 87.7 kW. The adopted efficiency is close to the 19.9% value reported in the Ecuadorian Bioenergy Atlas (relative difference ≈ 3.0%), indicating parameter consistency rather than independent validation. Gas cleaning losses, transient gasifier operation, and engine dynamics were not modeled.
3.2. Regional Energy-Performance Results
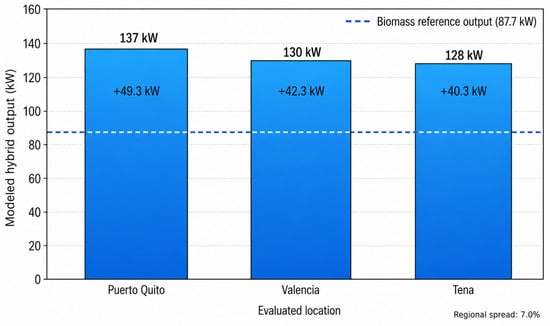
Puerto Quito showed the highest mean hybrid output, followed by Valencia and Tena, with 137, 130, and 128 kW, equivalent to 1200.1, 1138.8, and 1121.3 MWh/year, respectively. Table 2 summarizes the modeled outputs, equivalent annual energies, and source contributions. These values represent modeled mean-condition performance and should not be interpreted as installed capacities, measured generation, or independently validated subsystem outputs.
Table 2.
Representative modeled power and equivalent annual energy results.
As the combined PV–wind output decreased across the three locations, the biomass share increased from 64.0% in Puerto Quito to 68.5% in Tena. The relative regional spread was 22.3% for PV–wind [] and 7.0% for the complete hybrid system []. This reduction is mathematical: adding the same 87.7 kW biomass reference increases the common output baseline while the absolute Puerto Quito–Tena difference remains 9 kW. Thus, biomass reduces relative regional dispersion without reducing the underlying PV–wind difference or demonstrating lower temporal variability.
Figure 3 compares the hybrid outputs with the common biomass reference.
Figure 3.
Mean hybrid outputs under the common biomass reference scenario. The dashed line denotes 87.7 kW; the relative regional spread is 7.0%, while the absolute Puerto Quito–Tena difference remains 9 kW.
3.3. Sensitivity and Uncertainty Analysis
Biomass availability was varied by ±20% around the 1500 t/year reference case while maintaining the effective lower heating value and conversion efficiency constant. The same biomass levels were applied to all locations as controlled reference scenarios rather than site-specific residue estimates. Because biomass power is proportional to mass flow under these assumptions, supplies of 1200 and 1800 t/year produced 70.2 and 105.2 kW, respectively. Table 3 summarizes the resulting biomass and mean hybrid outputs.
Table 3.
Sensitivity of mean hybrid output to annual biomass availability.
Additional analytical screening was used to characterize other model uncertainties without treating them as new simulated cases. Because , a ±10% relative perturbation in either parameter would produce the same ±10% change in biomass output (78.9–96.5 kW); a 10% reduction in operational availability would likewise reduce the reference output to 78.9 kW. Moisture was not varied independently because its effect is implicitly represented by the effective LHV. A hypothetical 10% PV loss would reduce hybrid output by no more than 4.93, 4.23, and 4.03 kW for Puerto Quito, Valencia, and Tena, respectively, since PV output cannot exceed the reported combined PV–wind contribution. Wind resource uncertainty is treated separately through the Weibull-based temporal-resolution analysis in Section 2.3. The regional spread declined from 8.1% in the low-biomass scenario to 7.0% in the reference case and 6.2% in the high-biomass scenario. The Puerto Quito–Tena difference remained 9 kW because an identical biomass increment was applied to all locations. Thus, greater biomass availability increased total output and reduced relative dispersion without altering the underlying PV–wind performance gap.
3.4. Discussion
Regional hybrid performance remained conditioned by local solar and wind resources, consistent with studies on resource assessment and geographically dependent solar–wind balances [22,23]. Under the reference case, biomass contributed 64.0–68.5% and reduced the relative regional spread from 22.3% to 7.0%. This reduction is mathematical: adding the common 87.7 kW biomass reference increases the output baseline while the absolute Puerto Quito–Tena difference remains 9 kW. Thus, relative dispersion decreases without reducing the underlying PV–wind difference or demonstrating lower temporal variability. Biomass has similarly been identified as a controllable contribution in hybrid systems [24].
Total output and source shares depend on assumed biomass availability. Because residue supply varies spatially and seasonally [25], the biomass branch represents a controlled reference scenario rather than location-specific or guaranteed continuous generation. Biomass dominance reflects the adopted resource and sizing assumptions, while storage, dispatch, cost, and reliability constraints may alter the preferred design [26].
Daily mean wind speed introduces temporal-resolution uncertainty because wind power depends on . The Weibull-based sensitivity (k = 2–3) gives = 1.40–1.91; this is an uncertainty bound, not a direct turbine output correction. No independent experimental validation of the PV, wind, or biomass branches was performed; therefore, the results are comparative mean-condition estimates subject also to unmodeled PV losses, constant air-density treatment, and biomass assumptions. Signal-level integration assesses energy performance rather than converter synchronization, power quality, or grid stability.
4. Conclusions
This study evaluated a solar–wind–biomass framework for Puerto Quito, Valencia, and Tena using MATLAB/Simulink R2024b. The model combined location-dependent PV and wind generation with a controlled biomass reference scenario. At 1500 t/year, the biomass subsystem supplied 87.7 kW using an adopted conversion efficiency of 20.5%; the 19.9% Ecuadorian value served only as a parameter consistency benchmark, not as independent validation.
Mean hybrid outputs were 137, 130, and 128 kW, equivalent to 1200.1, 1138.8, and 1121.3 MWh/year, with biomass contributions of 64.0%, 67.5%, and 68.5%, respectively. The common 87.7 kW biomass reference reduced the relative regional spread from 22.3% to 7.0%, while the absolute Puerto Quito–Tena difference remained 9 kW. Therefore, biomass increased the common output baseline and reduced relative dispersion without altering the underlying PV–wind gap or demonstrating lower temporal variability.
Overall, the study provides a controlled regional comparison of mean power, equivalent annual energy, relative dispersion, and biomass sensitivity. Because no independent experimental validation of the PV, wind, or biomass branches was performed, the results should be interpreted as comparative mean-condition estimates rather than validated predictions of actual generation. Future work should incorporate higher-resolution meteorological inputs, location-specific biomass availability, storage and dispatch, techno-economic and environmental assessment, and subsystem-level experimental or hardware-in-the-loop validation.
Author Contributions
Conceptualization, A.C.-S.; methodology, A.C.-S.; software, A.Á. and R.P.; formal analysis, P.P. and A.C.; investigation, A.C.-S. and A.Á.; writing—original draft preparation, A.C.-S.; writing—review and editing, P.P., R.P., and A.C.; visualization, A.Á.; supervision, A.C.-S. All authors have read and agreed to the published version of the manuscript.
Funding
This research received no external funding.
Institutional Review Board Statement
Ethical review and approval were waived for this study due to the fact that no humans or animals were used.
Informed Consent Statement
Not applicable.
Data Availability Statement
Data are contained within the article.
Acknowledgments
During the preparation of this manuscript, the authors used ChatGPT (GPT-5.6) by OpenAI (San Francisco, CA, USA) to support Spanish-to-English translation and improve linguistic clarity. The authors reviewed and edited all AI-assisted content and take full responsibility for the final manuscript.
Conflicts of Interest
The authors declare no conflicts of interest.
References
- Intergovernmental Panel on Climate Change. Climate Change 2022: Mitigation of Climate Change. Contribution of Working Group III to the Sixth Assessment Report of the Intergovernmental Panel on Climate Change; Shukla, P.R., Skea, J., Slade, R., Al Khourdajie, A., van Diemen, R., McCollum, D., Pathak, M., Some, S., Vyas, P., Fradera, R., et al., Eds.; Cambridge University Press: Cambridge, UK; New York, NY, USA, 2022. [Google Scholar] [CrossRef] [Scilit]
- Jurasz, J.; Canales, F.A.; Kies, A.; Guezgouz, M.; Beluco, A. A Review on the Complementarity of Renewable Energy Sources: Concept, Metrics, Application and Future Research Directions. Sol. Energy 2020, 195, 703–724. [Google Scholar] [CrossRef] [Scilit]
- Khare, V.; Nema, S.; Baredar, P. Solar–Wind Hybrid Renewable Energy System: A Review. Renew. Sustain. Energy Rev. 2016, 58, 23–33. [Google Scholar] [CrossRef] [Scilit]
- Deshmukh, M.K.; Deshmukh, S.S. Modeling of Hybrid Renewable Energy Systems. Renew. Sustain. Energy Rev. 2008, 12, 235–249. [Google Scholar] [CrossRef] [Scilit]
- Upadhyay, S.; Sharma, M.P. A Review on Configurations, Control and Sizing Methodologies of Hybrid Energy Systems. Renew. Sustain. Energy Rev. 2014, 38, 47–63. [Google Scholar] [CrossRef] [Scilit]
- Erdinç, O.; Uzunoglu, M. Optimum Design of Hybrid Renewable Energy Systems: Overview of Different Approaches. Renew. Sustain. Energy Rev. 2012, 16, 1412–1425. [Google Scholar] [CrossRef] [Scilit]
- Sinha, S.; Chandel, S.S. Review of Recent Trends in Optimization Techniques for Solar Photovoltaic–Wind Based Hybrid Energy Systems. Renew. Sustain. Energy Rev. 2015, 50, 755–769. [Google Scholar] [CrossRef] [Scilit]
- Bansal, A.K. Sizing and Forecasting Techniques in Photovoltaic–Wind Based Hybrid Renewable Energy System: A Review. J. Clean. Prod. 2022, 369, 133376. [Google Scholar] [CrossRef] [Scilit]
- Babu, S.; Rathore, S.S.; Singh, R.; Kumar, S.; Singh, V.K.; Yadav, S.K.; Yadav, V.; Raj, R.; Yadav, D.; Shekhawat, K.; et al. Exploring Agricultural Waste Biomass for Energy, Food and Feed Production and Pollution Mitigation: A Review. Bioresour. Technol. 2022, 360, 127566. [Google Scholar] [CrossRef] [Scilit]
- Saleem, M. Possibility of Utilizing Agriculture Biomass as a Renewable and Sustainable Future Energy Source. Heliyon 2022, 8, e08905. [Google Scholar] [CrossRef] [Scilit]
- McKendry, P. Energy Production from Biomass (Part 3): Gasification Technologies. Bioresour. Technol. 2002, 83, 55–63. [Google Scholar] [CrossRef] [Scilit]
- Molino, A.; Chianese, S.; Musmarra, D. Biomass Gasification Technology: The State of the Art Overview. J. Energy Chem. 2016, 25, 10–25. [Google Scholar] [CrossRef] [Scilit]
- Sansaniwal, S.K.; Pal, K.; Rosen, M.A.; Tyagi, S.K. Recent Advances in the Development of Biomass Gasification Technology: A Comprehensive Review. Renew. Sustain. Energy Rev. 2017, 72, 363–384. [Google Scholar] [CrossRef] [Scilit]
- Alhijazi, A.A.K.; Almasri, R.A.; Alloush, A.F. A Hybrid Renewable Energy (Solar/Wind/Biomass) and Multi-Use System Principles, Types, and Applications: A Review. Sustainability 2023, 15, 16803. [Google Scholar] [CrossRef] [Scilit]
- González, A.; Riba, J.R.; Rius, A. Optimal Sizing of a Hybrid Grid-Connected Photovoltaic–Wind–Biomass Power System. Sustainability 2015, 7, 12787–12806. [Google Scholar] [CrossRef] [Scilit]
- González, A.; Riba, J.R.; Esteban, B.; Rius, A. Environmental and Cost Optimal Design of a Biomass–Wind–PV Electricity Generation System. Renew. Energy 2018, 126, 420–430. [Google Scholar] [CrossRef] [Scilit]
- Icaza, D.; Borge-Diez, D.; Pulla Galindo, S.; Flores-Vázquez, C. Modeling and Simulation of a Hybrid System of Solar Panels and Wind Turbines for the Supply of Autonomous Electrical Energy to Organic Architectures. Energies 2020, 13, 4649. [Google Scholar] [CrossRef] [Scilit]
- Ministerio Coordinador de Producción, Empleo y Competitividad; Ministerio de Electricidad y Energía Renovable; Instituto Nacional de Preinversión. Atlas Bioenergético del Ecuador; Ministerio Coordinador de Producción, Empleo y Competitividad: Quito, Ecuador, 2014. Available online: https://historico.energia.gob.ec/biblioteca/ (accessed on 29 July 2026).
- Huld, T.; Müller, R.; Gambardella, A. A New Solar Radiation Database for Estimating PV Performance in Europe and Africa. Sol. Energy 2012, 86, 1803–1815. [Google Scholar] [CrossRef] [Scilit]
- Zhang, T.; Stackhouse, P.W., Jr.; Chandler, W.S.; Hoell, J.M.; Westberg, D.; Whitlock, C.H. A Global Perspective: NASA’s Prediction of Worldwide Energy Resources (POWER) Project. In Proceedings of the ISES Solar World Congress 2007, Beijing, China, 18–21 September 2007; NASA Technical Reports Server, Document ID 20070031737. Available online: https://ntrs.nasa.gov/citations/20070031737 (accessed on 29 July 2026).
- Sparks, A.H. nasapower: A NASA POWER Global Meteorology, Surface Solar Energy and Climatology Data Client for R. J. Open Source Softw. 2018, 3, 1035. [Google Scholar] [CrossRef] [Scilit]
- Izadyar, N.; Ong, H.C.; Chong, W.T.; Leong, K.Y. Resource Assessment of the Renewable Energy Potential for a Remote Area: A Review. Renew. Sustain. Energy Rev. 2016, 62, 908–923. [Google Scholar] [CrossRef] [Scilit]
- Chen, Y.; Liu, J.; Yu, D. Global Assessment of Wind–Solar Hybrid Systems: Unraveling Physical Constraints and Economic Potential for Sustainable Energy Deployment. Energy 2026, 344, 139898. [Google Scholar] [CrossRef] [Scilit]
- Malik, P.; Awasthi, M.; Sinha, S. A Techno-Economic Investigation of Grid Integrated Hybrid Renewable Energy Systems. Sustain. Energy Technol. Assess. 2022, 51, 101976. [Google Scholar] [CrossRef] [Scilit]
- Honorato, A.; Sadhukhan, J. Annual Biomass Variation of Agriculture Crops and Forestry Residues, and Seasonality of Crop Residues for Energy Production in Mexico. Food Bioprod. Process. 2020, 119, 1–19. [Google Scholar] [CrossRef] [Scilit]
- Alturki, F.A.; Awwad, E.M. Sizing and Cost Minimization of Standalone Hybrid WT/PV/Biomass/Pump-Hydro Storage-Based Energy Systems. Energies 2021, 14, 489. [Google Scholar] [CrossRef] [Scilit]



Disclaimer/Publisher’s Note: The statements, opinions and data contained in all publications are solely those of the individual author(s) and contributor(s) and not of MDPI and/or the editor(s). MDPI and/or the editor(s) disclaim responsibility for any injury to people or property resulting from any ideas, methods, instructions or products referred to in the content. |
© 2026 by the authors. Licensee MDPI, Basel, Switzerland. This article is an open access article distributed under the terms and conditions of the Creative Commons Attribution (CC BY) license.