


Abstract
This paper applies the submodeling method in computational fluid dynamics (CFD) to analyze the rear wing of a Formula Student race car. The goal is to improve the accuracy of flow characterization and aerodynamic load estimation for structural assessment. First, a global CFD simulation of the full vehicle captures upstream flow conditions, including velocity and pressure distributions. These results are then used as boundary conditions for a localized submodel with a much finer mesh. The refined model produces detailed pressure contours on the rear wing, which are transferred to a finite element model for structural analysis. This approach reduces overall computational cost while enhancing solution accuracy in the region of interest. Submodeling enables efficient integration of aerodynamic and structural analyses, supports tight project timelines, and eliminates the need for uniformly fine meshes across the entire domain, providing reliable, high-resolution data for targeted components.
1. Introduction
In motorsport, Computational Fluid Dynamics (CFD) simulations have become an essential tool in the design process, enabling increased efficiency in aerodynamic development while reducing the number of costly and time-consuming physical experiments [1]. Numerical methods allow for the rapid evaluation and optimization of different geometric configurations, which are subsequently validated through experimental measurements during the later stages of the development process.
The aerodynamic package of the Formula Student race car developed by the Formula Student Team of Óbuda University has already been designed and manufactured. This study focuses on the aerodynamic investigation of the rear wing. During the initial development phase, two-dimensional numerical simulations provided a suitable basis for selecting the wing profiles. However, the investigation of realistic flow phenomena, particularly three-dimensional vortex structures, required the application of three-dimensional CFD models.
However, a high-resolution three-dimensional simulation of the entire vehicle requires substantial computational resources. The use of meshes consisting of tens or even hundreds of millions of cells not only significantly increases computation time but also limits the iteration speed of the development cycle. To address this challenge, the submodeling technique is widely employed in engineering practice.
The method is particularly common in structural and mechanical finite element analyses, where it is used for the local investigation of stress concentrations, welded joints, bolted connections, or crack tips. In such cases, the results of the global structural model are utilized to define the boundary conditions of a locally refined submodel. This approach substantially reduces computational cost without significantly compromising the accuracy of the results in the critical regions of interest [2,3].
In mechanical problems, the applicability of submodeling is facilitated by the fact that the governing equations can generally be expressed in well-defined closed-form integral solutions or in linear or weakly nonlinear finite element formulations. In contrast, the Navier–Stokes equations that form the basis of computational fluid dynamics simulations are highly nonlinear, and their solutions are highly sensitive to the quality of the prescribed boundary conditions. Although the uniqueness of the solution is guaranteed under certain conditions, the transfer of data between global and local models may introduce significant uncertainties due to interpolation errors, differences in turbulence modeling, and numerical instabilities. Consequently, while submodeling techniques have proven effective in mechanical analyses, their applicability and reliability within a CFD environment still require further investigation.
The objective of the present research is therefore not only to evaluate the aerodynamic performance of the rear wing but also to determine the extent to which the submodeling technique can be applied in CFD simulations. The study investigates the impact of the method on mesh size, computational time, and the accuracy of the results. Particular attention is devoted to assessing how effectively the boundary conditions derived from the global model can reproduce the flow characteristics obtained from the full-domain simulation. Identifying potential limitations, instabilities, or losses in accuracy associated with the method is in itself considered a valuable engineering outcome, contributing to a better understanding of the practical applicability of CFD-based submodeling techniques.
CFD modeling is not in itself a new numerical method, and the literature devotes little attention to examining its application in the development of rear wings for Formula Student race cars or to assessing its practical engineering accuracy. This work addresses the still limited investigation of CFD-based submodeling for local aerodynamic analysis by assessing its practical applicability and limitations.
2. Materials and Methods
2.1. Background of the Development
A well-designed aerodynamic system achieves maximum efficiency and generates the highest downforce when all of its components operate in synergy. However, due to constraints in the development timeline, parallel design becomes essential. Accordingly, the development of the rear wing can begin even before the final geometries of components such as the front wing, sidepods, or Venturi tunnels are defined; for example, by relying on the flow field of a previous iteration or an earlier aerodynamic concept. This proactive strategy ensures that by the time the overall race car concept is finalized, the rear wing has already reached a highly optimized state, significantly reducing the number of iterations required during final integration.
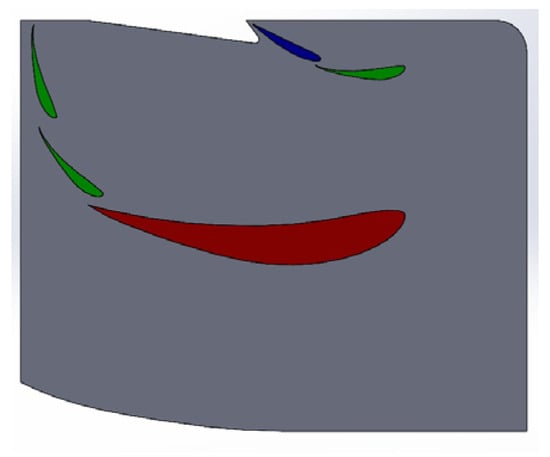
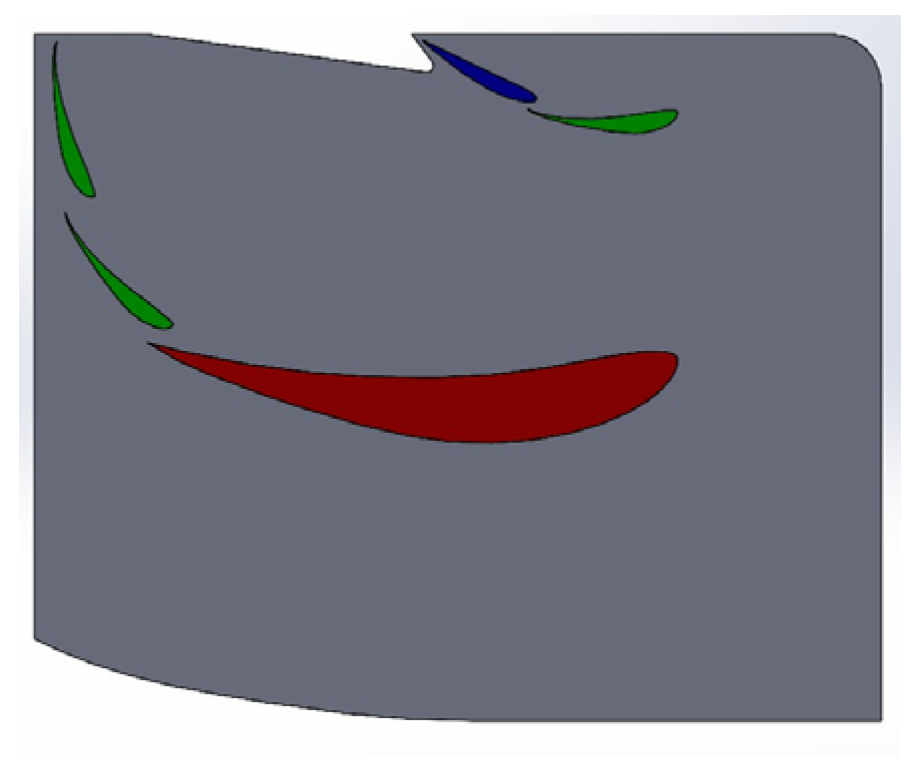
During the selection of airfoil profiles, we aimed to minimize the variety used in order to facilitate easier manufacturing, and we also sought to maintain consistent chord lengths for each profile. The selected profiles are shown in Figure 1. In motorsport, one of the most widely used airfoils is the Eppler-type high lift profile, where the Cl/Cd (lift coefficient/drag coefficient) ratio is reliable, and as will be demonstrated later, it delivers among the best performance [4]. With increasing angle of attack, the reduction in Cl is the smallest for this profile, indicating minimal flow separation. It can therefore be established that this profile provides more reliable performance during dynamic vehicle behavior, such as braking, when higher angles of attack occur. For this reason, it was chosen as the primary profile. Furthermore, it features the longest chord length, corresponding to the highest risk of flow separation, and it is from this element that we intended to generate the majority of the downforce.
Figure 1.
Selected profiles E423 (red), S1223 (green), and NACA4412 (blue).
The Selig-type profile (S1223) had already been used by the team in a previous rear wing design [5]. It is a high-lift airfoil commonly employed in Formula Student competitions [6]. The S1223 profile is designed for low-Reynolds-number operation; under the investigated Formula Student conditions, the relevant Reynolds-number range was approximately Re = 2 × 10⁵, based on the local flow velocity and airfoil chord. The conclusions of the present approximation should therefore primarily be interpreted within this operating range (Figure 1).
The standardized NACA 4412 profile was selected for the uppermost position. We aimed to avoid significant flow separation in this region, as it is located above the other profiles.
2.2. Initial Phase of the Design Process
As an initial step in the design process, the geometry of the rear wing was developed, which included the selection of appropriate airfoil profiles and their spatial arrangement relative to each other, initially without considering the effects of the endplates.
The investigation began with the analysis of the main plane, focusing on the optimization of chord length and angle of attack. The primary design objective was to minimize drag while maintaining the required level of downforce. To achieve this, a baseline configuration with a relatively large chord length and a low angle of attack was adopted. After finalizing the main plane, the fine-tuning of the multi-element wing system followed. This involved the precise determination of geometric parameters such as the gap and overlap between the profiles. For this purpose, empirically derived rules of thumb and aerodynamic guidelines available in the literature [7] were used as the basis for the design.
During the design process, particular attention had to be paid to the 2026 competition regulations [8], which introduced significant constraints on the configuration of the aerodynamic system. The most important change is the reduction in the rear-wing mounting height by 100 mm, resulting in a substantially smaller volume available for the placement of the wing assembly. To compensate for these spatial limitations and to achieve the required aerodynamic performance, the geometry was supplemented with two additional airfoil elements (flaps), positioned above the main plane. This modification not only generates additional downforce but also deliberately exploits the Venturi effect formed in the gaps between the profiles. This channeling effect accelerates the flow and energizes the boundary layer, thereby enhancing the overall aerodynamic efficiency of the multi-element system.
2.3. 2D Numerical Simulations
During the optimization of the geometric parameters of the main plane, the aerodynamic behavior of two selected airfoil sections (the Eppler E423 and the Selig S1223) was investigated using parametric simulations. In the first phase, the effect of chord length was analyzed over the range of 340 mm to 440 mm at a constant angle of attack of 0 degrees. The evaluation of the simulation results revealed a clear trend for both airfoils.
As the chord length increased, the aerodynamic efficiency—defined as the ratio of lift coefficient to drag coefficient (Cl/Cd)—showed a marked improvement. The physical explanation for this phenomenon is that the increase in downforce resulting from the pressure difference over the enlarged surface is significantly more dominant than the additional skin friction drag caused by the increased surface area.
The investigated chord length range was determined by the geometric constraints of the multi-element wing system. The objective was to identify a maximum chord length that, together with the additional flap elements, would still fit within the strictly defined bounding box specified by the competition regulations [8].
After fixing the maximum allowable chord length, the angle-of-attack sensitivity of the profiles was investigated over the range of 0 to 4 degrees. The objective of this study was to determine the optimal setting angle at which the profile operates with maximum efficiency without experiencing significant flow separation on the suction side. Based on the results, the aerodynamic optimum for both examined profiles was found to be at approximately 2 degrees angle of attack. Beyond this critical point, the lift coefficient (Cl), which is responsible for downforce, began to decrease, indicating early boundary layer separation and the onset of stall. To avoid the resulting drastic performance degradation, the installation angle of the main plane was ultimately fixed at 2 degrees. This value maximizes the downforce potential inherent in the profile while still providing sufficient safety margin against premature flow separation.
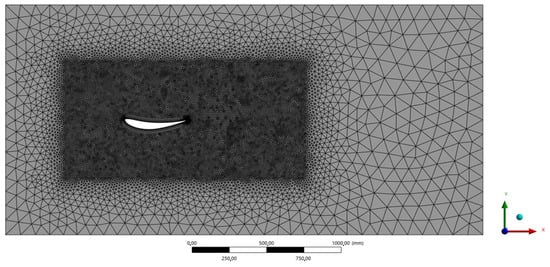
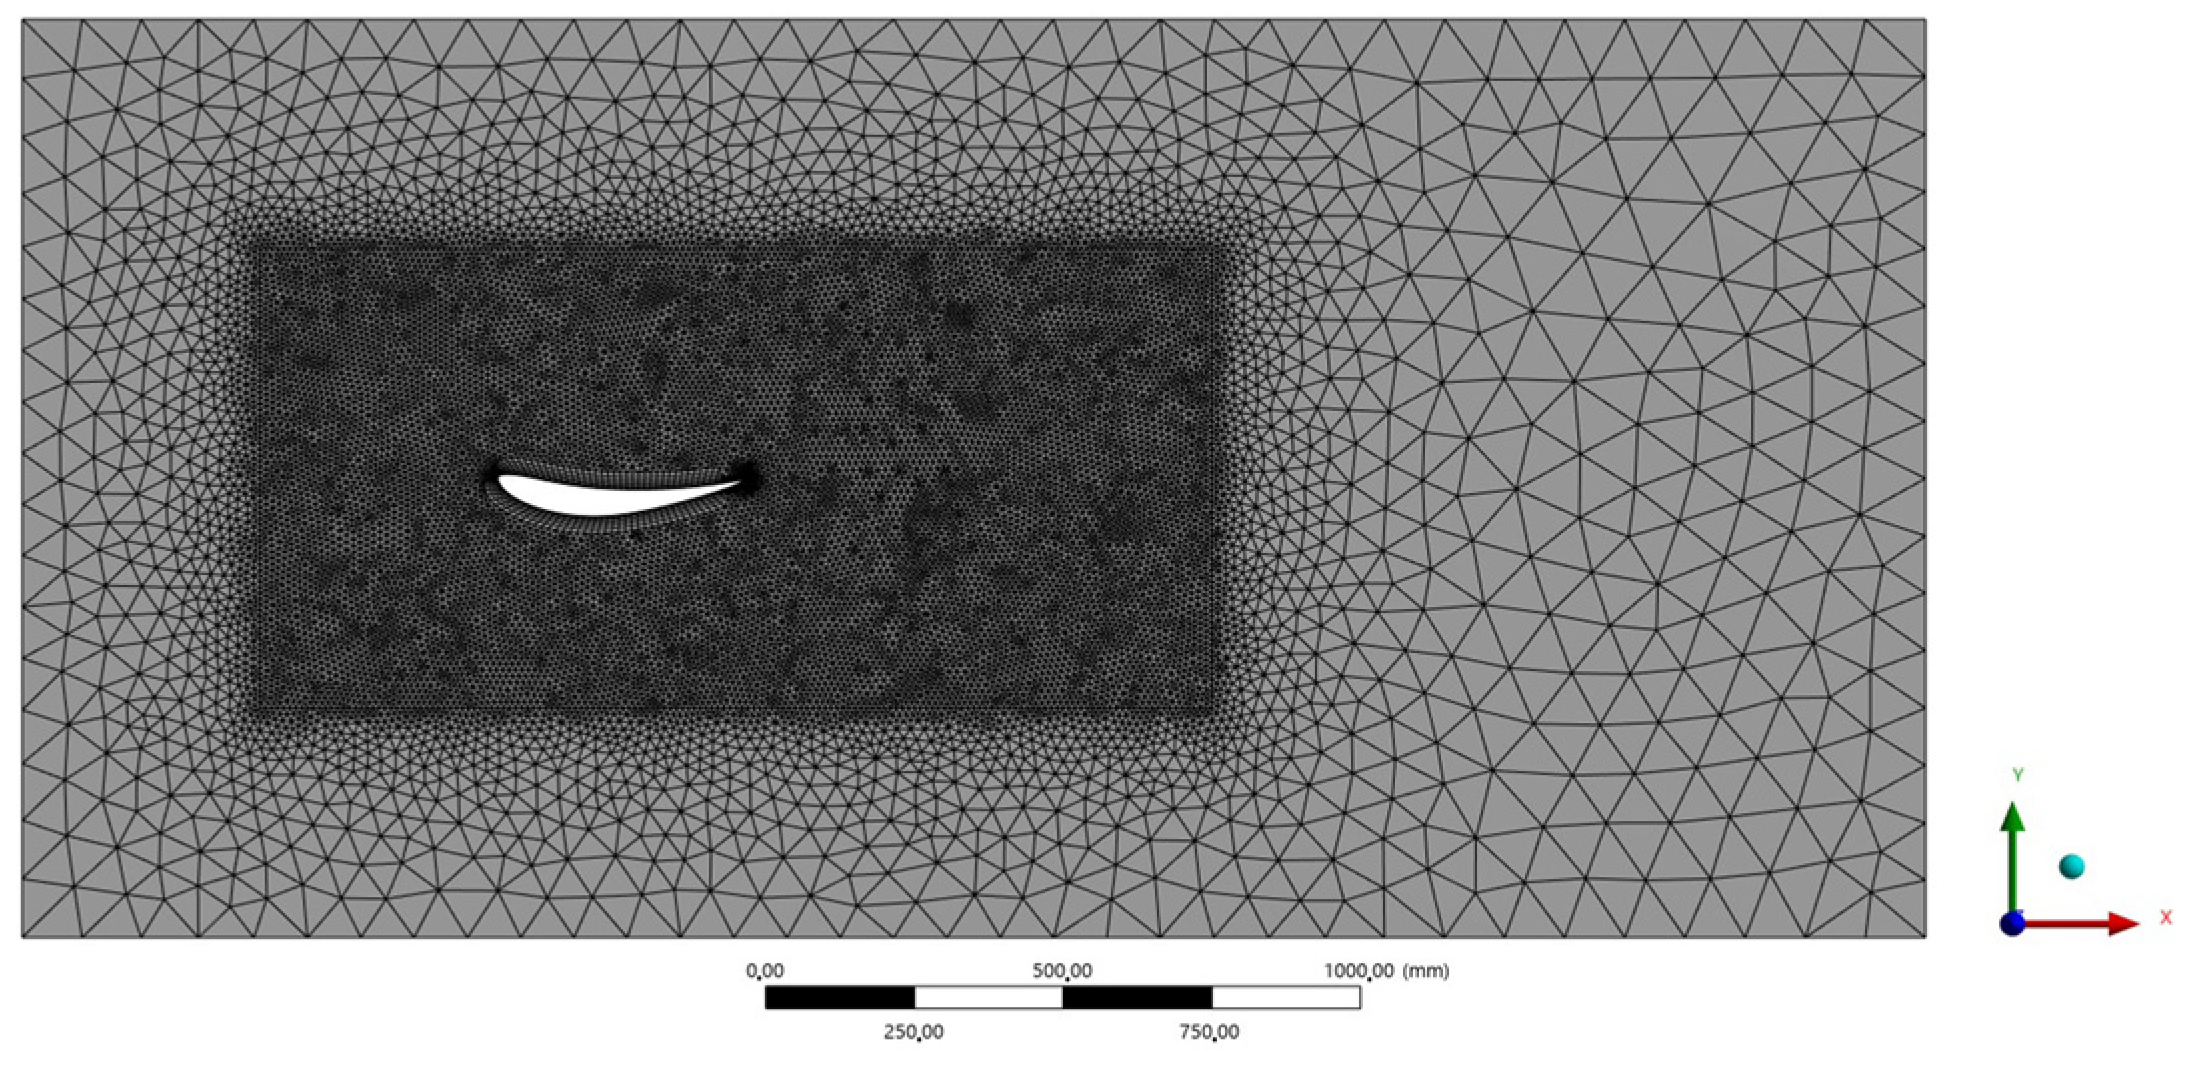
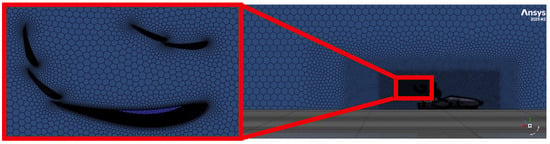
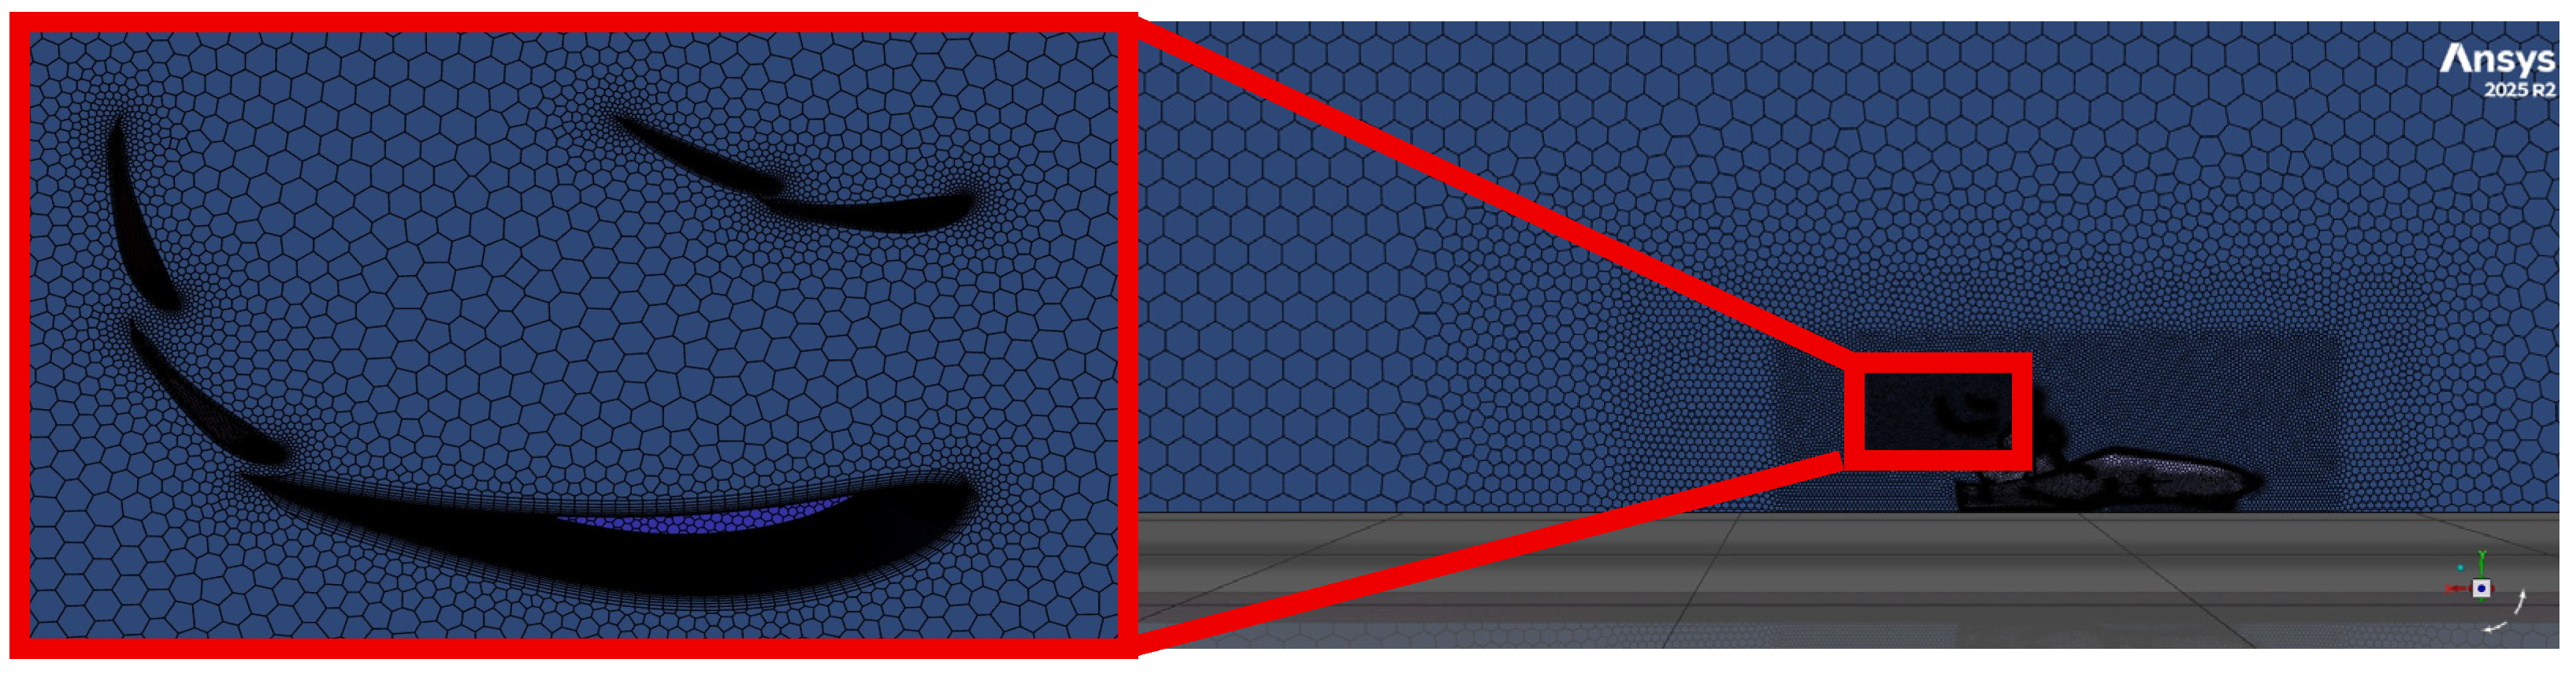
The mesh generation process was carried out in Ansys Mechanical 2024 R2, where a global cell size was first defined for the entire flow domain. To accurately capture more complex physical phenomena, local mesh refinement was applied in the immediate vicinity of the airfoil as well as along its surface. Proper resolution of the boundary layer was essential for the accurate analysis of wall-bounded flow and potential flow separation. To achieve this, so-called prism layers were generated along the contour of the airfoil. This approach creates prismatic cells that grow in the direction normal to the surface. The thickness, number, and growth rate of the prism layers were adjusted to meet the near-wall resolution requirements of the selected turbulence model (Figure 2).
Figure 2.
2D simulation mesh.
2.4. Simulation Analysis of the Complete 3D Model
The investigation of the real aerodynamic behavior of the complete system and its global effect on the vehicle requires an integrated analysis of the full-vehicle model. To achieve this, it is necessary to establish a three-dimensional CFD simulation environment. A significant portion of the boundary conditions and software settings applied in the earlier analyses were also utilized in the three-dimensional simulations (Figure 3).
Figure 3.
3D numerical simulation mesh.
Following the import of the three-dimensional geometry, the definition of local mesh refinement zones was carried out. Individual volumetric refinement regions were created around specific components of the vehicle along the x, y, and z axes (Table 1).
Table 1.
The extents of the different meshing regions.
During the refinement around the front and rear wheels, the extent of the refinement zone was increased in nearly all directions by one-tenth of the original wheel dimensions. An exception to this was the positive x-direction, corresponding to the wake region downstream of the component, where the extension factor was set to a full unit.
In practice, this means that the refined mesh extends downstream in the flow direction over a distance equal to the wheel’s length along the x-axis, thereby enabling accurate resolution of the shed vortical structures.
To ensure a gradual transition of the computational mesh, three nested volumes were created. First, a near-field region covering the immediate surroundings of the vehicle was defined, followed by an intermediate region, and finally a far-field zone encompassing the outer flow domain (Table 2 and Table 3). Outside these specifically parameterized volumes, the cell sizes are governed by a global mesh sizing applied to the entire simulation domain. After defining the volumetric refinement regions, the surface mesh sizing was specified, followed by a rigorous evaluation of mesh quality. During this process, particular attention was given to the skewness metric at surfaces, which describes how much a given mesh element (such as a triangle, tetrahedron, quadrilateral, or hexahedron) deviates from an ideal, perfectly regular shape, and for volumetric mesh, we examined the orthogonal quality (Table 4). If critical values are identified during this assessment, the mesh structure can be effectively optimized and improved using the mesh repair functions integrated into the software.
Table 2.
Mesh sizes in the different regions.
Table 3.
Surface mesh size.
Table 4.
Boundary layers’ settings.
During the aerodynamic development of a race car, the application of a low y+ approach is essential on critical components (airfoil profiles) in order to accurately capture flow separation and determine aerodynamic drag. At the same time, in less-relevant regions (e.g., the chassis and body panels, the driver’s helmet, and the suspension), the mesh density can be maintained at an optimal level using wall functions. This dual approach is handled most efficiently by the k–ω SST (Shear Stress Transport) model [6], which automatically switches between the two wall treatment methods depending on the mesh resolution, thereby ensuring both stability and accuracy.
Based on the target y+ value, the boundary layer thickness and the height of the first cell adjacent to the wall are determined for the different surfaces (taking into account that a second-order mesh will be used, thus the height is doubled). To achieve this, it is necessary to calculate the Reynolds number, the friction coefficient, and the wall shear stress, from which the friction velocity can be derived. Finally, for the first cell height, the required number of prism layers and the growth rate are defined in order to reach the overall boundary layer thickness [9]. Once the parameters required for generating the boundary layer mesh (prism layers) are available from the performed analytical calculations, the volumetric meshing method applied is the poly-hexcore approach. This structure is significantly more advantageous from the perspective of optimizing the cell count, as it is capable of filling the available flow domain much more efficiently.
Upon completion of the mesh generation process, a rigorous mesh quality assessment is performed; however, at this stage, the focus is on orthogonal quality, which evaluates how neighboring cells are spatially connected to each other.
3. Results
Technic of Submodel Developing
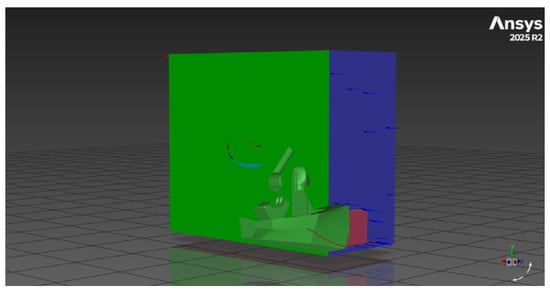
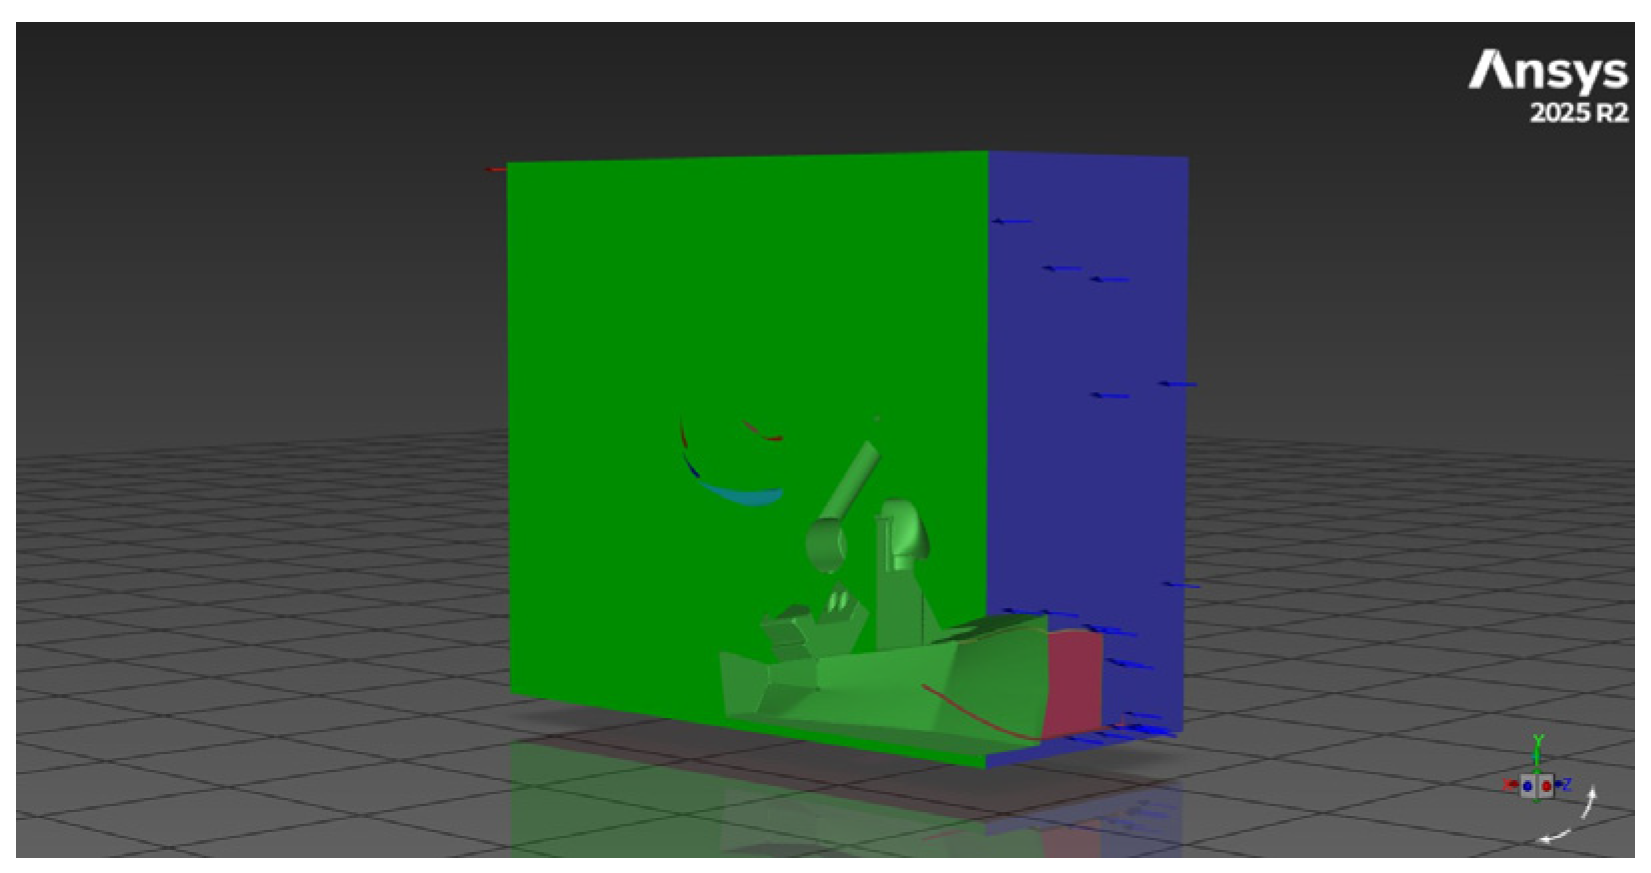
When applying the submodeling technique, the results of a comprehensive global simulation are used as input boundary conditions for a specific local model. This approach enables a much more accurate analysis with finer spatial resolution of a selected part of the system under investigation. By using a local submodel (Figure 4), the overall size of the computational mesh and the number of cells can be drastically reduced, which significantly facilitates simulations on workstations with limited computational resources.
Figure 4.
Submodel.
During the development of the local geometry, only the rear wing is considered; therefore, the extent of this component is taken as the nominal reference when defining the size of the simulation domain. Based on this principle, the surrounding flow domain is significantly reduced compared to the full-vehicle analysis. To ensure appropriate flow conditions, a distance equal to twice the nominal reference length is maintained upstream of the wing, above it, and along the outer lateral boundaries. In the downstream region behind the trailing edge, in order to accurately capture the developing wake, the longitudinal extent is defined as five times the reference value.
During the parameterization of the solver, the inlet boundary conditions are transferred to the model. It is crucial that the flow data are exported from the global simulation precisely at the spatial plane where the submodel geometry was previously sectioned. At the submodel inlet, the spatially resolved velocity field and the corresponding turbulence-model variables are extracted from the global solution at the exact cutting plane and mapped onto the local boundary. Consistent turbulence modeling in the global and local domains is therefore required to minimize inconsistencies introduced during data transfer. It logically follows from this procedure that the local submodel must strictly employ the same turbulence model as used in the global simulation. The runtime of extensive three-dimensional full-vehicle simulations typically ranges from 6 to 9 h (and occasionally up to 15 h), with a mesh size of approximately 8–15 million cells. During the development of the submodel, the investigated flow domain was significantly reduced, focusing exclusively on the vicinity of the rear wing. It is important to emphasize that, at this stage, only the aerodynamic behavior of the rear wing is analyzed. The primary objective of the submodeling approach is to establish a reliable and highly parameterizable, focused design methodology specifically for rear aerodynamic components. During the comparative analysis performed using the submodel, the following results were obtained (Table 5.).
Table 5.
Comparison of numerical results.
It can be concluded from Table 4 that the submodel significantly overestimates the results compared to the original model, predicting a total rear wing downforce that is approximately 30% higher. This phenomenon may be attributed to the excessive reduction in the virtual wind tunnel height, resulting in a large blockage ratio at the inlet. Consequently, the airflow accelerates within the restricted space, leading to increased downforce. In wind tunnel testing, this issue is typically addressed using correction factors [10] to approximate real-world values. Therefore, a comparison was carried out with the available wind tunnel measurement results.
In the resulting equation, A denotes the frontal area of the vehicle, while C represents the inlet cross-sectional area. The calculated result is Flc = −435.77 N. The deviation is 25%, which can be considered an improvement. The simulations were completed within 2–3 h using approximately 3–5 million cells, compared with 6–15 h and 8–15 million cells for the full-vehicle model (Table 6). Consequently, within the computational time required for one full-model simulation, approximately 2–5 rear-wing design iterations can be evaluated using the submodel, depending on the respective runtimes.
Table 6.
Comparison of resource requirements: full-domain vs. submodel simulation.
In the case of two-dimensional simulations, the aim was to perform a relative comparison of results obtained using an identical methodology. If this engineering compromise is acknowledged, and it is accepted that achieving fully accurate absolute results requires the execution of a full-vehicle global simulation, then this local analysis approach proves to be extremely useful.
The experience and methodological knowledge gained in this way provide an excellent and robust foundation for the efficient design of significantly more complex aerodynamic components in the future.
4. Conclusions
A measurable deviation can still be observed between the results of the two approaches; however, its magnitude is considered acceptable in the practice of aerodynamic simulations. As a consequence, the development and design processes can be significantly accelerated. At the same time, the accuracy of the method can be further improved in the future through a more detailed and precise definition of boundary conditions, which may serve as the subject of further research and refinement. The concept of the submodeling approach can also be extended to the application of pressure fields transferred from the global aerodynamic model to a finite element mechanical simulation. By directly utilizing this exported spatial dataset, the structural loading of the internal wing components and the supporting mounting elements could be evaluated with significantly greater accuracy and reliability. Since this type of complex software integration is already technologically feasible, it would be worthwhile to investigate it in more detail in future development projects and to incorporate it into everyday engineering workflows.
Author Contributions
Conceptualization, I.M. and V.A.; methodology, I.M. and V.A.; software, M.Z.I.; validation, I.M. and G.F.; formal analysis, G.F.; investigation, V.A.; resources, I.M.; data curation, M.Z.I.; writing—original draft preparation, M.Z.I.; writing—review and editing, I.M., S.V.A. and G.F.; visualization, M.Z.I.; supervision, G.F.; project administration, I.M. All authors have read and agreed to the published version of the manuscript.
Funding
This research received no external funding.
Institutional Review Board Statement
Not applicable.
Informed Consent Statement
Not applicable.
Data Availability Statement
Data can be requested from the corresponding authors.
Acknowledgments
The authors would like to thank the support of Óbuda University and Széchenyi István University.
Conflicts of Interest
The authors declare no conflicts of interest.
References
- Kirchberger, M. CFD Simulation and Validation of a Formula Student Car. Doctoral Dissertation, Technische Universität Wien, Vienna, Austria, 2023. [Google Scholar]
- Perić, M.; Tonković, Z.; Maksimović, K.S.; Stamenković, D. Numerical Analysis of Residual Stresses in a T-Joint Fillet Weld Using a Submodeling Technique. FMA Trans. 2019, 47, 183. [Google Scholar] [CrossRef] [Scilit]
- Curreli, C.; Viceconti, M.; Di Puccio, F. Submodeling in wear predictive finite element models with multipoint contacts. Int. J. Numer. Methods Eng. 2021, 122, 3812–3823. [Google Scholar] [CrossRef] [Scilit]
- Airfoil Tools. Available online: http://airfoiltools.com/airfoil/details?airfoil=e423-il (accessed on 28 May 2025).
- Airfoil Tools. Available online: http://airfoiltools.com/airfoil/details?airfoil=s1223-il (accessed on 28 May 2025).
- Loução, R.; Duarte, G.O.; Mendes, M.J.G.C. Aerodynamic Study of a Drag Reduction System and Its Actuation System for a Formula Student Competition Car. Fluids 2022, 7, 309. [Google Scholar] [CrossRef] [Scilit]
- McBeath, S. Competition Car Downforce: A Practical Guide, Hardcover; Motorbooks International: Beverly, MA, USA, 1998. [Google Scholar]
- Formula Student Rules 2026 Version 1.1. Formulastudent. Available online: https://www.formulastudent.de/fileadmin/user_upload/all/2026/rules/FS-Rules_2026_v1.1.pdf (accessed on 1 March 2026).
- Schlichting, H.; Gersten, K. Boundary-Layer Theory; Springer: Berlin, Germany, 2017. [Google Scholar]
- Katz, J. Race Car Aerodynamics: Designing for Speed, 2nd ed.; Bentley Publishers: Cambridge, MA, USA, 1996; pp. 1–14, 23–49, 99–145, 147–171. [Google Scholar]

Disclaimer/Publisher’s Note: The statements, opinions and data contained in all publications are solely those of the individual author(s) and contributor(s) and not of MDPI and/or the editor(s). MDPI and/or the editor(s) disclaim responsibility for any injury to people or property resulting from any ideas, methods, instructions or products referred to in the content. |
© 2026 by the authors. Licensee MDPI, Basel, Switzerland. This article is an open access article distributed under the terms and conditions of the Creative Commons Attribution (CC BY) license.