


Abstract
The effects of carbon nanotubes (CNT) on the thermal properties of polyethylene/polypropylene (PE/PP) blends were investigated, with the addition of CNT at levels of 0.59, 1.18 and 2.35 wt%. The melting and crystallization properties of the materials were examined by DSC. The thermal stability of the materials was measured up to 800 °C by thermogravimetry. It can be stated that by adding CNT, the compatibility of both the 40–60 and 60–40 wt% PE-PP mixtures was increased, because in most nanocomposites, one-peak crystallization can be observed. Due to the nucleating effect of CNT, the mixtures approach the higher thermal values of PP. The 1.18 and 2.35 wt% 40–60 wt% nanocomposites have the best thermal stability, as the final decomposition temperature rises by ~50 °C to ~600 °C. Their decomposition rate also increases relatively evenly. The temperature at the maximum rate of decomposition of 1.18 and 2.35 wt% of 60–40 wt% nanocomposites increases to around 80 °C.
1. Introduction
Polyolefins are the most widely produced synthetic plastics, obtained through the polymerization of olefin monomers, also known as alkenes [1]. Olefins are unsaturated hydrocarbons containing a carbon–carbon double bond. The simplest olefin is ethylene from which polyethylene is made. Other polymers derived from olefins include polypropylene and polyisobutylene. Their use is advantageous because they are produced using energy-, cost-, and raw material-efficient catalytic processes, free of solvents and harmful byproducts. In addition, polyolefins have a low carbon footprint. By 2017, polyolefins accounted for ~63% of total polymer production, with 76 million tons of polyethylene and 56 million tons of polypropylene produced annually, and this volume continues to grow year by year [1].
Blends of two immiscible polymers, such as polyethylene (PE) and polypropylene (PP), could form different phase morphologies, which can be changed by adding nanoparticles [2,3]. Carbon nanotubes diffuse selectively to either one phase or are located at the interface, which increases the interfacial adhesion between the phases [4]. For the thermal characterization of PE/CNT and PP/CNT nanocomposites, the degree of crystallinity (XC) obtained during the second heating—which is proportional to the enthalpy change (ΔH)—the crystallization rate (vC), the peak melting temperature (Tpm), the estimated onset crystallization temperature (Teic), and the peak crystallization temperature (Tpc) are generally used. Although the degree of crystallinity generally increases with CNT content [5], the opposite effect has also been reported, as CNTs may hinder the formation of large, well-defined lamellae, increase the density of grain boundaries, and introduce additional structural defects [6]. The change in XC was ±10% in all studies. Some studies have found that although a loading below 1% causes only a slight decrease [7] or increase [8] in XC, it still increases the crystallization rate in all cases [7,9]. Since carbon nanotubes generally act as good nucleating agents, they increase the crystallization rate of the mixture [7,10,11]; however, this depends on the dispersion of the filler, so it generally increases with longer mixing times [12]. The physical limit of the crystallization rate is around 1.5% CNT, at which point it is no longer the nucleation rate that increases, but rather the growth of the crystal nuclei [12]. The onset and peak crystallization temperatures also increased in all cases studied [13,14], by 2–4 °C at a CNT content of 1 wt% [5,6] and by 18 °C at 20 wt% [15].
The thermal stability of composites can be characterized by the temperature at which 5% of the material has decomposed (T5%) and the temperature measured at the maximum decomposition rate (Tmax), which corresponds to the inflection point of the decomposition curve (TC). Sometimes the extrapolated onset temperature (TA) is also determined, but it provides a similar value to T5%, although it is influenced by the initial slope of the curve [6]. The addition of CNTs increases the above properties of polyolefins in all cases studied. Among polyolefins, it is more effective in the PE matrix than in the PP matrix [16]. According to Kodjie et al., no significant increase can be expected after the formation of the CNT percolation network (~0.2 wt%) [6]. However, a greater improvement can be achieved at the T5% value, even up to 30–60 °C [5,17], because CNTs prevent the escape of polymer combustion products into the gas phase and reduce the mobility of polymer chains. Since the difference between Tmax and T5% decreases, the weight–temperature curve becomes steeper, and after the onset of decomposition, CNTs “accelerate” the degradation [6].
Based on the literature, there are several studies investigating polyolefin (PP or PE)/CNT nanocomposites, but a vanishingly small number have studied PE/PP blend as a matrix with CNT. That is why PE/PP/multi-wall carbon nanotube (MWCNT) nanocomposites were made in different compositions (40–60 and 60–40% PE/PP blends) with 0.59; 1.18, and 2.35 wt% MWCNT content. In our earlier rheological study of 40–60 wt% series, the rheological percolation threshold was found between 0.59 and 1.18 wt% CNT [18]. The aim of this study is to determine the effect of CNT on the crystallization and degradation processes of these blends.
2. Materials and Methods
MOL TIPPLEN H 145 F polypropylene (PP) (MOL Group TVK Nyrt. Hungary), TIPELIN FA 381-10 high-density polyethylene (HDPE) (MOL Group TVK Nyrt., Tiszaújváros, Hungary), and Nanocyl PlasticylTM PP2001 (Nanocyl SA, Birla Carbon, Belgium) type PP/MWCNT masterbatch were chosen to produce nanocomposites. According to the literature, CNT is effective even under 5 wt%.
From this aspect, 40–60 wt% and 60–40 wt% HDPE/PP-/MWCNT blends were made based on the masterbatch data sheet with 0.5, 1, and 2 wt% of CNT, then CNT content was clarified by Thermogravimetry (TA Q50) for 0.59, 1.18, and 2.35 wt%, as can be seen in Table 1. The experimental setup consisted of a Brabender extruder, the die of which was coupled to an IDMX® (Independently Driven Dynamic Melt Mixer), a water-filled cooling bath, and a Collin Teach-Line CSG171T grinder (Dr. Collin GmbH, Maitenbeth, Germany). The applied zone temperatures in the Brabender Plastograph extruder (Anton Paar, Graz, Austria) were 210, 210, 200, and 190 °C, while the screw speed was 80 1/min. The IDMX mixer consists of stationary and rotating elements, which provide dynamic mixing. The applied temperature was 210 °C, and the screw speed was 40 1/min. Each blend was mixed twice through the production line for the purpose of increasing the dispersion of the MWCNTs.
Table 1.
Investigated material compositions.
The melting and crystallization properties of the materials were examined by differential scanning calorimetry (DSC) analytical equipment (TA Instruments, Q200, New Castle, DE, USA) in an inert (nitrogen) atmosphere, according to the MSZ ISO 11357-3:2025 standard [19]. The measuring method consisted of heating–cooling–reheating cycles between 30 and 200 °C with changes of 20 °C/min. During the evaluation, the characteristic temperatures of the second heating and cooling cycles (extrapolated onset, peak, and final temperatures), as well as the enthalpy changes in the processes were determined, and the crystalline fraction of the materials from the enthalpy of melting was calculated using Equation (1) [20].
where ΔHm is the change in melting enthalpy measured during the second heating [J/g], and ΔH0m is the thermodynamic change in melting enthalpy [J/g] corresponding to theoretical 100% crystallization of partially crystalline polymers. In the PE-PP blends, the enthalpy changes for the PP and PE peaks were determined separately, which resulted in values approximately 5–10 J/g lower than if the enthalpy change in the blend had been determined in one section. This was necessary because the thermodynamic enthalpy of the raw materials differs: that of PE is 293 J/g, while that of PP homopolymers is 207 J/g [20]. The thermal stability of the materials was examined by thermogravimetry (TG) (TA Instruments, Q50) in inert (nitrogen) atmosphere, according to the MSZ EN ISO 11358-1:2022 standard [21]. The ~10 mg sample was heated up to 800 °C at 20 °C/min and the mass loss was measured by the equipment.
3. Results and Discussion
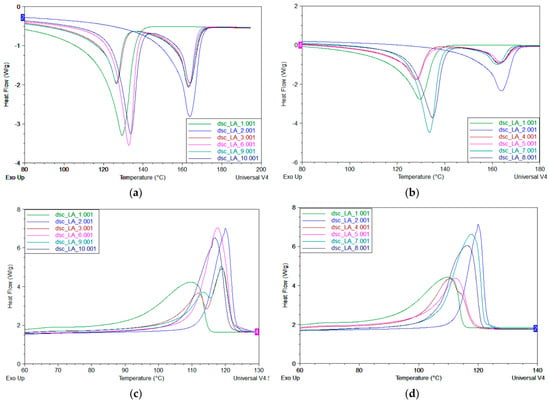
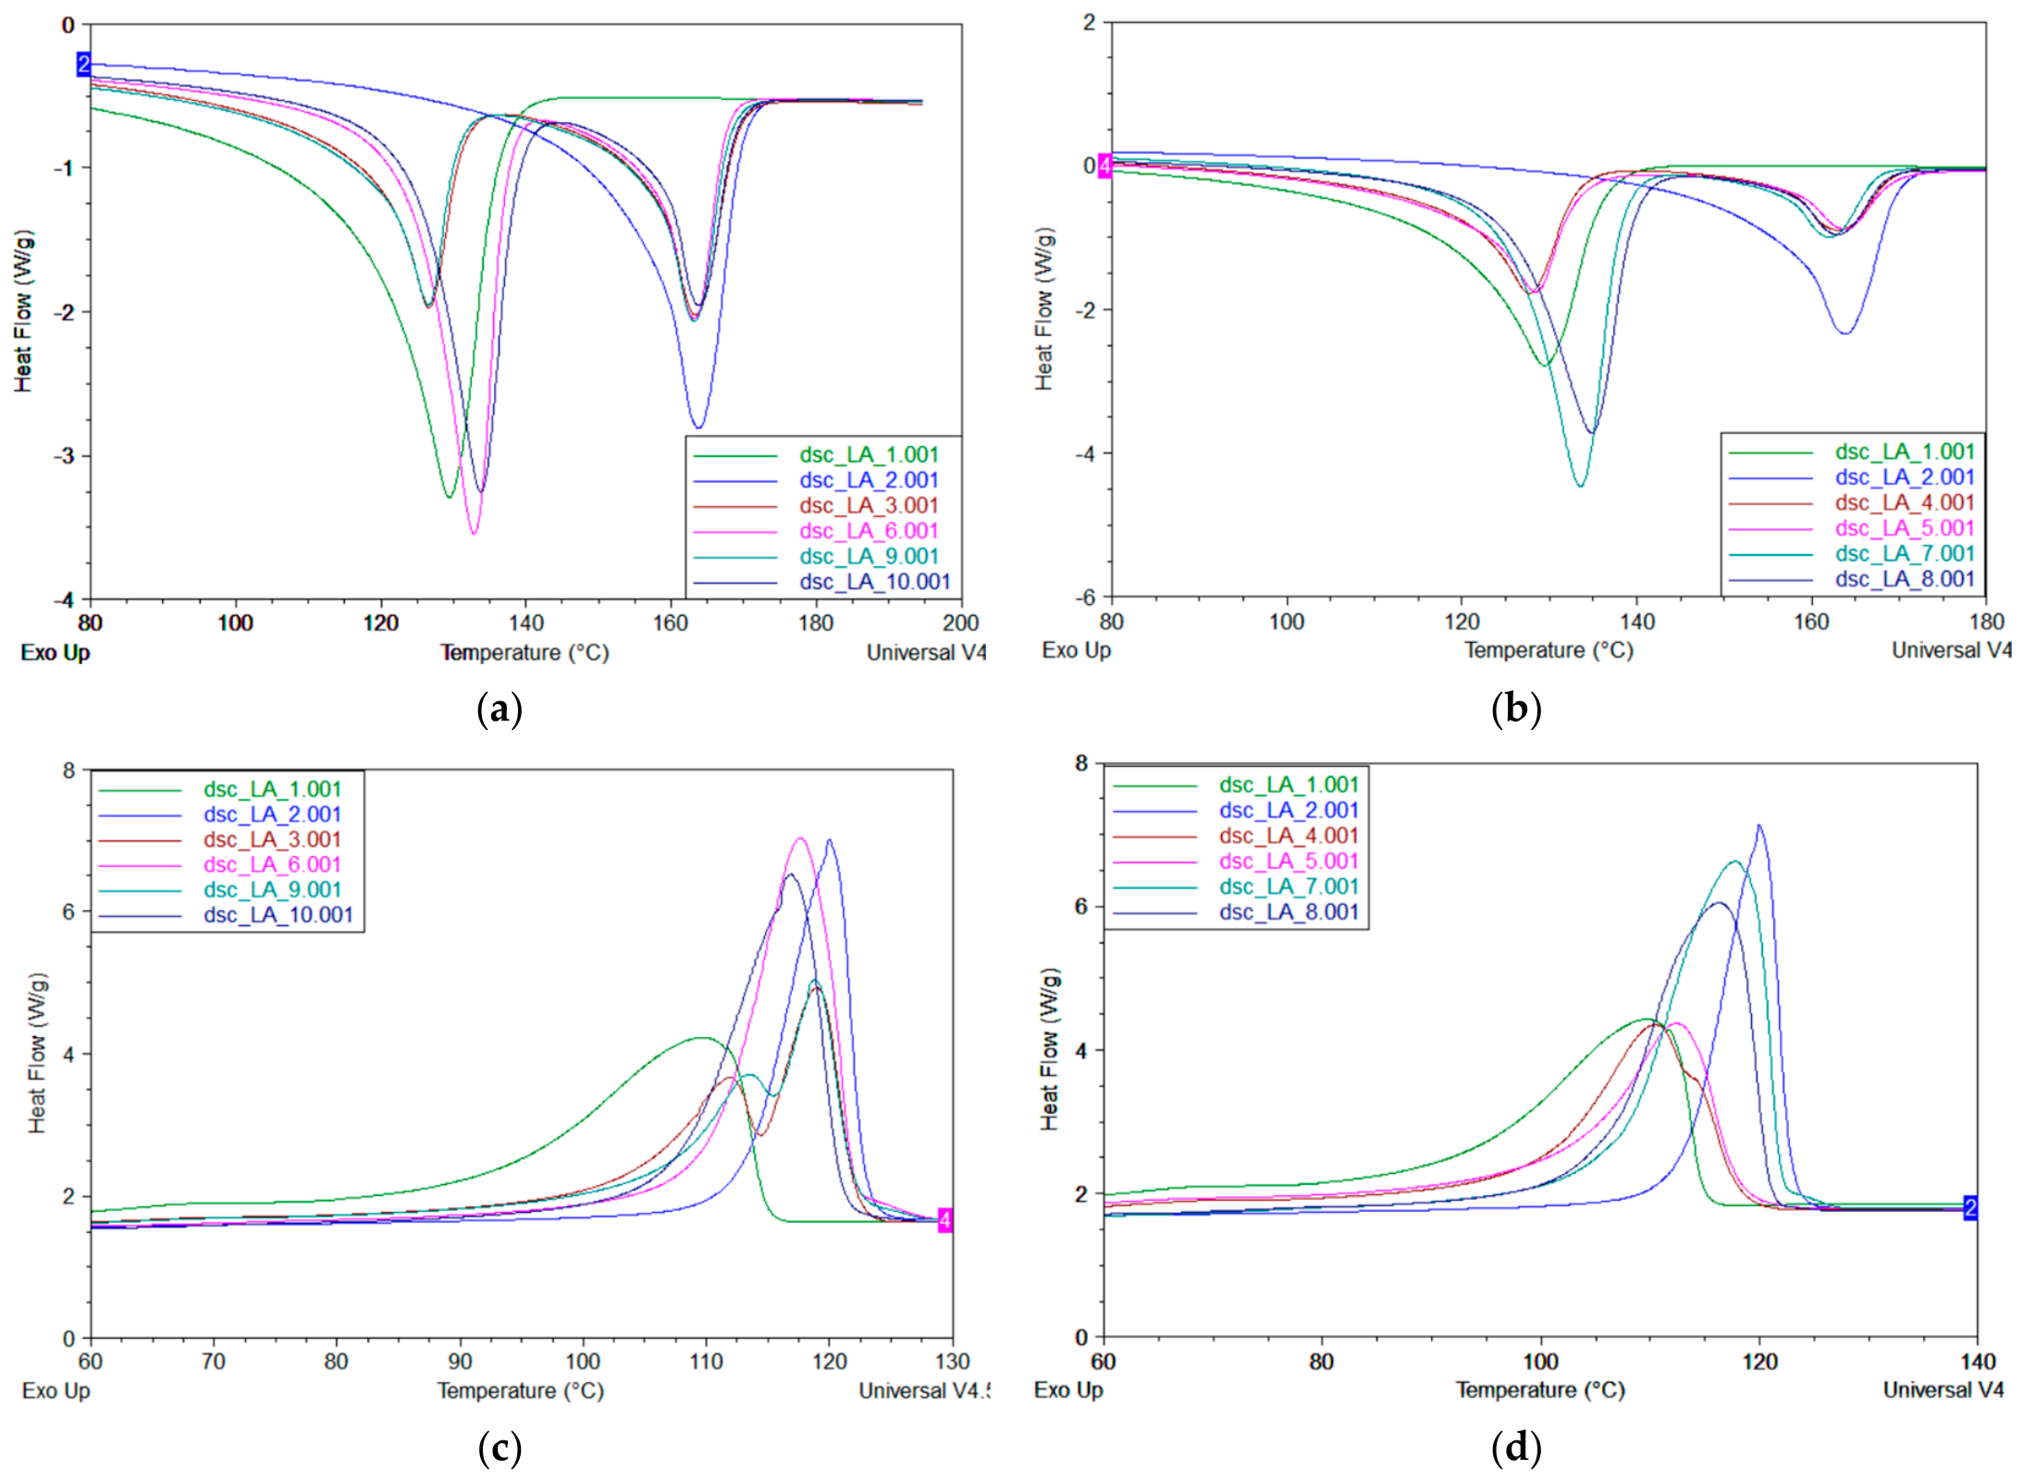
The melting endothermic curves of PE-PP blends obtained from a second heating cycle show a two-peak melting profile (Figure 1a,b), which is characteristic of immiscible blends.
Figure 1.
The PE/PP/MWCNT nanocomposites with 40–60 wt% (left) and 60–40 wt% (right) during the (a,b) second heating cycle and (c,d) cooling cycles.
The peak temperatures of unfilled blends are a few degrees lower (max. 3 °C) than those characteristic of the base materials. Due to the reinforcing material, both the size and position of the peak characteristic of the HDPE phase may change, but the peak associated with the PP phase is reduced by only 1 °C, as it is presumed that the CNT is located in the PE phase, as determined by Borhot Moussa [22]. Among the 40–60% blends, the sample containing 2.35 wt% CNTs (identified as 9) shows no change in the values compared to the unfilled material. Among the 60–40% blends, the sample with 1.18% CNT (identified as 5) shows similar behavior. During the second heating cycle, the Tpm of the blends decreased slightly compared to those of the original raw materials. The CNTs did not significantly alter the Tpm of the PP phase in the blends, as CNTs generally diffuse into the PE phase [23]. The Tpm characteristic for HDPE phase, however, increased with CNT content most significantly in the 0.59% composite (~7 °C).
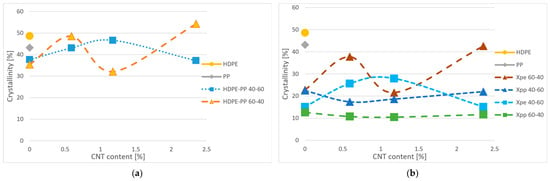
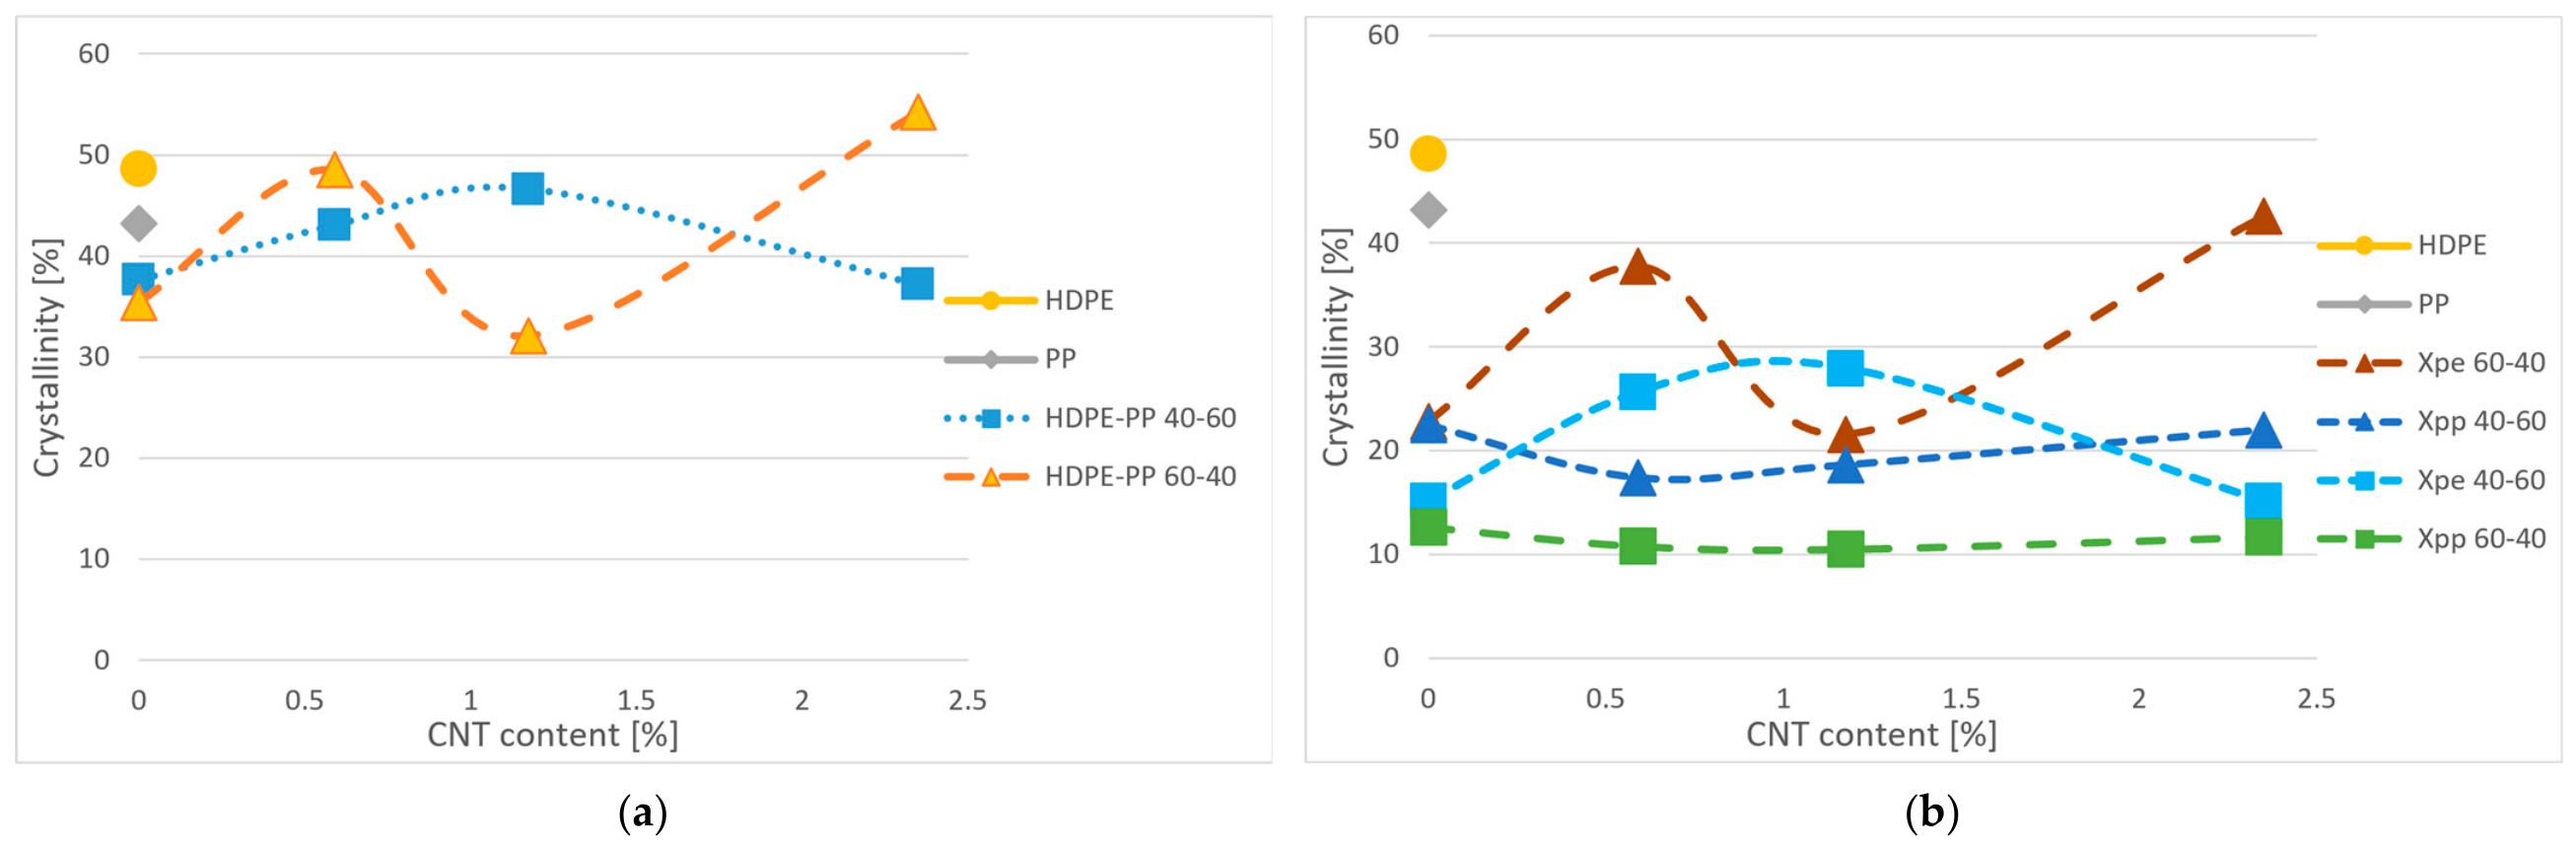
The degree of crystallinity of PE and PP phases could be calculated separately from the second melting curves, and adding them together resulted in the total crystallinity (Figure 2). It is likely that the different phases hinder each other from forming uniform, larger lamellae. The original HDPE has a higher crystallinity than PP, but PP begins to crystallize at a higher temperature. This is the reason why the degree of crystallinity of the mixture with a higher PP content (40–60%) exceeds that of the 60–40% mixture. The addition of CNTs increases the total crystallinity (Figure 2a), except for mixtures labeled 5 and 9; however, the reinforcing material has a negative effect on the crystallization of the PP phase (XPP). Since the PE phase begins to crystallize at a higher temperature due to the nucleation effect of CNTs, the lamellae formed in the PP phase influence it sooner (Figure 2b). In contrast, the crystallization of the PE phase (XPE) increases significantly (except for composites labeled 5 and 9). The addition of 0.59% CNT increases the XPE values of both the 40–60% and 60–40% blends to a comparable extent; however, the increase is more pronounced in the blend with the higher HDPE weight fraction, as HDPE constitutes the continuous phase.
Figure 2.
The degree of crystallinity (a) of PE/PP/MWCNT nanocomposites and (b) of PE and PP phases as a function of CNT content.
The exothermic crystallization peaks measured during cooling fall within the crystallization ranges of HDPE and PP (Figure 1c,d). The unfilled blends exhibit a two-peak crystallization profile; at the 40–60% blend ratio, the peak of PP is larger, while at the 60–40% blend ratio, the peak of PP almost merges with the HDPE peak. The onset of crystallization in the nanocomposites is faster, and the curve begins with a steeper slope. Xu et al. reported a similar phenomenon for an iPP matrix [11]. However, since the peak temperatures are lower than those of PP, this simply means that crystallization begins earlier in some blends (6, 9, 7) than in PP. The crystallization peak of the composites labeled with 9 is very similar to that of the matrix, but the peaks are more fused together. The curves for the 0.59% and 1.18% materials more closely resemble those of the original PP material; as the CNT content increases, the peak width increases, and the peak temperature also increasingly approaches that of PP. The crystallization curve of the composite labeled with 5 is similar in height to that of the PE/PP matrix, but it is a single-peak crystallization. The peaks of the 0.59% and 2.35% composites with CNT content increasingly resemble the PP curve, even with a higher Tpc. The carbon nanotube reduces the peak width (accelerates crystallization), but even so, we obtain broader peaks than in the case of PP. The post-crystallization sub-peak characteristic of HDPE (around 60 °C) is still visible in nanocomposites with 60% HDPE content but shifts toward higher temperatures (~75 °C). It can be stated that the addition of carbon nanotubes successfully increased the compatibility of both the 40–60% and 60–40% unfilled two-phase PE-PP matrices, as a single peak is observed at most CNT concentrations instead of the original two-peak crystallization profile.
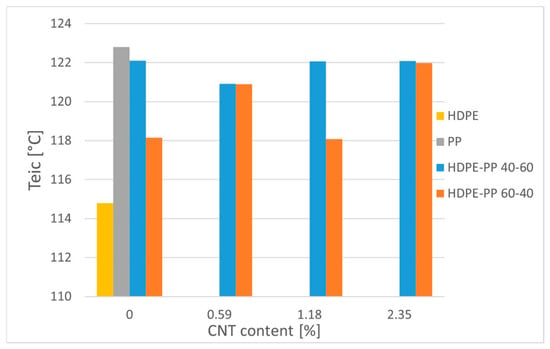
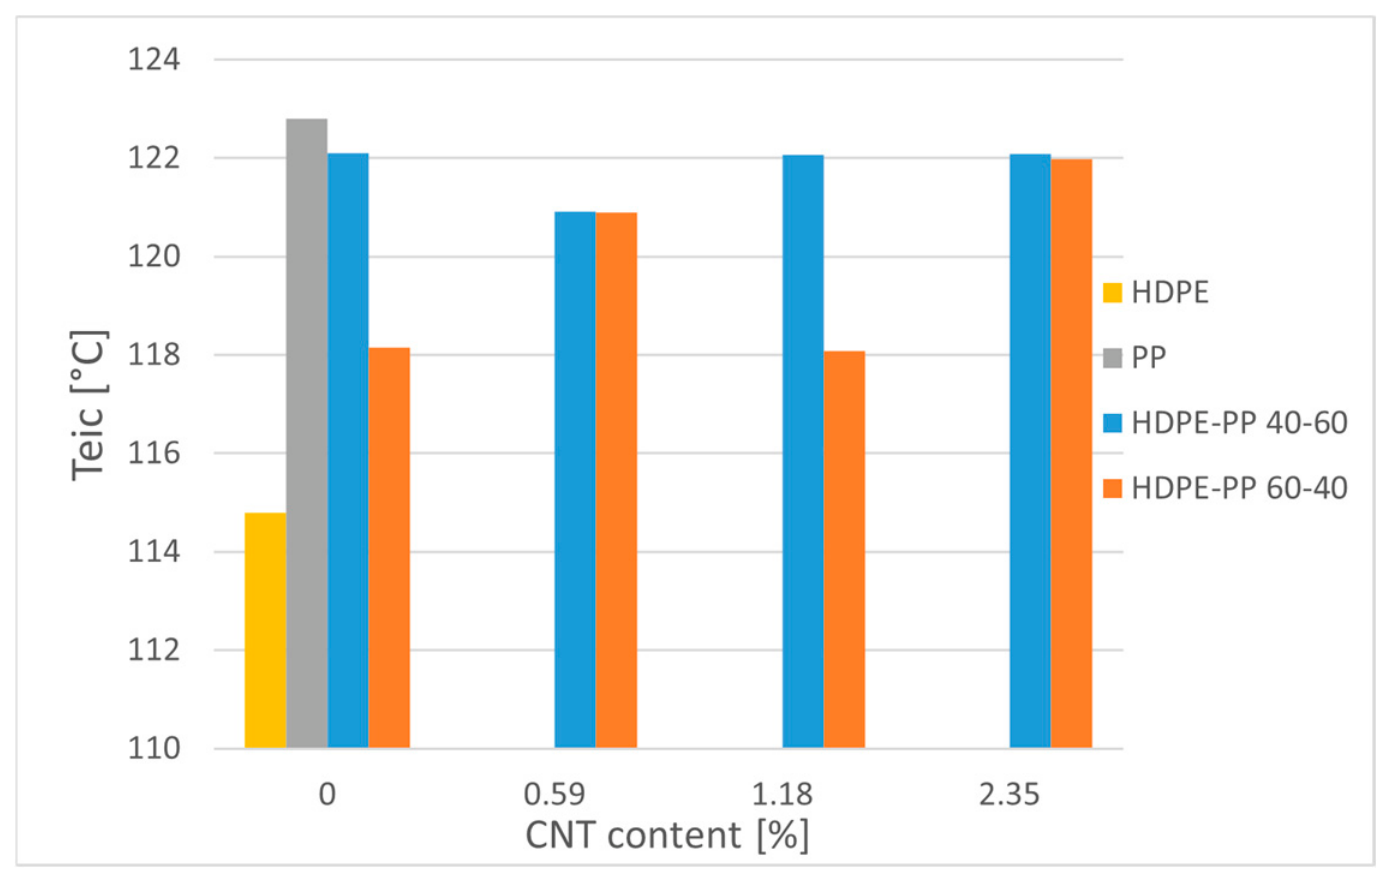
The nucleating effect of carbon nanotubes may be indicated by the increase in the extrapolated onset crystallization temperature (Teic) (Figure 3). While none of the blends surpassed the onset temperature of the PP base material, formulations with a matrix content of 40–60% approached this threshold, a level that was likewise retained in the nanocomposites containing 1.18% and 2.35% nanotubes. It is interesting, however, that this value was also achieved by adding 2.35% CNT to the 60–40% blend, which originally crystallizes at a much lower temperature.
Figure 3.
The extrapolated onset crystallization temperature as a function of CNT content in PE/PP/MWCNT nanocomposites.
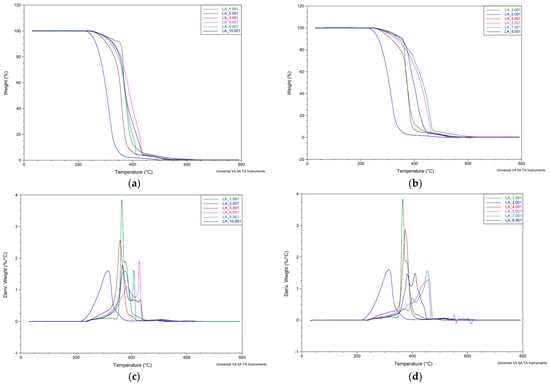
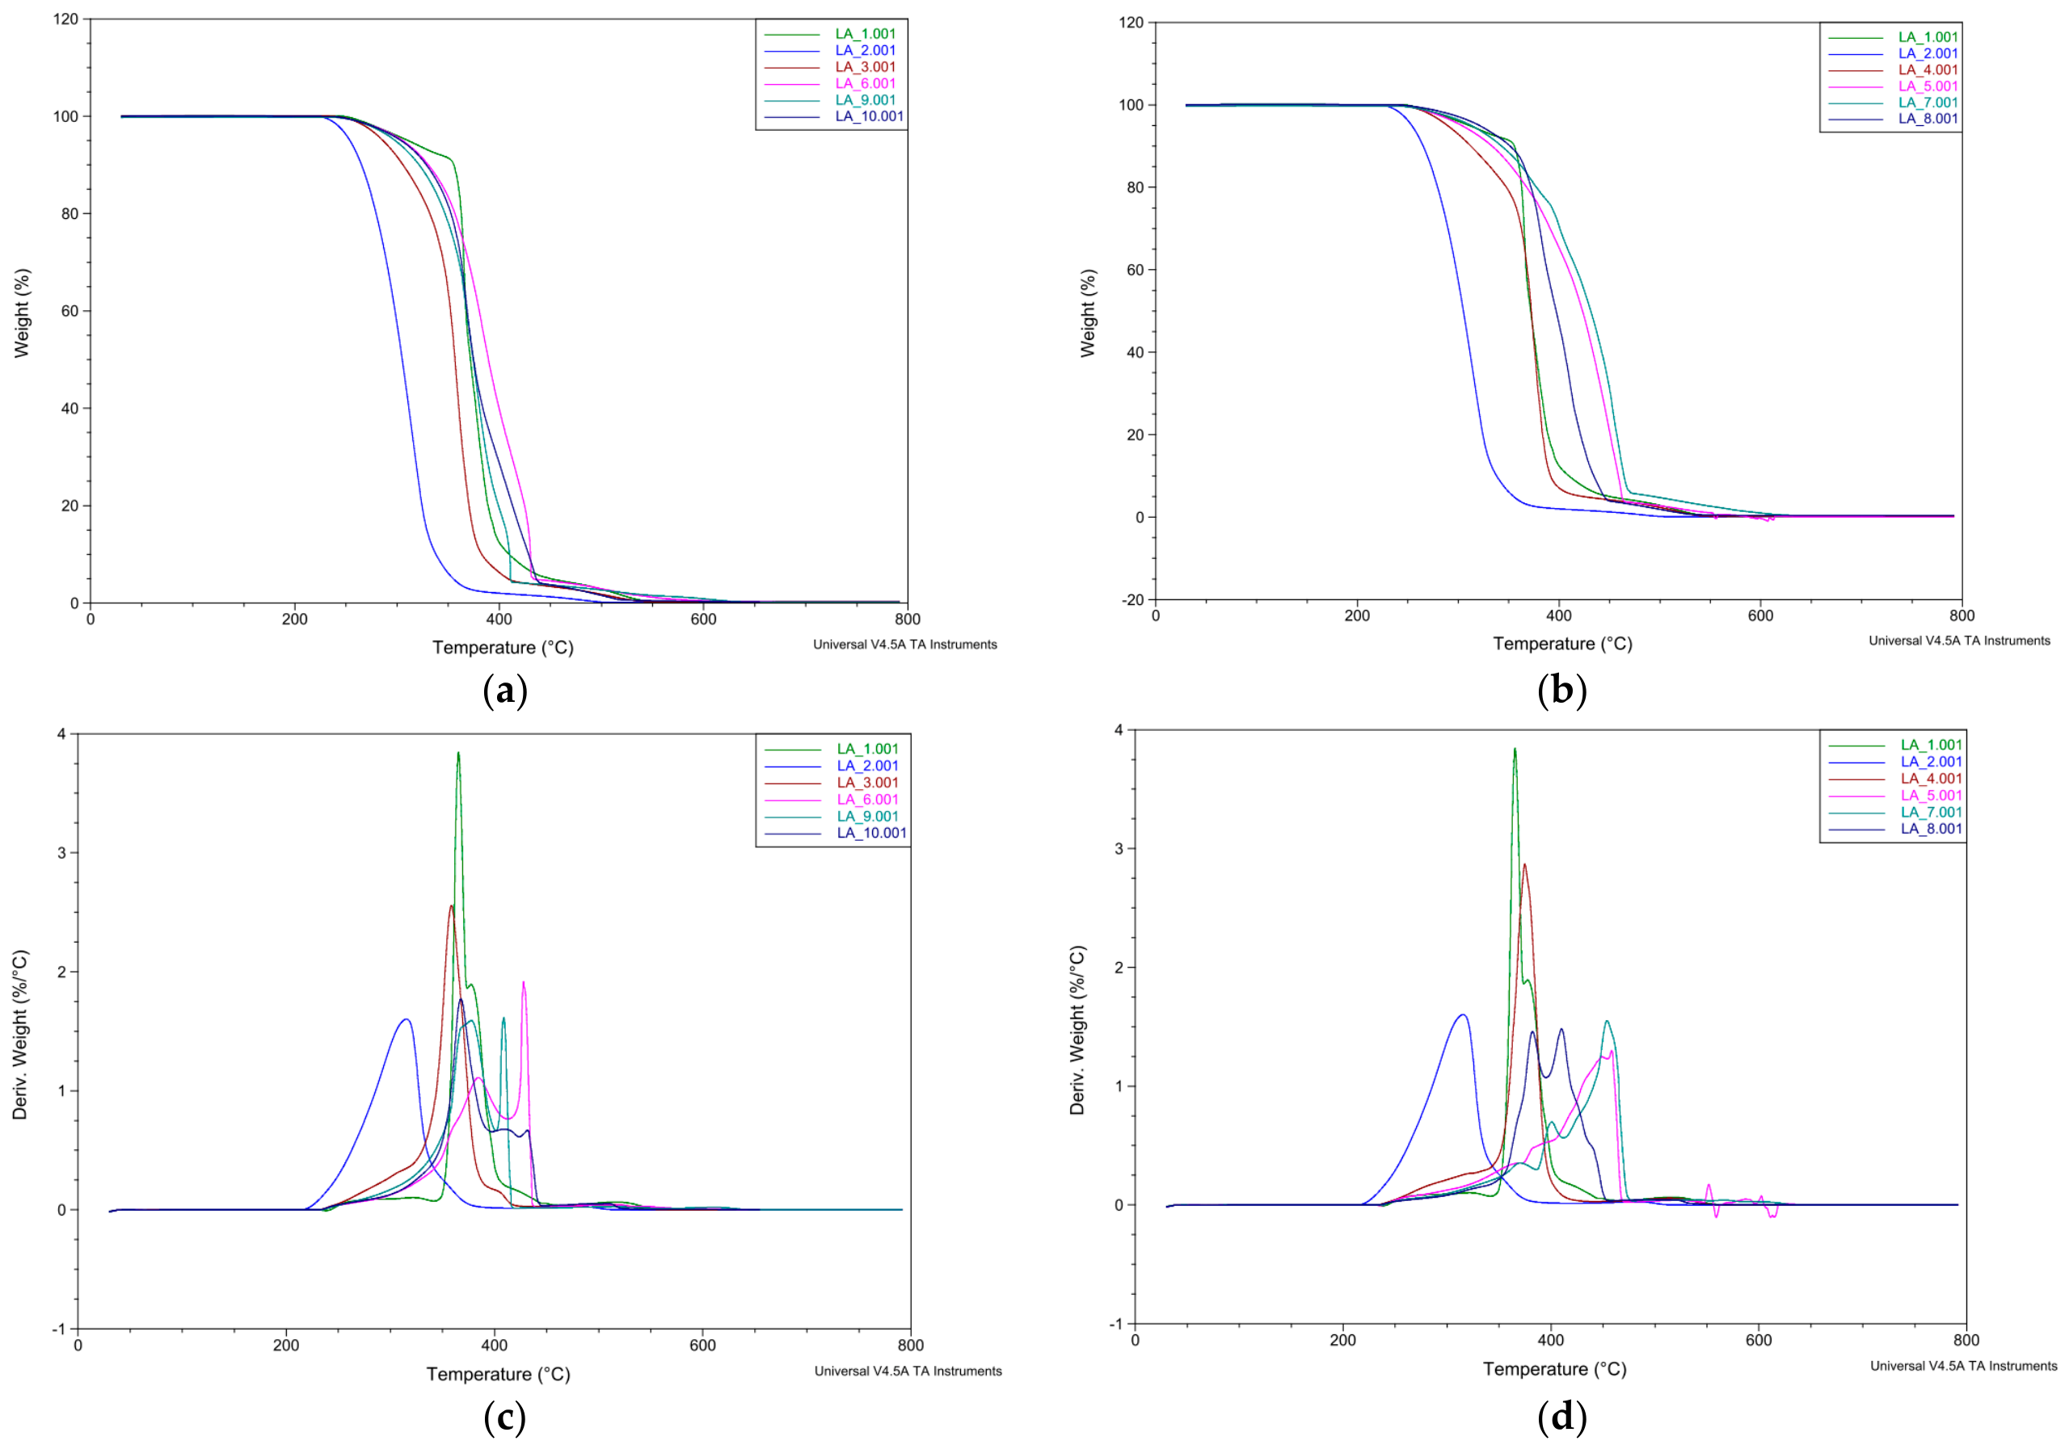
During the thermogravimetric analysis (TGA), PP decomposed at the lowest temperature (Figure 4a,b). The decomposition profile of the HDPE substrate is more segmented compared to the other materials; it is milder up to 10% decomposition, then suddenly begins to decompose at a higher rate. The curves for the PE/PP blends are located near the HDPE degradation step, at lower (40–60%) or nearly identical (60–40%) temperatures depending on the composition. At the end of the degradation curve, the degradation of both the base materials and the blends is slower. For nanocomposites containing 1.18% and 2.35% CNTs, the degradation of the last ~5% of the material is even more prolonged, with the final temperature shifting by ~50 °C (up to ~600 °C).
Figure 4.
The (a,b) weight loss and (c,d) DTG curves for the PE/PP/MWCNT nanocomposites with 40–60 wt% (left) and 60–40 wt% (right) compositions.
The derivative temperature (DTG) curves show that the decomposition rate of the blends falls between those of the two base materials (Figure 4c,d). You can also observe the effect of CNTs; the maximum rate decreases for all nanocomposites to a value similar to that of PP, to a greater extent for the 60–40% composites. The elongated decomposition caused by the nanotubes results in multi-peak DTG curves with fluctuating decomposition rates. Unfilled blends exhibit much more favorable degradation behavior than PP; however, nanocomposites perform even better (Table 2). Due to the unique shape of the HDPE degradation profile, few composites can generate higher temperatures during the initial few percent degradation. The 60–40% blends containing 0.59% and 2.35% CNT, however, succeeded in doing so. The values for the other nanocomposites lie just below those of HDPE.
Table 2.
Decomposition temperatures of PE/PP/MWCNT nanocomposites.
In 40–60% nanocomposites, the first major peak is located near the HDPE decomposition peak, whereas in 60–40% blends a broader peak appears. The best thermal stability is exhibited by 1.18 and 2.35 wt%, as their decomposition rate increases relatively uniformly, and they increase the maximum rate temperature (TC) the most, by around 80 °C (83 and 79 °C) (Table 2). The degradation range can also be significantly increased (nearly threefold with 1.18 wt% nanotubes) by adding CNTs, inhibiting the escape of gaseous degradation products from the polymer, and thereby slowing down degradation.
The temperature corresponding to a 5% mass loss is commonly reported in the literature as a reference measure of thermal stability. In the present study, the greatest improvement was observed for the 60–40 blend containing 0.59 wt% CNT, for which this temperature increased by approximately 31 °C. A comparable enhancement of 32 °C was reported by Marosfoi et al. for a composite containing 3 wt% MWCNTs [17].
4. Conclusions
In our study, 40–60 and 60–40% PE/PP nanocomposites with 0.59, 1.18, and 2.35 wt% MWCNT addition were made and were investigated by thermal analysis.
It was determined that although the blends of PE and PP are immiscible, the crystalline fraction of the PE phase can be increased by adding MWCNT. One-peak crystallization and higher crystallinity of HDPE fraction could be an indicator of compatibility.
HDPE-PP blends were also analyzed using thermogravimetry; it was found, with the addition of 0.59 wt% CNT, that 5% mass loss temperature is higher by 18 °C for the 40% HDPE–60% PP blend and by 31 °C for the 60% HDPE-40% PP blend, and the decomposition range becomes 51 °C and 36 °C wider, respectively, meaning the plastic decomposes more slowly.
Author Contributions
Conceptualization, D.A.N.; methodology, D.A.N.; software, D.A.N. and B.Á.; validation, D.A.N. and B.Á.; formal analysis, D.A.N. and B.Á.; investigation, D.A.N.; resources, D.A.N.; data curation, D.A.N.; writing—original draft preparation, D.A.N.; writing—review and editing, D.A.N. and B.Á.; visualization, D.A.N.; supervision, B.Á., K.U.K. and A.Á.M.; project administration, D.A.N. All authors have read and agreed to the published version of the manuscript.
Funding
This research received no external funding.
Institutional Review Board Statement
Not applicable.
Informed Consent Statement
Not applicable.
Data Availability Statement
The original contributions presented in this study are included in the article. Further inquiries can be directed to the corresponding author.
Conflicts of Interest
The authors declare no conflicts of interest.
References
- Posch, W. Polyolefins. In Applied Plastics Engineering Handbook: Processing, Materials, and Applications, 2nd ed.; Kutz, M., Ed.; William Andrew (Elsevier): Oxford, UK, 2017; pp. 27–53. [Google Scholar] [CrossRef] [Scilit]
- Teh, J.W.; Rudin, A.; Keung, J.C. A Review of Polyethylene-Polypropylene Blends and Their Compatibilization. Adv. Polym. Technol. 1994, 13, 1–23. [Google Scholar] [CrossRef] [Scilit]
- Varga, E.; Tóth, L.; Ádám, B.; Tajti, F.; Hansághy, P. Novel insights into the morphological effects of micron-scale inorganic fillers on polyethylene composites. Compos. Commun. 2025, 56, 102394. [Google Scholar] [CrossRef] [Scilit]
- Baudouin, A.C.; Bailly, C.; Devaux, J. Interface localization of carbon nanotubes in blends of two copolymers. Polym. Degrad. Stab. 2010, 95, 389–398. [Google Scholar] [CrossRef] [Scilit]
- Tabuani, D.; Granelli, W.; Camino, G.; Claes, M. Polypropylene based carbon nanotubes composites: Structure and properties. e-Polymers 2008, 8, 103. [Google Scholar] [CrossRef] [Scilit]
- Kodjie, S.L.; Li, L.; Li, B.; Cai, W.; Li, C.Y.; Keating, M. Morphology and crystallization behavior of HDPE/CNT nanocomposite. J. Macromol. Sci. Phys. 2006, 45, 231–245. [Google Scholar] [CrossRef] [Scilit]
- Manchado, M.A.L.; Valentini, L.; Biagiotti, J.; Kenny, J.M. Thermal and mechanical properties of single-walled carbon nanotubes-polypropylene composites prepared by melt processing. Carbon 2005, 43, 1499–1505. [Google Scholar] [CrossRef] [Scilit]
- Bhuiyan, M.K.H.; Rahman, M.M.; Mina, M.F.; Islam, M.R.; Gafur, M.A.; Begum, A. Crystalline morphology and properties of multi-walled carbon nanotube filled isotactic polypropylene nanocomposites: Influence of filler size and loading. Compos. Part A Appl. Sci. Manuf. 2013, 52, 70–79. [Google Scholar] [CrossRef] [Scilit]
- Bata, A.; Ronkay, F.; Zhang, C.; Gerse, P. Effect of Recycling on the Thermal and Rheological Properties of PP/MWCNT Composites Used as Liner Materials. Polymers 2025, 17, 2178. [Google Scholar] [CrossRef] [Scilit] [PubMed]
- Bhattacharyya, A.R.; Sreekumar, T.; Liu, T.; Kumar, S.; Ericson, L.M.; Hauge, R.H.; E Smalley, R. Crystallization and orientation studies in polypropylene/single wall carbon nanotube composite. Polymer 2003, 44, 2373–2377. [Google Scholar] [CrossRef] [Scilit]
- Xu, D.; Wang, Z. Role of multi-wall carbon nanotube network in composites to crystallization of isotactic polypropylene matrix. Polymer 2008, 49, 330–338. [Google Scholar] [CrossRef] [Scilit]
- Morcom, M.; Simon, G. Polyolefin-carbon nanotube composites. In Polymer-Carbon Nanotube Composites: Preparation, Properties and Applications; Elsevier: Amsterdam, The Netherlands, 2011; pp. 511–544. [Google Scholar] [CrossRef] [Scilit]
- McNally, T.; Pötschke, P.; Halley, P.; Murphy, M.; Martin, D.; Bell, S.E.; Brennan, G.P.; Bein, D.; Lemoine, P.; Quinn, J.P. Polyethylene multiwalled carbon nanotube composites. Polymer 2005, 46, 8222–8232. [Google Scholar] [CrossRef] [Scilit]
- He, F.A.; Zhang, L.M. Preparation of multi-walled carbon nanotubes/high density polyethylene composites with enhanced properties by using a master batch method. Polym. Polym. Compos. 2021, 29, S644–S654. [Google Scholar] [CrossRef] [Scilit]
- Valentini, L.; Biagiotti, J.; Kenny, J.M.; Santucci, S. Morphological characterization of single-walled carbon nanotubes-PP composites. Compos. Sci. Technol. 2003, 63, 1149–1153. [Google Scholar] [CrossRef] [Scilit]
- Attharangsan, S.; Saikrasun, S. Comparative performance of carbon nanotube and organo montmorillonite as a thermo-oxidative-stabilizing modifier for polypropylene- and polyethylene-based thermoplastic composites. J. Thermoplast. Compos. Mater. 2015, 28, 1423–1444. [Google Scholar] [CrossRef] [Scilit]
- Marosfői, B.B.; Szabó, A.; Marosi, G.; Tabuani, D.; Camino, G.; Pagliari, S. Thermal and spectroscopic characterization of polypropylene-carbon nanotube composites. J. Therm. Anal. Calorim. 2006, 86, 669–673. [Google Scholar] [CrossRef] [Scilit]
- Nagy, D.A.; Ádám, B.; Varga, E.; Hansághy, P.; Palásti, F.; Tóth, L. Oscillatory Shear Rheology of PE/PP/MWCNT Nanocomposites. Eng. Proc. 2025, 113, 51. [Google Scholar] [CrossRef] [Scilit]
- MSZ ISO 11357-3:2025; Plastics—Differential Scanning Calorimetry (DSC) Part 3: Determination of Temperature and Enthalpy of Melting and Crystallization. Magyar Szabványügyi Testület: Budapest, Hungary, 2025.
- Ehrenstein, G.; Riedel, G.; Trawiel, P. Thermal Analysis of Plastics: Theory and Practice; Hanser: Munich, Germany, 2004. [Google Scholar]
- MSZ EN ISO 11358-1:2022; Plastics—Thermogravimetry (TG) of Polymers Part 1: General Principles. ISO: Geneva, Switzerland, 2022.
- Borhot Moussa, A.C. Effect of Masterbatch Type and Concentration on Carbon Nanotube Reinforced Polyolefin Blend Nanocomposites. Master’s Thesis, University of Calgary, Calgary, AB, Canada, 2018. [Google Scholar]
- Zhang, C.; Yi, X.S.; Yui, H.; Asai, S.; Sumita, M. Selective location and double percolation of short carbon fiber filled polymer blends: High-density polyethylenerisotactic polypropylene. Mater. Lett. 1998, 36, 186–190. [Google Scholar] [CrossRef] [Scilit]

Disclaimer/Publisher’s Note: The statements, opinions and data contained in all publications are solely those of the individual author(s) and contributor(s) and not of MDPI and/or the editor(s). MDPI and/or the editor(s) disclaim responsibility for any injury to people or property resulting from any ideas, methods, instructions or products referred to in the content. |
© 2026 by the authors. Licensee MDPI, Basel, Switzerland. This article is an open access article distributed under the terms and conditions of the Creative Commons Attribution (CC BY) license.