


Abstract
In fused deposition modelling (FDM), build orientation is known to govern the mechanical properties of printed parts, but its effect on geometric and form accuracy is far less thoroughly characterised. This study investigates how build orientation influences the dimensional and form characteristics of FDM-printed PLA specimens, evaluated together with their tensile behaviour on the same parts. Rectangular tensile specimens were printed from PLA at a fixed infill in four representative build orientations—flat, on-edge, 45°, and upright. Dimensional accuracy was measured by coordinate measuring machine (CMM) inspection and the flatness of the principal faces by optical 3D scanning, and the same specimens were then tensile tested. The results show that geometric accuracy and strength vary together with build orientation: the 45° orientation produced the largest flatness error together with the lowest tensile strength, whereas the on-edge orientation combined the best flatness with the highest strength. Because build orientation was the only variable, this co-variation reflects their shared dependence on orientation rather than a direct causal link between flatness and strength. Comparing the form deviations across orientations therefore shows that the geometrically and mechanically preferable build directions can coincide, providing practical guidance for selecting build orientation when both matter.
1. Introduction
Fused deposition modelling (FDM), also referred to as fused filament fabrication, is one of the most widely used additive manufacturing technologies, owing to its low cost, design flexibility, and ability to produce geometrically complex parts directly from a digital model [1]. In FDM, a thermoplastic filament is melted and deposited layer by layer, and the resulting part properties depend strongly on the chosen process parameters [2]. Among the available materials, polylactic acid (PLA) is one of the most common, valued for its ease of processing, dimensional stability, and favourable strength-to-cost ratio [1].
Because FDM parts are built layer by layer, their performance is inherently dependent on the build orientation—the position of the part relative to the build platform during printing. Build orientation has been shown to be one of the most influential parameters governing the mechanical behaviour of FDM parts [2]. For PLA specimens, tensile strength generally decreases as the orientation shifts from flat towards upright, with reductions of roughly one third reported for upright builds compared with flat ones, because in the upright orientation the load is applied perpendicular to the deposited layers, loading the comparatively weak interlayer bonds [3]. Comparisons across flat, edgewise, and vertical orientations have similarly shown that the edgewise and flat builds tend to provide higher tensile strength and stiffness than the vertical one, with the failure mode shifting accordingly [4,5,6]. The effect of orientation can also interact with other parameters, such as infill and raster settings, which is why isolating orientation as a single variable is important for a clear interpretation [2].
Build orientation affects not only strength but also the geometric and dimensional quality of the finished part. Studies on PLA have found that build orientation is a primary factor influencing dimensional accuracy and flatness error, since the layer-wise deposition and the accumulation of positioning errors differ between orientations [7]. The dimensional accuracy and the mechanical strength have been shown to be influenced together by the printing conditions, indicating that the two cannot be optimised independently [8]. Geometric tolerances such as flatness, perpendicularity, and parallelism—commonly evaluated using coordinate measuring machines (CMMs)—are likewise sensitive to the printing parameters and to the orientation of the part on the build plate [9,10]. Investigations across multiple build orientations have confirmed that different orientations affect the dimensional and form deviations of printed features to different extents, so that an orientation favourable for one feature is not necessarily favourable for another [11].
The underlying reason for this orientation dependence is the anisotropy inherent to layer-by-layer fabrication. The mechanical properties parallel to the deposited filaments differ from those across the layer interfaces, an effect traditionally attributed to weak interlayer bonding [12,13]. More recent work has refined this picture, showing that the interlayer bond strength can approach that of the bulk material and that the observed anisotropy is governed to a large extent by the geometry of the deposited filaments and the associated stress concentrations rather than by weak bonding alone [12]. In either interpretation, the orientation of the layers relative to the applied load remains the decisive factor for the resulting strength.
Although the effect of build orientation on the mechanical properties of FDM parts is extensively documented, its influence on geometric and form characteristics—and in particular on flatness—has received considerably less attention, and the geometric and mechanical responses are seldom evaluated on the very same specimens. As a result, it remains unclear whether the build orientation that is most favourable for dimensional and form accuracy is also the one that maximises strength, or whether a trade-off must be accepted. The present work addresses this gap. Rectangular tensile specimens were produced from PLA at a fixed infill in four representative build orientations—flat (principal face on the platform), on-edge (long side on the platform), 45° (inclined), and upright (end face on the platform). For each orientation, the dimensional accuracy was evaluated by coordinate measuring machine (CMM) inspection against a common datum reference frame and the flatness of the principal faces by optical 3D scanning, after which the same specimens were subjected to tensile testing. Combining both measurements on a single set of specimens makes it possible to relate the orientation-dependent form deviations directly to the orientation-dependent mechanical response and thereby to identify which build orientation offers the best compromise between geometric accuracy and strength.
2. Materials and Methods
2.1. Specimen Geometry and Build Orientations
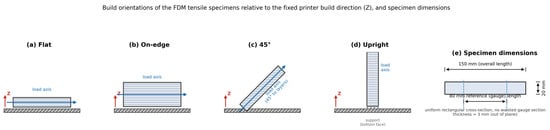
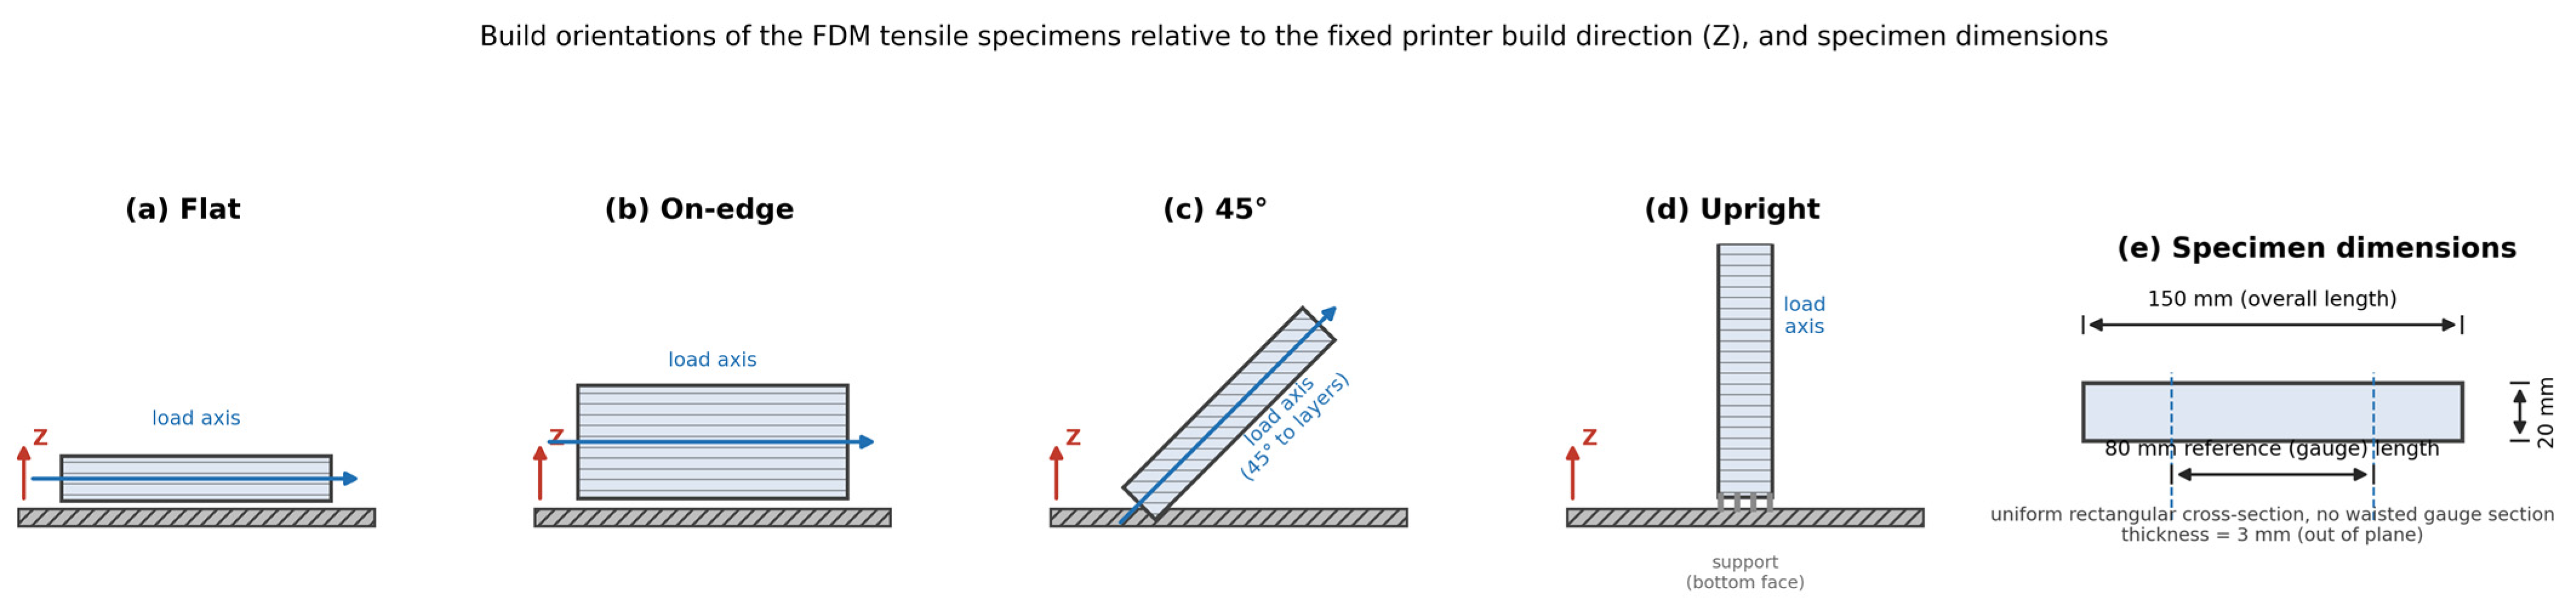
Rectangular tensile specimens with a uniform cross-section of 20 mm × 3 mm and an overall length of 150 mm were used throughout. A standard small-scale ISO 527 [14] plastics specimen (e.g., type 1BA or 5A) was deliberately not adopted: the same specimen family is intended to serve our planned digital image correlation (DIC) measurements, for which a larger, uniform gauge area makes the measurement markedly easier to plan and evaluate. To avoid an arbitrary custom geometry, the specimen was instead based on the sheet-metal tensile-testing standard ISO 6892-1 [15], from which the 80 mm reference (gauge) length along the loading direction was taken; this reference length was used for the strain calculation. The specimens are therefore larger, non-waisted rectangular strips rather than a standard plastics specimen type. Build orientation was the only variable in the study; all other design and process parameters were held constant. Four representative orientations were investigated, each printed in three replicates, giving a total of twelve specimens. Each orientation was produced in its own separate build, so the twelve specimens originate from four independent builds of three specimens each. The orientations were as follows (Figure 1): flat, with the principal (largest) face lying on the build platform; on-edge, with one long side on the platform; 45°, with the specimen inclined to the platform; and upright, with one end face on the platform. Support structures were generated only for the upright orientation, where they contacted the bottom face. The specimen identifiers A, B, C, and D denote the flat, on-edge, 45°, and upright orientations, respectively.
Figure 1.
Build orientations of the FDM tensile specimens relative to the fixed printer build direction (Z): (a) flat, (b) on-edge, (c) 45°, (d) upright. The build direction (Z) and the horizontal, globally deposited layers are the same in every panel; only the specimen’s orientation, and hence the load axis, changes. Support material contacted the bottom (end) face only for the upright orientation. (e) Dimensioned plan view of the specimen: a uniform 20 mm × 3 mm rectangular cross-section, 150 mm overall length, with an 80 mm reference (gauge) length centred along the loading axis (no waisted/necked gauge section).
2.2. Specimen Manufacturing
All specimens were fabricated from polylactic acid (PLA) filament (Snapmaker Basic PLA, 1.75 mm nominal diameter, yellow; Snapmaker, Shenzhen, China) on a Snapmaker U1 desktop FDM system—a CoreXY machine equipped with a 0.4 mm stainless-steel nozzle and a PEI-coated flexible steel build plate; the build files were prepared in Snapmaker Orca (based on OrcaSlicer). The principal process parameters were held constant for every orientation: a layer height of 0.2 mm, three perimeters, a nozzle temperature of 200 °C, a build-plate temperature of 55 °C, and an average printing speed of 300 mm/s. The infill was set to 20% with a gyroid pattern. The 20% gyroid infill has no linear raster angle; the three perimeters follow the part contour in every layer, and the raster angle of the solid top and bottom layers was left at the slicer default and was not logged. The filament was dried at 50 °C before printing, and all four builds were carried out in the laboratory at approximately 24 °C and 50% relative humidity, with part cooling at 100% fan throughout. Feature-specific speeds (outer perimeter, infill) were not logged separately from the 300 mm/s average. The support structures of the upright specimens were removed by hand, without further post-processing of the contact face; the datum and evaluation regions of the geometric inspection were kept away from the resulting support-contact marks. Because the infill is well below 100%, the load-bearing solid fraction of the nominal cross-section is correspondingly reduced; the tensile results reported below are therefore gross-section, specimen-level values rather than properties of fully dense PLA.
2.3. Geometric Inspection
The geometric quality of every specimen was characterised non-destructively prior to tensile testing using two complementary metrology techniques. The dimensional accuracy was assessed on a Mitutoyo (Kawasaki, Japan) coordinate measuring machine (CMM) fitted with a touch-trigger probe. The CMM was calibrated by the manufacturer in January 2026, with a certified accuracy of 3 μm. A common datum reference frame was established for all specimens using the 3-2-1 principle: datum A on the principal large flat face, datum B on one long side, and datum C on one end face. From this frame, the width, thickness, and length were measured and compared with their nominal values; the recorded width values for all specimens are listed in the specimen measurement log. The flatness of the principal face was evaluated separately by full-field optical digitisation on a GOM ATOS TripleScan (GOM, Braunschweig, Germany) structured-light (blue-light, fringe-projection) 3D scanner. The scanner was calibrated immediately before the measurement series; its most recent annual certification (January 2026) documented an accuracy of 7 μm. The resulting high-density point cloud was imported into GOM ATOS Professional software (version 2018), where the flatness of the principal face was evaluated as the peak-to-valley deviation of the measured surface from a Gaussian (least-squares) best-fit reference plane fitted to that face; a minimum-zone evaluation was not used, so the reported values are best-fit peak-to-valley form errors. The evaluation was numerical: no colour deviation maps were exported for this series. For the upright specimens, the datum and evaluation regions were kept away from the support-contact marks to avoid biasing the form assessment. Three specimens were measured per orientation, and the mean and standard deviation are reported.
2.4. Tensile Testing
After inspection, the same specimens were tested to assess failure in uniaxial tension on a Zwick 1454 universal testing machine (ZwickRoell, Ulm, Germany) with a 20 kN measuring range. The specimens were clamped in mechanical wedge grips over their full end sections, leaving the 80 mm reference length free between the grips. The force was recorded by an HBM Z4 load cell (HBM, Darmstadt, Germany; 20 kN capacity), while the crosshead displacement was measured with an ASM WS10SG-1250-10V-L10-M4-D8 draw-wire displacement sensor (ASM, Moosinning, Germany); both signals were acquired with an HBM QuantumX MX840A data acquisition system and HBM Catman AP 5.5.3 software at a sampling rate of 75 Hz. The testing machine and the load cell were operated within their manufacturer-specified calibrated measuring ranges; a dedicated recalibration certificate was not obtained for this test series, which is one reason the derived stiffness and energy quantities are reported as apparent, specimen-level values. Tests were performed under crosshead control at a constant rate of 5 mm/min. The engineering stress was computed from the force divided by the cross-sectional area measured on each individual specimen by CMM (Section 2.3; 59.5–60.7 mm2, against a nominal 60 mm2), and the apparent strain from the crosshead displacement referred to the 80 mm reference length. Because no extensometer was used, the displacement signal includes the compliance of the load train; the resulting stiffness is therefore reported only as an apparent modulus and not as a material elastic modulus. The ultimate tensile strength (UTS) was taken as the maximum engineering stress. The apparent E-modulus was obtained by linear least-squares regression of the stress–apparent strain response on the rising branch, between 10% and 40% of the ultimate stress of the specimen concerned; the coefficient of determination of every individual fit is reported in Section 3.3, so that the quality of each regression can be judged directly. The elongation at break was taken as the apparent strain at the last recorded point of the test, at which the load had fallen below 5% of the peak in every specimen, and the apparent toughness as the area under the stress–apparent strain curve up to that point.
3. Results and Discussion
3.1. Dimensional Accuracy
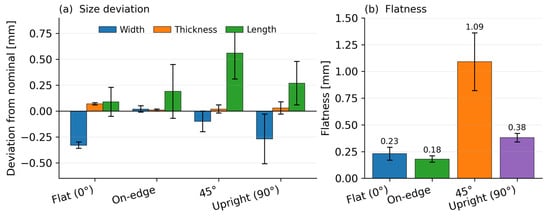
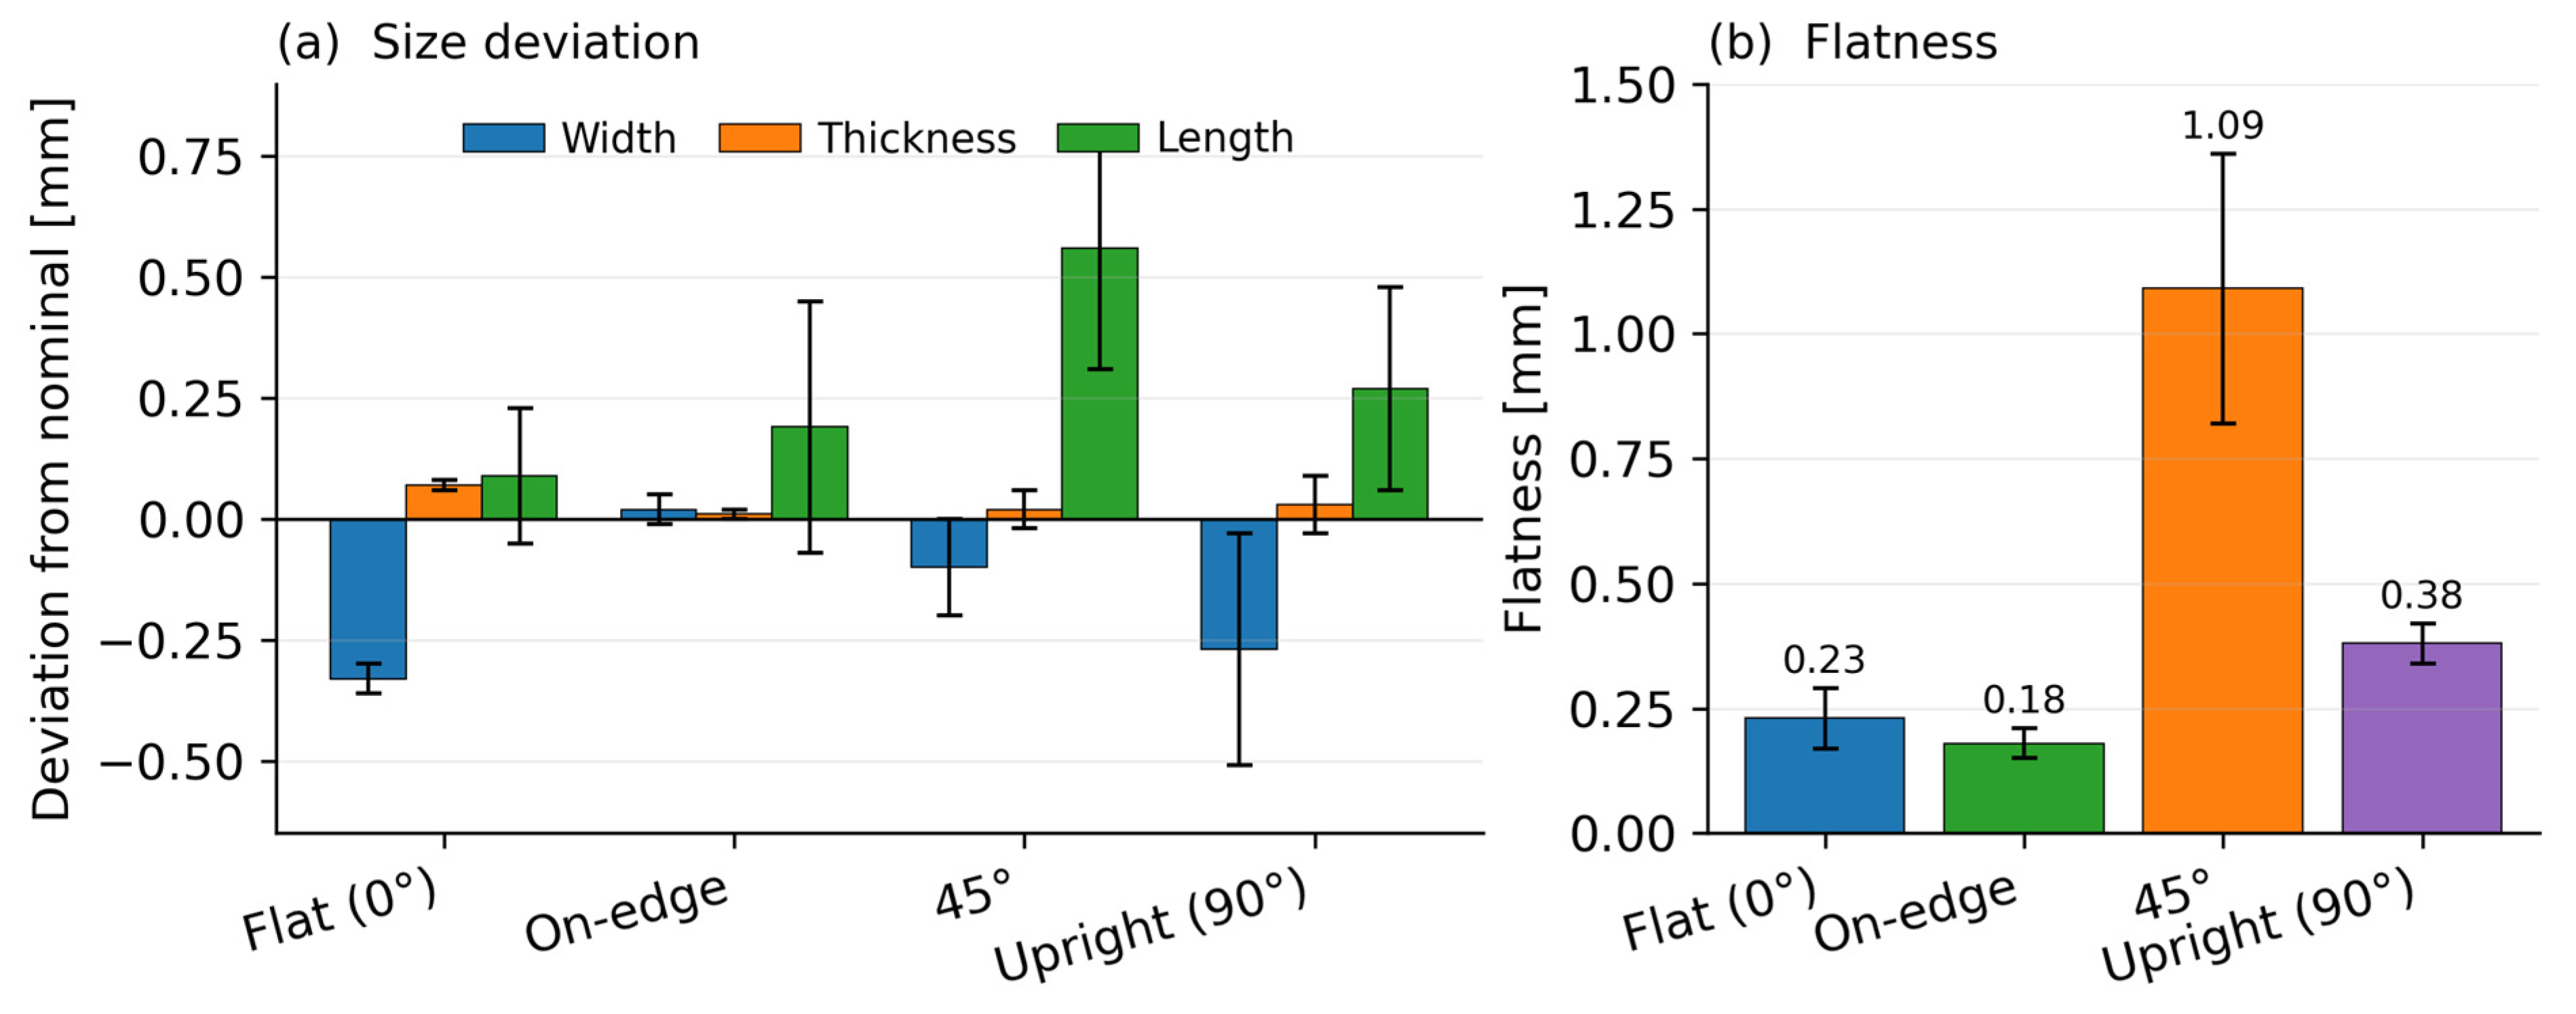
Table 1 summarises the size deviations from nominal and the flatness of the principal face for the four orientations. The linear dimensions were reproduced with good fidelity in every orientation (Figure 2a), with all mean deviations remaining within approximately ±0.6 mm. The width tended to be slightly undersized, most noticeably for the flat (−0.33 mm) and upright (−0.27 mm) builds, while the thickness stayed close to nominal throughout (within +0.07 mm). The length was generally on the oversize side, with the largest excess for the 45° orientation (+0.56 mm), which also showed the greatest scatter. Overall, the build orientation had only a second-order effect on the linear dimensions, consistent with reports that dimensional accuracy in FFF is governed by the combined contributions of motion precision and orientation rather than by orientation alone [7].
Table 1.
Mean size deviation from nominal and flatness of the principal face for the four build orientations (mean ± standard deviation, n = 3).
Figure 2.
Geometric accuracy for the four build orientations: (a) mean size deviation from nominal (width, thickness, and length) and (b) flatness of the principal face. Mean ± standard deviation, n = 3.
3.2. Flatness
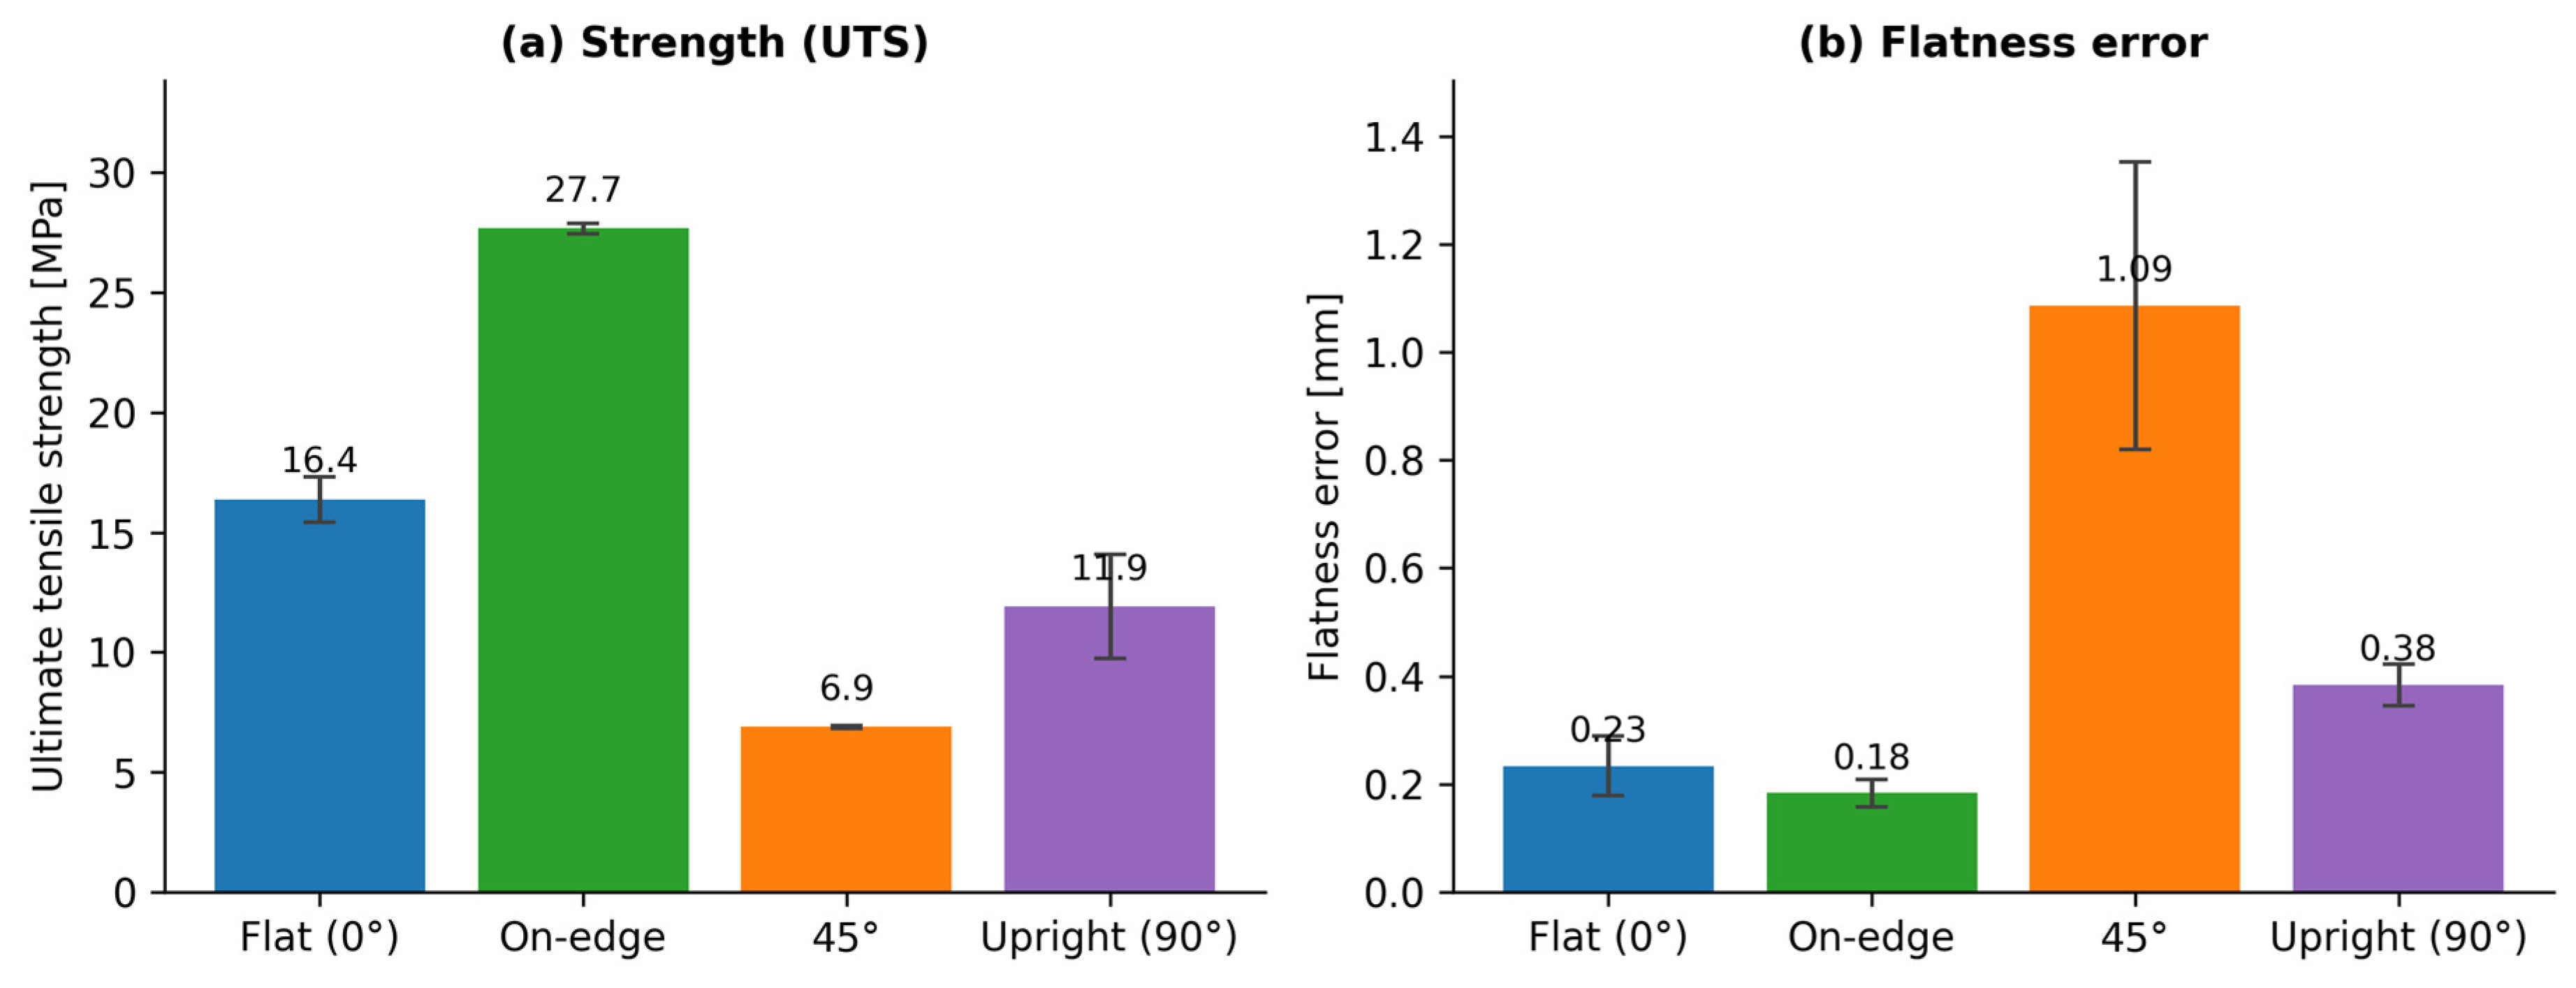
In contrast to the linear dimensions, the flatness of the principal face was strongly orientation-dependent, as shown in Figure 2b. The flat and on-edge orientations produced the smallest form errors (0.23 and 0.18 mm, respectively), whereas the 45° orientation produced a flatness error of 1.09 mm—roughly five to six times larger—and also the largest variability between replicates. The upright orientation fell in between, at 0.38 mm. The full-field optical scans confirmed that this behaviour is the geometric signature of the staircase approximation: when the principal face is built at an intermediate angle, it is reproduced as a series of stepped layer edges rather than a single continuous surface, so the measured flatness degrades markedly relative to a face that is either parallel or perpendicular to the deposited layers. The result confirms that, among the geometric characteristics studied, flatness is the one most sensitive to build orientation, which is consistent with the orientation sensitivity of GD&T form tolerances reported for FFF and other layer-wise processes [9,10].
3.3. Tensile Behaviour
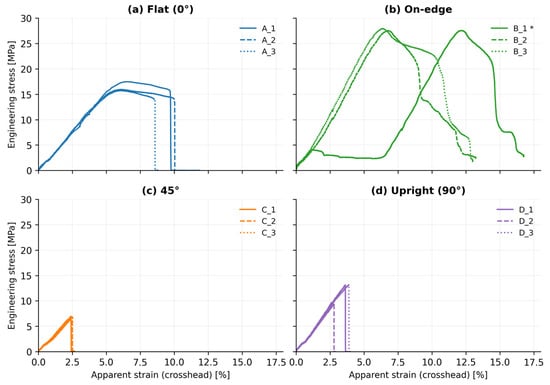
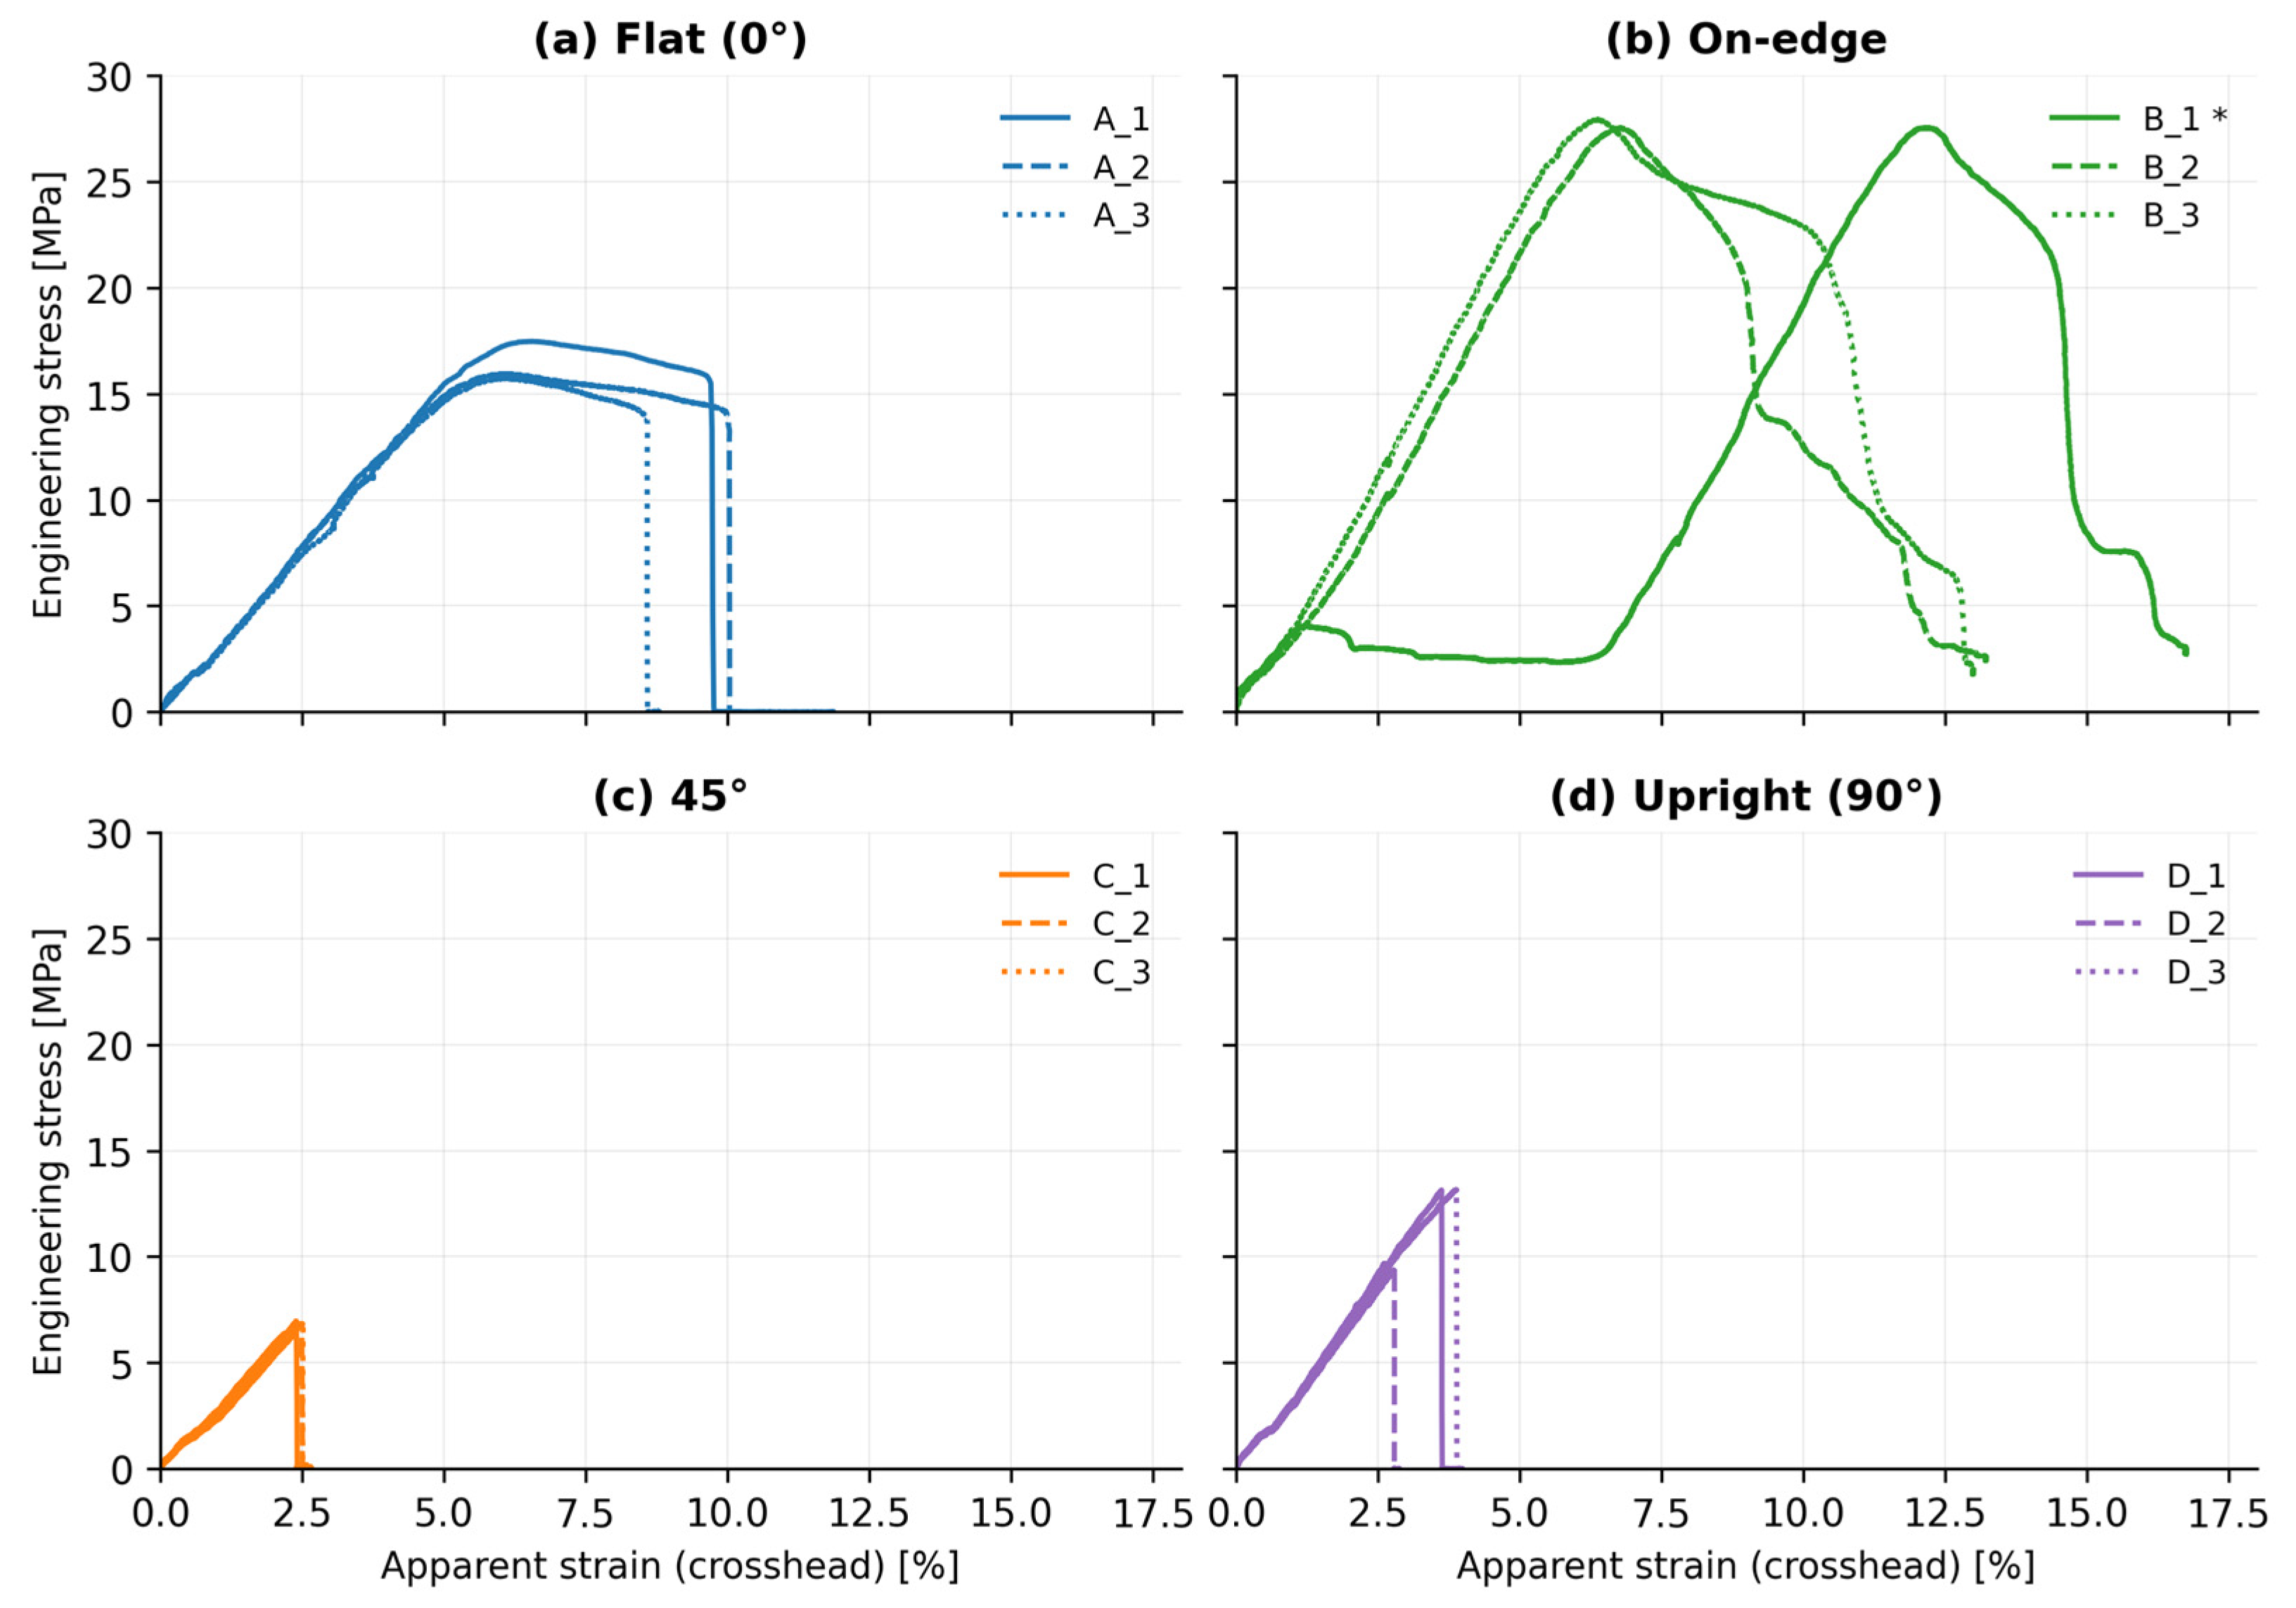
The orientation also governed the tensile response, summarised in Table 2, with the stress–strain curves of all replicates shown in Figure 3. The on-edge orientation was the strongest, reaching a gross-section UTS of 27.7 MPa, followed by the flat orientation at 16.4 MPa, the upright orientation at 11.9 MPa, and the 45° orientation at only 6.9 MPa. The on-edge and flat builds also sustained the largest elongations at break, whereas the 45° and upright specimens failed at comparatively small strains. The ranking reflects the orientation of the deposited filaments relative to the load: in the on-edge and flat builds, a large proportion of the filaments run along the loading direction and carry the load directly, while in the upright build, the load is transmitted across the layer interfaces, and in the 45° build, the inclined, stepped structure combines off-axis filaments with the stress concentrations associated with the staircase geometry. This load-path dependence is the well-documented anisotropy of extrusion additive manufacturing [3,4,12]. The shape of the curves further reveals two distinct failure modes (Figure 3): the on-edge and flat builds reached their peak stress well before fracture and then softened gradually, indicating a comparatively ductile, progressive failure, whereas the 45° and upright specimens fractured almost immediately after the peak in a brittle manner. In every orientation, fracture occurred within the free reference length and was distributed along it rather than being concentrated at the grip edges, indicating that the recorded strengths were not governed by grip-induced damage. This is captured by the apparent toughness in Table 2, the energy absorbed to break: the on-edge and flat orientations absorbed roughly an order of magnitude more energy (2.02 and 1.08 MJ/m3, respectively) than the upright and 45° builds (0.21 and 0.08 MJ/m3), so the on-edge orientation was the toughest as well as the strongest.
Table 2.
Gross-section ultimate tensile strength (UTS), apparent E-modulus, elongation at break, and apparent toughness (energy absorbed to break) for the four build orientations (mean ± standard deviation, n = 3 unless noted otherwise).
Figure 3.
Engineering stress–apparent strain curves for all three replicates of every build orientation: (a) flat, (b) on-edge, (c) 45°, (d) upright. All four panels share the same axes. The apparent strain is derived from crosshead displacement and includes load-train compliance. * Specimen B_1 shows a pronounced grip-slip plateau between roughly 1% and 8% strain; its peak stress is unaffected, but its strain-derived quantities are not reliable, and it is excluded from the apparent modulus statistics.
The absolute strength values are lower than those typically quoted for solid or injection-moulded PLA, which is expected and consistent with the experimental design: the specimens were printed at 20% gyroid infill, so only a fraction of the nominal 60 mm2 cross-section is solid material. For reference, the manufacturer’s datasheet for this filament quotes a bulk tensile strength of 66 MPa [16]; even the strongest orientation (on-edge, 27.7 MPa) therefore reaches only about 42% of the solid-material value, as anticipated for a partially infilled, layer-built part. The values reported here are thus gross-section, specimen-level strengths suitable for comparing orientations under identical infill, rather than intrinsic material properties. For the same reason, and because strain was derived from crosshead displacement rather than from an extensometer, the stiffness is reported only as an apparent modulus rather than a material modulus.
All twelve stress–apparent strain curves are shown in Figure 3, and the individual results of every replicate are listed in Table 3. With n = 3 per orientation, formal 95% confidence intervals would be wide (t-multiplier ≈ 4.3); mean ± standard deviation is therefore reported throughout, consistent with common practice for small-n mechanical testing, and Table 3 lets the reader inspect the underlying scatter directly.
Table 3.
Individual tensile results for all three replicates of each build orientation.
3.4. Coupling Between Geometric Accuracy and Strength
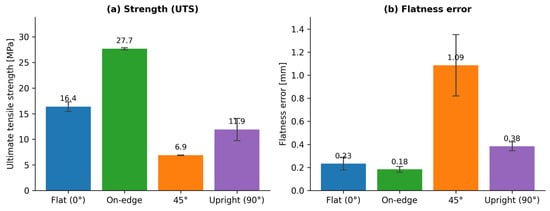
Examining the geometric and mechanical results together reveals a consistent coupling rather than a trade-off. Figure 4 compares the two effects on a common orientation axis: build orientation governs both the mechanical response (a) and the geometric accuracy (b), and the two follow the same ranking, with on-edge the strongest and most accurate and 45° the weakest and least accurate. Because orientation is the only variable studied here, these data do not by themselves establish a direct, orientation-independent link between flatness and strength; with only four discrete orientations, any apparent accuracy–strength correlation chiefly reflects the orientation effect itself. Whether a genuine coupling also exists at a fixed orientation—for example, whether more accurately formed specimens are intrinsically stronger—cannot be resolved from the present design and is left for future work with more replicates and finer orientation and parameter sampling. The on-edge orientation combined the smallest flatness error with the highest tensile strength and toughness, making it the preferred build direction on all counts. The 45° orientation showed the opposite: it produced the largest flatness error and the lowest strength and is therefore the least favourable orientation in both respects. The flat and upright orientations occupied intermediate positions. For the specimens and conditions studied, the build orientation that is best for form accuracy is thus also the best for strength, so a single orientation choice can satisfy both requirements simultaneously—a practically useful outcome, since it removes the need to compromise dimensional quality for mechanical performance. The agreement also has a common physical origin: both the flatness degradation and the strength loss at 45° stem from the stepped, inclined deposition of the layers, linking the geometric and mechanical penalties of intermediate build angles to the same staircase mechanism [8].
Figure 4.
Build orientation governs both the mechanical response (a) and the geometric accuracy (b): ultimate tensile strength and flatness of the principal face (mean ± standard deviation, n = 3). The two properties follow the same orientation ranking.
4. Conclusions
The effect of build orientation on the geometric accuracy and tensile strength of FDM-printed PLA specimens was investigated by measuring both characteristics on the same set of specimens across four representative orientations—flat, on-edge, 45°, and upright. The linear dimensions were reproduced accurately in all orientations, with mean deviations within approximately ±0.6 mm, indicating that build orientation had only a minor influence on size. The flatness of the principal face, by contrast, was strongly orientation-dependent: the 45° orientation produced a flatness error roughly five to six times larger than the flat and on-edge builds, a direct consequence of the staircase approximation of the inclined face. The gross-section tensile strength followed the order on-edge > flat > upright > 45°, reflecting the orientation of the deposited filaments relative to the applied load. Most importantly, the geometric and mechanical responses were coupled in the same direction: the on-edge orientation was simultaneously the most accurate and the strongest, while the 45° orientation was the least favourable on both counts, so that no trade-off between form accuracy and strength was required. These findings and the reported numerical values are specific to the printer, PLA filament grade, layer height, and 20% gyroid infill used here and should not be extrapolated to other materials, infill levels, or FDM systems without verification. Because strain was derived from crosshead displacement rather than from an extensometer, the reported stiffness, elongation, and toughness values include the compliance of the load train and are therefore apparent, specimen-level quantities rather than material properties; this is the principal measurement limitation of the present study. Because the present results were obtained at a single infill on four discrete orientations, future work will extend the study to intermediate build angles, add extensometer-based stiffness measurement, and include parallelism and perpendicularity to build a more complete picture of the orientation dependence of form accuracy and to test whether dimensional accuracy and mechanical properties are linked independently of build orientation.
Author Contributions
Conceptualisation, S.S., A.N. and J.B.; methodology, S.S., A.N. and J.B.; software, S.S., A.N. and J.B.; validation, S.S., A.N. and J.B.; formal analysis, S.S., A.N. and J.B.; investigation, S.S., A.N. and J.B.; resources, S.S., A.N. and J.B.; data curation, S.S., A.N. and J.B.; writing—original draft preparation, S.S., A.N. and J.B.; writing—review and editing, S.S., A.N. and J.B.; visualisation, S.S., A.N. and J.B.; supervision, S.S., A.N. and J.B.; project administration, S.S., A.N. and J.B.; funding acquisition, S.S., A.N. and J.B. All authors have read and agreed to the published version of the manuscript.
Funding
This research received no external funding.
Institutional Review Board Statement
Not applicable.
Informed Consent Statement
Not applicable.
Data Availability Statement
The data presented in this study are available upon request from the corresponding author.
Conflicts of Interest
The authors declare no conflicts of interest.
References
- Sandanamsamy, L.; Harun, W.S.W.; Ishak, I.; Romlay, F.R.M.; Kadirgama, K.; Ramasamy, D.; Idris, S.R.A.; Tsumori, F. A comprehensive review on fused deposition modelling of polylactic acid. Prog. Addit. Manuf. 2023, 8, 775–799. [Google Scholar] [CrossRef] [Scilit] [PubMed]
- Dey, A.; Yodo, N. A systematic survey of FDM process parameter optimization and their influence on part characteristics. J. Manuf. Mater. Process. 2019, 3, 64. [Google Scholar] [CrossRef] [Scilit]
- Pernet, B.; Nagel, J.K.; Zhang, H. Effect of build orientation on the mechanical behaviour and build time of FDM 3D-printed PLA parts: An experimental investigation. Eur. Mech. Sci. 2021, 5, 116–120. [Google Scholar] [CrossRef] [Scilit]
- Ekşi, S.; Karakaya, C. Effects of process parameters on tensile properties of 3D-printed PLA parts fabricated with the FDM method. Polymers 2025, 17, 1934. [Google Scholar] [CrossRef] [Scilit] [PubMed]
- Kamaal, M.; Anas, M.; Rastogi, H.; Bhardwaj, N.; Rahaman, A. Effect of FDM process parameters on mechanical properties of 3D-printed PLA parts. Prog. Addit. Manuf. 2021, 6, 63–69. [Google Scholar] [CrossRef] [Scilit]
- Beattie, N.; Bock, N.; Anderson, T.; Edgeworth, T.; Kloss, T.; Swanson, J. Effects of build orientation on mechanical properties of fused deposition modeling parts. J. Mater. Eng. Perform. 2021, 30, 5059–5065. [Google Scholar] [CrossRef] [Scilit]
- García Plaza, E.; Núñez López, P.J.; Caminero Torija, M.Á.; Chacón Muñoz, J.M. Analysis of PLA geometric properties processed by FFF additive manufacturing: Effects of process parameters and plate-extruder precision motion. Polymers 2019, 11, 1581. [Google Scholar] [CrossRef] [Scilit] [PubMed]
- Frunzaverde, D.; Cojocaru, V.; Ciubotariu, C.R.; Miclosina, C.-O.; Ardeljan, D.D.; Ignat, E.F.; Marginean, G. The influence of the printing temperature and the filament color on the dimensional accuracy, tensile strength, and friction performance of FFF-printed PLA specimens. Polymers 2022, 14, 1978. [Google Scholar] [CrossRef] [Scilit] [PubMed]
- Jayakumar, N.; Senthilkumar, G.; Kumar, M. Investigation on geometric, dimensional accuracy and surface roughness for 3D printed PLA via fused deposition modelling (FDM) process. Proc. Inst. Mech. Eng. Part E 2026, 240, 1019–1030. [Google Scholar] [CrossRef] [Scilit]
- Kačmarčik, J.; Spahić, D.; Varga, J.; Pavlović, A. An investigation of geometrical accuracy of desktop 3D printers using CMM. IOP Conf. Ser. Mater. Sci. Eng. 2018, 393, 012085. [Google Scholar] [CrossRef] [Scilit]
- Kalilayeva, A.; Zhumashev, D.; Wei, D.; Perveen, A.; Talamona, D. Investigation of stereolithography additively manufactured components for deviations in dimensional and geometrical features. Polymers 2024, 16, 3311. [Google Scholar] [CrossRef] [Scilit] [PubMed]
- Allum, J.; Moetazedian, A.; Gleadall, A.; Silberschmidt, V.V. Interlayer bonding has bulk-material strength in extrusion additive manufacturing: New understanding of anisotropy. Addit. Manuf. 2020, 34, 101297. [Google Scholar] [CrossRef] [Scilit]
- Perez, D.B.; Celik, E.; Karkkainen, R.L. Investigation of interlayer interface strength and print morphology effects in fused deposition modeling 3D-printed PLA. 3D Print. Addit. Manuf. 2021, 8, 23–32. [Google Scholar] [CrossRef] [Scilit] [PubMed]
- ISO 527-2:2012; Plastics—Determination of Tensile Properties—Part 2: Test Conditions for Moulding and Extrusion Plastics. International Organization for Standardization: Geneva, Switzerland, 2012.
- ISO 6892-1:2019; Metallic Materials—Tensile Testing—Part 1: Method of Test at Room Temperature. International Organization for Standardization: Geneva, Switzerland, 2019.
- Snapmaker. Basic PLA Filament (1 kg)—Technical Specifications. Available online: https://shop.snapmaker.com/products/pla-filament-1kg (accessed on 11 June 2026).

Disclaimer/Publisher’s Note: The statements, opinions and data contained in all publications are solely those of the individual author(s) and contributor(s) and not of MDPI and/or the editor(s). MDPI and/or the editor(s) disclaim responsibility for any injury to people or property resulting from any ideas, methods, instructions or products referred to in the content. |
© 2026 by the authors. Licensee MDPI, Basel, Switzerland. This article is an open access article distributed under the terms and conditions of the Creative Commons Attribution (CC BY) license.