


Abstract
Bloch-like surface waves (BLSWs) excited in side-polished photonic crystal fibers (PCFs) combine high refractive-index sensitivity with narrow resonances. This work investigates two- and three-nanostrip TiO2 coatings on a D-shaped PCF to characterize the trade-off between refractometric sensitivity and spectral performance. Finite-element and eigenmode-expansion simulations show that the inter-strip gap (GAP) modifies BLSW coupling, resonance linewidth, and resonance depth. At the smallest simulated gap (0.05 μm), three 10-μm-wide strips achieve 8884 nm/RIU, approximately 17% higher than the single-strip reference. The two-strip design better balances sensitivity, linewidth, and resonance depth. The proposed platform may support high-resolution, localized refractometric measurements relevant to non-destructive monitoring.
1. Introduction
Electromagnetic surface waves (ESWs) have been widely investigated for optical sensing because their electromagnetic fields are strongly confined near an interface and are therefore highly sensitive to variations in the refractive index (RI) of the surrounding medium [1,2,3]. Among ESW-based sensors, surface plasmon resonance (SPR) is the most established technology and has demonstrated excellent RI sensitivity. However, the intrinsic absorption and dispersion of the metallic layers required for SPR lead to resonance broadening, increasing the full width at half maximum (FWHM) and limiting the achievable figure of merit (FOM) [4,5,6].
Dielectric surface waves, particularly Bloch surface waves (BSWs), have emerged as an attractive alternative because dielectric photonic crystals exhibit substantially lower optical losses than metallic structures, enabling narrower resonances and high FOM values while maintaining high RI sensitivity [7,8,9]. In side-polished photonic crystal fibers (PCFs), the periodic air-hole microstructure of the cladding can itself act as a two-dimensional photonic crystal. Under appropriate phase-matching conditions, the evanescent field of the core-guided mode can couple to surface modes supported near the polished interface. The addition of a single high-refractive-index, low-loss dielectric layer on the flat surface modifies the local boundary conditions and enables direct tuning of these modes [6,10]. Since their field confinement is not necessarily strictly tied to the periodicity of the photonic crystal, these modes have been described as Bloch-like surface waves (BLSWs). Side-polished PCF platforms supporting BLSWs have demonstrated high sensitivities together with ultra-high FOM values, making them particularly attractive for high-resolution refractometric sensing [6,10]. Compared with conventional side-polished single-mode-fiber BSW platforms, which generally require a deposited dielectric multilayer to provide the photonic bandgap, the periodic cladding of the PCF itself acts as the photonic crystal, allowing BLSW excitation using only a single high-index termination layer [6,10]. This reduces the complexity of the functional coating and provides additional flexibility for controlling modal coupling through the PCF microstructure and polishing depth. These advantages must, however, be balanced against the higher cost and greater splicing complexity of PCFs compared with conventional single-mode fibers.
The sensing performance of these structures is strongly influenced not only by the optical properties and thickness of the dielectric coating but also by its lateral geometry. In a previous study, the effect of partially removing a TiO2 nanolayer deposited on a side-polished PCF was investigated, progressively transforming the continuous coating into a single nanostrip [11]. Reducing the coating width increased the lateral confinement of the BLSW mode and produced substantially narrower resonances, leading to an enhancement of the FOM for sufficiently narrow strips. However, this improvement was accompanied by a reduction in refractive-index sensitivity, revealing an important trade-off between modal confinement, resonance linewidth, and light–analyte interaction [11]. These results indicate that further manipulation of the lateral coating geometry may provide an additional degree of freedom for tuning the performance of BLSW refractometers.
Motivated by this trade-off, the present work investigates a multi-nanostrip configuration in which the TiO2 coating is divided into two or three parallel nanostrips separated by controlled inter-strip gaps (GAP). Rather than confining the surface mode within a single strip, the proposed geometry is intended to redistribute the BLSW electromagnetic field among adjacent dielectric regions and the analyte-filled gaps between them. Consequently, the GAP becomes an additional design parameter that can modify the overlap between the evanescent field and the surrounding medium and potentially enhance RI sensitivity while preserving the narrow resonances characteristic of laterally confined BLSW modes.
High-resolution fiber-optic refractometers may also be relevant to non-destructive testing (NDT) and structural-health monitoring when degradation processes are accompanied by changes in the composition or refractive index of accessible fluids. One representative scenario is the monitoring of chloride-rich aqueous ingress or variations in pore-fluid composition in reinforced-concrete structures, for which optical-fiber sensing approaches have been investigated [12]. In a practical implementation, the D-shaped sensing section could operate as a protected sensing head located at a monitoring point or coupled to a small sampling chamber, while the light source and spectral interrogator remain remotely located. Such an arrangement preserves the compactness, remote-interrogation capability, immunity to electromagnetic interference, and minimally invasive nature of fiber-optic sensing [13]. The present device should nevertheless be regarded as a refractometric platform rather than as a chemically selective sensor; selectivity toward specific species would require appropriate surface functionalization and calibration.
In this work, the refractometric performance of two- and three-nanostrip BLSW configurations is systematically investigated as a function of the separation between adjacent strips. Finite-element method (FEM) modal analysis and eigenmode expansion (EME) propagation simulations are used to characterize the optical intensity distributions and transmission spectra of the proposed structures. Their performance is assessed in terms of refractive-index sensitivity, FWHM, resonance depth, FOM, and RFOM, with the objective of determining how the multi-nanostrip geometry tunes the trade-off between refractometric sensitivity and spectral performance.
2. Materials and Methods
2.1. Sensor Geometry
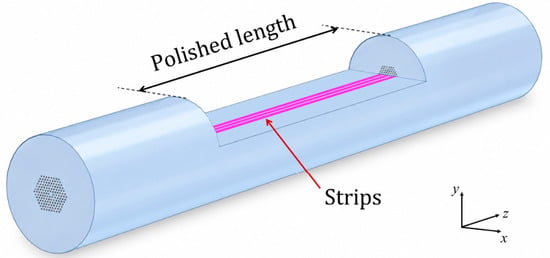
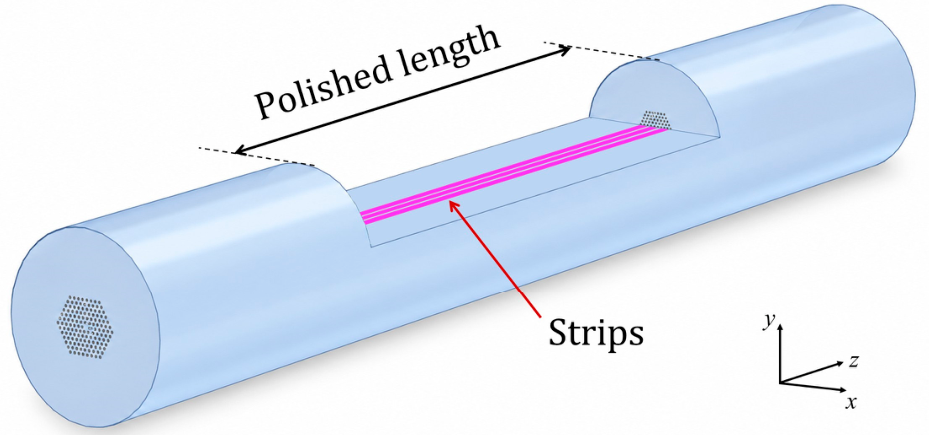
The sensor model was based on the commercial endlessly single-mode PCF LMA-05 from NKT Photonics (Birkerød, Denmark). The fiber consists of a pure-silica background containing a hexagonal array of air holes with a pitch of , an air-hole filling ratio of , and a core diameter of approximately [6,14]. As shown in Figure 1, the fiber was side-polished to obtain a -mm-long D-shaped cross-section, leaving three rows of air holes between the core and the flat surface. This geometry corresponds to a distance of h = 1.24 between the uppermost row of holes and the polished surface [6]. A 31-nm-thick TiO2 coating was included on the flat surface of the polished section to support the first-order transverse electric (TE)-polarized BLSWs in the near-infrared.
Figure 1.
Three-dimensional schematic of the side-polished LMA-05 PCF containing a 20-mm-long TiO2 multi-nanostrip sensing section. The nanostrips are parallel to the fiber axis and exposed to the surrounding analyte.
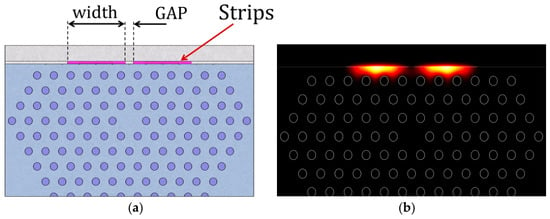
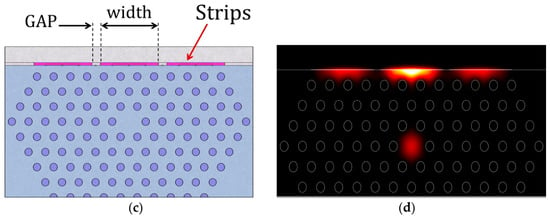
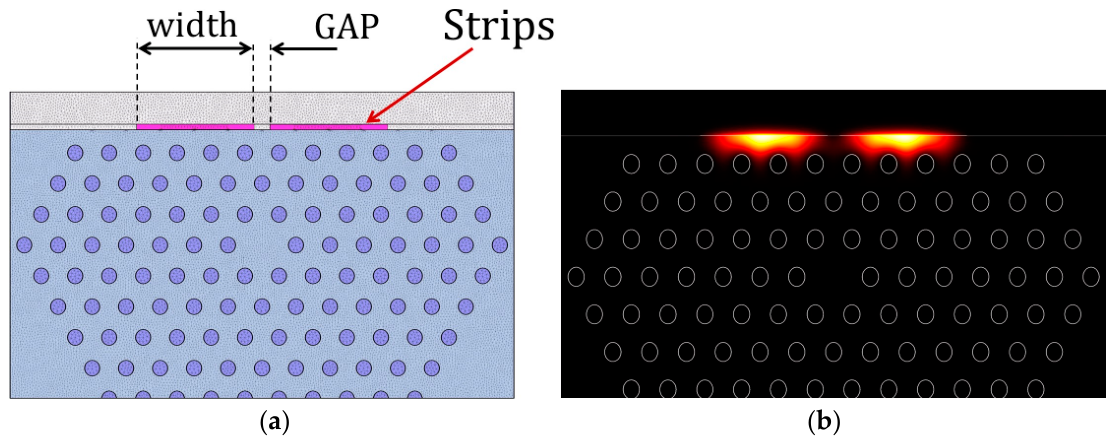
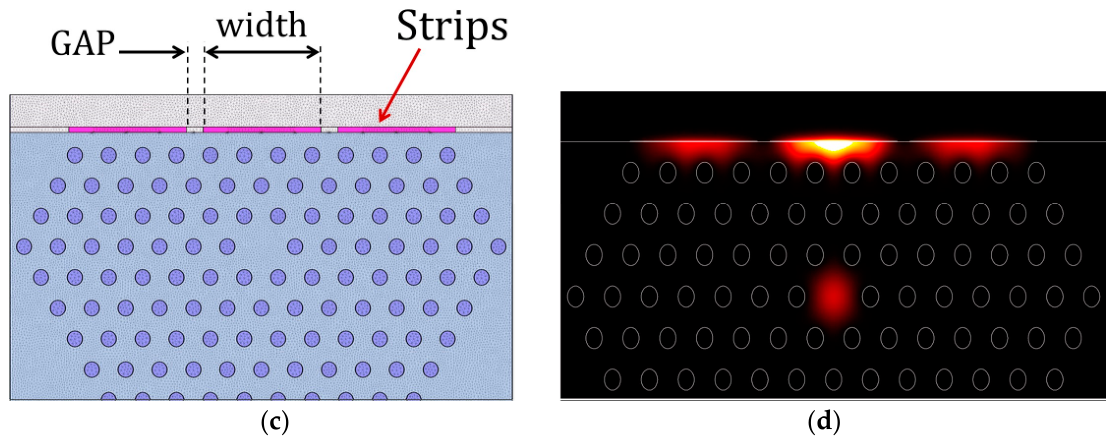
Two symmetric configurations were analyzed (Figure 2), one with two 10-μm-wide strips separated by the gap (GAP) (Figure 2a,b), and the other with three 10-μm-wide strips with one central strip and two lateral strips at the same GAP (Figure 2c,d). The analyte occupied the region above and between the strips.
Figure 2.
Cross-sectional geometries and representative optical intensity distributions of the first-order TE-BLSW for (a,b) the two-strip and (c,d) the three-strip configurations. In (b,d), the color scale represents the normalized optical intensity, ranging from minimum (black) to maximum (yellow/white).
2.2. Numerical Modeling
The optical response was calculated using FIMMWAVE and its FIMMPROP propagation module (version 8.1.0, Photon Design, Oxford, UK). The longitudinal model comprised three consecutive sections, two unmodified PCF sections separated by a 20-mm-long, side-polished, TiO2-coated sensing section. The transverse modes supported by each section were calculated using the finite element method implemented in the FIMMWAVE FDM/FEM mode solver, whereas propagation through the complete structure and coupling between the modes of consecutive sections were evaluated using the eigenmode expansion method implemented in FIMMPROP. The fundamental TE-polarized core mode of the unmodified PCF was used as the input field. The number of modes retained in the D-shaped section was determined from a numerical convergence analysis (Supplementary Figure S1), which showed that the resonance characteristics remained essentially unchanged when 15 or more modes were included. Accordingly, 20 modes were used in all subsequent simulations to ensure adequate representation of the relevant surface-mode coupling while maintaining a reasonable computational cost.
Perfectly matched layers (PMLs) were not used. Accordingly, the calculated attenuation bands represent power coupled from the fundamental core mode to the BLSW modes, including absorption in the TiO2 termination layer, rather than radiation loss into free space. Unless otherwise stated, the transverse computational window was 43 μm-wide and 25 μm-high, the FEM mesh was defined using the parameter nElemPerDiagonal = 100, and the transmission spectra were calculated using a wavelength step of 0.5 nm.
Material dispersion was included for both fused silica and TiO2 using the wavelength-dependent models in references [15,16], and a TiO2 extinction coefficient of was used as an effective value accounting for absorption [17]. The refractive index of the surrounding analyte was treated as constant over the simulated wavelength interval, and the resonance wavelength was assigned to the first-order TE-BLSW attenuation peak. If an additional resonance appeared, the primary peak was tracked through continuity of its resonance wavelength and by examining its transverse optical intensity distribution. This criterion prevents an artificial change in resonance branch when the relative depths of the two dips vary. The value of the extinction coefficient should be regarded as an effective low-loss value representative of TiO2 thin films near telecom wavelengths and of additional absorption and scattering losses [6]. Since the same optical constants are used for all configurations, the relative influence of the nanostrip geometry can be compared consistently. However, the absolute FWHM, resonance depth, and RFOM are expected to depend on the actual losses of the fabricated TiO2 film. Similarly, the analyte RI is treated as wavelength independent to isolate the local refractometric response; for a specific practical application, its wavelength-dependent complex refractive index should be incorporated.
Numerical stability was evaluated by independently varying the wavelength sampling, FEM mesh resolution, number of calculated modes, and transverse computational-window width. The complete convergence analysis is provided in the Supplementary Material (Figure S1 and Tables S1–S4). The results showed that the resonance characteristics remained stable around the selected numerical parameters. Based on these tests, a wavelength step of 0.5 nm, nElemPerDiagonal = 100, 20 calculated modes, and a 43 μm-wide computational window were adopted for the simulations.
2.3. Refractometric Performance Metrics
The refractometric performance was evaluated using the wavelength sensitivity (), full width at half maximum (FWHM), figure of merit (FOM), resonance-depth magnitude (), and reasonable figure of merit (RFOM). For each configuration, was determined by linear regression using analyte refractive indices between 1.330 and 1.334 and is expressed in nm/RIU. The FWHM and were measured for the tracked primary TE-BLSW attenuation dip and averaged over the three refractive indices. The resonance depth was defined as the positive attenuation magnitude relative to the local baseline. The metrics were calculated as FOM = /FWHM, expressed in RIU−1, and RFOM = FOM ∗ Depth, expressed in dB/RIU [11]. All configurations were evaluated using the same interaction length, wavelength sampling, refractive-index values, and resonance-processing procedure. For the three-strip configuration with GAP = 1.2 μm, the influence of RI sampling density was assessed using five equally spaced refractive-index values within the same interval. The resulting sensitivity differed by less than 0.02% from the three-point estimate, and both linear fits yielded R2 = 0.9998 (Supplementary Figure S3 and Table S6).
3. Results and Discussion
3.1. Spectral Response
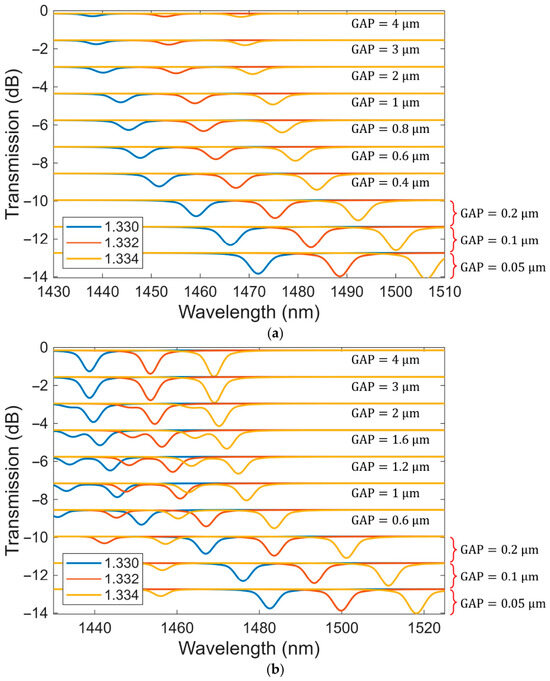
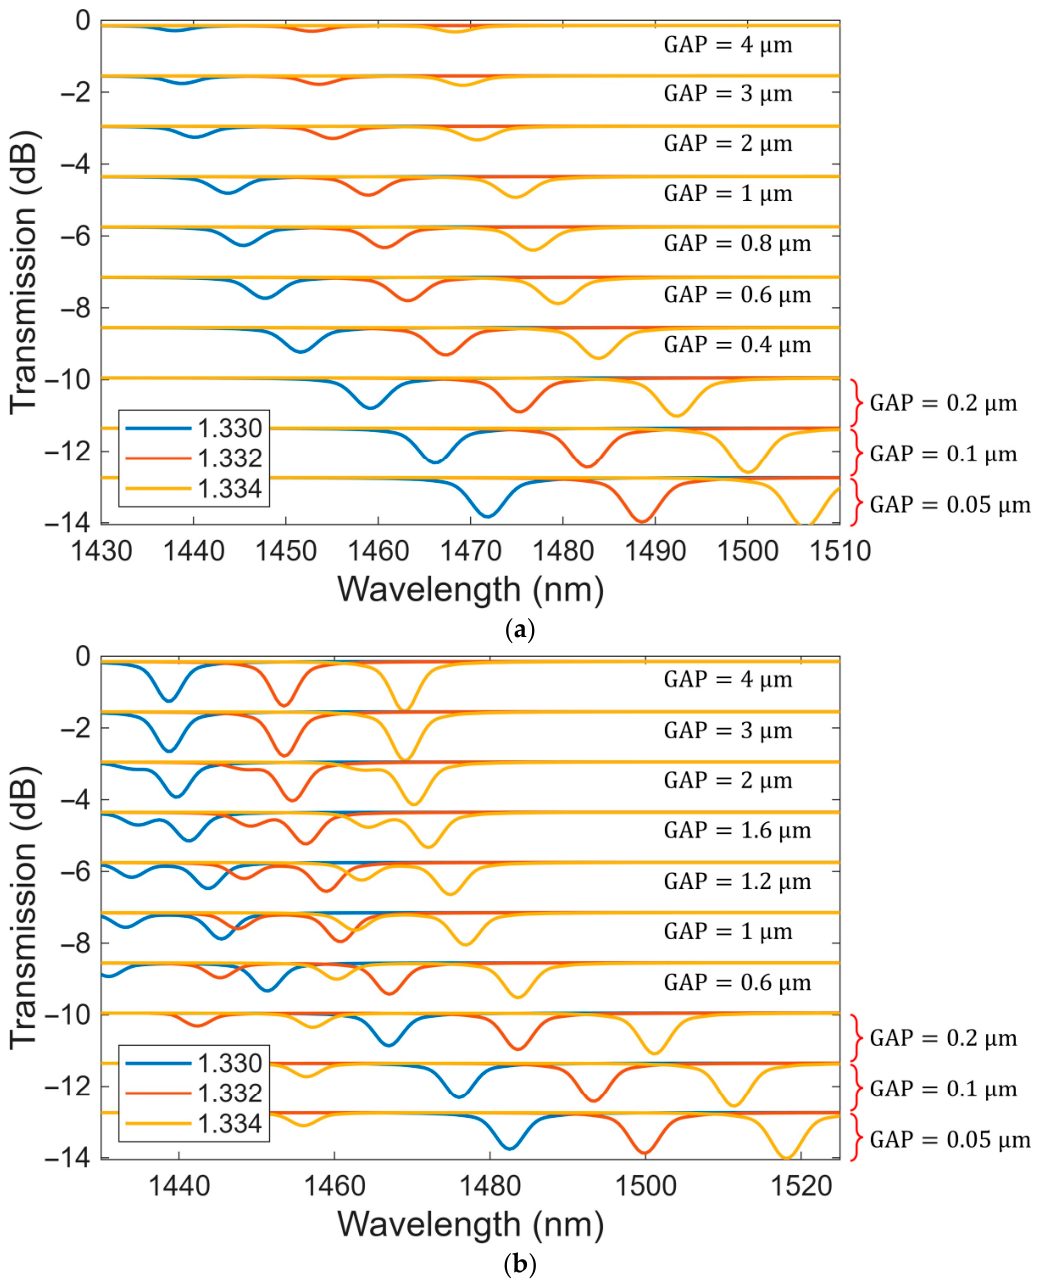
Figure 3 presents the transmission spectra of the two- and three-strip configurations for different GAP distances and analyte refractive indices. The spectra corresponding to successive GAP values are vertically offset; therefore, their vertical positions do not represent additional propagation losses. In both configurations, increasing the analyte refractive index from 1.330 to 1.334 produces a systematic redshift of the BLSW resonance, confirming the expected refractometric response.
Figure 3.
Transmission spectra of the (a) two-strip and (b) three-strip BLSW configurations for different GAPs and analyte RI between 1.330 and 1.334. Successive spectra are vertically offset for clarity; the offsets do not represent additional propagation losses.
For the two-strip configuration, Figure 3a shows a single dominant attenuation dip throughout the investigated GAP range. As the GAP is reduced, the resonance shifts toward longer wavelengths and the spectral separation between the dips corresponding to the three analyte RI values increases. This behavior indicates an increase in wavelength sensitivity, which can be attributed to the modification of the BLSW field distribution and its interaction with the analyte as the two strips approach each other. The resonance also becomes progressively deeper for smaller GAPs, indicating stronger coupling between the fundamental core mode and the surface mode.
The three-strip configuration exhibits a similar general response, where an increase in the analyte RI produces a redshift, while reducing the GAP increases the separation between the corresponding resonance wavelengths and, consequently, the RI sensitivity. However, Figure 3b reveals a more complex spectral evolution for intermediate separations, approximately between 1 and 2 μm. In this interval, a secondary attenuation dip appears next to the primary resonance, indicating simultaneous coupling of the core-guided mode to two different BLSW branches. Modal inspection shows that the primary peak corresponds to a BLSW whose optical intensity distribution is predominantly concentrated around the central TiO2 strip and its adjacent regions, as illustrated in Figure 2d. The second peak, whose optical intensity distribution is shown in the Supplementary Material, exhibits more pronounced intensity localization around the two lateral strips. When the resonance wavelengths of these two branches become spectrally close, the optical power transferred from the core mode is redistributed between them. Consequently, the attenuation associated with the primary resonance decreases, producing the reduction in resonance depth observed between approximately 1 and 2 μm.
As the two resonance peaks become spectrally separated again, their competition for the power coupled from the core mode is reduced. The primary attenuation dip consequently recovers its depth and resumes the trend observed outside the multimode-interaction interval. This modal competition explains the non-monotonic dependence of resonance depth on the GAP in the three-strip configuration.
3.2. Influence of the Inter-Strip GAP on Refractometric Performance
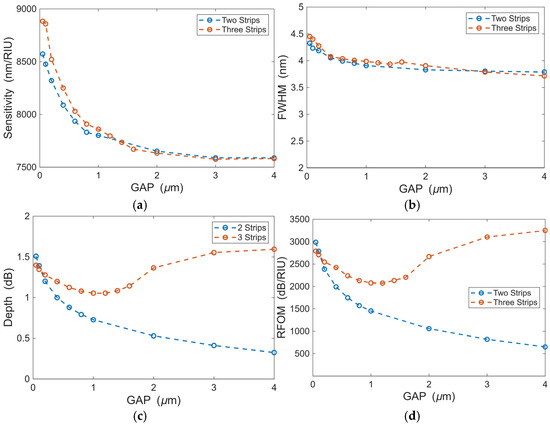
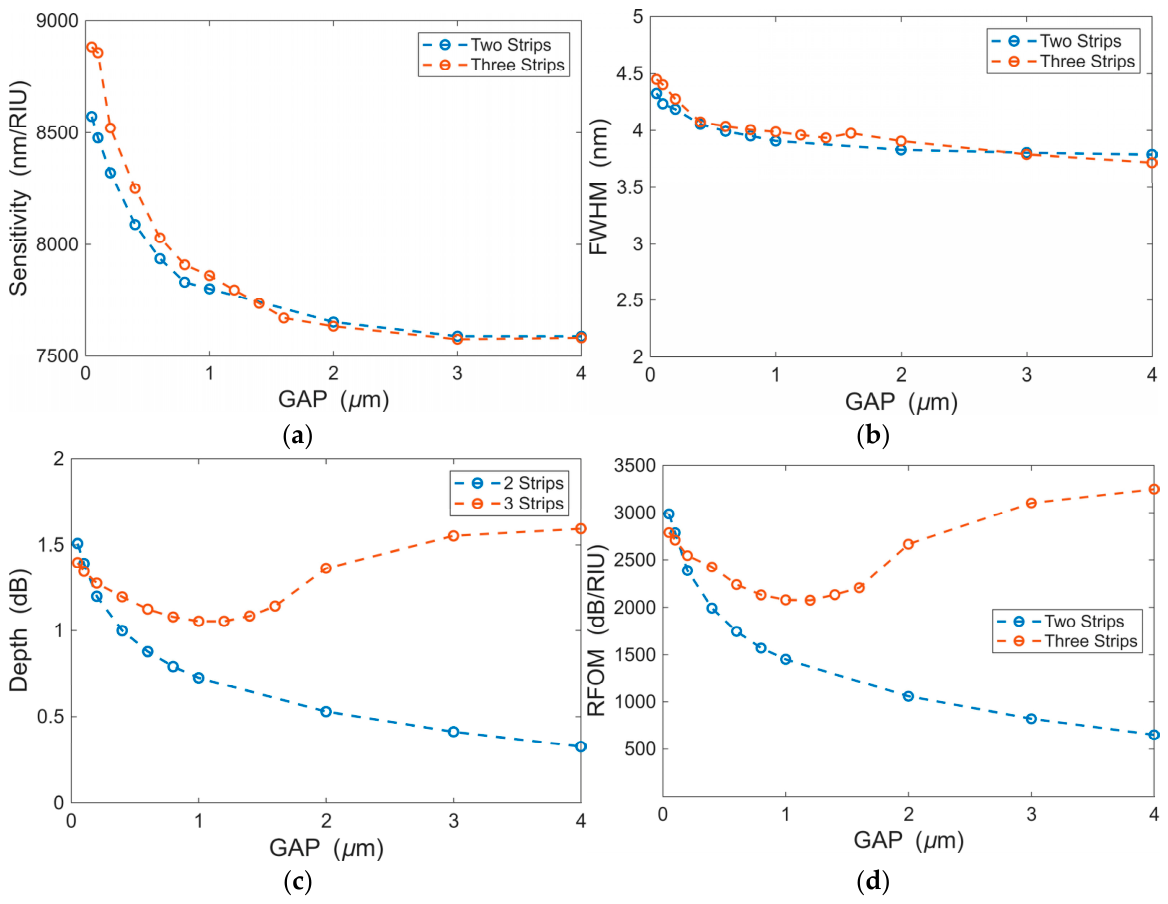
Figure 4 summarizes the sensitivity, FWHM, resonance depth, and RFOM obtained for the two- and three-strip configurations. The results reveal that reducing the GAP improves the sensitivity (see Figure 4a) but also broadens the resonance. At GAP = 0.05 μm, the two- and three-strip configurations reach sensitivities of 8573 and 8884 nm/RIU, respectively, corresponding to increases of approximately 13% and 17% relative to the single-strip reference (7597 nm/RIU). At large GAPs, the sensitivities of both layouts approach approximately 7580 nm/RIU. However, only the three-strip layout reproduces the complete single-strip response because its central strip remains aligned with the fiber core, whereas the two-strip resonance becomes substantially shallower.
Figure 4.
Refractometric performance as a function of the GAP for the two- and three-strip configurations: (a) sensitivity, (b) FWHM, (c) resonance depth, and (d) RFOM.
This sensitivity increase is accompanied by resonance broadening, which affects FWHM, as shown in Figure 4b. In the two-strip case, the FWHM grows from 3.79 nm to 4.33 nm, while in the three-strip case it increases from 3.72 to 4.45 nm. As both sensitivity and FWHM increase, the FOM remains relatively stable, ranging from 1930 to 2040 RIU−1. Therefore, the conventional FOM alone does not effectively discriminate among the analyzed configurations. Thus, the gain in sensitivity at small GAPs is largely offset when using the conventional FOM.
In contrast, the resonance depth is strongly affected by the GAP of the structure, as shown in Figure 4c. For two strips, the depth increases from 0.32 dB to 1.51 dB, which is a 4.6-fold rise. This occurs because reducing the GAP concentrates the TiO2-coated regions above the core, strengthening coupling with the surface mode. In contrast, the three-strip configuration shows a different behavior. When the strips are separated from each other, the central strip dominates and yields a depth of 1.59 dB. As the GAP decreases, the depth drops to about 1.05 dB (at GAP = 1.2 μm), before recovering to 1.40 dB (at GAP = 0.05 μm). This behavior is linked to the competition between BLSW branches predominantly localized around the central and lateral strips, which redistribute power in the intermediate-GAP region and weaken the main resonance.
Figure 4d shows that the RFOM reflects the resonance depth trend. For two strips, it increases from 651 to 2987 dB/RIU as the GAP decreases. Within the two-strip configuration, reducing the GAP simultaneously increases sensitivity, resonance depth, and RFOM. For three strips, the RFOM starts at 3250 dB/RIU (GAP = 4 μm), drops to 2074 dB/RIU (GAP = 1.2 μm), and recovers to 2790 dB/RIU (GAP = 0.05 μm). Although the smallest GAP case provides the highest sensitivity, its RFOM is lower than that of the large-GAP case due to a broader and slightly weaker resonance.
Table 1 compares the selected multi-nanostrip configurations against the single-strip reference and includes the large-GAP three-strip case to verify the limiting behavior.
Table 1.
Comparison of the single-nanostrip and the selected multi-nanostrip configurations.
At GAP = 4 μm, the three-strip design reproduces the single-strip response, confirming that distant lateral strips contribute negligibly. By contrast, at GAP = 0.05 μm, the two- and three-strip configurations increase sensitivity by approximately 13% and 17%, respectively, relative to the single-strip reference, while resonance broadening and changes in resonance depth reduce RFOM by approximately 8% and 14%. Thus, two strips provide a favorable sensitivity–RFOM compromise among the fixed-width multi-strip configurations, whereas three closely spaced strips are preferable when the main criterion is to maximize sensor sensitivity.
From a fabrication perspective, the 50-nm GAP represents a demanding but technologically meaningful limiting case. Electron-beam lithography and related patterning approaches have demonstrated TiO2 features with characteristic dimensions in the 30–60 nm range, while nanoscale periodic structures have also been fabricated directly on side-polished optical-fiber sensing regions [18,19,20]. The main challenge is therefore maintaining a uniform gap and sufficiently smooth strip edges over the 20-mm interaction length. Fabrication-induced dimensional variations may shift the resonance and modify its linewidth and depth [21]; consequently, the 50-nm configuration should be regarded as the high-sensitivity limit of the investigated design space rather than as a fabrication-insensitive practical optimum.
3.3. Influence of Total TiO2-Coated Width and Resonance Wavelength
Because the main parametric study maintained the individual strip width at 10 μm, increasing the number of strips also increases the total TiO2-coated width. To isolate the influence of lateral segmentation from the increase in total TiO2-coated width, an additional control study was performed at GAP = 0.05 μm using 1 × 10 μm, 2 × 5 μm, and 3 × 3.33 μm configurations. With the TiO2 thickness fixed at 31.0 nm, the corresponding sensitivities were 7597, 7315, and 7217 nm/RIU, respectively, indicating that segmentation at constant total coating width does not intrinsically increase the refractive-index sensitivity. However, the reduction in individual strip width also shifts the BLSW resonance toward shorter wavelengths. To separate this spectral contribution from the effect of lateral segmentation, the TiO2 thickness was slightly adjusted to align the resonances within the same spectral region. Under these spectrally matched conditions, the sensitivities converged to 7597, 7579, and 7580 nm/RIU, respectively, differing by less than 0.25%. Complete results are presented in Table 2.
Table 2.
Control analysis of the influence of lateral TiO2 segmentation and resonance wavelength on refractometric performance for GAP = 0.05 μm. In all cases the total TiO2 width is approximately 10 μm.
These results indicate that lateral segmentation alone does not intrinsically enhance refractive-index sensitivity. Instead, the sensitivity variations observed for the fixed-thickness configurations are strongly influenced by the geometry-induced shift in the BLSW operating wavelength. Once this spectral shift is compensated, the single-, two-, and three-strip configurations exhibit nearly equivalent sensitivities and comparable spectral performance. Therefore, the sensitivity enhancement observed in the original fixed-10-μm-strip study should be interpreted as the combined consequence of the increased total coated width and the associated modal and spectral tuning, rather than solely as an effect of the inter-strip gaps.
4. Conclusions
Multi-nanostrip patterning provides an additional parameter for tuning BLSW refractometers.
At the smallest investigated GAP (0.05 μm), the three-strip configuration achieved the highest computed sensitivity (8884 nm/RIU), whereas the two-strip configuration provided a favorable sensitivity–RFOM compromise among the fixed-width multi-strip designs. The large-GAP three-strip response reproduced the single-strip reference, confirming the negligible contribution of distant lateral strips. Because the individual strip width rather than the total coating width was fixed, the observed sensitivity enhancement results from the combined effects of increased coated width and geometry-induced modal and spectral tuning. Thus, three closely spaced strips are preferable for sensitivity-driven measurements, whereas two strips better balance the spectral metrics. The proposed platform may therefore be of interest for localized refractometric monitoring of fluid-composition changes associated with NDT and structural-health-monitoring scenarios, such as chloride-rich aqueous ingress in reinforced concrete. Experimental validation, including fabrication tolerances, temperature cross-sensitivity, selectivity, and long-term stability, will be required before practical deployment.
Supplementary Materials
The following supporting information can be downloaded at https://www.mdpi.com/article/10.3390/engproc2026156007/s1, Figure S1: Numerical stability analysis of transmission spectra under variations in simulation parameters; Table S1: Influence of wavelength sampling on resonance characteristics; Table S2: Influence of the number of modes in the D-shaped sensing section on resonance characteristics; Table S3: Influence of FEM mesh resolution on resonance characteristics; Table S4: Influence of the transverse computational-window width on resonance characteristics; Figure S2: Transmission spectrum and double-resonance feature of the three-strip configuration; Table S5: Effective refractive indices and transverse optical intensity distributions of the core-guided mode and two BLSW branches at the resonance wavelengths; Figure S3: Transmission spectra of the three-strip configuration using three and five analyte RI values; Table S6: Comparison of the refractometric performance of the three-strip configuration using three and five RI sampling points.
Author Contributions
E.G.-V.: conceptualization, investigation, resources, supervision, writing—review and editing, formal analysis, and project administration. J.C.V.-M.: methodology and software. N.G.-C. and P.T.: conceptualization, resources, supervision. All authors have read and agreed to the published version of the manuscript.
Funding
This research was partially funded by Corporación Ruta N Medellín through the Fourth Joint Call for Projects for the G8+, under Cooperation Agreement No. CI-26-135, corresponding to the project “Plataforma FOTON-IA: Monitoreo inteligente para la valorización energética de aguas residuales en el Valle de Aburrá”. Additional funding was provided by Institución Universitaria ITM (PG8 26101) and Universidad Nacional de Colombia (Hermes Code 66401).
Institutional Review Board Statement
Not applicable.
Informed Consent Statement
Not applicable.
Data Availability Statement
The data that support the findings of this study are available from the corresponding author upon reasonable request.
Conflicts of Interest
The authors declare no conflicts of interest.
References
- Hu, D.J.J.; Ho, H.P. Recent Advances in Plasmonic Photonic Crystal Fibers: Design, Fabrication and Applications. Adv. Opt. Photonics 2017, 9, 257–314. [Google Scholar] [CrossRef] [Scilit]
- Liscidini, M.; Gerace, D.; Sanvitto, D.; Bajoni, D. Guided Bloch Surface Wave Polaritons. Appl. Phys. Lett. 2011, 98, 121118, Erratum in Appl. Phys. Lett. 2011, 98, 199901. https://doi.org/10.1063/1.3589118. [Google Scholar] [CrossRef] [Scilit]
- Descrovi, E.; Sfez, T.; Dominici, L.; Nakagawa, W.; Michelotti, F.; Giorgis, F.; Herzig, H.-P. Near-Field Imaging of Bloch Surface Waves on Silicon Nitride One-Dimensional Photonic Crystals. Opt. Express 2008, 16, 5453. [Google Scholar] [CrossRef] [Scilit]
- Piliarik, M.; Homola, J. Surface Plasmon Resonance (SPR) Sensors: Approaching Their Limits? Opt. Express 2009, 17, 16505. [Google Scholar] [CrossRef] [Scilit]
- Sinibaldi, A.; Danz, N.; Descrovi, E.; Munzert, P.; Schulz, U.; Sonntag, F.; Dominici, L.; Michelotti, F. Direct Comparison of the Performance of Bloch Surface Wave and Surface Plasmon Polariton Sensors. Sens. Actuators B Chem. 2012, 174, 292–298. [Google Scholar] [CrossRef] [Scilit]
- Gonzalez-Valencia, E.; Reyes-Vera, E.; Del Villar, I.; Torres, P. Side-Polished Photonic Crystal Fiber Sensor with Ultra-High Figure of Merit Based on Bloch-like Surface Wave Resonance. Opt. Laser Technol. 2024, 169, 110129. [Google Scholar] [CrossRef] [Scilit]
- Gryga, M.; Ciprian, D.; Hlubina, P. Bloch Surface Wave Resonance Based Sensors as an Alternative to Surface Plasmon Resonance Sensors. Sensors 2020, 20, 5119. [Google Scholar] [CrossRef] [Scilit]
- Gryga, M.; Ciprian, D.; Hlubina, P. From Bloch Surface Waves to Cavity-Mode Resonances Reaching an Ultrahigh Sensitivity and a Figure of Merit. Opt. Lett. 2023, 48, 6068. [Google Scholar] [CrossRef] [Scilit]
- Gonzalez-Valencia, E.; Herrera, R.A.; Torres, P. Bloch Surface Wave Resonance in Photonic Crystal Fibers: Towards Ultra-Wide Range Refractive Index Sensors. Opt. Express 2019, 27, 8236. [Google Scholar] [CrossRef] [Scilit]
- Gonzalez-Valencia, E.; Del Villar, I.; Torres, P. Bloch Waves at the Surface of a Single-Layer Coating D-Shaped Photonic Crystal Fiber. Opt. Lett. 2020, 45, 2547–2550. [Google Scholar] [CrossRef] [Scilit]
- Gonzalez-Valencia, E.; Lara-Davila, N.C.; Montoya-Cardona, J.A.; Gomez-Cardona, N.; Torres, P. Performance of Bloch-like Surface Wave Refractometers Based on Laterally Polished Photonic Crystal Fibers with Single-Layer Coatings: From Nanolayer to Nanostrip. Eng. Proc. 2025, 118, 22. [Google Scholar] [CrossRef] [Scilit]
- Lam, C.C.C.; Rajesh, M.; Sun, T.; Grattan, K.T.V.; Grattan, S.K.T.; Taylor, S.E.; Basheer, P.A.M. Calibration of Optical Fiber Refractive Index Sensor with Potential for Structural Corrosion Monitoring. ACI Symp. Publ. 2008, 252, 73–84. [Google Scholar] [CrossRef] [Scilit]
- Hassani, S.; Dackermann, U. A Systematic Review of Advanced Sensor Technologies for Non-Destructive Testing and Structural Health Monitoring. Sensors 2023, 23, 2204. [Google Scholar] [CrossRef] [Scilit]
- Debbal, M.; Bouregaa, M.; Chikh-Bled, H.; Chikh-Bled, M.E.K.; Ouadah, M.C.E. Influence of Temperature on the Chromatic Dispersion of Photonic Crystal Fiber by Infiltrating the Air Holes with Water. J. Opt. Commun. 2019, 44, 163–166. [Google Scholar] [CrossRef] [Scilit]
- Saleh, B.E.A.; Teich, M.C. Fundamentals of Photonics, 2nd ed.; Saleh, B.E.A., Ed.; Wiley Series in Pure and Applied Optics; John Wiley & Sons, Inc.: New York, NY, USA, 2007; Volume 24, ISBN 978-0-471-35832-9. [Google Scholar]
- DeVore, J.R. Refractive Indices of Rutile and Sphalerite. J. Opt. Soc. Am. 1951, 41, 416–419. [Google Scholar] [CrossRef] [Scilit]
- Lang, Y.; Liu, Q.; Wang, Q.; Zhou, X.; Jia, G. Wavelength-Dependent Goos-Hänchen Shifts Observed in One-Dimensional Photonic Crystal Films with Different Structures. Phys. Lett. A 2022, 449, 128348. [Google Scholar] [CrossRef] [Scilit]
- Huang, J.; Lee, M.; Lucero, A.; Cheng, L.; Kim, J. Area-Selective ALD of TiO2 Nanolines with Electron-Beam Lithography. J. Phys. Chem. C 2014, 118, 23306–23312. [Google Scholar] [CrossRef] [Scilit]
- Einck, V.J.; Torfeh, M.; McClung, A.; Jung, D.E.; Mansouree, M.; Arbabi, A.; Watkins, J.J. Scalable Nanoimprint Lithography Process for Manufacturing Visible Metasurfaces Composed of High Aspect Ratio TiO2 Meta-Atoms. ACS Photonics 2021, 8, 2400–2409. [Google Scholar] [CrossRef] [Scilit]
- Xiao, L.; Liu, K.; Jing, J.; Jiang, J.; Zhu, F.; Zhan, X.; Liu, J.; Xiong, Y.; Xu, T.; Liu, T. Highly Sensitive Near-Field Leakage-Enhanced Optical Fiber SPR Sensor Based on Gold Nanoarrays Modulation. Opt. Laser Technol. 2025, 180, 111518. [Google Scholar] [CrossRef] [Scilit]
- Sahoo, P.K.; Coates, E.; Silver, C.D.; Li, K.; Krauss, T.F. On the Reproducibility of Electron-Beam Lithographic Fabrication of Photonic Nanostructures. Sci. Rep. 2024, 14, 8703. [Google Scholar] [CrossRef] [Scilit]

Disclaimer/Publisher’s Note: The statements, opinions and data contained in all publications are solely those of the individual author(s) and contributor(s) and not of MDPI and/or the editor(s). MDPI and/or the editor(s) disclaim responsibility for any injury to people or property resulting from any ideas, methods, instructions or products referred to in the content. |
© 2026 by the authors. Licensee MDPI, Basel, Switzerland. This article is an open access article distributed under the terms and conditions of the Creative Commons Attribution (CC BY) license.