


Abstract
This article presents the results of the classification of measurement errors of electromyography signals caused by interference and noise. It is shown that interference and measurement noise mainly occur during the registration of electromyography signals and significantly reduce the measurement accuracy. To classify measurement errors, the article analyzes and identifies the features of interference and measurement noise. This analysis is based on the mechanism of occurrence and the physical nature of interference and noise, as well as their spectral, frequency, and statistical characteristics. Initially, to analyze and identify the features of interference and noise, the article examines the characteristics of electromyography signals recorded during the movement of a human limb. It is shown that the informative components of the motor units of electromyography signals during limb movement are variable. The analysis results revealed that measurement noise and interference are slowly variable and have a Gaussian distribution. The frequency composition of low- and high-frequency interference and measurement noise is distinct from that of the measured electromyography signals. To systematize the results of the analysis, a classification scheme for measuring errors in electromyography signals is presented. It is recommended to use the measurement error classification scheme when solving the problem of signal filtering, where it is necessary to identify informative components for measuring and evaluating the movement of human limbs using electromyography signals. Furthermore, a comparative evaluation of band-pass filters of different orders was conducted to eliminate interference. A lower-order band-pass filter, even when implemented unidirectionally, improves the signal-to-noise ratio and highlights informative components.
1. Introduction
The development of the modern electronic base of microelectronic technology has led to the widespread use of computing devices and digital systems for measuring bioelectric signals, particularly in electromyography research.
Electromyography is a method for studying the bioelectric potentials generated in human skeletal muscles during power loads and limb movement. In this case, the bioelectric potentials produced by muscles are commonly referred to as an electromyography (electromyography) signal [1,2].
Due to the development of the theory of bioelectric signals, created by V.S. Gurfinkel and N.N. Vasilevsky under the leadership of N.P. Bekhterova, it is possible to use electromyography signals not only in medicine for diagnosis [3], but also in information and measurement systems for managing various means of rehabilitation [1] for measurement and evaluation limb movements [4].
The information and measurement system for managing rehabilitation facilities [3,4], namely the phalanges of the fingers of the prosthetic hand, includes [5,6]: a human operator for forming movement commands; a portable measuring system for registering gestures using electromyography signals; a computer for measuring finger gestures and evaluating limb movement; an executive mechanism of the rehabilitation device—prosthetic hand.
In practical conditions, during the registration of electromyography signals [2,5,6], there is an inevitable impact of errors caused by interference and noise [7,8]. Interference and noise significantly reduce the accuracy of measuring electromyography signals [9,10]. The fight against interference and noise in the reception and study of measured bioelectric signals is an urgent and fundamental task of instrument engineering [11,12].
It is known that among the methods for compensating measurement errors, the most effective is the filtration method based on separating the spectral components of measurement signals from interference. At the same time, interference and noise filtering of electromyography signal measurements can be carried out both by hardware filtering tools and by software. With hardware filtering, the measurement signals are processed by filters of the analog recording path. During such filtering, due to insufficient cutoff, interference and noise are attenuated to a lesser extent, necessitating the use of filtering software.
The construction of filtering software is based on the tasks of a priori models of measurement errors (interference and noise). At the same time, the reliability of the assignment and the adequacy of the error models directly affect the accuracy of the measurement results.
There are several names for types of interference and noise in the scientific literature for measuring electromyography signals. To build software measurement tools, there is a great need to clearly distinguish and separate interference and noise by their occurrence and physical nature, as well as by their spectral, frequency, and statistical characteristics. However, due to the ambiguity of the published works on the subject under consideration, this is not always easy; therefore, the analysis and classification of electromyography signal measurement errors caused by interference and noise are urgent tasks.
The purpose of this work is to identify and analyze the main sources of interference and noise, as well as their characteristics, in order to develop a classification scheme for measuring errors in electromyography signals and their filtering. For this purpose, an analysis of the works [10,12] was carried out, as a result of which two main classification features of measurement errors of electromyography signals were presented. Electromyography signal processing is performed through a band-pass filtering system, based on a comparative assessment of the influence of the system’s order. Selecting the order of the band-pass filtering system allows for adequate filtering of classified interference and selection of the filter’s pass-band. Moreover, according to the review, band-pass filtering is the most commonly used method for processing electromyography signals. These filters allow adequate separation of signal components from noise (classified as noise).
This article is structured as follows. First, a problem statement is formulated, and a definition and a mathematical model of the measured signal with measurement error are given. The classification of errors according to the mechanism of occurrence and physical nature, as well as their spectral, frequency, and statistical characteristics, is presented. As part of the analysis, the classification scheme of the measurement error of electromyography signals is considered. After classifying the characteristics of the interference that introduces measurement errors into the electromyography signal, the signal is processed using a band-pass filtering system and the choice of its order. In conclusion, the main conclusions of this work are formulated.
2. Problem Statement
The problems associated with interference and noise in electromyography signal measurements are diverse, and their presence significantly reduces the effectiveness of filtering tools designed to measure these signals. There are various filtering tools, but they do not take into account the shape and characteristics of the electromyography signals and the properties of interference that occurs during registration. Based on this, the task is to analyze various types of interference and noise and classify them, taking into account their spectral, frequency, and statistical characteristics. This approach will make it possible to take into account the effects of interference and noise when improving or developing effective filtering tools to improve the accuracy of measuring electromyography signals in terms of interference. The procedure for software filtering of bioelectric signals consists of the following [2]: signal preprocessing; interference filtering; and selection of signal sections. For the step-by-step implementation of software filtering procedures, it is necessary to study the characteristics of electromyography signals, as well as the properties of interference and noise that occur during registration. The analysis of the identified interference features will further improve the choice of filtering software to improve the accuracy of measuring signal parameters and estimating the movement of a human limb based on electromyography signals.
3. Measuring Electromyography Signal and Its Components
The model of the measuring electromyography signal is characterized by a set of parameters that carry useful information about the object under study and interference of the type (1)
where x(t) is the recorded measuring signal, s(t) is the electromyography signal, and ξ(t) is the measurement interference and noise. In this case, ξ(t) can be represented as the sum of the interference or noise components described below.
x(t) = s(t) + ξ(t)
The s(t) electromyography signal is a complex bioelectric signal, the informative parameters of which are characterized by significant variability. The amplitude and time parameters of the electromyography signal strongly depend on various factors: the type of measuring electrodes used for recording [2], as well as the electrode location and the set motion commands.
As with any measured signal, the frequency response of the electromyography signal lies in the range 0 Hz to 1000 Hz [2,7], limited by the characteristics of the measuring device’s hardware. However, according to numerous studies, the informative part of the motor units of electromyography signals generated during limb movement can be located in the frequency ranges: 0–20 Hz [10], 5–15 Hz [4], 20 Hz [8]. Electromyography signals are also characterized by “statistics” that vary over time due to the bioelectric origin of the measured signal [2], which explains the non-stationarity of the parameters. In addition, the non-stationarity of the parameters of electromyography signals may lead to non-determinism and indicate a lack of a priori information about the shapes of the measured signals.
Measurement errors. Initially, to analyze and classify measurement errors in the electromyography signal, a definition of interference should be provided. The interference ξ(t) is an external disturbance that affects the measurement accuracy. Therefore, in electromyography signals, interference refers to external signals that distort the informative sections and the measurement results. The electromyography signal is usually affected by additive interference of the form (1). As a rule, additive interference is combined with the useful signal and introduces the greatest error in measurement. In information and measurement systems, random additive interference is commonly referred to as noise having a higher frequency spectrum than the useful signal. Let us take a closer look at the nature of interference and noise affecting electromyography signal measurements.
4. Classification by Origin and Physical Nature
From the perspective of the physical nature of interference and noise, electromyography signal measurements are divided into two classes: external and internal. External interference during the measurement of electromyography signals occurs under the influence of external distorting influences, for example: power supply frequency interference, electromagnetic interference, interference from measuring electrodes, interference or artifacts of human movement. Internal interference during signal measurement occurs due to the influence of elements of the measuring equipment itself, for example [5,6]: the operation of amplifiers and resistors, elements of an analog-to-digital converter (ADC).
External interference. Frequency interference of the power supply or network interference is observed during the operation of amplifiers of external electromagnetic household and medical devices. The amplitude of this interference varies slowly during electromyography signal registration and exhibits multiple harmonics at 50/60 Hz and 100/120 Hz [2,7,8]. The effect of electromagnetic interference is observed when exposed to an electromagnetic background and can vary over a wide frequency range [13]. Interference from the measuring electrodes is observed when the electrodes are in poor contact at the skin-electrode junction due to a violation of the conductivity of the contact substances of the electrodes themselves. Motion interference or motion artifact is observed due to the movement of the conductive cables of the measuring electrodes during the movement of the person himself during the registration of electromyography signals, which has harmonics at frequencies of no more than 0.5 Hz [2,7]. When recording electromyography signals, artifacts can appear during the person’s natural activity.
Internal interference. Noise from amplifiers and resistors is observed due to heating of the internal elements of the measuring equipment during prolonged operation and is therefore called thermal noise. It is known [7] that the movement of current carriers causes thermal noise and is present in any element of the measuring device at a non-zero absolute temperature. Noise from ADC elements is observed at the converter output; for example, the drift of current carriers due to the discreteness of electric current is called shot noise.
5. Classification by Spectral, Frequency, and Statistical Characteristics
Based on spectral characteristics, external interference in electromyography signals is classified as narrowband or broadband. Narrowband interference is interference with certain narrow frequency components. In relation to electromyography signals, narrowband external interference is network and electromagnetic interference, motion artifacts, and interference from measuring electrodes. Broadband interference is interference with a wide spectrum and a set of additive frequency components [2]. Electromagnetic interference, which varies over a wide frequency range of the measuring signal, refers to broadband electrical interference.
The spectral characteristic of thermal noise is determined by the white noise spectrum, which is evenly distributed over all frequencies. In other words, this interference is broadband measurement noise. The spectral component of shot noise is determined by the spectrum of white noise, which decreases at lower signal frequencies. By frequency characteristics. Errors in measuring electromyography signals, based on frequency characteristics, are divided into low- and high-frequency interference and noise. Low-frequency interference refers to the portion of the frequency spectrum below the informative range of the measured signals. Similar to low-frequency interference, high-frequency interference refers to the portion of the frequency spectrum above the informative part of the measured signals. Motion artifacts and interference from measuring electrodes are classified as low-frequency interference because their frequency components are no more than 0.5 Hz. Network and electromagnetic interference are classified as high-frequency interference, since their frequency components are above 20 Hz (gestures in the electromyography signal). The frequency composition of thermal (white) noise is manifested at high frequencies, since the noise is limited to the entire range of the measuring signal. Shotgun noise is white in the low-frequency region [7].
According to statistical characteristics. Traditionally, statistical indicators are used in measurement processing to describe error models. The average error value and error distribution density are often used as indicators. It is generally assumed that if the measured average error tends to zero and the distribution density is normal, then the interference and noise are Gaussian. Note that the terms “Gaussian interference” and “Gaussian noise” refer to the probability density distribution. In addition, in an aggressive signal-interference environment, the distribution of measurement errors may be asymmetric relative to the center of the distribution, which may be explained by non-Gaussian interference. In practical conditions, such interference can occur during long-term monitoring of electromyography signals in conditions of active human activity [8].
6. Classification Scheme of Measurement Errors of Electromyography Signals
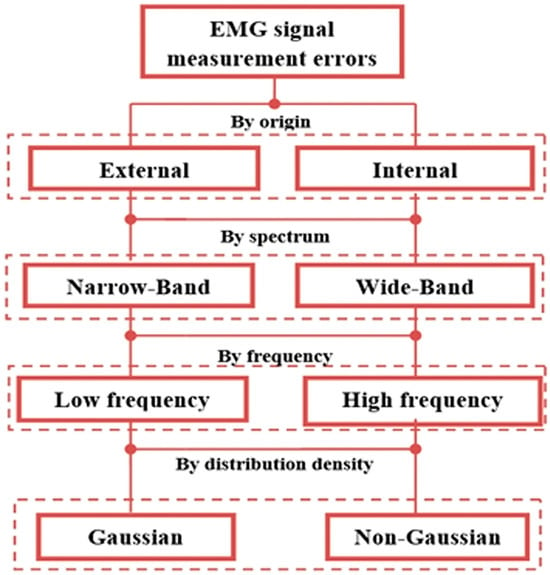
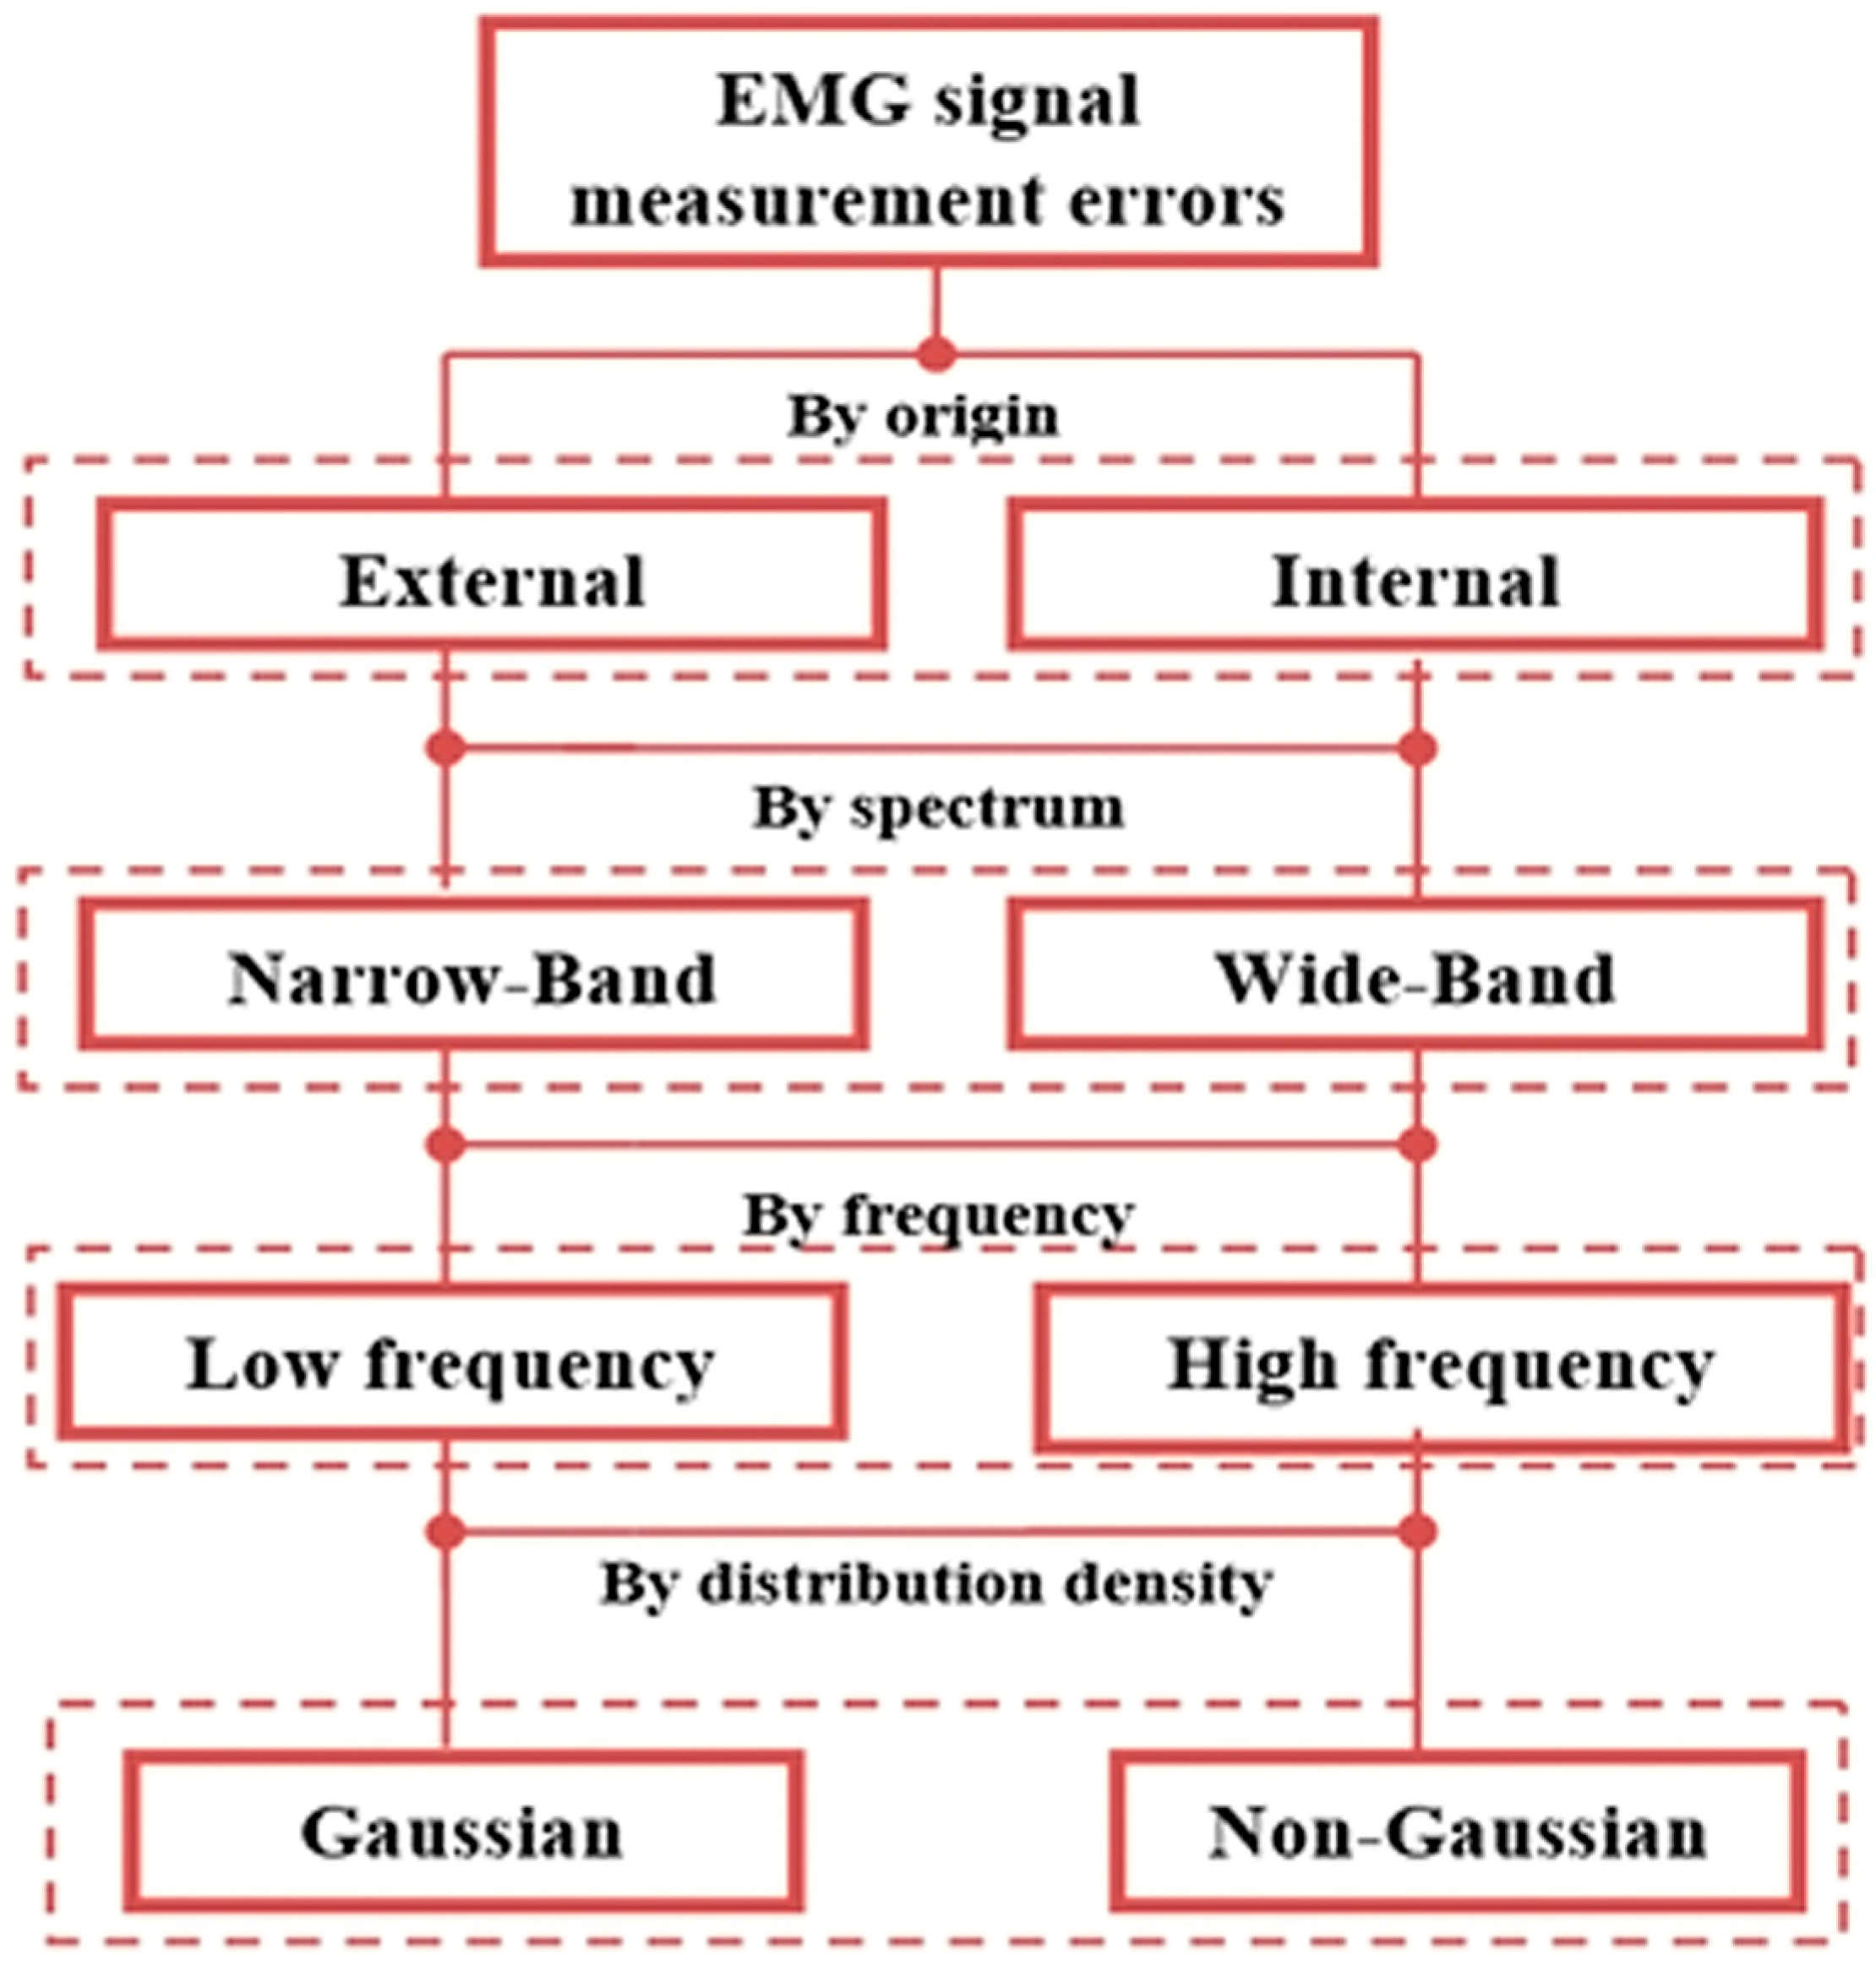
To systematize the above, Figure 1 presents a classification scheme for interference and measurement noise. In the developed scheme, interference and noise are classified by origin, spectrum, frequency, and distribution density.
Figure 1.
Classification of measurement errors of electromyography signals.
Thus, the measurement errors of electromyography signals caused by interference and noise that occur during registration are slowly variable and have a Gaussian distribution. The frequency composition of the low-frequency and high-frequency components of the measurement errors analyzed above largely depends on the frequency component of the measured electromyography signals.
The scientific novelty of this study lies in the development and refinement of a new classification scheme for factors influencing the electromyography signal. Previously, the development of a classification scheme for factors and its systematization according to the proposed four classification criteria has received little attention. A four-level approach to classifying factors influencing the electromyography signal allows for a more refined characterization of the influencing factors, enabling the further selection of signal processing methods.
7. Electromyography Signal Recording and Processing for Comparative Study
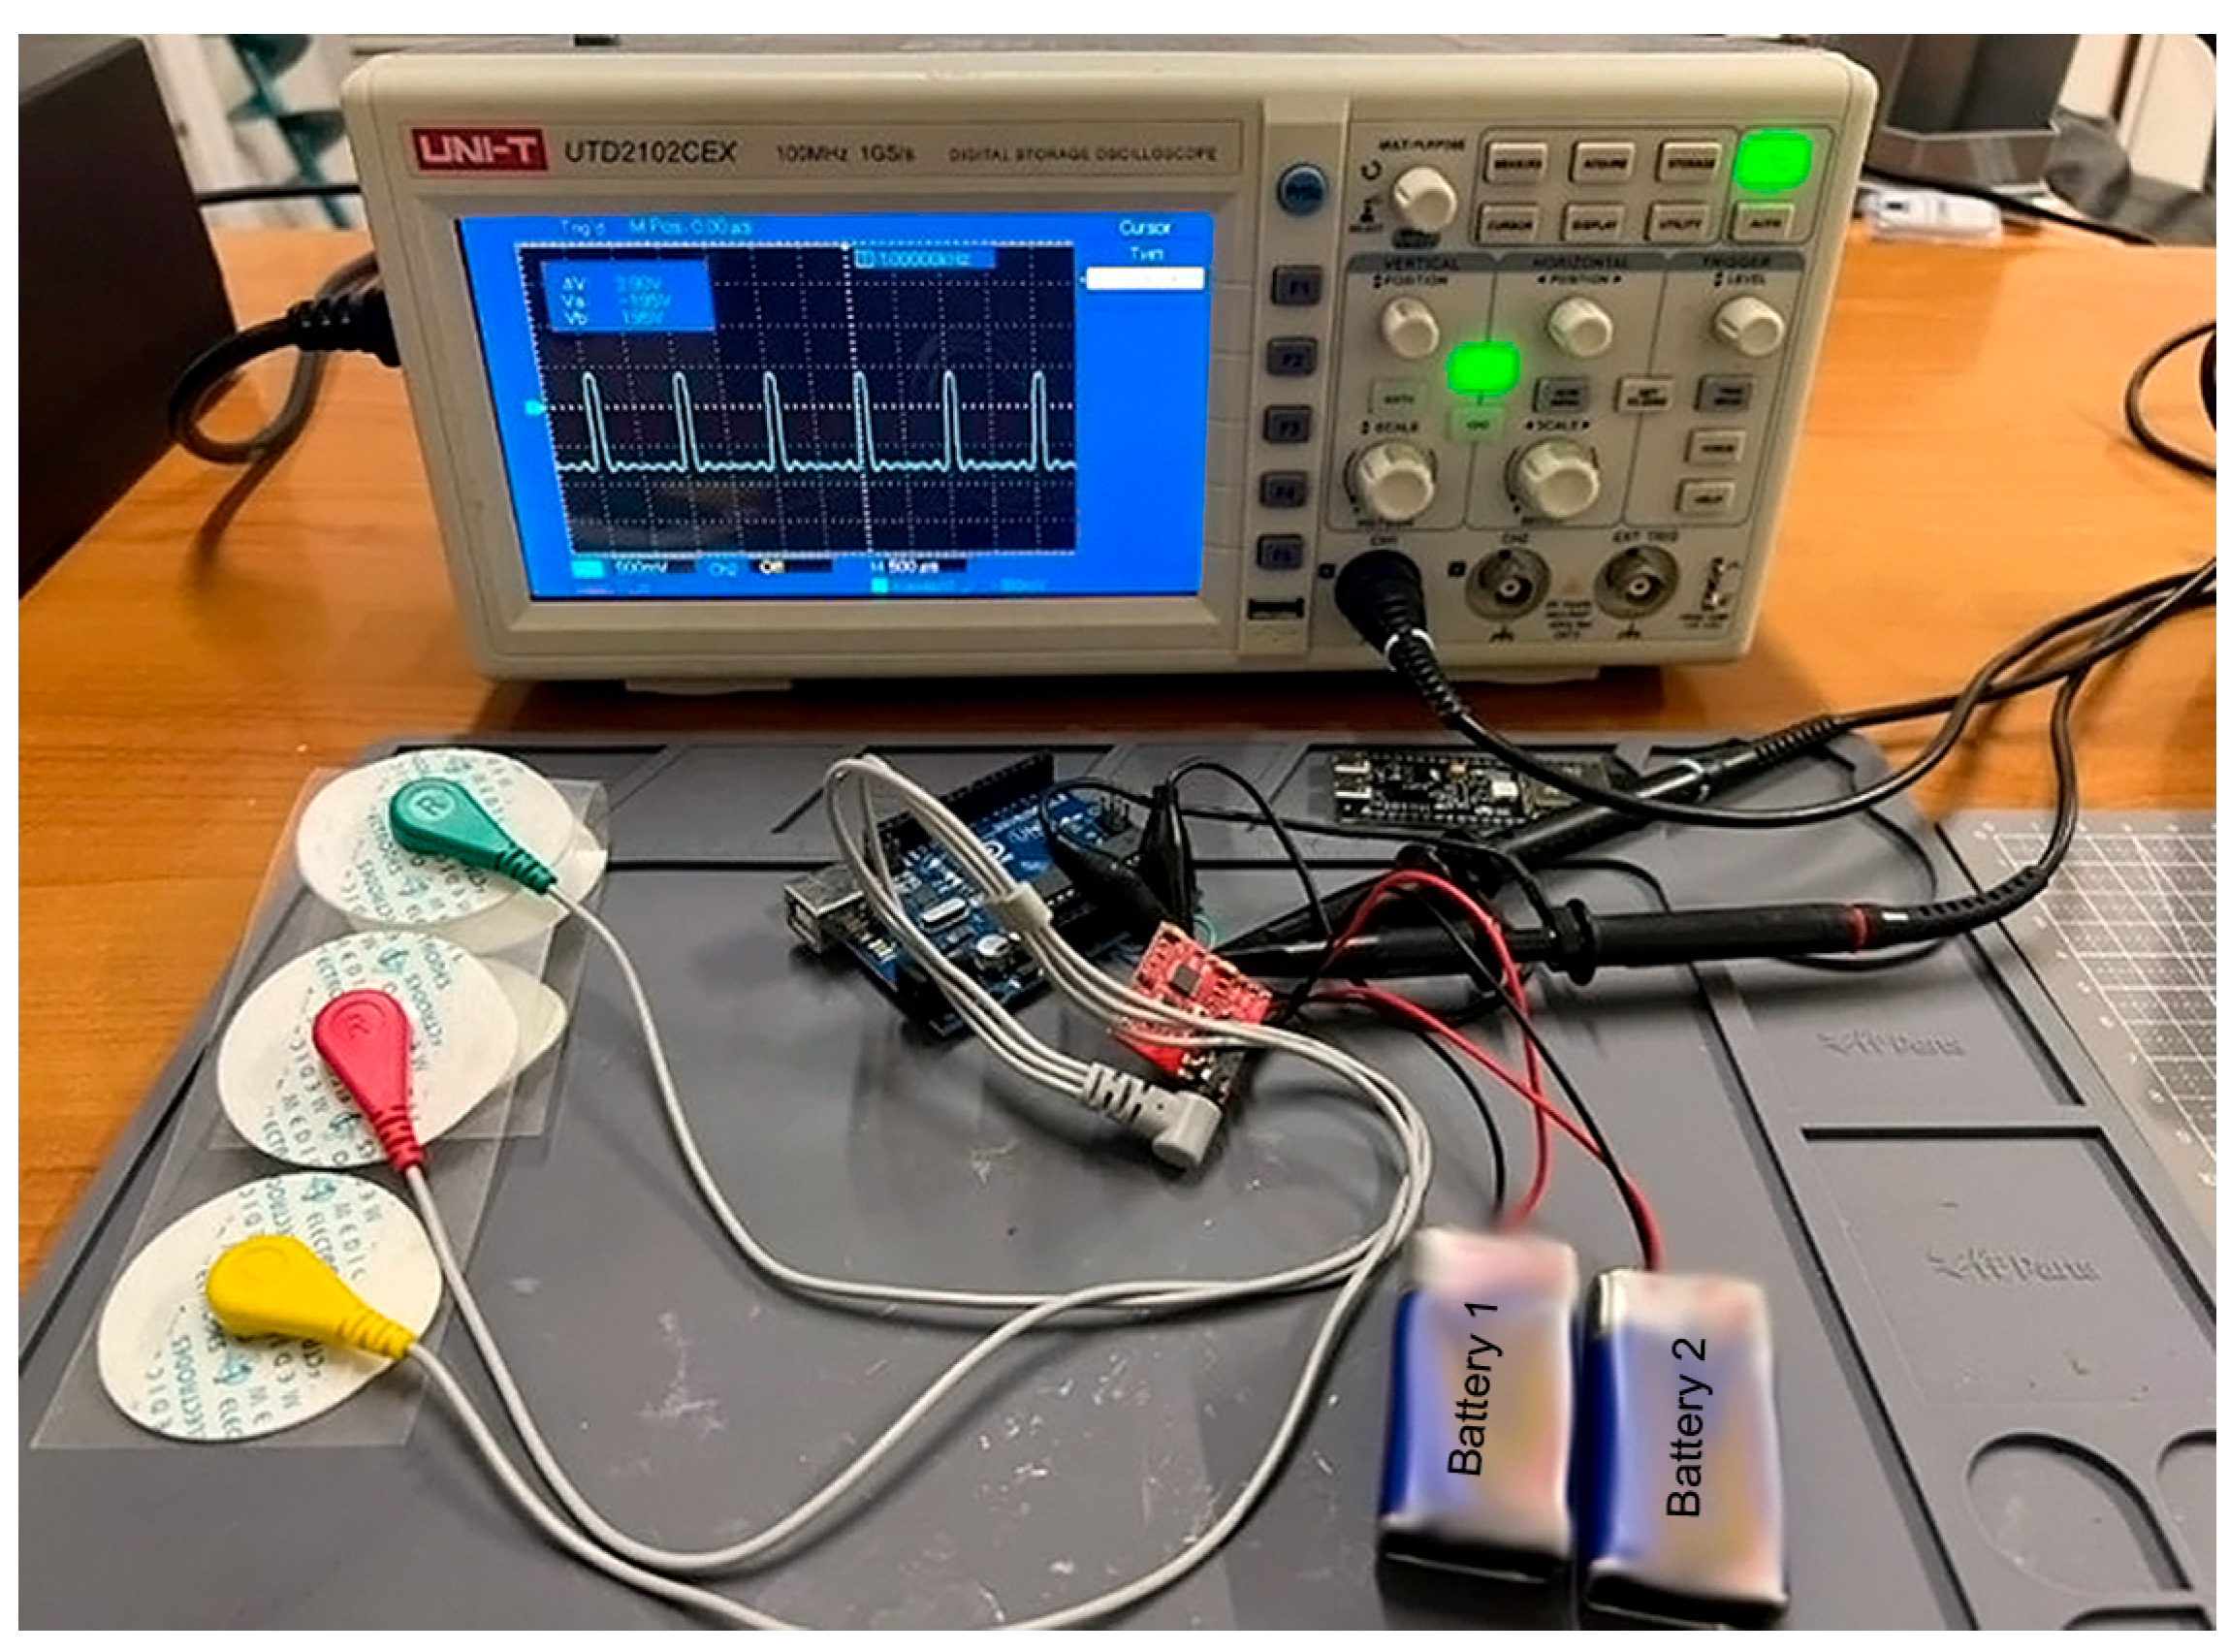
The electromyography signal was recorded using a developed distributed system equipped with specialized modules for bio-signal recording and transmission to a server for subsequent digital processing and analysis. The signal was collected from the leg muscles using electrodes coated with a solid conductive gel, the diameter of which did not exceed 1 cm to ensure a low polarization potential at the skin-electrode junction, as shown in Figure 2.
Figure 2.
Electromyography signal recording system.
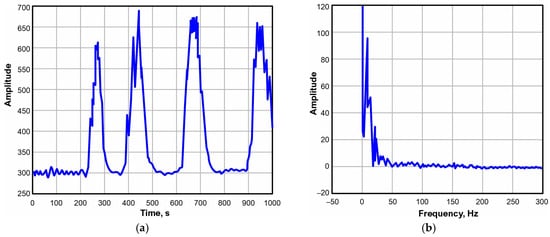
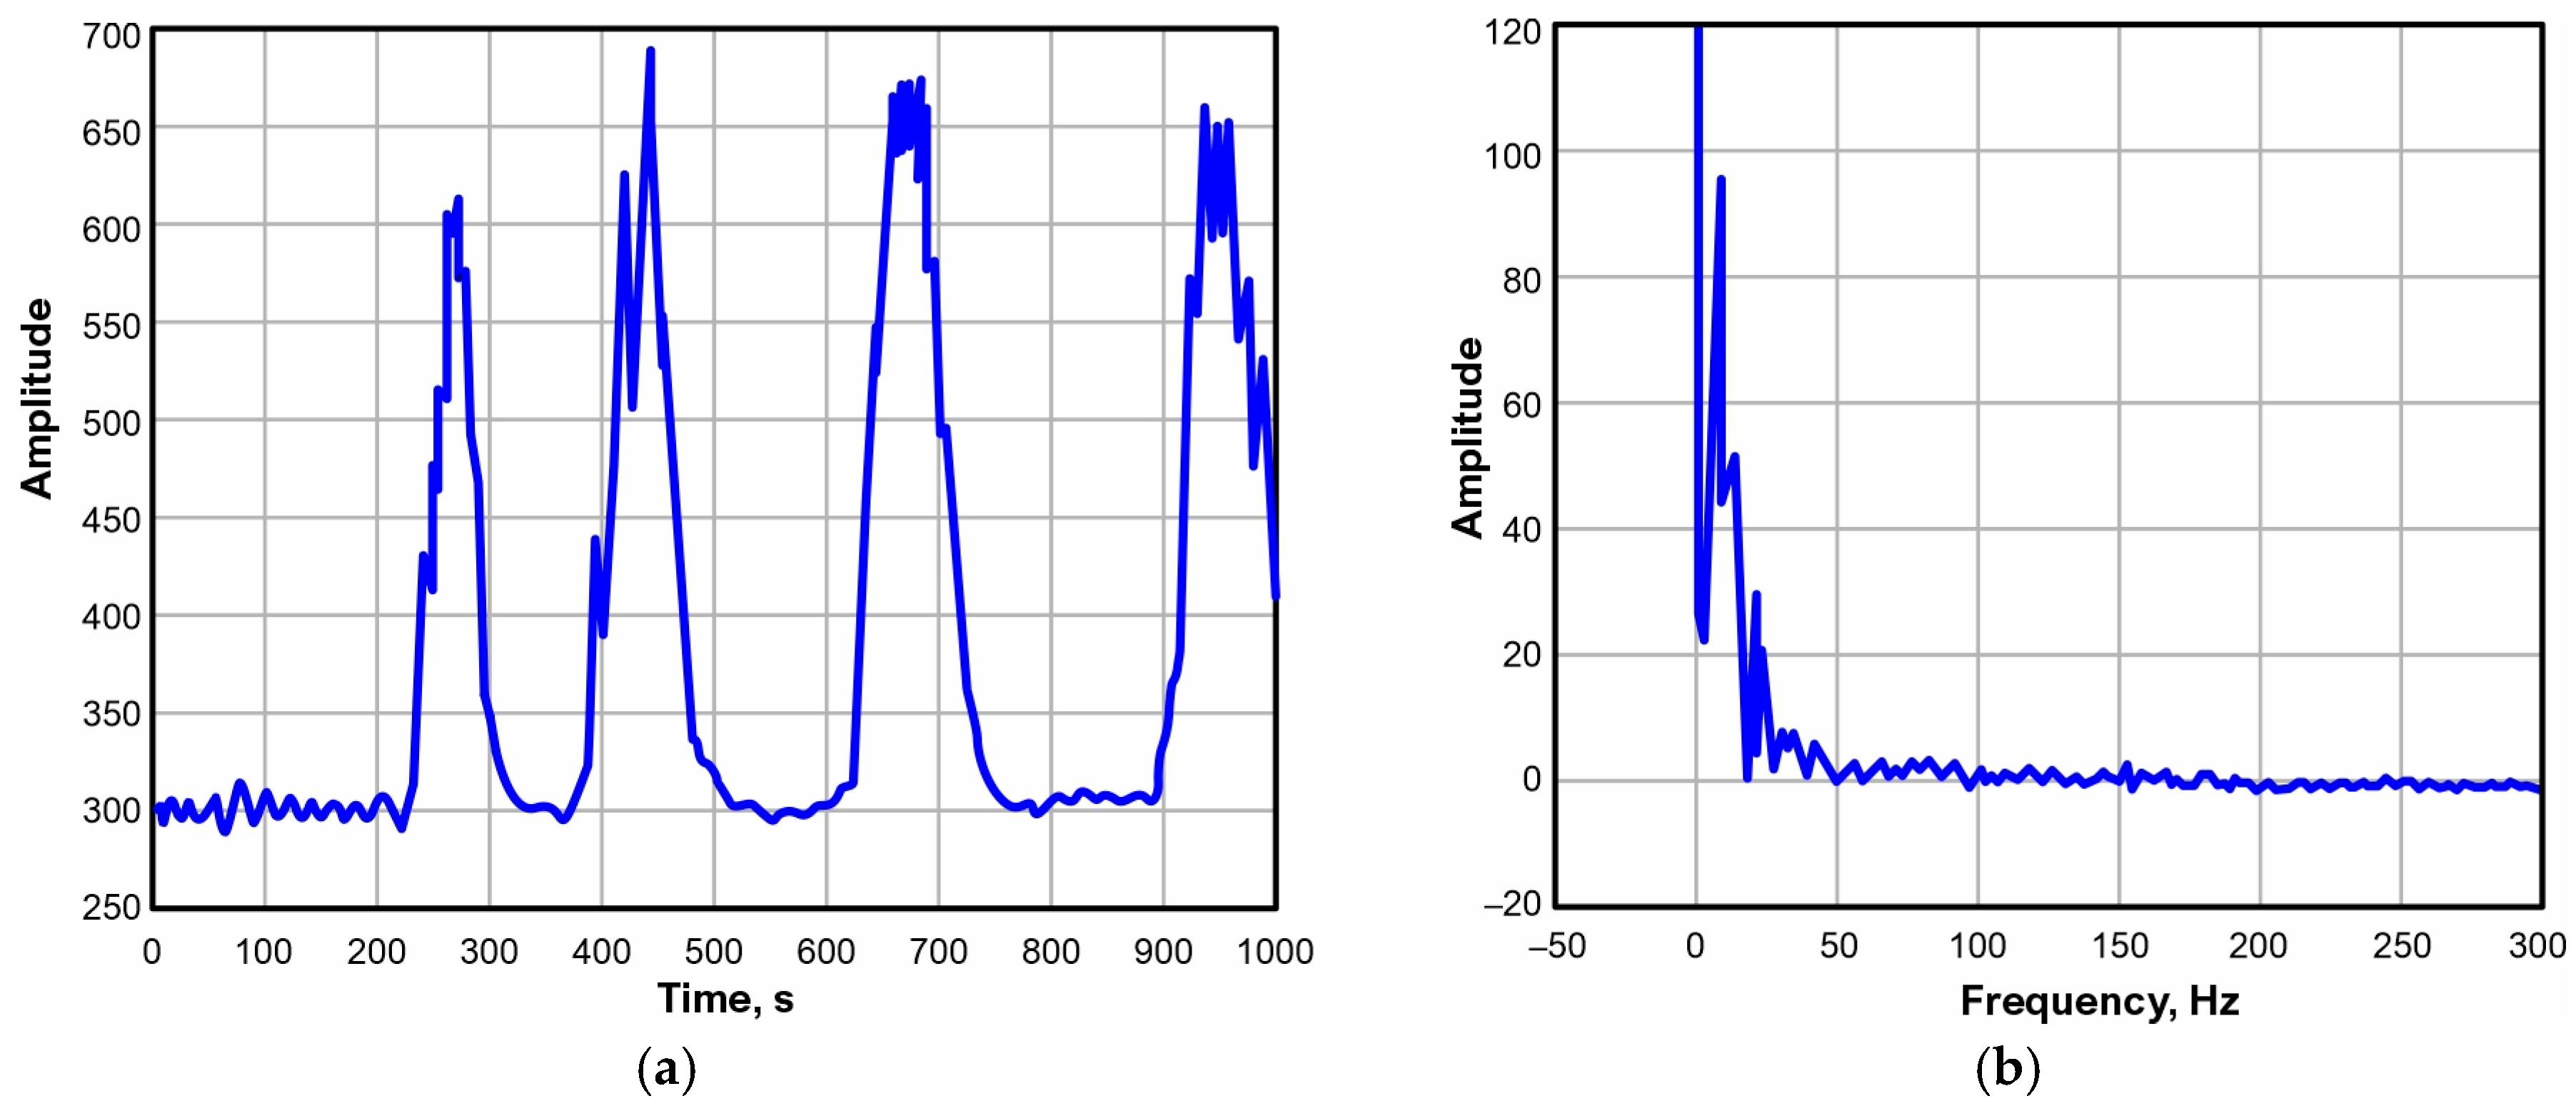
The electromyography signal from the human leg muscles was recorded on a computer, and its amplitude, time, and frequency characteristics are presented in Figure 3.
Figure 3.
Noisy electromyography signals: amplitude-temporal (a); amplitude-frequency (b).
Figure 3 shows that the electromyography signal has four muscle forces, represented by four harmonics. Each harmonic carries information about bioelectrical activity. The frequency content of the electromyography signal indicates that most of the energy in the informative component is concentrated in the 4–200 Hz range. Frequencies outside this range are considered noise and interference.
Based on the identified frequency values of this signal, a band-pass filtering system was configured at a sampling frequency of 2000 Hz, in accordance with the recommendations of the Neurological Association. Digital processing of the electromyography signal with calculated filters from first to sixth order was performed using unidirectional and bidirectional filtering. The importance of this signal processing lay in the detailed assessment of the electromyography signal-to-interference ratio, as a function of the order of the band-pass filtering system.
The selection of a band-pass filter from the first to the sixth order with the Butterworth root structure is justified based on its maximally flat and symmetrical amplitude-frequency characteristic in the interference suppression and signal transmission bands, as well as the least distortion introduced into the signal shape.
The data from electromyography signal processing with band-pass filtering from 1st to 6th order are presented in Table 1.
Table 1.
SNR indicator.
Table 1 shows that the SNR values at the output of each order of the band-pass filtering system vary, as the direct and indirect parameters of each order significantly alter the shape of the evaluated electromyography signal. Due to this characteristic, the results at the output of each order in the band-pass filtering system vary.
The calculated negative value of the SNR indicator at the output of each order of the filtering system characterizes the degree of attenuation of the interference influencing the shape of the evaluated electromyography signal. A negative value characterizes the level of noise attenuation relative to the informative signal. This is because the formula for this traditional indicator involves the power of the filtered signal relative to the power of the noise signal. The power of the noise signal is calculated by subtracting the filtered electromyography signal from the noisy signal. This approach significantly improves the evaluation and calculation of this indicator. The results show that increasing the order of the system leads to a strong distortion of the results of electromyography signal processing, which has a negative impact on the signal shape.
Among existing signal processing quality metrics, the choice of SNR was justified by its high information content and ability to characterize the performance of a band-pass filtering system under interference, noise, and artifacts of various types and structures. Therefore, the choice of this metric is considered fully justified.
Unidirectional processing is considered less effective than bidirectional filtering, since the latter’s output can provide the best evaluation result by eliminating introduced distortions. However, according to recent scientific research [13], with bi-directional signal filtering, the system order inevitably doubles. It is this characteristic that increases the depth of interference suppression and enhances the interference cutoff frequency.
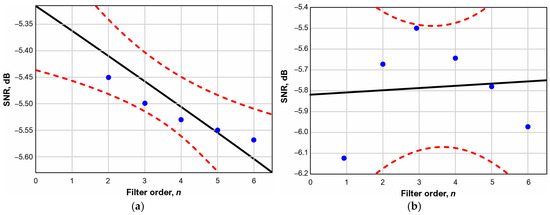
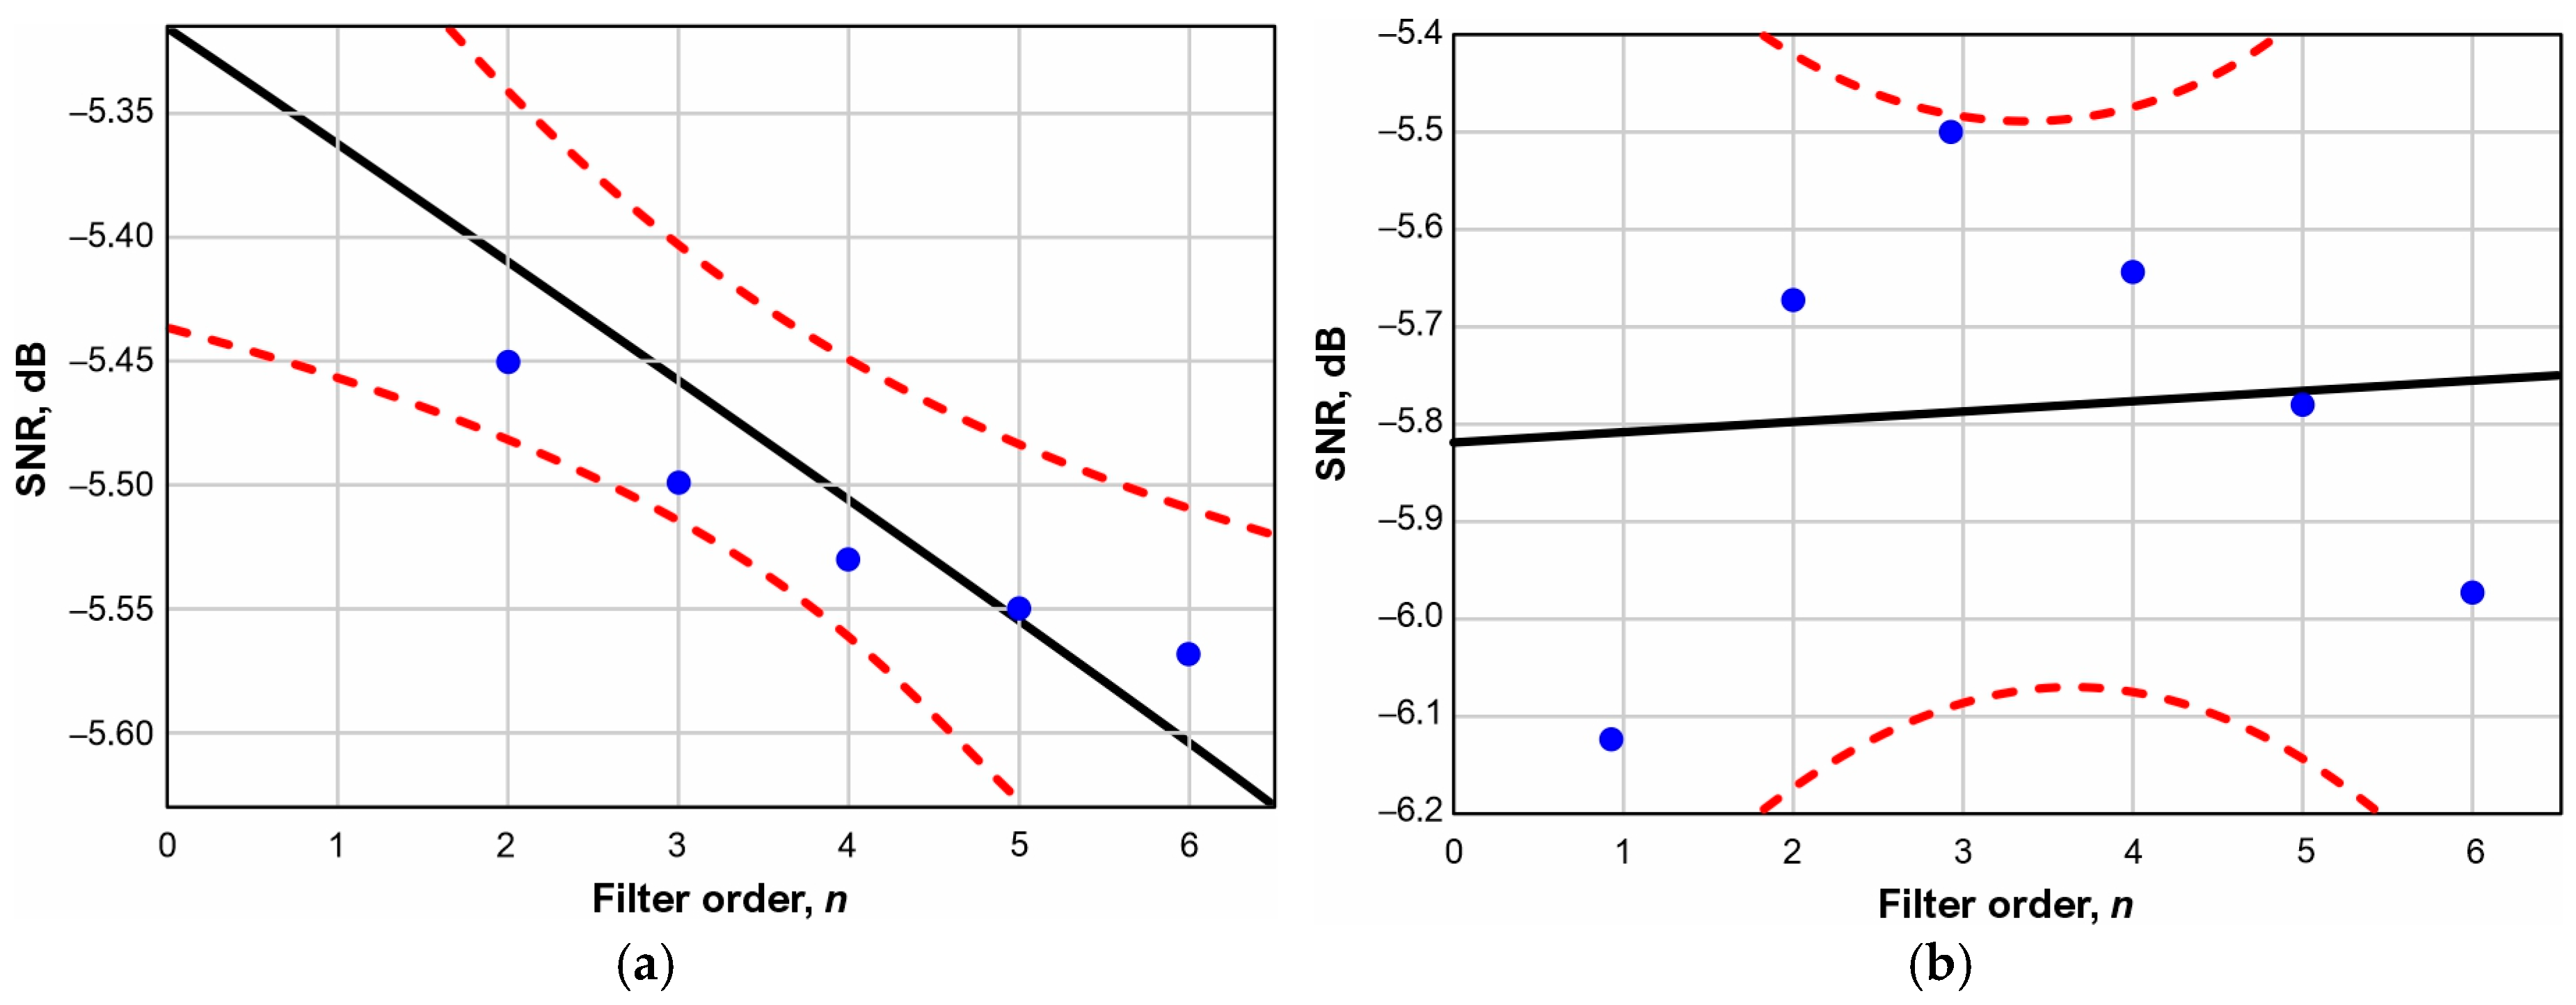
The quantitative results presented in Table 1 allow us to derive a relationship and develop a mathematical model for assessing the impact of band-pass filtering system parameters from first to sixth order. This model can further facilitate the assessment of the influence of order on the quality of electromyography signal processing. The results presented in Figure 4 fully illustrate the influence of order on the SNR.
Figure 4.
Dependence of the filtering system order on the SNR. (a): for unidirectional filtering; (b): for bidirectional filtering.
Figure 4 shows that with unidirectional processing, higher orders of the band-pass filtering system linearly reduce the SNR indicator, whereas with bidirectional filtering this dependence is nonlinear, as is typical for a filter system with a polynomial structure. A nonlinear dependence of filters with a polynomial structure during bidirectional signal processing was previously observed in [13].
The results of the regression analysis revealed the following. The influence of the order of the band-pass filtering system on the SNR indicator can also be confirmed by the Pearson correlation coefficient, which is r = −0.9059 units, which explains the significant decrease in SNR with increasing filter order at a level of p = 0.0129, the convergence of which can also be seen from the high determination coefficient R2 = 0.8206 units. Moreover, an insignificant correlation was found between the values of the bidirectional filtering indicators, with r = 0.0936 and R2 = 0.0088.
The developed regression model has the following form:
- For unidirectional processing: SNR (dB) = −0.048∙n + 5.315.
- For bidirectional processing: SNR (dB) = 0.0114∙n − 5.823.
The model presented above allows us to characterize the operation of the band-pass filtering system when processing the electromyography signal.
The scientific novelty of this study lies in the developed mathematical models, considered regression-based machine learning models, which enable us to predict the reduction in signal-to-noise ratio as the order of a bandpass filter increases. The significance and practical necessity of these models allow us to select and predict the reduction in this indicator and choose the lowest order for high-precision processing of a given signal.
8. Conclusions
In this work, measurement errors of electromyography signals caused by interference and noise are analyzed and classified. The analysis showed that the measurement errors of electromyography signals can be classified by origin and physical nature: spectral, frequency, and statistical characteristics. The developed error classification scheme will allow a systematic approach to improving or developing new filtering software tools to minimize errors and increase the accuracy of measuring electromyography signal parameters in relation to interference.
The results of electromyography signal processing with a band-pass filter are presented. The characteristics of electromyography signal processing using a band-pass filtering system and the influence of its order on signal-processing quality are studied. For the first time in electromyography signal processing, it was found that during unidirectional processing, higher orders of the band-pass filter system linearly reduce the SNR indicator. During bidirectional filtering, this dependence is nonlinear, as is typical for filter systems with a polynomial structure. Moreover, a negative but significant correlation of 0.9059 was found between the system order and the assessment. The significant, very high correlation indicates a decrease in the SNR assessment as the filtration system order increases.
Author Contributions
Conceptualization, Y.A.; methodology and formal analysis, I.S.; investigation, A.R.; writing—original draft preparation, A.R. and Y.A.; writing—review and editing, I.S. All authors have read and agreed to the published version of the manuscript.
Funding
This research received no external funding.
Institutional Review Board Statement
Not applicable.
Informed Consent Statement
Not applicable.
Data Availability Statement
The original contributions presented in this study are included in the article. Further inquiries can be directed to the corresponding authors.
Conflicts of Interest
The authors declare no conflicts of interest.
References
- Finsterer, J. Electromyography-Interference Pattern Analysis. J. Electromyogr. Kinesiol. 2001, 11, 231–246. [Google Scholar] [PubMed]
- Furui, A.; Hayashi, H.; Nakamura, G.; Chin, T.; Tsuji, T. An Artificial Electromyography Generation Model Based on Signal-Dependent Noise and Related Application to Motion Classification. PLoS ONE 2017, 12, e0180112. [Google Scholar] [CrossRef] [Scilit] [PubMed]
- Bekhtereva, N.P.; Lange, K.A. The Institute of Experimental Medicine: The Past, Present and Future. Vestn. Akad. Meditsinskikh Nauk 1990, 11, 4–11. [Google Scholar]
- Kim, J.; Kim, Y.; Lee, J.; Shin, M.; Son, D. Wearable Liquid Metal Composite with Skin-Adhesive Chitosan–Alginate–Chitosan Hydrogel for Stable Electromyogram Signal Monitoring. Polymers 2023, 15, 3692. [Google Scholar] [CrossRef] [Scilit] [PubMed]
- Petersen, E.; Sauer, J.; Graßhoff, J.; Rostalski, P. Removing Cardiac Artifacts from Single-Channel Respiratory Electromyograms. IEEE Access 2020, 8, 30905–30917. [Google Scholar] [CrossRef] [Scilit]
- Nsugbe, E.; Phillips, C.; Fraser, M.; McIntosh, J. Gesture Recognition for Transhumeral Prosthesis Control Using Electromyography and NIR. IET Cyber-Syst. Robot. 2020, 2, 122–131. [Google Scholar] [CrossRef] [Scilit]
- Malesevic, N.; Björkman, A.; Andersson, G.S.; Matran-Fernandez, A.; Citi, L.; Cipriani, C.; Antfolk, C. A Database of Multi-Channel Intramuscular Electromyogram Signals During Isometric Hand Muscles Contractions. Sci. Data 2020, 7, 10. [Google Scholar] [CrossRef] [Scilit] [PubMed]
- Fleming, A.; Stafford, N.; Huang, S.; Hu, X.; Ferris, D.P.; Huang, H.H. Myoelectric Control of Robotic Lower Limb Prostheses: A Review of Electromyography Interfaces, Control Paradigms, Challenges and Future Directions. J. Neural Eng. 2021, 18, 041004. [Google Scholar] [CrossRef] [Scilit] [PubMed]
- Leone, A.; Carluccio, A.M.; Caroppo, A.; Manni, A.; Rescio, G. A Systematic Review of Surface Electromyography in Sarcopenia: Muscles Involved, Signal Processing Techniques, Significant Features, and Artificial Intelligence Approaches. Sensors 2025, 25, 2122. [Google Scholar] [CrossRef] [Scilit] [PubMed]
- Ianculescu, M.; Constantin, V.-Ș.; Gușatu, A.-M.; Petrache, M.-C.; Mihăescu, A.-G.; Bica, O.; Alexandru, A. Enhancing Connected Health Ecosystems Through IoT-Enabled Monitoring Technologies: A Case Study of the Monit4Healthy System. Sensors 2025, 25, 2292. [Google Scholar] [CrossRef] [Scilit] [PubMed]
- Alcan, V.; Zinnuroğlu, M. Current Developments in Surface Electromyography. Turk. J. Med. Sci. 2023, 53, 1019–1031. [Google Scholar] [CrossRef] [Scilit] [PubMed]
- Landgraf, M.; Yoo, I.S.; Sessner, J.; Mooser, M.; Kaufmann, D.; Mattejat, D.; Reitelshöfer, S.; Franke, J. Gesture Recognition with Sensor Data Fusion of Two Complementary Sensing Methods. In Proceedings of the 7th IEEE International Conference on Biomedical Robotics and Biomechatronics (Biorob), Enschede, The Netherlands; IEEE: New York, NJ, USA, 2018; pp. 795–800. [Google Scholar]
- Fedorov, A.V.; Altay, Y.A.; Stepanova, K.A.; Kuzivanov, D.O. The Effect of Signal-to-noise-ratio Value on the Error in Measuring Acoustic Emission Parameters: Statistical Assessment. Sci. Tech. J. Inf. Technol. Mech. Opt. 2022, 22, 1205–1215. [Google Scholar] [CrossRef] [Scilit]

Disclaimer/Publisher’s Note: The statements, opinions and data contained in all publications are solely those of the individual author(s) and contributor(s) and not of MDPI and/or the editor(s). MDPI and/or the editor(s) disclaim responsibility for any injury to people or property resulting from any ideas, methods, instructions or products referred to in the content. |
© 2026 by the authors. Licensee MDPI, Basel, Switzerland. This article is an open access article distributed under the terms and conditions of the Creative Commons Attribution (CC BY) license.