


Abstract
This study offers a comprehensive techno-economic evaluation of the offshore wind-energy potential of a 1.190 km2 pilot zone situated in the southern region of Romania’s Exclusive Economic Zone. The MERRA-2 reanalysis dataset’s wind time series were processed for a reference location connected to the target area; the covered time period was 2005–2025. The analysis of wind speed at a height of 50 m revealed a significant seasonal variation, with maximum values exceeding 25 m per second during the winter. The performance of two separate offshore wind turbines (10 and 15 MW) was then examined; average capacity factors were found to be between 32.39 and 40.42%. These numbers were used to propose a number of offshore wind farm layouts based on the lowest/maximum recommended rotor distance; the most practical scenarios were linked to a 2.64 GW farm capacity. Both the annual electricity output and pertinent economic metrics, such as levelized cost of energy (LCOE) or development expenditure, were used to evaluate the performance of the proposed projects. The LCOE can range from a minimum of 92.68 to a maximum of 423.35 USD/MWh depending on the wind technology (fixed or floating), capital and operating expenditure, or discount rate.
1. Introduction
Wind energy has become an increasingly important component of the transition toward low-carbon electricity systems, with offshore development receiving particular attention due to the generally stronger and less obstructed wind fields available over marine areas. Offshore wind resources can contribute substantially to the diversification of electricity generation while reducing dependence on conventional energy sources. Nevertheless, the variability and intermittency of wind remain major challenges for both resource assessment and operational planning. These characteristics are particularly relevant in enclosed and semi-enclosed seas, where regional atmospheric circulation, coastal geometry, topography, air–sea interactions and seasonal variability can generate complex wind regimes. Consequently, accurate characterization and prediction of wind conditions are essential for the efficient exploitation of offshore and nearshore wind resources [1,2].
The Black Sea presents a moderate-to-high wind-energy potential, although the resource is not uniformly distributed throughout the basin. The geographical distribution of wind power density closely follows the spatial distribution of wind speed, with relatively favorable conditions in the northern and western sectors and lower values toward the southeastern part of the basin. Historical climate conditions indicate wind power densities exceeding 500 W/m2 in some northern areas, values between approximately 300 and 500 W/m2 in the northern and western Black Sea, and lower values in the southeastern sector [1]. Spatial variability is accompanied by a pronounced seasonal cycle, with winter representing the most energetic period and summer the least energetic season [2].
Long-term climate projections indicate that these regional differences are likely to remain relevant throughout the twenty-first century. Although a general reduction in wind power density is projected across much of the European domain, the Black Sea does not exhibit the same robust negative climate-change signal observed in several other European marine regions [1]. At the same time, future wind power density remains characterized by significant temporal and spatial variability, with the eastern basin showing higher variability than the western sector. The western Black Sea is associated with more stable, durable and persistent wind resources, which increases its attractiveness for future offshore wind developments [2]. This stability is particularly relevant because high mean wind speeds alone are not sufficient to ensure reliable energy production when temporal variability is significant.
Comparison with other European marine environments further highlights the particular characteristics of the Black Sea. The Mediterranean and Black Sea basins contain several distinct energetic regions, with strong spatial differences resulting from basin geometry, atmospheric circulation and local meteorological forcing. Long-term ERA5 analyses identify important wind and marine-energy resources in the western Mediterranean, Aegean Sea and selected Black Sea sectors, while the western Black Sea remains one of the most relevant areas within the basin [3]. The Mediterranean generally exhibits stronger marine-energy conditions in several regions, whereas the Black Sea displays a more pronounced contrast between its western and eastern sectors [3]. These differences emphasize the importance of developing forecasting approaches adapted to regional and local environmental conditions rather than transferring models directly between geographically and climatologically different offshore areas.
The Romanian coastal and offshore sector is located within the favorable western Black Sea region and presents considerable potential for future wind-energy development. The Romanian continental shelf extends along approximately 245 km of coastline and reaches depths of up to about 130 m [4]. ERA5 data for the period 2014–2023 reveal a pronounced seasonal behavior of the wind resource, with maximum values during winter and minimum values during summer. Estimated wind power density values between approximately 528.9 and 757.7 W/m2 indicate that several locations along the Romanian continental shelf can provide favorable conditions for wind-energy exploitation [4]. The combination of relatively energetic wind conditions, an extended continental shelf and increasing interest in offshore renewable energy strengthens the strategic importance of this region for future marine-energy development.
Accurate wind information is particularly important because the available energy resource is highly sensitive to variations in wind speed. Wind power density is proportional to the cube of wind speed, meaning that relatively small deviations in wind-speed estimates can produce substantially larger differences in the resulting energy assessment [1]. Validation of ERA5 wind forcing against multi-mission satellite observations over the Black Sea has shown a relatively small negative bias of approximately 0.14 m/s, an RMSE slightly above 1.5 m/s and a correlation coefficient of approximately 0.81 [5]. Although these results confirm the general reliability of reanalysis data for regional studies, they also demonstrate that prediction errors remain relevant when the objective is local resource characterization or operational forecasting.
The complexity of the Black Sea marine environment is further increased by the interaction between atmospheric forcing and the wave climate. The western sector generally presents the highest marine-energy levels in the basin, particularly during winter, while summer conditions are considerably less energetic [5,6]. The wave regime is strongly dependent on wind direction, intensity and duration, and long-term analyses show a close relationship between wind and wave resources [3,6]. Although wave-energy studies address a different conversion technology, they provide additional evidence of the strong temporal variability of the atmospheric forcing controlling the marine environment. Nearshore renewable-energy applications are therefore particularly dependent on accurate local environmental prediction, especially in areas where short-term fluctuations may influence resource availability, system performance and operational decisions [6,7].
However, the term favorable should be interpreted in a regional rather than a pan-European context. A quantitative comparison with mature offshore wind regions shows that the Black Sea resource remains lower than that available in the North and Baltic Sea. For nine locations within the Romanian Black Sea Exclusive Economic Zone, mean wind speeds at 100 m height range between approximately 6.84 and 7.51 m/s. At the same height, representative values reported for the North Sea range from approximately 8.5 to 11 m/s, while Baltic Sea offshore conditions are typically within approximately 8 to 9.5 m/s [8]. Consequently, the Romanian Black Sea does not reach the wind intensity characteristic of the main established offshore wind regions of northern Europe. Nevertheless, its resource remains technically relevant, particularly when evaluated together with local bathymetry, distance from the coast, seasonal stability and turbine operating characteristics. This comparison provides a more appropriate basis for describing the western Black Sea as promising, rather than implying that its wind resource is equivalent to that of the North Sea or Baltic Sea.
Despite the increasing number of studies addressing Black Sea wind climatology, offshore resource assessment, climate projections and marine-energy potential, considerably less attention has been directed toward data-driven prediction of nearshore wind conditions. Most existing investigations focus on long-term spatial distributions, seasonal variability, climate-change scenarios or technology assessment, while accurate short-term prediction remains comparatively less explored. This research gap is particularly relevant for the Romanian western Black Sea, where favorable wind resources coexist with strong seasonal variability and growing interest in future offshore-energy exploitation.
In this context, the present study investigates the deep learning-based prediction of Black Sea nearshore wind. The main objective is to evaluate the ability of a data-driven forecasting approach to reproduce temporal wind variability under the specific environmental conditions of the western Black Sea. The resulting framework is intended to contribute to more reliable local wind characterization and to support future applications related to offshore resource assessment, energy production estimation and operational planning.
2. Materials and Methods
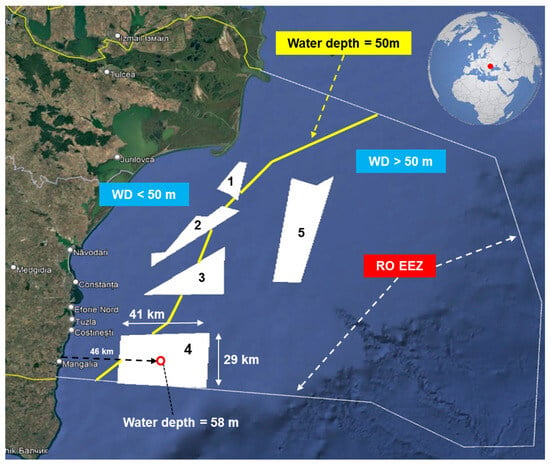
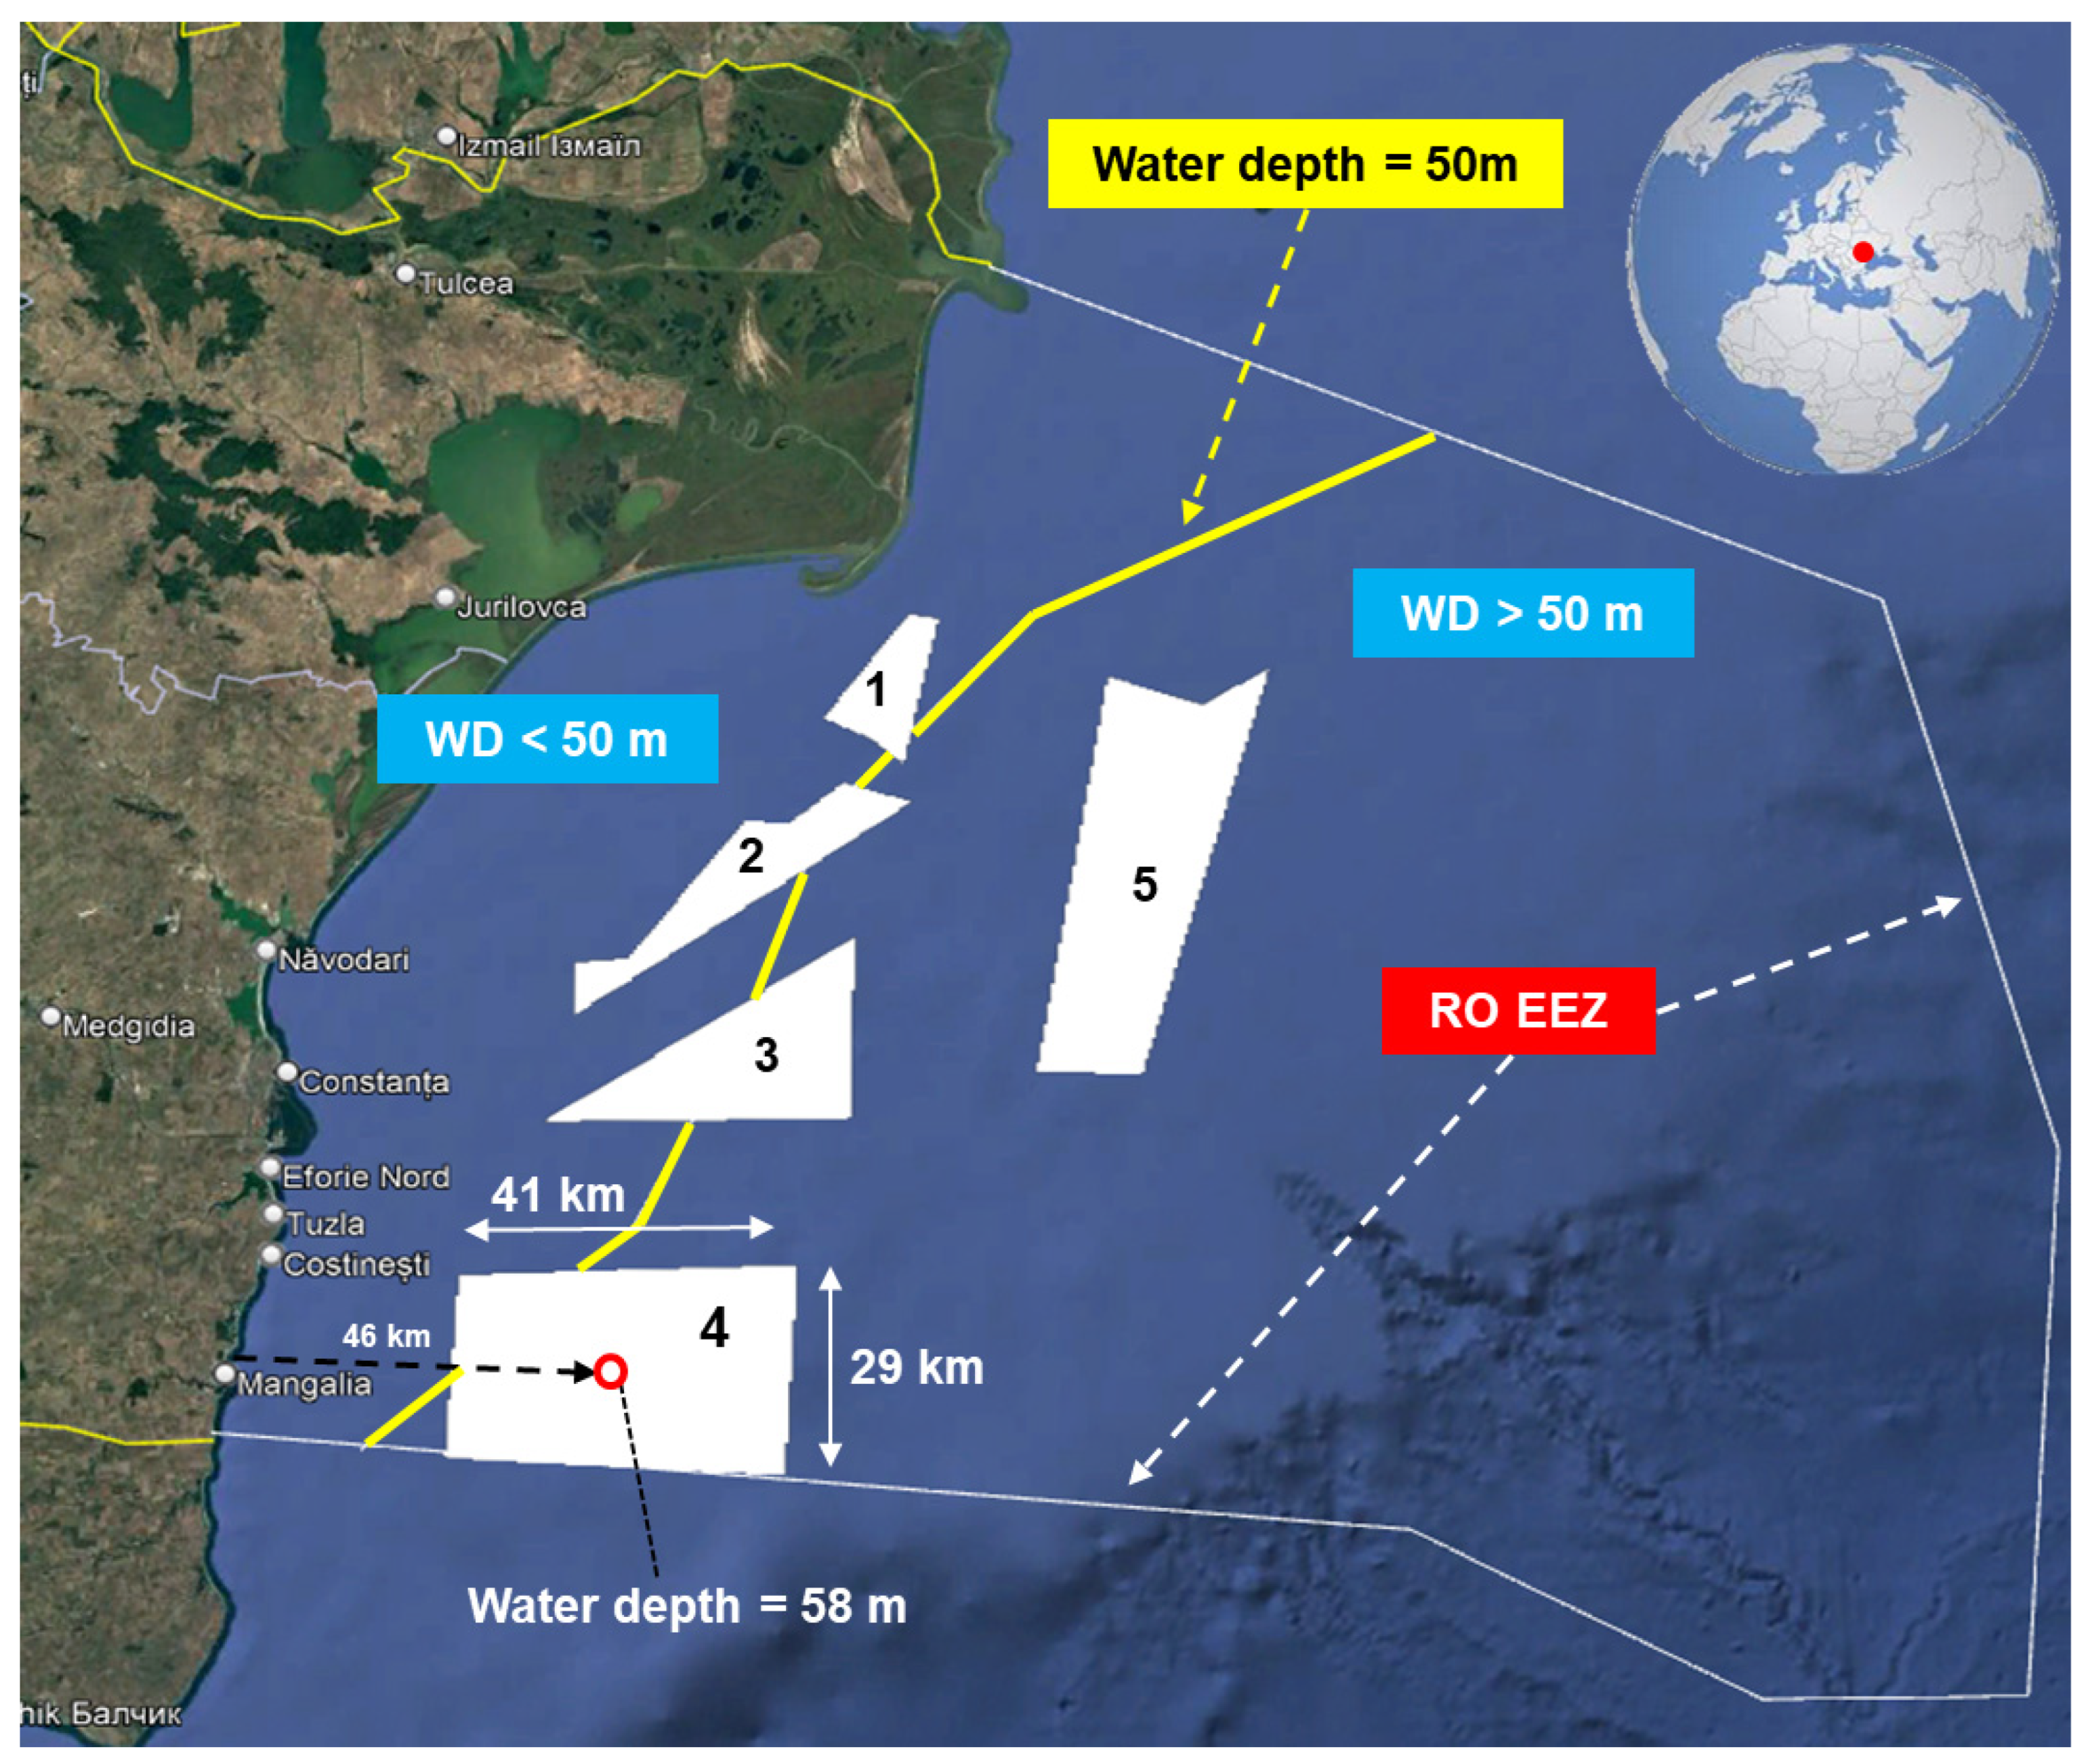
The Romanian Exclusive Economic Zone (also known as the EEZ) is shown in Figure 1, along with the boundary between water depths of (a) less than 50 m and (b) greater than 50 m. This value is generally used to choose the wind foundation; lower values are appropriate for fixed foundations, while floating platforms are thought to be more suitable for water depths greater than 50 m [9]. In the study of Onea and Rusu [10], the sea depth was determined by taking into account different reference lines that were equally spaced from the south to north. According to these results, the northern part is defined by a much lower sea depth of 30 m for the range of 0–20 km from the shore, whereas the Mangalia site (southern area, pilot zone 4) has a sea depth of around 50 m.
Figure 1.
Map of the Romanian EEZ and the sectors considered for the implementation of marine wind farm projects. Information processed from Google Earth, 2026 and [11].
The sites from the central and southern regions are linked to a maximum sea depth of 80 m at a distance of 80 km from the coast. It is important to note at this point that the Romanian EEZ’s offshore boundary is defined by a maximum distance of 220 km (south). The north and south extremities of the coastline present more constant wind resources (average of 6.6 m/s), according to the same paper [10], which conducted a geographical analysis of the wind conditions (U80 parameter). The wind conditions begin to stabilize around 7.2 m/s (80 km from the shore) as we go farther away from the coast (80 km from the shore). Based on an existing literature assessment [11], several pilot zones for the development of marine wind farms were recommended. For the current study, pilot zone number four was picked for further examination since it is located in a region with more constant wind resources (relative to the Romania EEZ). Furthermore, its rectangular design (41 km × 29 km) facilitates the development of numerous wind farm layout possibilities. The MERRA-2 reanalysis dataset, which is publicly accessible, is linked to the wind speed taken into account in this work [12]. The time series of several meteorological characteristics (such as temperature and wind speed) that are available globally can be accessed through a graphical interface. The accessible parameters are being averaged over a 0.5 × 0.625° MERRA-2 global grid of historical data that is located behind this interface. Geostationary satellite images are used to get the single-level cloud motion vector winds, which are available at elevations of 10 and 50 m above sea level [13].
As with every reanalysis dataset, the MERRA-2 reanalysis surface wind has certain limitations, including coarse spatial resolution, larger total errors when compared to alternative reanalyses, and the underestimation of ocean surface winds. More than 0.5° × 0.625° in spatial resolution does not capture near-shore wind variability, resulting in a point-specific rather than area-wide feature [14,15].
The work of Victoria et al. [16] discussed the evolution of wind conditions from the northern part of the Romanian coastal area, by taking into account the wind variation from land to the offshore area. Among the considered datasets was also the wind speed (U10) from the MERRA-2 dataset, covering the interval from January 2001 to December 2020. When the MERRA-2 data were compared to in situ observations from the Sulina station (north of Romania EEZ), it was discovered that the average values for the interval 4–10 m/s were significantly lower, while the remaining wind classes showed fair agreement with measurements. The MERRA-2 underestimates the actual wind conditions when we consider extreme wind values, particularly for the higher wind classes (17–25 m/s). A reanalysis model, in which the data are averaged over a standard computing grid, might be expected to produce this discrepancy.
Only the wind speed at 50 m of height (or U50) was taken into account for the Romanian EEZ. The corresponding time series was retrieved directly for the center of sector 4 (Latitude: = 43.82°; Longitude: 29.18°), taking into account the 21-year period from January 2005 to December 2025 (24 values per day). However, the goal of this work is to assess the performance of a number of cutting-edge offshore wind turbines that operate at hub heights greater than 100 m. Because of this, the initial wind speed (U50) must be changed to the operating height. This can be done simply using a logarithmic law, as shown below [10]:
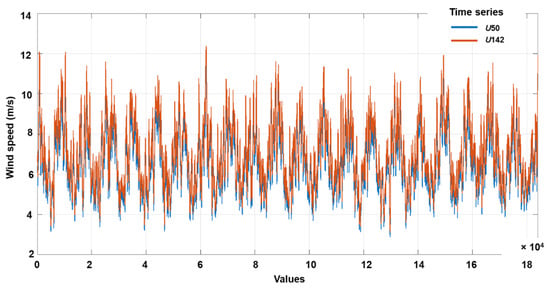
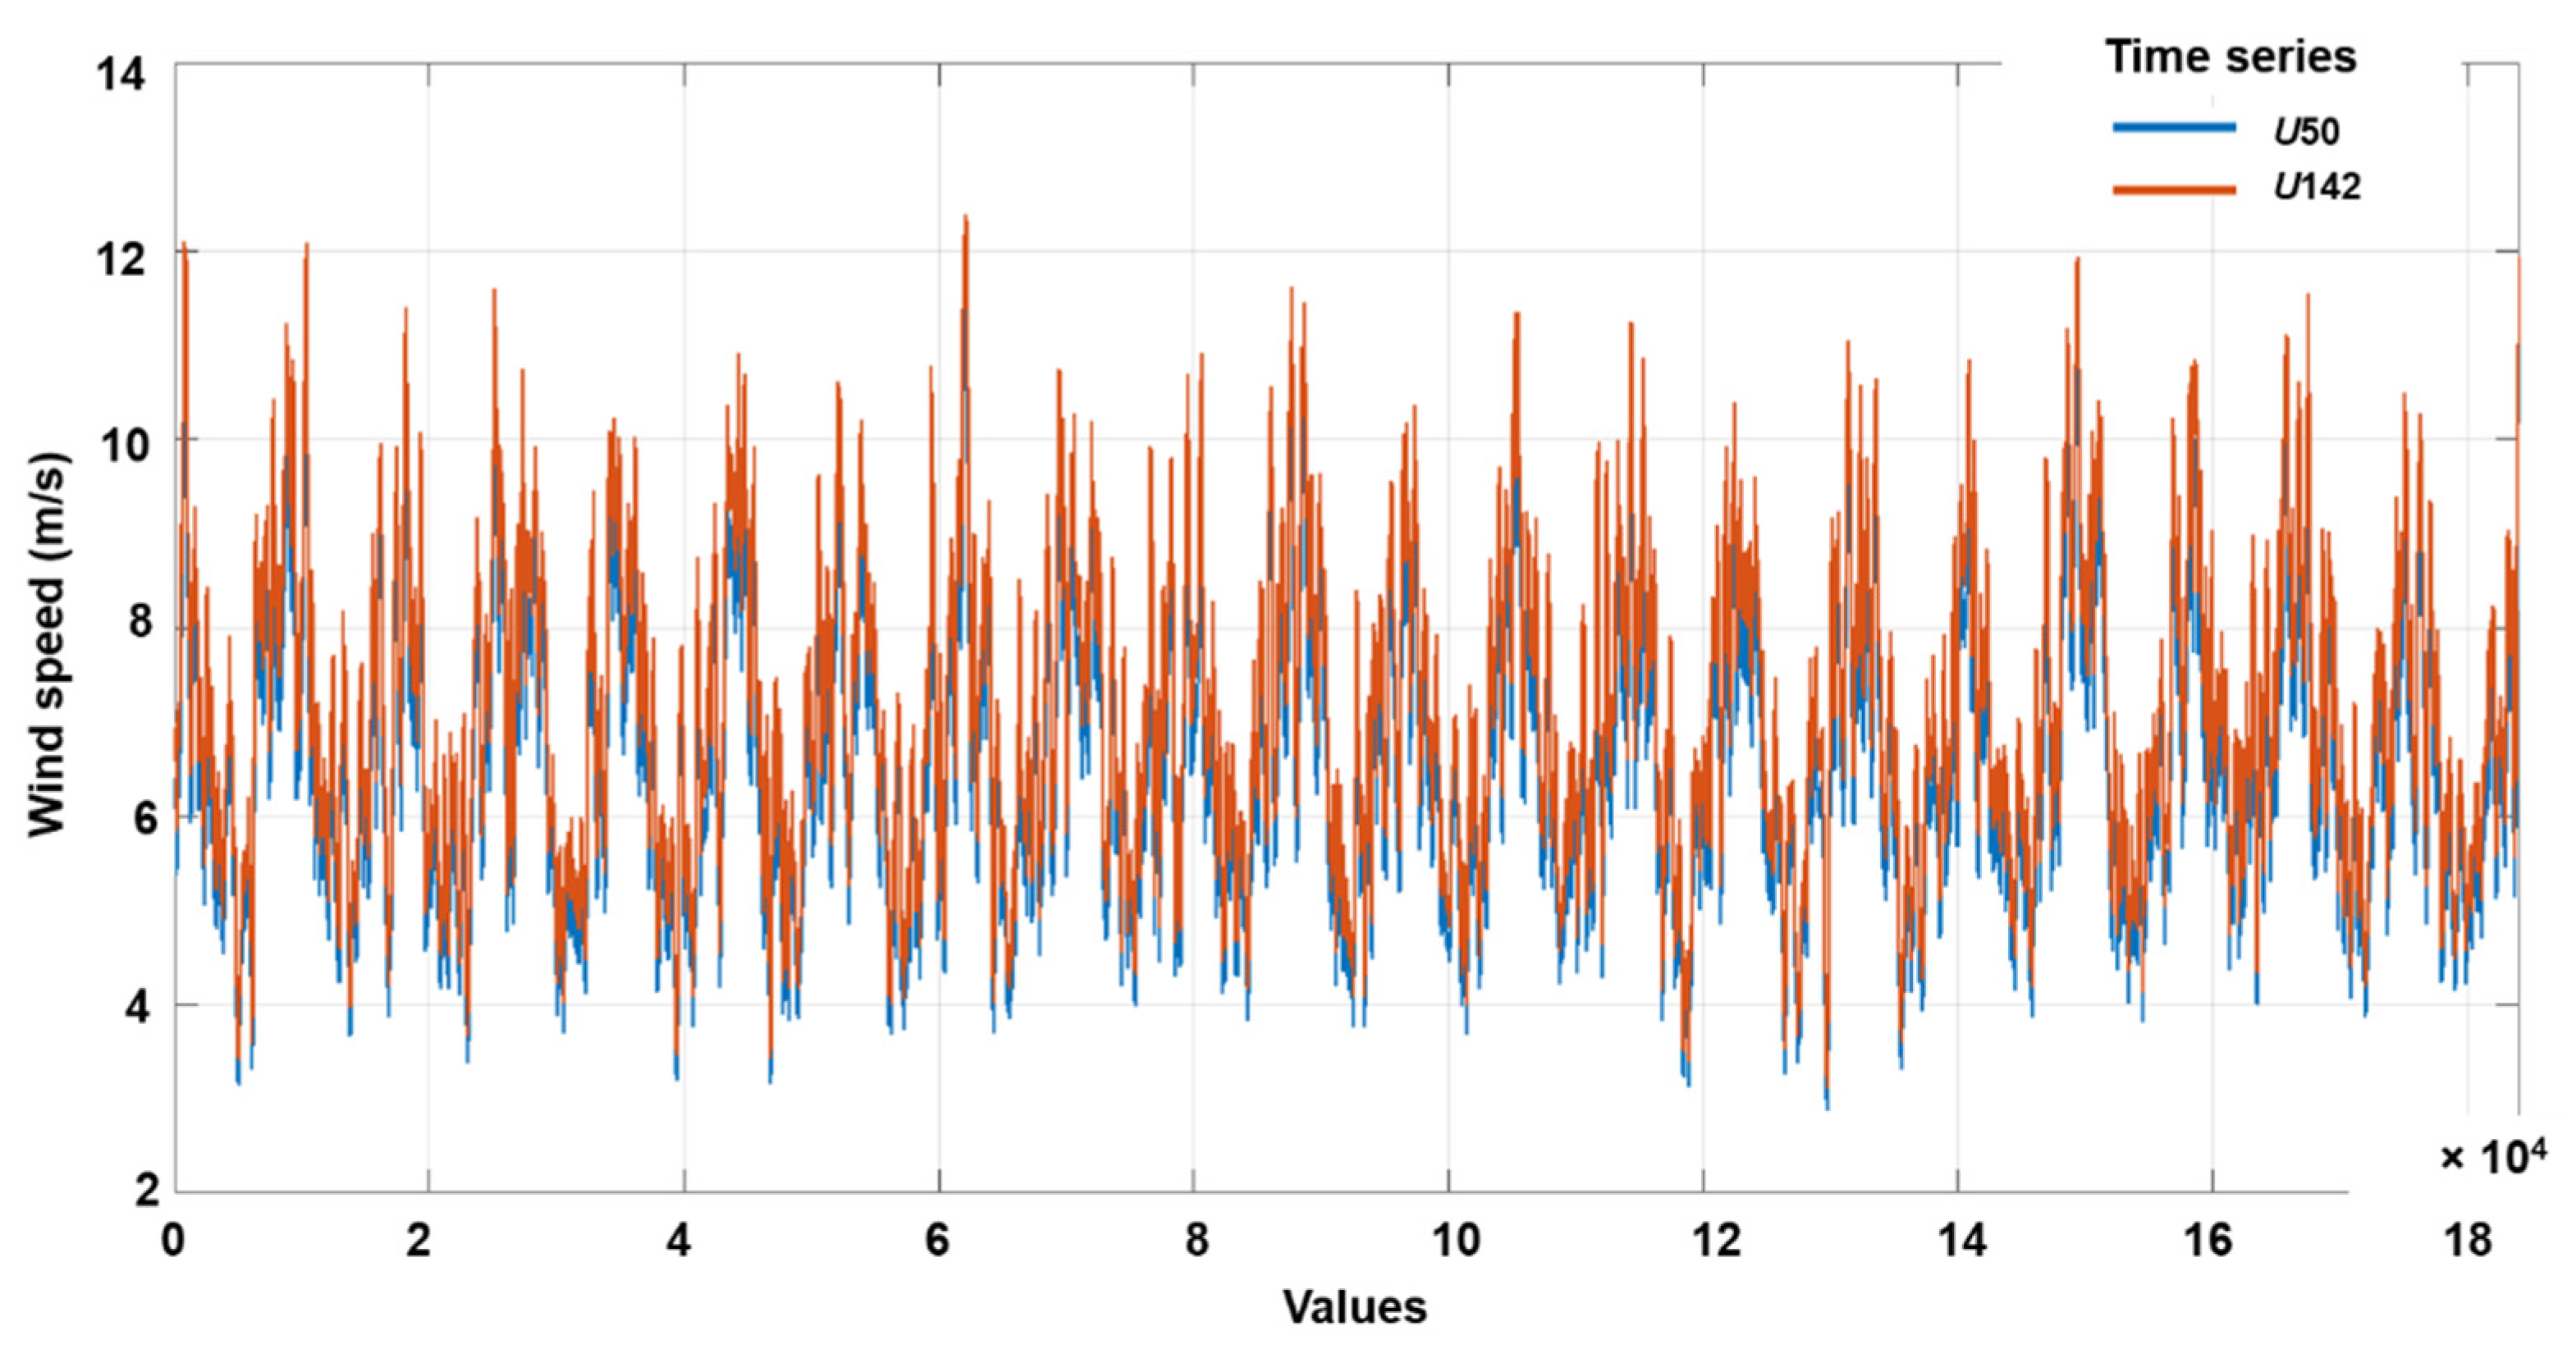
where Uturbine represents the wind speed at the hub height; U50 the initial MERRA-2 wind speed; z0— the roughness factor of the calm sea surface (0.0002 m); hturbine—the height of the wind turbine; h50—the reference height of the MERRA-2 raw data. A distribution of the U50 time series (raw data) and the adjusted U142 values, which will be used to evaluate the performance of a specific offshore wind turbine, are shown in Figure 2.
Figure 2.
Time series of the U50 and U142 wind conditions indicated for the center of the sector 4 (Romanian, EEZ). A moving average filter of 300 time steps was applied.
Both time series show the distribution of summer values (gaps in time series) and winter values (peaks) that can reach up to 12 m/s, and we can see that there are no missing data. The differences between the datasets under consideration can be highlighted by using a moving-average filter.
Two representative offshore wind turbines were considered in this study, reflecting current technological developments in the industry. Their technical characteristics are presented in Table 1.
Table 1.
Technical specifications of the wind turbines.
The Vestas V164-10.0 MW turbine is widely used in offshore applications, while the V236-15.0 MW model represents the latest generation of large-scale turbines. Larger rotor diameters and higher-rated capacities contribute to increased energy capture and improved efficiency.
3. Results
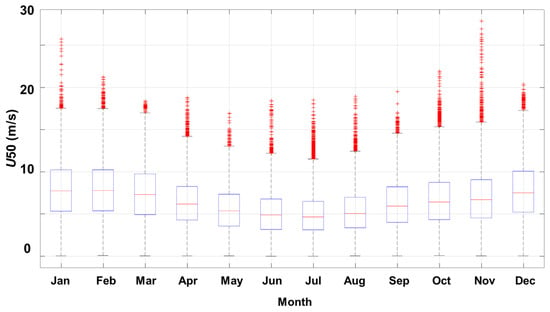
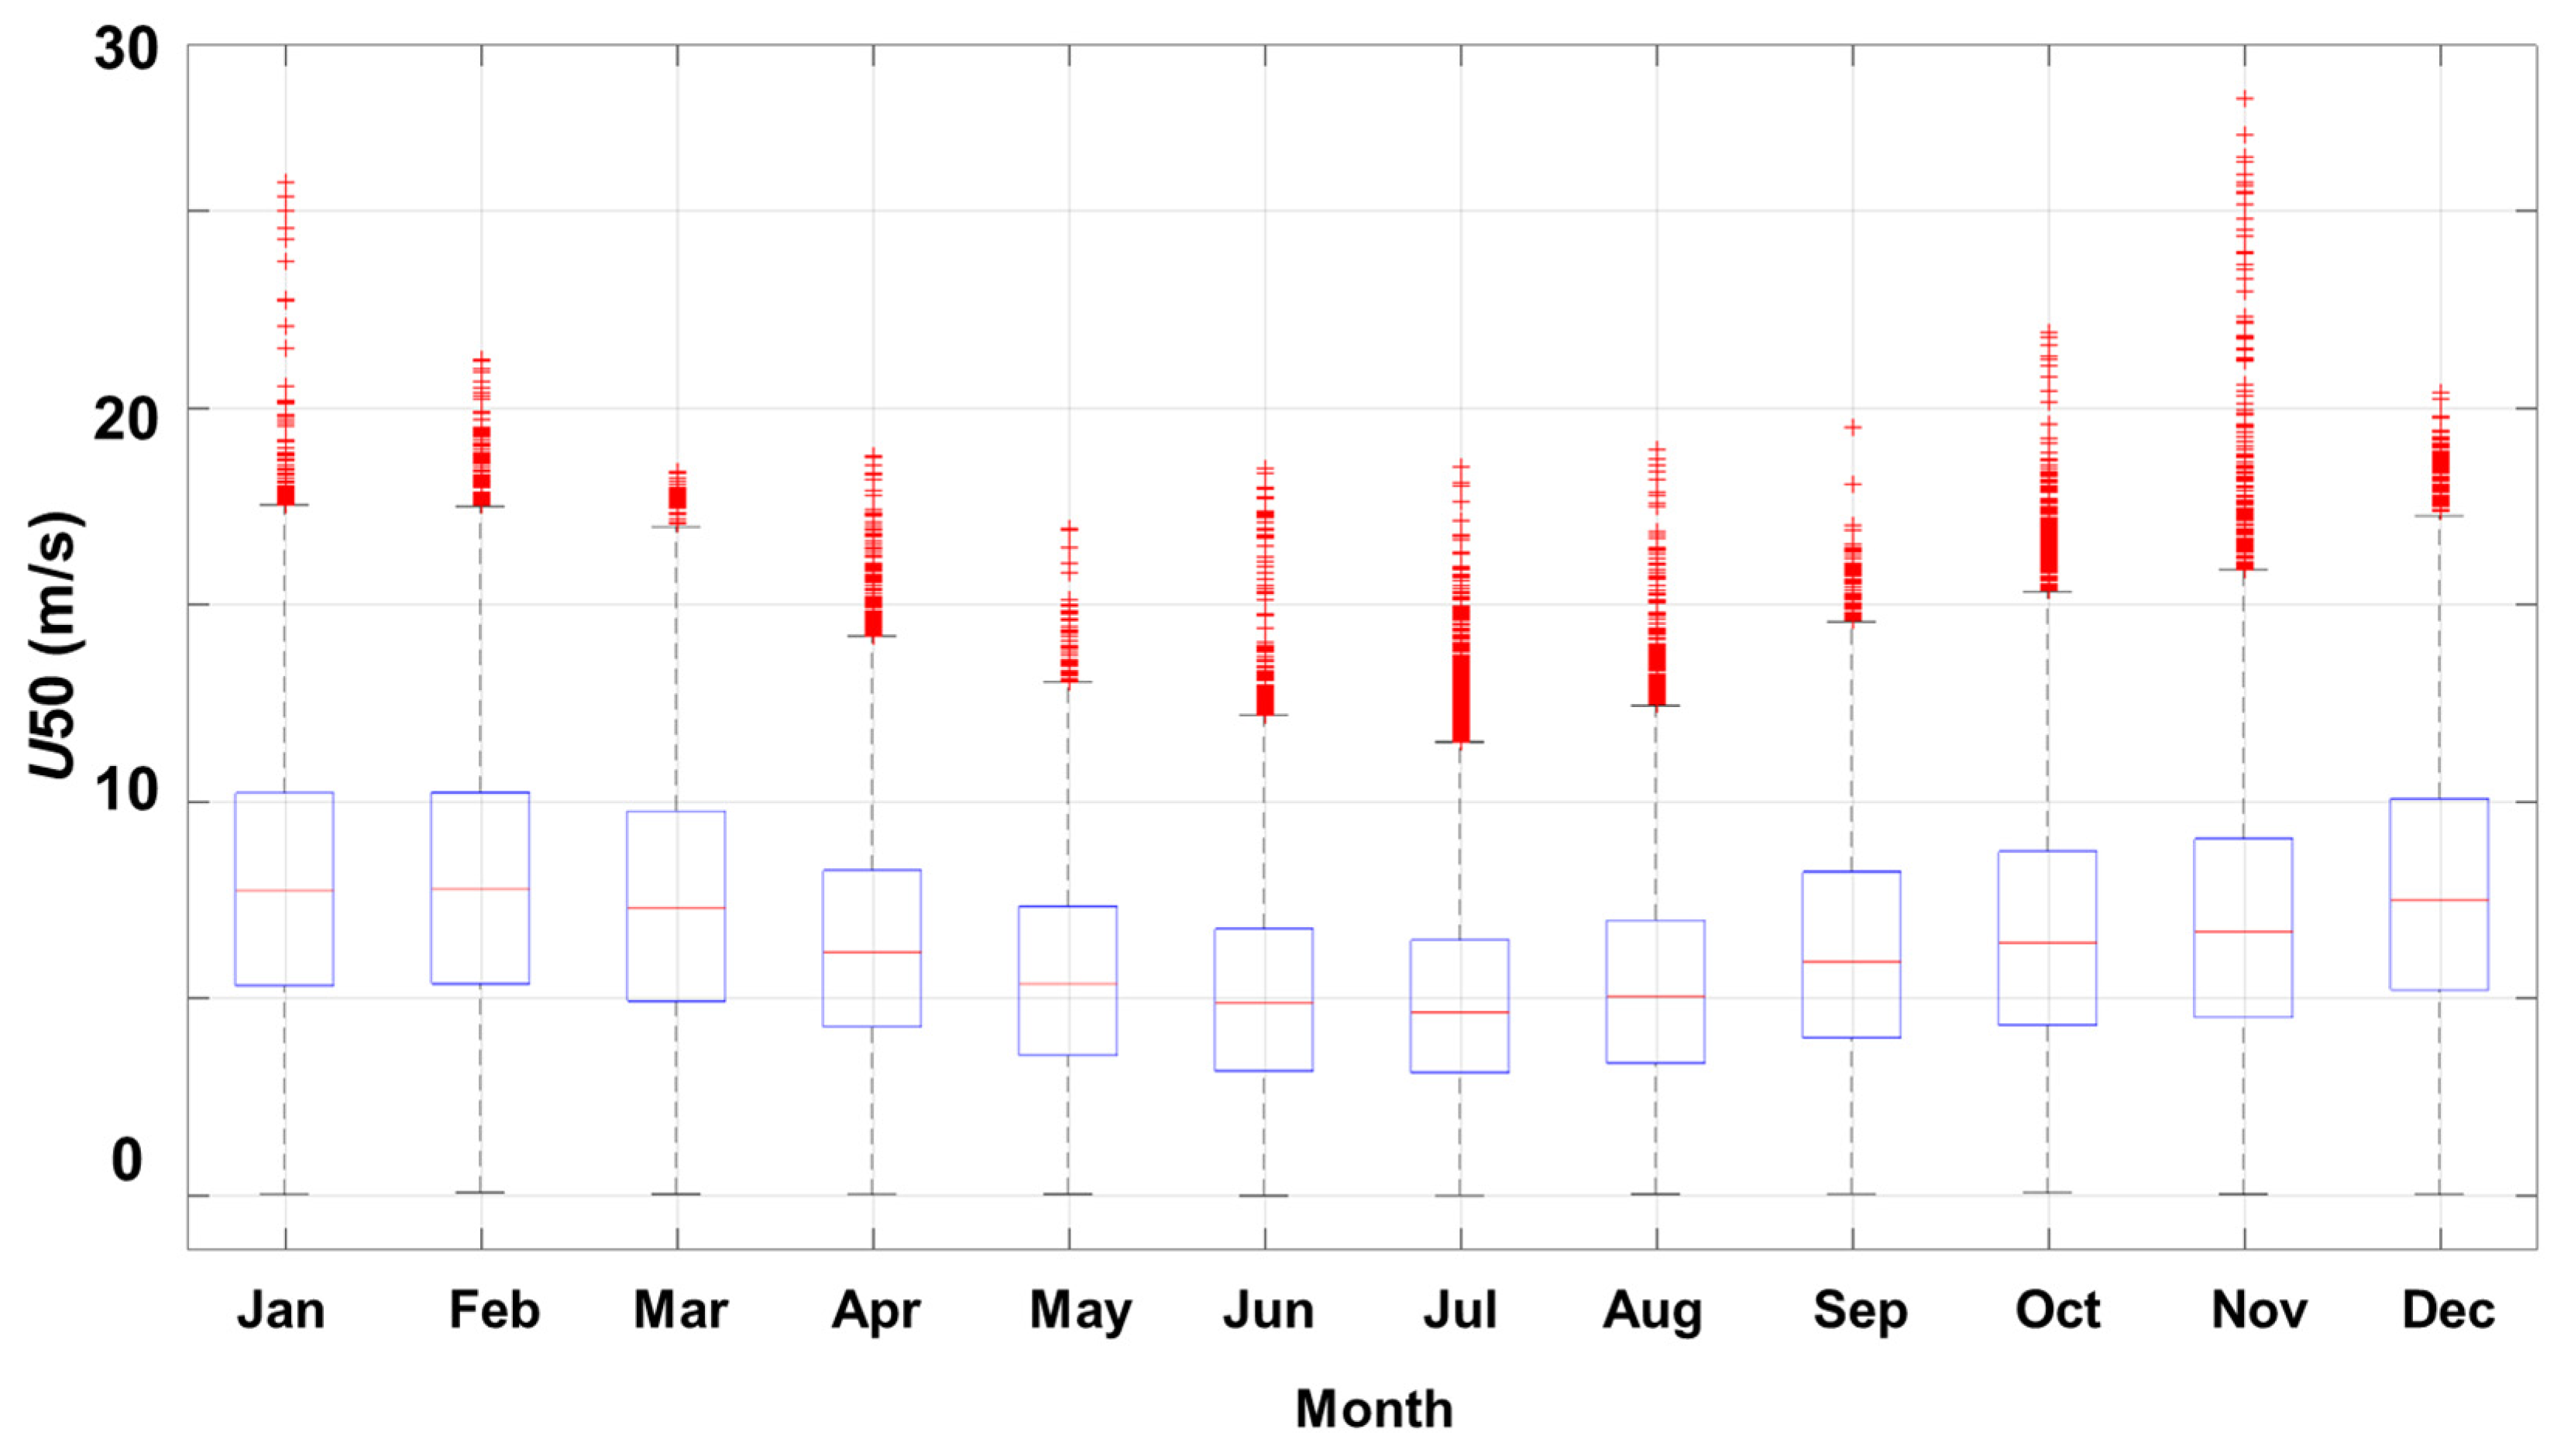
The wind resource assessment is based on long-term reanalysis datasets, including MERRA-2, which have been widely used in offshore wind studies [20,21]. The analysis focuses on the U50 parameter, representing wind speed at 50 m of height. The temporal variability of wind speed is illustrated in Figure 3.
Figure 3.
Monthly boxplot distribution of the U50 parameter associated with the center of the pilot zone 4. Results are based on the MERRA-2 dataset covering the time interval of 2005–2025.
The results indicate a seasonal pattern, with higher wind speeds during winter months, consistent with previous findings in the Black Sea region [22]. The statistical distribution of wind speeds supports the feasibility of offshore wind development, with mean values suitable for large-scale energy production.
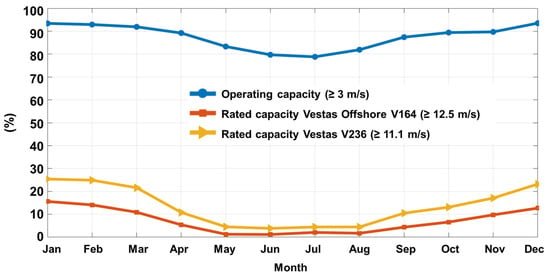
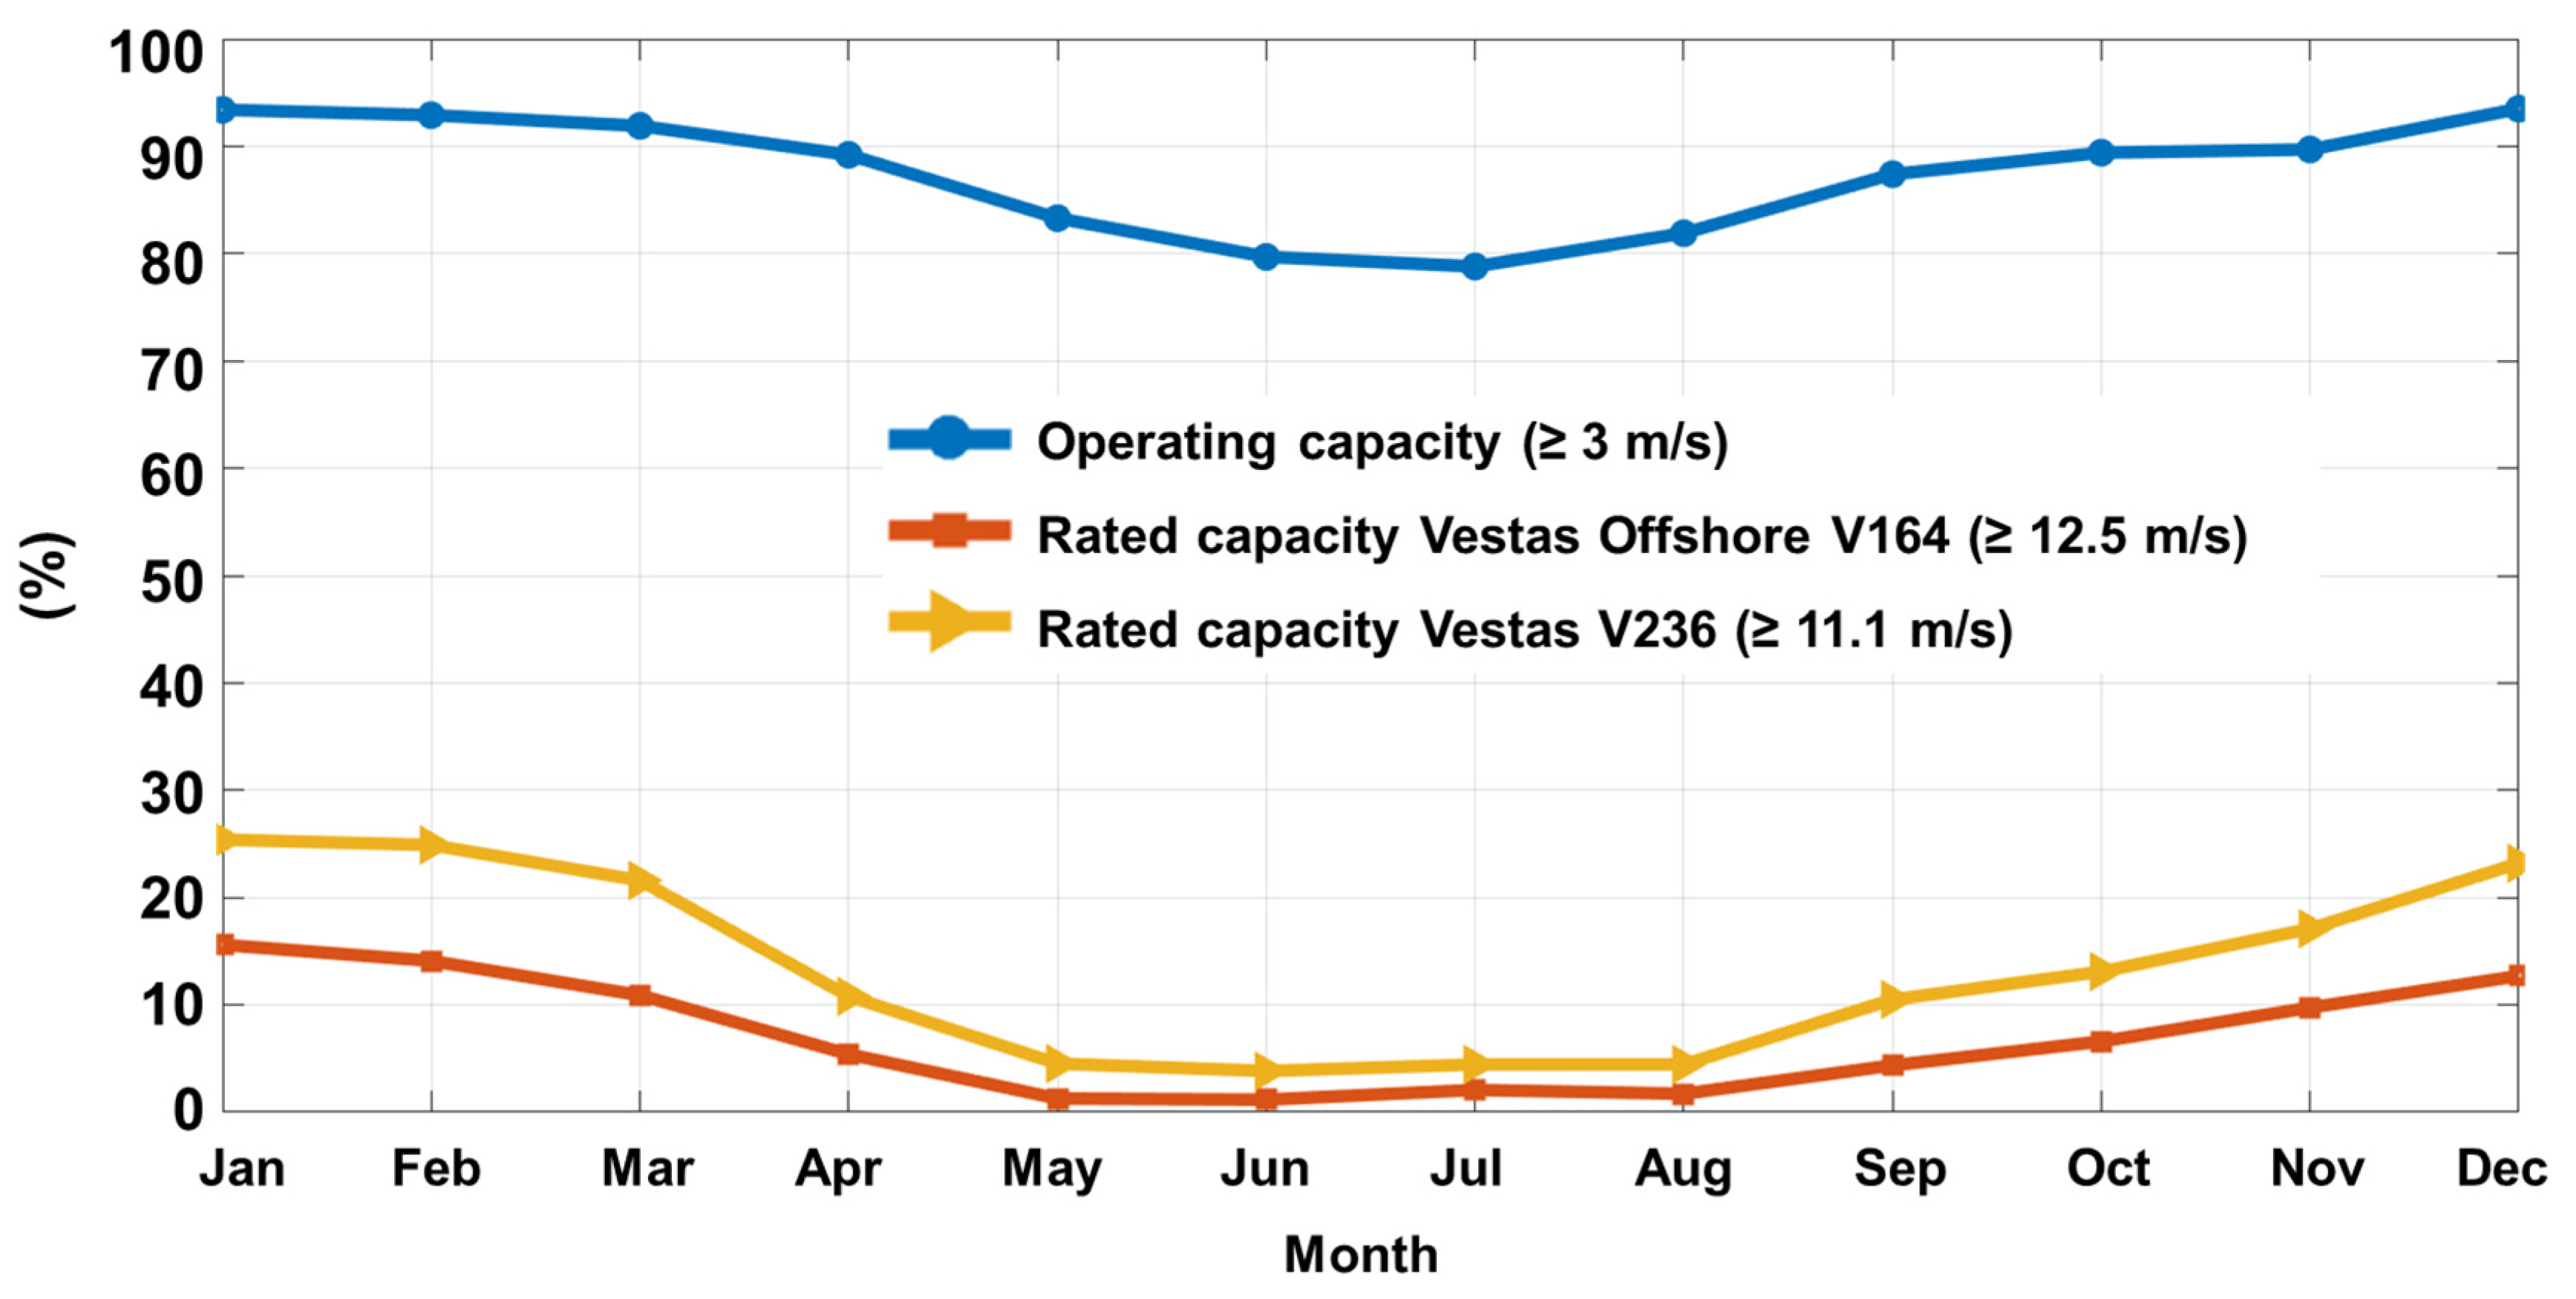
Figure 4 highlights the rated and operating capacity factors of the selected wind turbines (10 and 15 MW). The operational capacity of both turbines has a similar trend, falling between 78.8 and 93.4%. The rated capacity is more significant to turbine performance, as it defines the interval during which a wind turbine will operate at full capacity. The Vestas V236 (15 MW) system is characterized by much higher values, which are particularly noticeable during the winter when a peak of 25.4% is projected. During the summer, peak values of 1.17 and 4.45% are indicated for the 10 and 15 MW wind turbines.
Figure 4.
Operating and rated capacity of the Vestas Offshore V164-10.0 MW and Vestas V236-15.0 MW expected for the pilot zone 4, according to the MERRA-2 dataset (2005–2025).
A method for evaluating a specific wind turbine’s performance is its capacity factor, which is defined as [10]:
where Pturbine is the power output over a given time period; Prated is the maximum possible power output expected from a wind turbine (e.g., Vestas Offshore V164 = 10 MW).
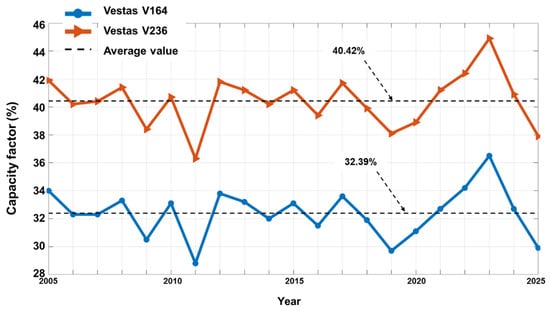
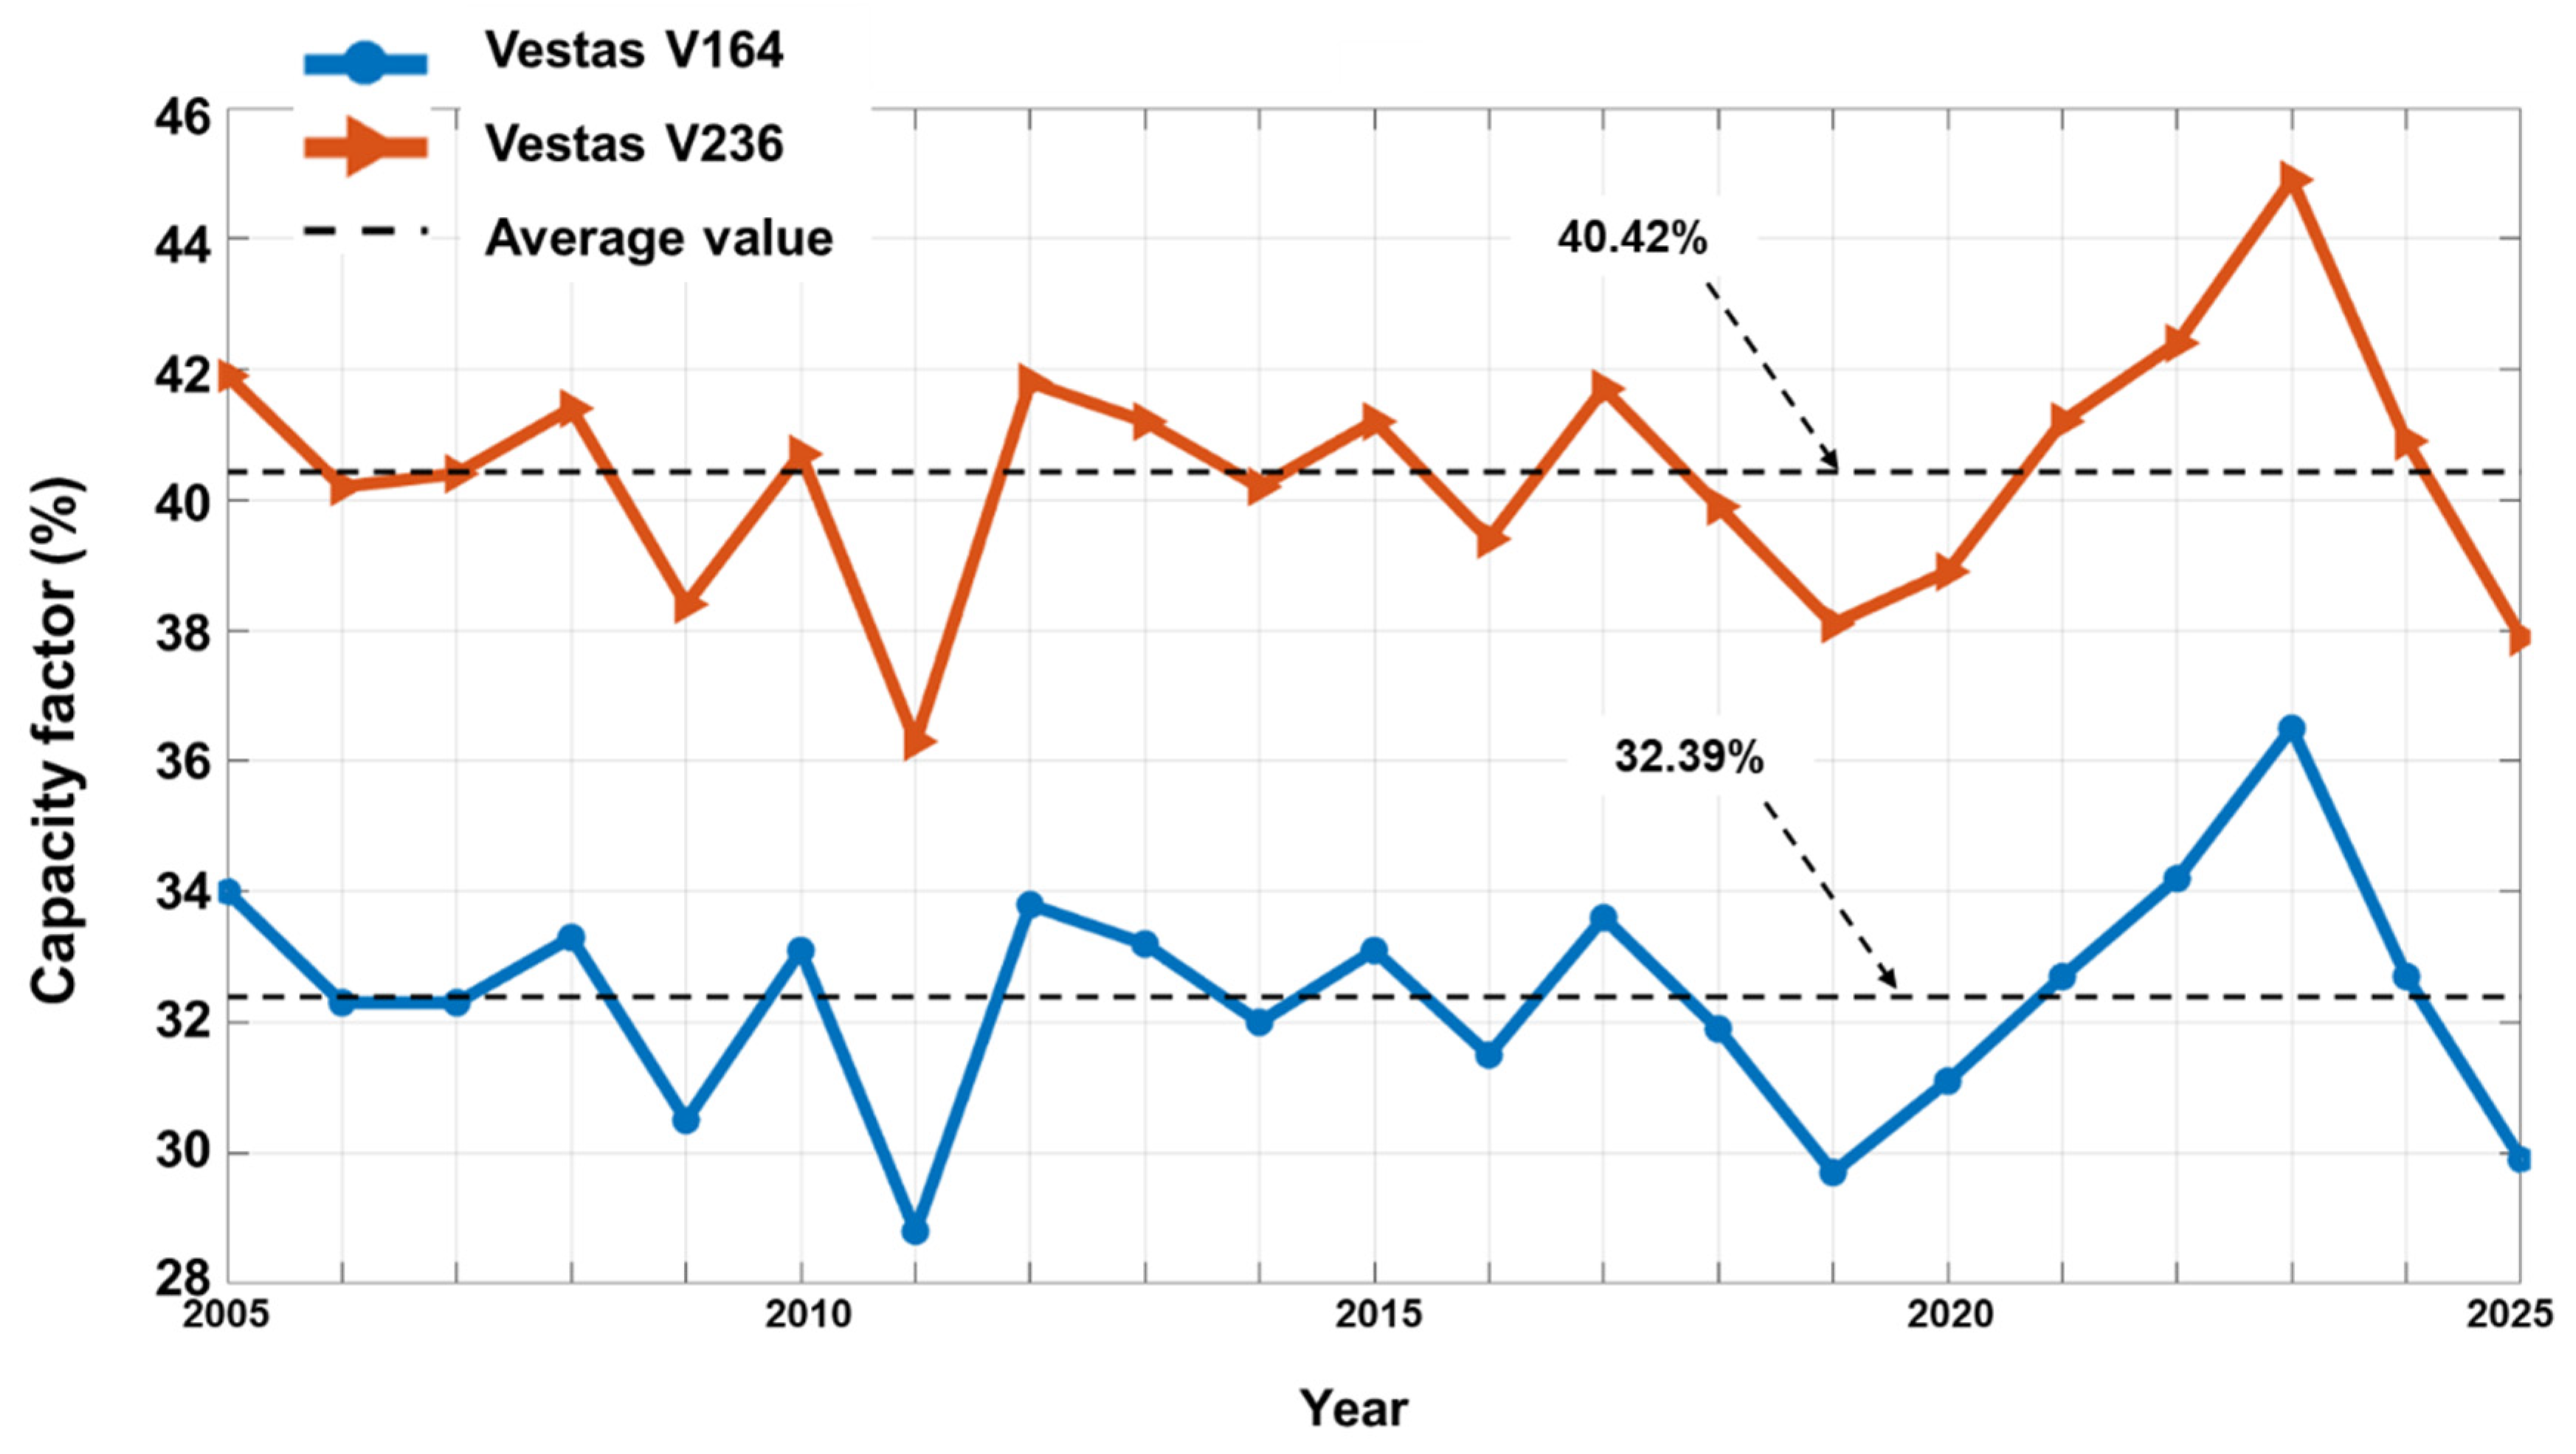
The annual capacity factor for the two wind turbines under consideration is shown in Figure 5. From this perspective, the Vestas V164 turbine (15 MW) is distinguished by a higher capacity factor, which can average 40.42% as opposed to the Vestas 164 (10 MW) system’s anticipated 32.39%.
Figure 5.
Capacity factor of the Vestas Offshore V164 (10 MW) and Vestas V236 (15 MW) in the pilot zone 4, according to the MERRA-2 dataset (2005–2025).
One explanation could be connected to the two turbines’ rated speeds; the 15 MW system has a substantially lower starting point (11.1 m/s) than the 10 MW system (12.5 m/s). The capacity factor varies significantly based on wind resources; better results were observed in 2023, when a maximum peak of 44.9% was recorded.
Table 2 presents two scenarios for the suggested configuration: (a) four rotor distances; (b) ten rotor distances. To determine the total number of turbines, these distances were evenly spread along the x and y axes (or longitude and latitude), covering the full pilot zone four. A four rotor diameter is regarded the shortest distance to be considered in order to prevent wake effects, although operating offshore wind farms normally consider a six to eleven rotor diameter [23]. The wake effect is ignored in this study because the general configuration is studied on a broad scale. Furthermore, because wind direction was not taken into account, it is difficult to predict how wake effects may affect the wind farm’s overall performance.
Table 2.
Case studies considered for implementation.
The annual electricity production (AEP) of a wind turbine, can be estimated as [24]:
where T represents the average number of hours per year (8760 h), f(u) is the Weibull probability density function, P(u) the turbine power curve, cut-in/cut-out—turbine characteristics.
The Weibull density function can be defined as [25]:
where u is the wind speed (U107 and U142 in this case), k is the shape parameter, and c is the scale parameter (in meters per second). The overall electricity output of a wind turbine is calculated by multiplying the AEP of a single turbine by the total number of turbines shown in Table 2 for each case study. For the current work, only the aging influence was taken into account for the performance drop, which was related with a mechanical wear of 1.6% each year (21 years in total) [26].
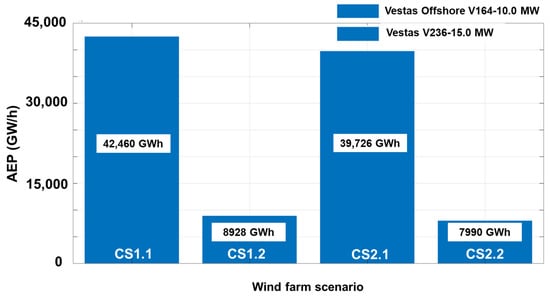
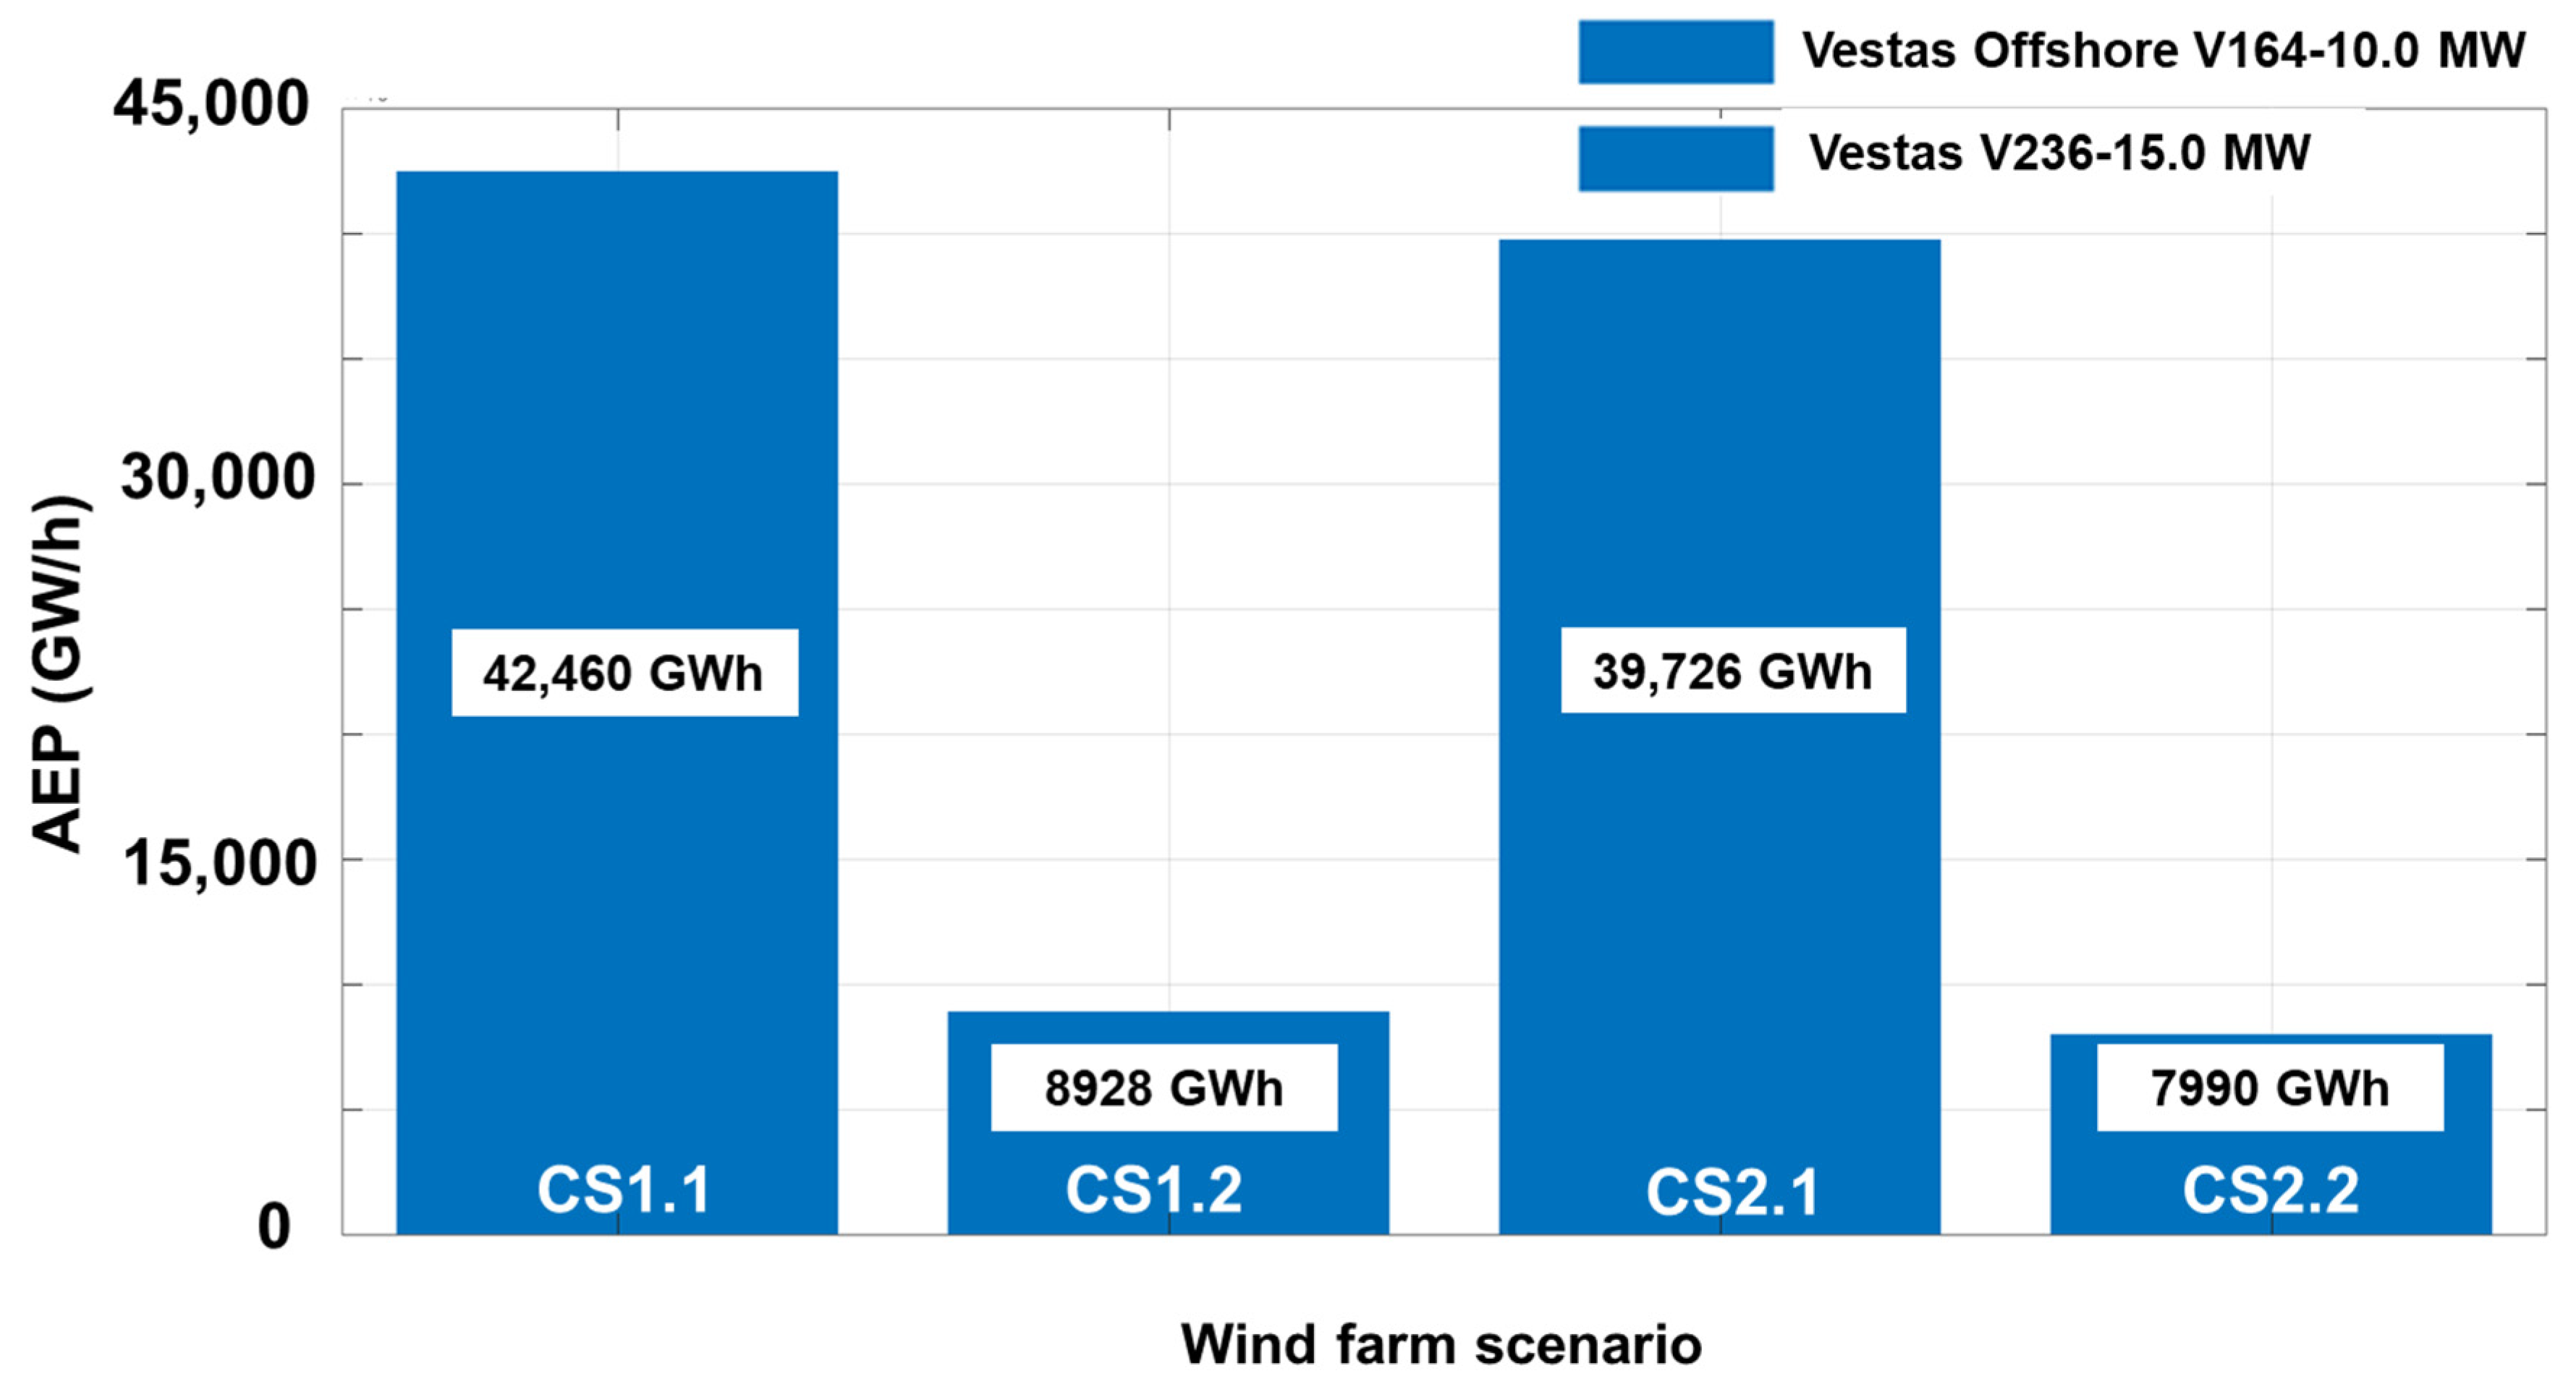
Figure 6 shows the estimated annual energy production for each case study. Only the CS1.2 and CS1.2 scenarios are considered realistic, given the estimated maximum offshore wind farm capacity of 3.6 GW for a single project (e.g., Dogger Bank, UK). Nevertheless, a future offshore wind farm created in the Romanian EEZ area will most likely include a wind farm layout ranging from four to ten rotor diameters. According to these findings, it is more efficient to develop a wind project based on the 15 MW wind turbine (176 turbines), with a projected AEP difference of 1 GWh when compared to a project based on the 10 MW turbine assembled from 368 units.
Figure 6.
Expected AEP according to each case study (CS1.1, CS1.2, CS2.1 and CS2.2).
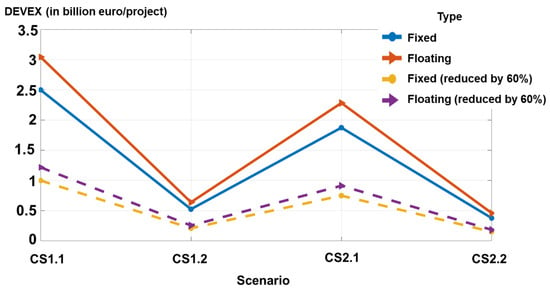
These scenarios reflect variations in turbine spacing and installed capacity, enabling the assessment of both high-density and low-density configurations. The techno-economic analysis integrates energy production estimates with DEVelopment EXpenditure (DEVEX) calculations. Development costs include turbine acquisition, installation, grid connection, and infrastructure components. Economic evaluations are supported by recent offshore wind cost studies and policy reports. The DEVEX analysis also considers the differences between fixed-bottom and floating offshore systems, with floating technologies exhibiting higher costs but increased spatial flexibility [27].
The calculation of the DEVEX indicator (€/MW) is based on the existing literature [28], which makes a clear distinction between fixed and floating technologies:
where PWF—projected wind farm capacity (in MW). The DEVEX values are determined based on the case studies presented in Table 2. The calculated figures (for example, 142,800) represent a sum of several components, such as environmental impact, fish survey, human impact, sensors, geotechnical survey, and so on. It is important to note that DEVEX and CAPEX (capital expenditure) are not the same thing. The first refers to the funds required before the project begins, to take it from concept to final approval, whereas the CAPEX represents the expenditure required to develop the real wind farm.
High-density configurations (CS1.1 and CS2.1) generate significantly higher energy outputs due to increased installed capacity. However, turbine spacing influences wake effects and overall efficiency. The development expenditure for each scenario is illustrated in Figure 7.
Figure 7.
DEVEX (development expenditure) values estimated for each case study (fixed and floating).
The results show that large-scale projects benefit from economies of scale, which lowers the cost per installed MW; nevertheless, floating offshore systems remain more expensive due to technological complexity. Looking at the base scenario (fixed or floating), we can see that the DEVEX number is fairly large (3 billion euros per project, for example), indicating a significant financial investment. Nonetheless, according to the literature analysis, combining surveying and development expenditures into a single project can cut DEVEX costs by over 60% [29].
In addition to the technological difficulties, the financial factors play a significant role in the development and operation of any offshore wind farm. This is reflected by the LCOE indicator that stands for levelized cost of energy (or electricity), which is the average cost of producing one unit of electricity from a specific power plant over its entire lifetime [30]. This can be defined as [31]:
where CAPEXt—represents capital expenditure; OPEXt—operational expenditures reported for year t; AEPt—annual energy production corresponding to year t; i—the discount rate; n—project’s lifetime; t—year from the start of project.
The input values for the LCOE parameter estimation are shown in Table 3. Given that the CAPEX and OPEX values are defined in terms of the minimum and maximum value, it is evident that a single LCOE value cannot be obtained. As anticipated, the floating turbine is characterized by significantly higher investment, which can reach up to 7500 USD/kW for CAPEX and 160 USD/kW/year for the OPEX indicator. The predicted rate of return or interest used to translate future cash flows and expenses into their current worth is known as the discount rate for a wind turbine. This has a significant impact on how the LCOE changes, with the offshore wind industry showing values in the range of 4–10% annually [32].
Table 3.
Key factors in the assessment of LCOE.
Table 4 shows that a number of scenarios were taken into consideration by accounting for variations in CAPEX and OPEX in addition to wind turbine technology.
Table 4.
LCOE scenarios according to the lowest and highest values.
Table 5 presents the predicted LCOE findings for the scenarios CS1.2 and CS2.2, which are specified by capacities of 3.68 GW and 2.64 GW, respectively. Given that the proposed Dogger Bank (UK) is now thought to be the largest offshore wind farm, with an installed capacity of 3.6 GW developed in three parts (1.2 GW each), these two possibilities can be seen as more realistic [35]. Furthermore, the Romanians set a goal of installing 3 GW of offshore capacity by 2035 [36].
Table 5.
LCOE findings related to case studies CS1.2 and CS2.2 and pilot zone 4.
In contrast to CS2.2 (fixed turbines), where a maximum of 141.03 USD/MWh is anticipated, the LCOE for the CS1.2 gradually increased from 115.23 to 263.90 USD/MWh. A rise of over 31% between the lowest and highest LCOE value is anticipated, demonstrating the impact of the discount rate. The LCOE values for floating systems are notably higher, ranging from 173.42 to 255.66 USD/MWh for the minimal scenario in the CS1.2 scenario, while a maximum of 423.35 USD/MWh may be anticipated for the less desirable situation when a 10% discount rate is taken into account. The floating project for CS2.2 is linked to an LCOE that fluctuates between 92.68 and 226.24 USD/MWh.
4. Conclusions
The current project is in accordance with Romania’s goals of creating a competitive offshore wind industry. It is anticipated that a 3 GW offshore wind project located at least 50 km from the shoreline will supply over 16% of Romania’s electricity needs, while a 7 GW project might cover 37% [37]. The first step was to identify some suitable pilot areas from the Romanian EEZ that can be considered for the development of different wind projects.
Since there is currently no operational wind farm in this region, several scenarios were proposed to determine how different wind farm layouts will perform in terms of power generation and economic metrics. The case studies are focused on 10 and 15 MW turbines, which is a similar approach to the SPOWIND project being focused on the Mediterranean Sea [28]. For simplicity, a rectangular pilot area was used, with scenarios ranging from 2.6 to 17.5 GW, where a higher-density farm is characterized by the minimum rotor distances (4 diameters) that are unaffected by wake losses.
The AEP is calculated using MERRA-2 wind data from 2005 to 2025, which spans 21 years. Based on the AEP numbers, the Vestas V236-15.0 MW appears to perform substantially better, with a total output of 7990 GWh from 176 wind turbines, compared to 8928 GWh projected from the Vestas Offshore V164-10.0 MW (368 systems). This distinction stems from the fact that the 15 MW turbine has a larger hub height area (142 m vs. 107 m), yet the rated wind speed is substantially lower, implying that this turbine will begin to function at full capacity after a longer period of time. Another essential consideration is the turbine capacity factor, which for the current work is defined by the average values of 32.39 (10 MW turbine) and 40.42% (15 MW turbine). For example, in the case of the UK offshore wind farm, the annual capacity factor ranges between 25.7 and 38.4%, with an expected increase of 10% in the near future [38]. Compared to the year 2025, the capacity factor of European offshore wind plants was approximately 34%, with newly installed projects potentially reaching over 50% [39].
The methodology under consideration, which just assessed the aging of the turbines, is another drawback of the current analysis. In actuality, an offshore wind farm is a more intricate system that is impacted by availability, electrical, and wake losses. The current work is predicated on an ideal situation (no losses), which has two effects on the outcomes: (a) wind farm performance is exaggerated, particularly when there is a dense wind configuration; (b) the LCOE is underestimated due to the influence of OPEX and AEP values.
In terms of economics, as larger offshore wind-energy installations are built, the LCOE of wind energy significantly decreases. The estimated LCOE for offshore wind in 2024 is 65–118 USD/MWh in Denmark, 72–127 USD/MWh in Germany, 64–139 USD/MWh in the Netherlands, and 132–197 USD/MWh in France, with the mention that most of the projects are based on fixed foundations [15]. For example, in the Romanian EEZ area, recent economic studies on wind turbines ranging from 5 to 9.5 MW revealed LCOE values ranging from 96.37 to 169.82 USD/MWh [8]. The current work found that it is more viable to develop a wind project that includes 15 MW wind turbines (176 units), with an estimated LCOE value ranging from 61.58 to 141.03 USD/MWh depending on the discount rate and input scenarios. A floating project can be projected to have a minimum LCOE of 92.68 USD/MWh, while a more pessimistic scenario could have a maximum LCOE of 226.24. At this point, we should emphasize that the LCOE value was estimated on a general level, without taking into account wake influences or distance-to-shore variations, which will require a more in-depth analysis.
The current work focuses on a rough assessment of the LCOE values based on the available literature reviews. A more complete assessment should consider a wide range of criteria, including turbine price, service life, and distance to shore.
Finally, it can be concluded that a large-scale project can achieve competitive cost levels and is likely to make a major contribution to the Romanian electricity market, particularly during the summer months when the hydropower sector is less visible.
Author Contributions
R.-A.D. and F.O. performed the literature review, processed the data, and wrote the manuscript. E.R. designed and supervised the present work. A.S. contributed to the design and implementation of the research. All authors have read and agreed to the published version of the manuscript.
Funding
This research received no external funding.
Data Availability Statement
The original contributions presented in this study are included in the article. Further inquiries can be directed to the corresponding author.
Acknowledgments
The MERRA-2 reanalysis database is available on the NASA website (https://power.larc.nasa.gov/data-access-viewer/, accessed on 7 September 2026). This work was presented at the 1st International Online Conference on Inventions (IOCIV), 25–26 June 2026.
Conflicts of Interest
The authors declare no conflicts of interest.
References
- Davy, R.; Gnatiuk, N.; Pettersson, L.; Bobylev, L. Climate Change Impacts on Wind Energy Potential in the European Domain with a Focus on the Black Sea. Renew. Sustain. Energy Rev. 2018, 81, 1652–1659. [Google Scholar] [CrossRef] [Scilit]
- Islek, F.; Yuksel, Y. Evaluation of Future Wind Power Potential and Their Projected Changes in the Black Sea and Possible Stable Locations for Wind Farms. Ocean Eng. 2022, 266, 112832. [Google Scholar] [CrossRef] [Scilit]
- Görmüş, T.; Aydoğan, B.; Ayat, B. Analysis of Hybrid Exploitation of Wind and Wave Power in the Mediterranean and the Black Sea. Energy Convers. Manag. 2024, 299, 117820. [Google Scholar] [CrossRef] [Scilit]
- Cuciureanu, M.C.; Vedinaș, I.; Mărășescu, C.D.; Volintiru, O.N.; Scurtu, I.C. Study on the Wind Energy Potential of the Black Sea Continental Shelf in the Coastal Area of Romania. Geo-Eco-Marina 2025, 31, 127–134. [Google Scholar] [CrossRef]
- Karagiorgos, J.; Dallenga, R.; Vervatis, V.; Sofianos, S. Wave Energy Potential in the Mediterranean and Black Seas: A 15-Year Hindcast and Ocean Current Influence. Tech. Ann. 2024, 1, 1–17. [Google Scholar] [CrossRef] [Scilit]
- Aydoğan, B.; Görmüş, T.; Ayat, B.; Çarpar, T. Analysis of Potential Changes in the Black Sea Wave Power for the 21st Century. Renew. Energy 2021, 169, 512–526. [Google Scholar] [CrossRef] [Scilit]
- Bekçi, E.; Koca, K.; Bashir, M.F. Design Analysis of a Wave Energy Converter for Hydrogen Generation near Shoreline of Black Sea. Process Saf. Environ. Prot. 2024, 186, 1–9. [Google Scholar] [CrossRef] [Scilit]
- Manolache, M.; Andrei, G.; Manolache, A.I. Assessment of Offshore Wind Potential and Economic Sustainability Using Levelized Cost of Energy Across Nine Sites in Romania’s Black Sea Exclusive Economic Zone. Sustainability 2026, 18, 6798. [Google Scholar] [CrossRef] [Scilit]
- Furubayashi, T.; Tsujie, K. Analysis of Offshore Wind Power Potential Considering Different Mesh Shapes in the Presence of Prevailing Wind and Deeper Water Depth: A Case Study in Akita, Japan. Energies 2025, 18, 4187. [Google Scholar] [CrossRef] [Scilit]
- Onea, F.; Rusu, L. A Study on the Wind Energy Potential in the Romanian Coastal Environment. J. Mar. Sci. Eng. 2019, 7, 142. [Google Scholar] [CrossRef] [Scilit]
- World Bank’s IFC Launched the Consultation for Romania’s Offshore Wind Roadmap—Energynomics.Ro. Available online: https://www.energynomics.ro/en/world-banks-ifc-launched-the-consultation-for-romanias-offshore-wind-roadmap/ (accessed on 19 August 2026).
- NASA POWER|Data Access Viewer (DAV). Available online: https://power.larc.nasa.gov/data-access-viewer/ (accessed on 7 September 2026).
- NASA POWER|Docs|Methodology|Meteorology|Data—NASA POWER|Docs. Available online: https://power.larc.nasa.gov/docs/methodology/meteorology/ (accessed on 7 September 2026).
- Alvarez, I.; Gomez-Gesteira, M.; deCastro, M.; Carvalho, D. Comparison of Different Wind Products and Buoy Wind Data with Seasonality and Interannual Climate Variability in the Southern Bay of Biscay (2000–2009). Deep Sea Res. Part II Top. Stud. Oceanogr. 2014, 106, 38–48. [Google Scholar] [CrossRef] [Scilit]
- Li, X.; Qin, X.; Yang, J.; Xu, W. Comparison of the Applicability of Two Reanalysis Products in Estimating Tall Tower Wind Based on Multiple Linear Regression and Artificial Neural Network in South China. Adv. Meteorol. 2022, 2022, 6573202. [Google Scholar] [CrossRef] [Scilit]
- Yildirir, V.; Rusu, E.; Onea, F. Wind Energy Assessments in the Northern Romanian Coastal Environment Based on 20 Years of Data Coming from Different Sources. Sustainability 2022, 14, 4249. [Google Scholar] [CrossRef] [Scilit]
- Vestas V164-10.0—10.00 MW-Wind Turbine. Available online: https://en.wind-turbine-models.com/turbines/2348-vestas-v164-10-0 (accessed on 19 August 2026).
- V236-15.0 MWTM. Available online: https://www.vestas.com/en/energy-solutions/offshore-wind-turbines/V236-15MW (accessed on 19 August 2026).
- Vestas’ First 15MW Turbine Begins Generating at Germany’s Largest Offshore Wind Farm. Available online: https://www.tgs4c.com/news/vestas27-first-15mw-turbine-begins-generating-at-germany27s-largest-offshore-wind-farm-nid32178.html (accessed on 19 August 2026).
- Gruber, K.; Regner, P.; Wehrle, S.; Zeyringer, M.; Schmidt, J. Towards Global Validation of Wind Power Simulations: A Multi-Country Assessment of Wind Power Simulation from MERRA-2 and ERA-5 Reanalyses Bias-Corrected with the Global Wind Atlas. Energy 2022, 238, 121520. [Google Scholar] [CrossRef] [Scilit]
- Wang, Y.; Warder, S.C.; Benmoufok, E.F.; Wynn, A.; Buxton, O.R.H.; Staffell, I.; Piggott, M.D. Geographic Variability in Reanalysis Wind Speed Biases: A High-Resolution Bias Correction Approach for UK Wind Energy. Energy Convers. Manag. 2026, 352, 121066. [Google Scholar] [CrossRef] [Scilit]
- Onea, F.; Rusu, E. An Evaluation of the Wind Energy in the North-West of the Black Sea. Int. J. Green Energy 2014, 11, 465–487. [Google Scholar] [CrossRef] [Scilit]
- Amiri, M.M.; Shadman, M.; Estefen, S.F. A Review of Physical and Numerical Modeling Techniques for Horizontal-Axis Wind Turbine Wakes. Renew. Sustain. Energy Rev. 2024, 193, 114279. [Google Scholar] [CrossRef] [Scilit]
- Onea, F.; Rusu, E.; Rusu, L. Assessment of the Offshore Wind Energy Potential in the Romanian Exclusive Economic Zone. J. Mar. Sci. Eng. 2021, 9, 531. [Google Scholar] [CrossRef] [Scilit]
- Al-Nassar, W.K.; Neelamani, S.; Al-Salem, K.A.; Al-Dashti, H.A. Feasibility of Offshore Wind Energy as an Alternative Source for the State of Kuwait. Energy 2019, 169, 783–796. [Google Scholar] [CrossRef] [Scilit]
- Staffell, I.; Green, R. How Does Wind Farm Performance Decline with Age? Renew. Energy 2014, 66, 775–786. [Google Scholar] [CrossRef] [Scilit]
- Huang, P.; Yu, Y.-H. Integrated Turbine and Cable Layout Optimization for Floating Offshore Wind Farms: A Techno-Economic Assessment. Energy Convers. Manag. X 2026, 31, 101955. [Google Scholar] [CrossRef] [Scilit]
- SPOWIND Project. Available online: https://spowind.interreg-euro-med.eu/ (accessed on 5 September 2026).
- Mega Project (15GW) Cost Reduction Report. Available online: https://ore.catapult.org.uk (accessed on 7 September 2026).
- Oladokun, V.O.; Asemota, O.C. Unit Cost of Electricity in Nigeria: A Cost Model for Captive Diesel Powered Generating System. Renew. Sustain. Energy Rev. 2015, 52, 35–40. [Google Scholar] [CrossRef] [Scilit]
- Travaglini, R.; Papi, F.; Bianchini, A. Floating Wind Farms in Sea Basins with Moderate Wind Speeds: A Critical Assessment of the Potential of Low-Specific-Power Turbines in Reducing the LCoE. Renew. Sustain. Energy Rev. 2025, 222, 115990. [Google Scholar] [CrossRef] [Scilit]
- Saługa, P.W.; Zamasz, K.; Dacko-Pikiewicz, Z.; Szczepańska-Woszczyna, K.; Malec, M. Risk-Adjusted Discount Rate and Its Components for Onshore Wind Farms at the Feasibility Stage. Energies 2021, 14, 6840. [Google Scholar] [CrossRef] [Scilit]
- Koondhar, M.A.; Afridi, S.K.; Alsenani, T.R.; Mahariq, I.; Zeinoddini-Meymand, H.; Shahnia, F.; Touti, E. A Structured Techno-Economic and Socio-Regulatory Comparison of Onshore, Fixed-Bottom Offshore, and Floating Offshore Wind Energy Systems. Int. J. Energy Res. 2026, 2026, 9999516. [Google Scholar] [CrossRef] [Scilit]
- Thomas, B.; Costoya, X.; deCastro, M.; Iglesias, G.; Gómez-Gesteira, M. Levelized Cost of Energy for Various Floating Offshore Wind Farm Designs in the Areas Covered by the Spanish Maritime Spatial Planning. Appl. Energy 2025, 381, 125165. [Google Scholar] [CrossRef] [Scilit]
- The World’s Largest Offshore Wind Farm. Available online: https://doggerbank.com/ (accessed on 8 September 2026).
- Romania Consults on Black Sea Offshore Wind Concession Areas. Available online: https://www.tgs4c.com/news/romania-consults-on-black-sea-offshore-wind-concession-areas-nid33108.html (accessed on 8 September 2026).
- World Bank Offshore Wind Development Program. Offshore Wind Roadmap for Romania; World Bank: Washington, DC, USA, 2024. [Google Scholar]
- Drew, D.; Cannon, D.; Brayshaw, D.; Barlow, J.; Coker, P. The Impact of Future Offshore Wind Farms on Wind Power Generation in Great Britain. Resources 2015, 4, 155–171. [Google Scholar] [CrossRef] [Scilit]
- WindEurope. Wind Energy in Europe: 2025 Statistics and the Outlook for 2026–2030; WindEurope: Brussels, Belgium, 2026. [Google Scholar]

Disclaimer/Publisher’s Note: The statements, opinions and data contained in all publications are solely those of the individual author(s) and contributor(s) and not of MDPI and/or the editor(s). MDPI and/or the editor(s) disclaim responsibility for any injury to people or property resulting from any ideas, methods, instructions or products referred to in the content. |
© 2026 by the authors. Licensee MDPI, Basel, Switzerland. This article is an open access article distributed under the terms and conditions of the Creative Commons Attribution (CC BY) license.