


Abstract
With the increasing adoption of gigacasting in the automotive industry, establishing joining technologies between aluminum casting alloys and rolled aluminum alloys has become an important challenge. In resistance spot welding (RSW) of these dissimilar materials, nugget formation is often absent, and the factors governing joint strength remain unclear. This study aims to clarify the factors affecting joint strength in RSW joints between aluminum casting alloy and rolled aluminum alloy. The relationship between fracture morphology and joint characteristics was systematically investigated through cross-tension tests, cross-sectional observations, hardness measurements, and numerical simulations. The results indicate that cross-tension strength (CTS) is strongly correlated with crack propagation behavior in the rolled aluminum alloy. In contrast, conventional factors such as penetration and plug diameter show weak correlation with CTS. Furthermore, the deformation range of the rolled aluminum alloy affects the distribution of plastic strain, which in turn controls crack propagation angle and joint strength. These findings demonstrate that the deformation behavior of the rolled aluminum alloy plays a dominant role in determining joint strength in nugget-free RSW joints.
1. Introduction
In recent years, the automotive industry has increasingly focused on reducing CO2 emissions by decreasing vehicle weight [1]. As a result, the use of aluminum casting alloys and rolled aluminum alloys has expanded [2,3,4]. In particular, the introduction of gigacasting technology has accelerated the demand for reliable joining methods between these materials. Resistance spot welding (RSW) is widely used in automotive production due to its high productivity and cost efficiency [5]. However, when applied to joints between aluminum casting alloys and rolled aluminum alloys, nugget formation is often absent because of differences in electrical resistivity and thermal properties [6,7,8]. In such cases, the joining mechanism differs significantly from conventional RSW of similar materials. Previous studies have reported that aluminum casting alloy preferentially melts, resulting in limited penetration into the rolled aluminum alloy [6,7,8]. Despite the absence of a nugget, the joint strength has been reported to be comparable to that of conventional aluminum–aluminum joints [8]. However, the reproducibility of penetration and the factors governing joint strength remain unclear. Therefore, this study aims to clarify the factors affecting joint strength in RSW joints between aluminum casting alloy and rolled aluminum alloy, with particular focus on fracture morphology, deformation behavior, and crack propagation characteristics.
2. Materials and Methods
2.1. Materials and Welding Conditions
The materials used in this study were 2.8 mm-thick Al–Si–Mg casting alloy and 1.1 mm-thick 6016-T4 rolled aluminum alloy sheets. Welding was performed using a resistance spot welding system equipped with a DC inverter power supply. The rolled aluminum alloy sheet was placed on the positive electrode side, and the aluminum casting alloy sheet was placed on the negative electrode side. The welding conditions are summarized in Table 1. The electrodes were made of Cu–Cr alloy (SMK, Tokyo, Japan). Type R100 electrodes were used for both positive and negative sides. In addition, type R25 electrodes were used to control the current path. The test specimens were prepared by performing three consecutive welds as one set, and this procedure was repeated three times, resulting in a total of nine joints. Furthermore, the same electrode was used within each set, and the electrode was replaced after each set was completed.
Table 1.
Welding conditions using R100 and R25 electrodes.
2.2. Method for the Cross-Tension Test
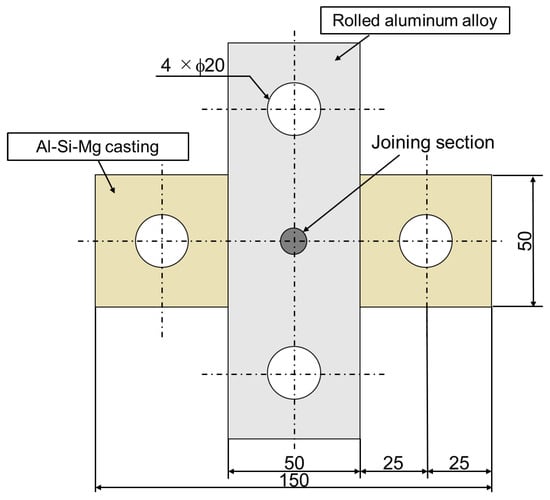
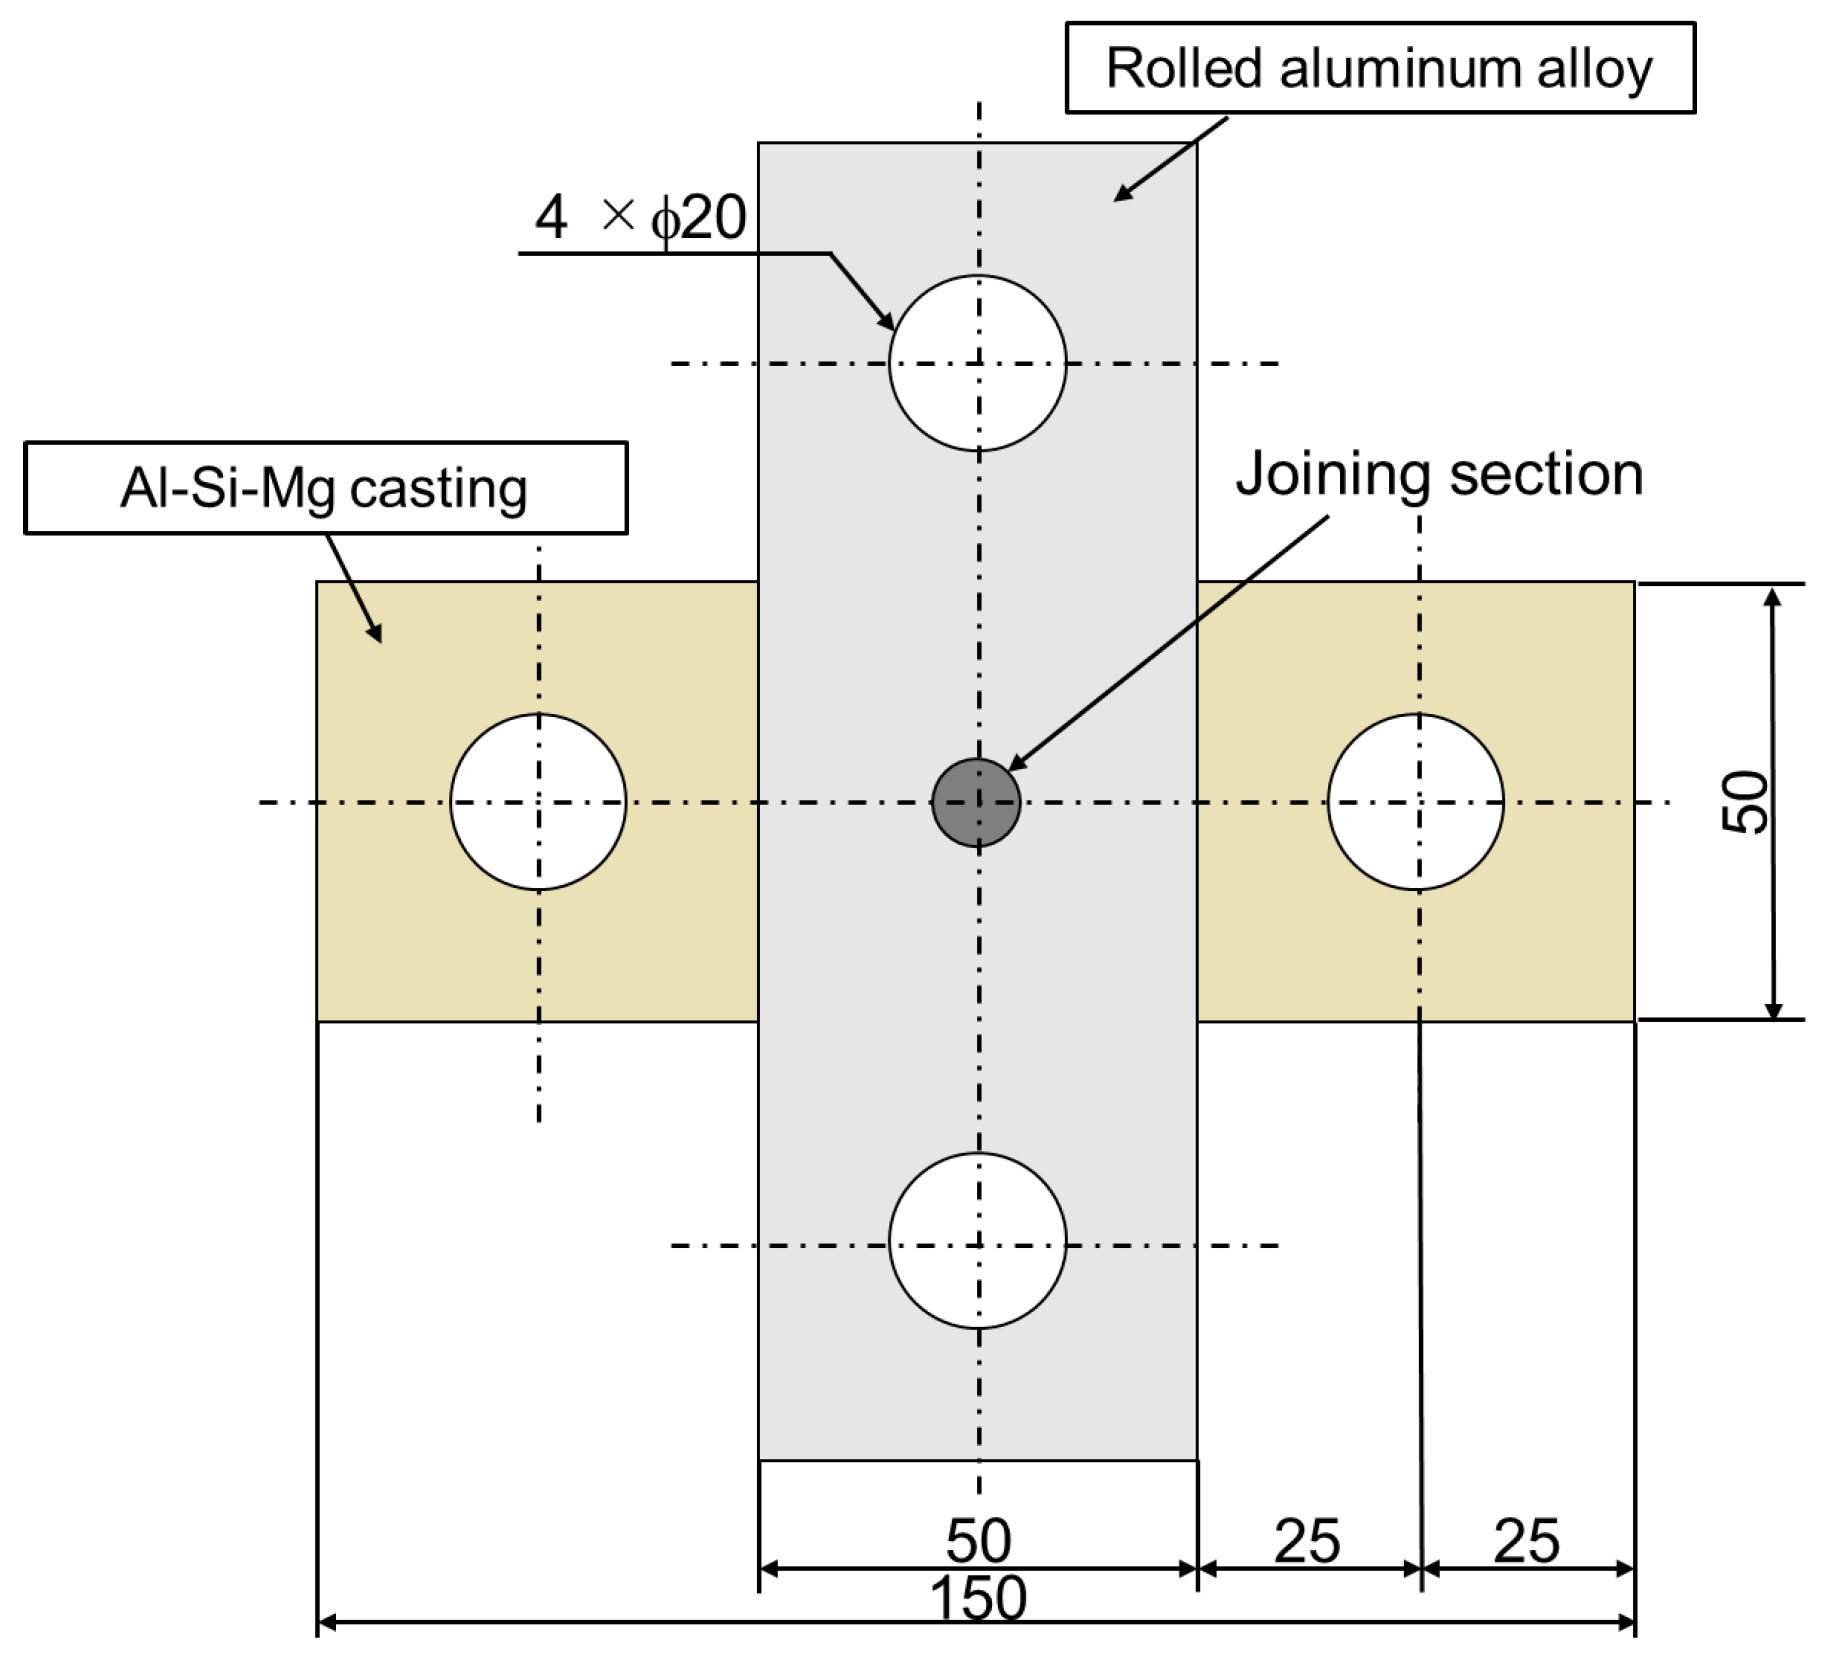
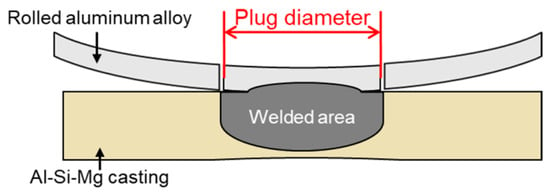
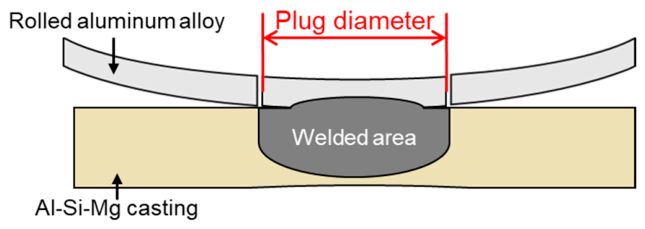
Cross-tension tests were conducted to evaluate joint strength in accordance with JIS Z 3137. Specimens were prepared by overlapping 50 mm × 150 mm sheets and welding at the center, as shown in Figure 1 [9]. The crosshead speed was set to 10 mm/min. After testing, the plug diameter was measured from cross-sectional observations, as defined in Figure 2.
Figure 1.
Schematic diagram of the method for preparing the cross-tension specimen. The units of dimension in the figure are “mm”.
Figure 2.
Evaluation method for the plug diameter observed from the cross-section of a joint.
2.3. Measuring Methods of Cross-Section and Hardness Map
Cross-sectional specimens were prepared by sectioning the welded joints at the center of the electrode indentation. Optical microscopy was used for microstructural observation. The two-dimensional Vickers hardness distribution was measured in both the thickness and interface directions.
2.4. Measuring Method for Deformation Range of the Rolled Aluminum Alloy
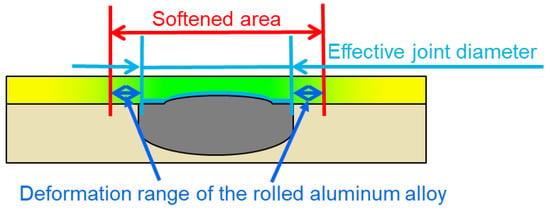
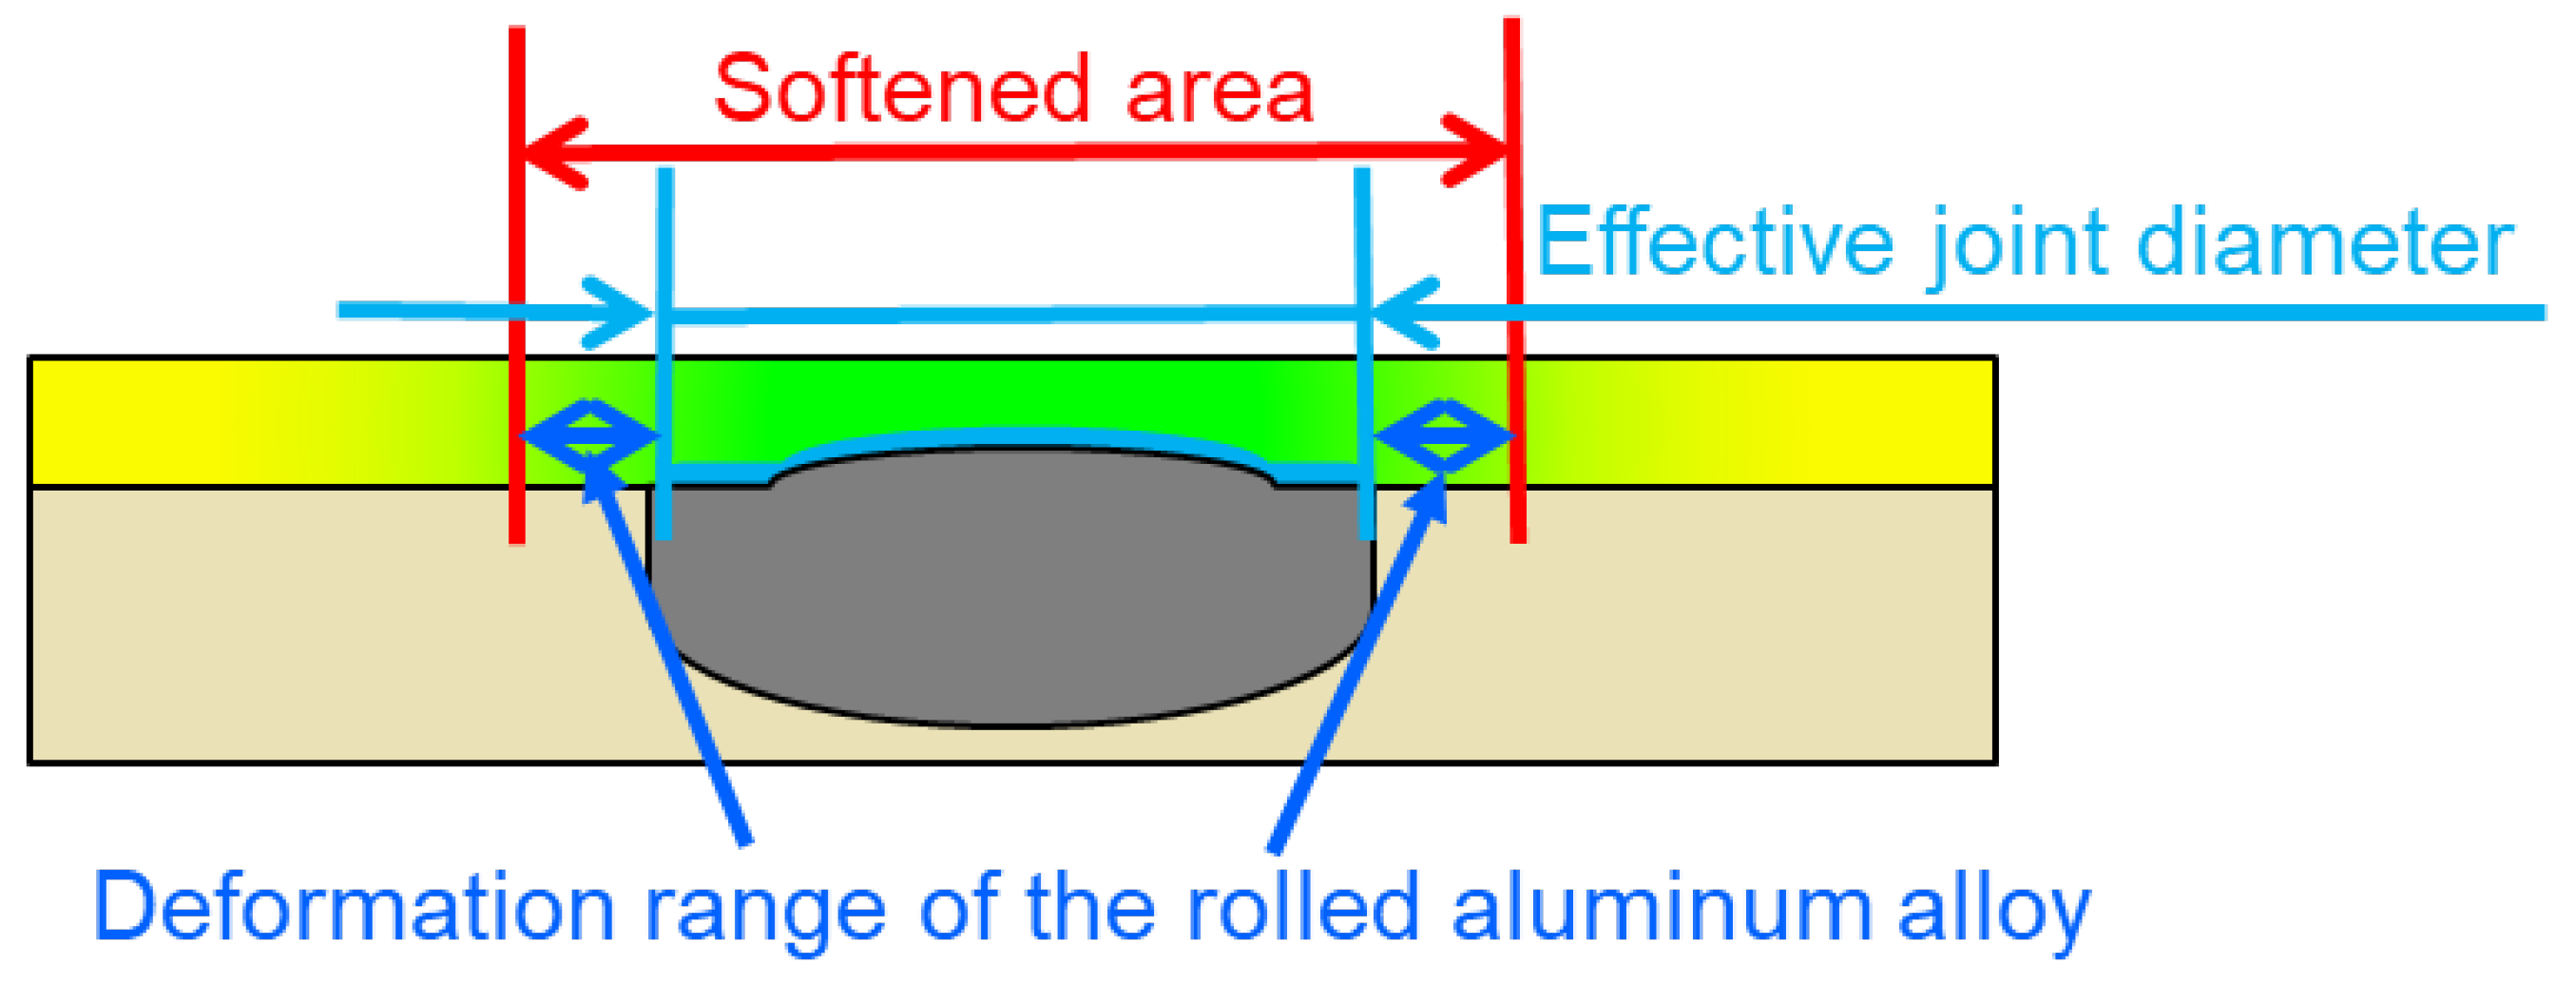
The deformation range of the rolled aluminum alloy was evaluated based on the difference between the effective joint diameter and the softening zone. The effective joint diameter was determined from the distance between crack initiation points, while the softening zone was identified from hardness distribution measurements, as shown in Figure 3.
Figure 3.
Evaluation method for the deformation range of the rolled aluminum alloy based on the joint diameter confirmed from cross-sectional observation and the softening area confirmed from the hardness map.
2.5. Method of Numerical Simulation
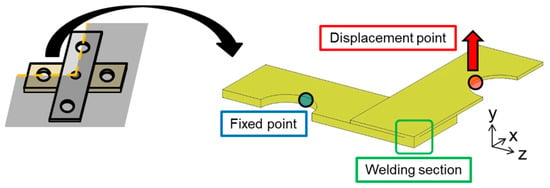
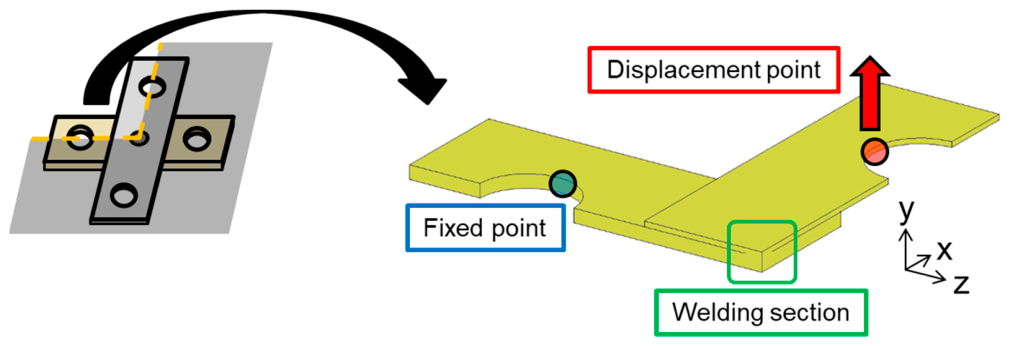
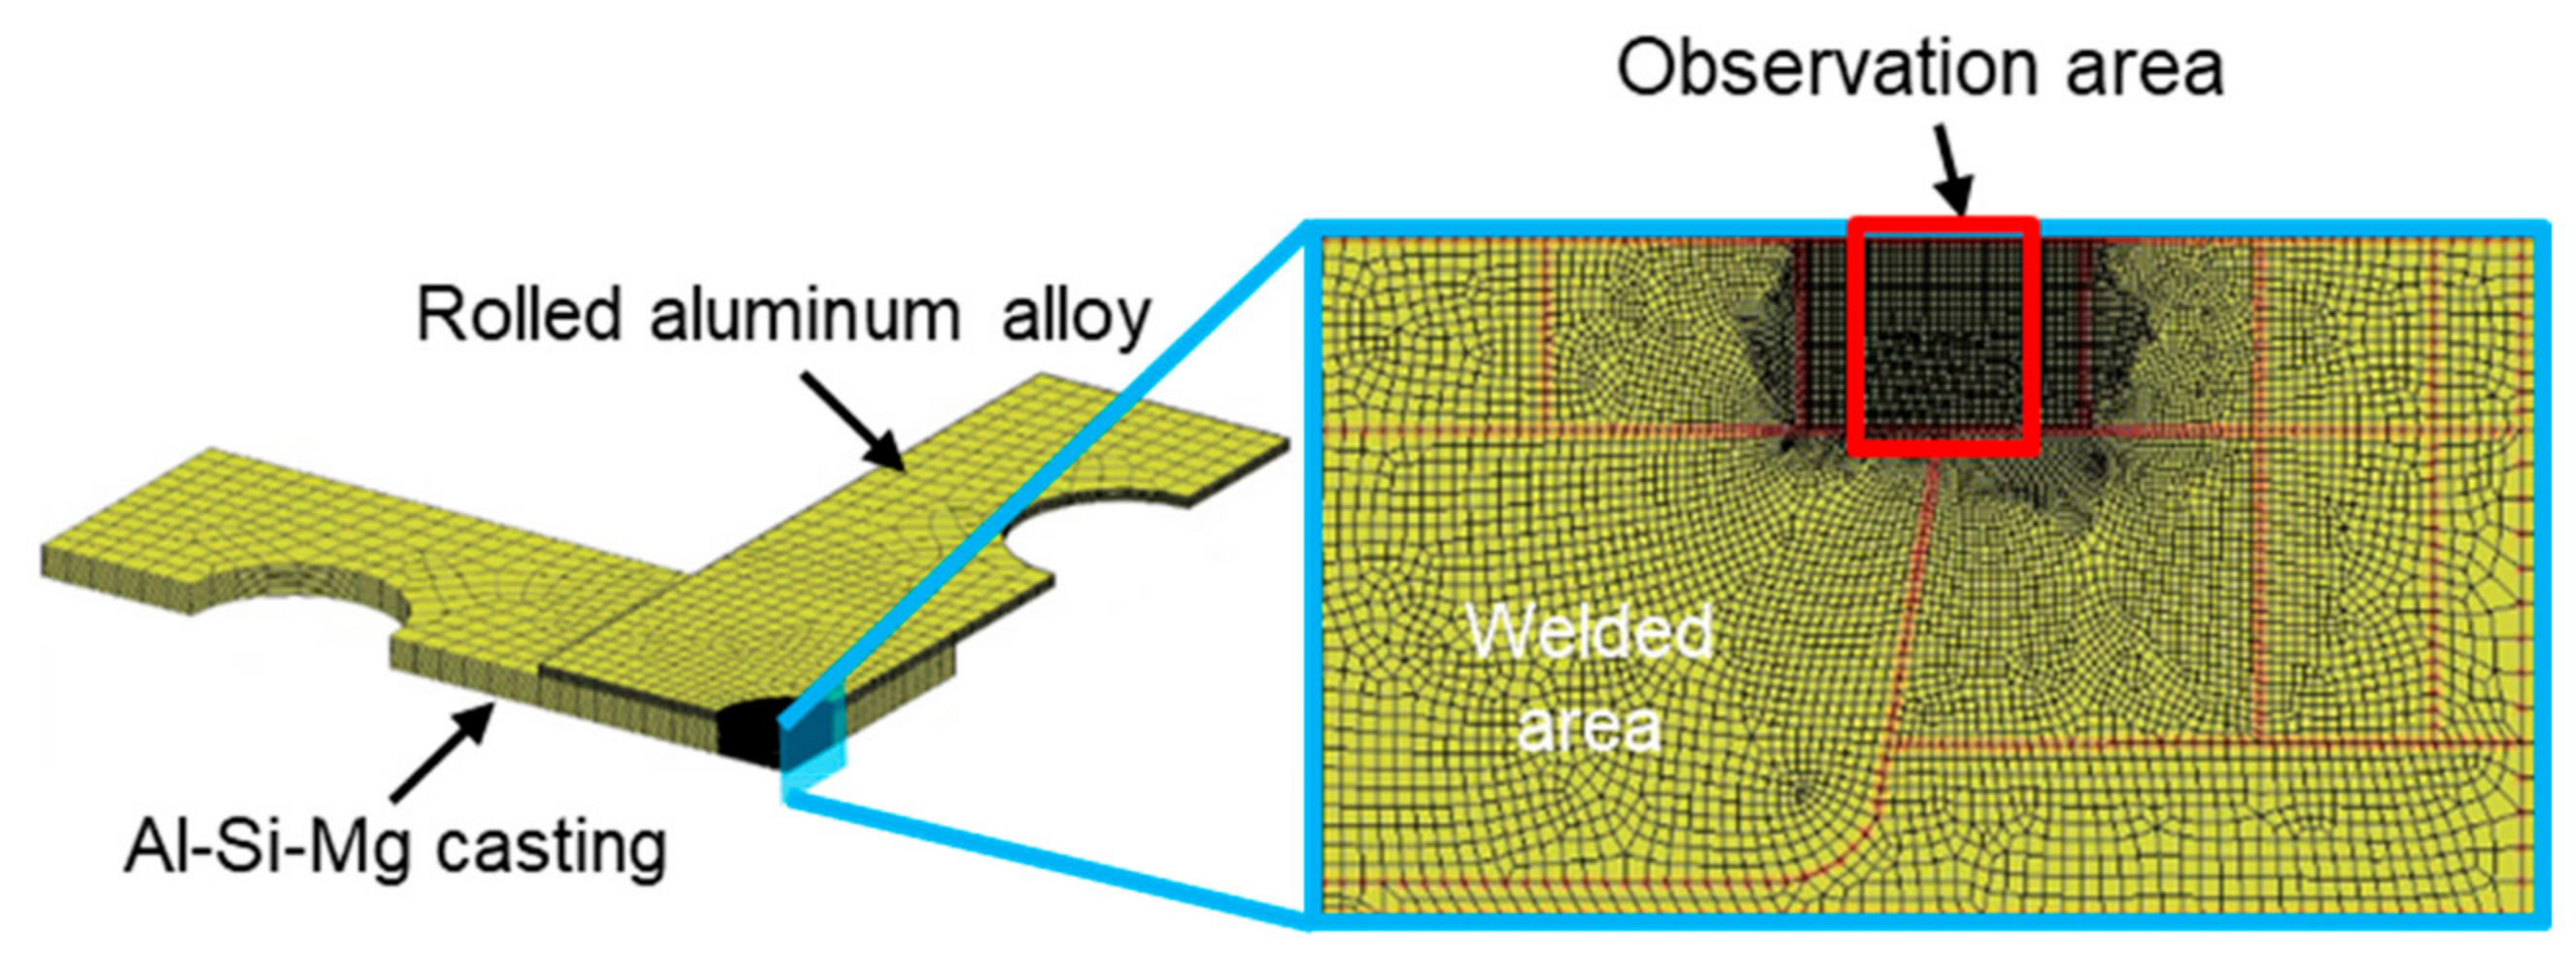
The software used was Marc Mentat 2021.2 (MSC software, Tokyo, Japan). A finite element model was constructed to simulate the cross-tension test. A quarter-symmetry model was used to reduce computational cost. The model dimensions and boundary conditions are shown in Figure 4, Figure 5 and Figure 6. Equivalent plastic strain distributions were evaluated under a load of 1400 N, corresponding to the onset of crack propagation.
Figure 4.
A quarter-symmetrical model of the cross-tension test specimen.
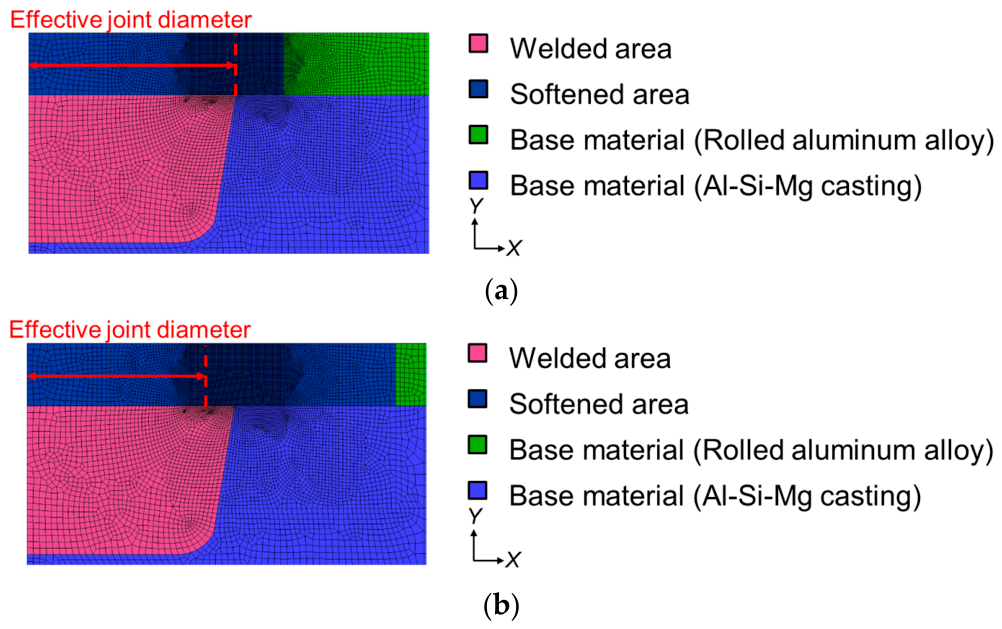
Figure 5.
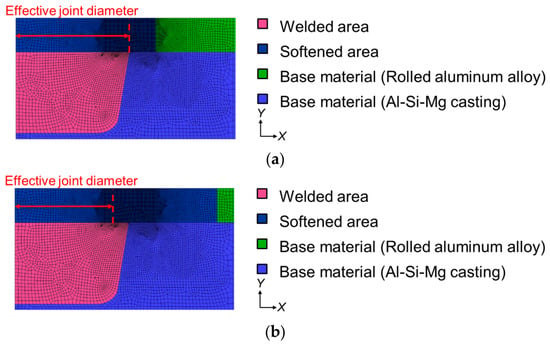
Cross-sectional model around the welded zone of (a) reduction in the deformation range of the rolled aluminum alloy; (b) expansion in the deformation range of the rolled aluminum alloy. (The red arrow indicates the effective joint diameter).
Figure 6.
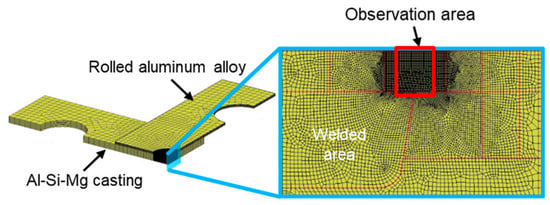
Observation area for the equivalent plastic strain.
Figure 5 shows a detailed view of the region near the welded area in the numerical simulation model. Figure 5a shows a model simulating a joint with a reduced deformation range of the rolled aluminum alloy. The effective joint diameter was set to 3.6 mm and the softening zone to 4.5 mm. Figure 5b shows a model simulating a joint with an expansion deformation range of the rolled aluminum alloy. The effective joint diameter was set to 3.1 mm and the softening zone to 6.5 mm. Furthermore, the observation plane was set to the region shown in Figure 6 to observe the distribution of equivalent plastic strain. In this numerical simulation, the strain distribution of a rolled aluminum alloy was obtained at 1400 N, the load at which a crack develops in the direction of the rolled aluminum alloy thickness.
2.6. Measuring Method of the Crack Propagation Angle
The crack propagation angle was measured from cross-sectional observations after the cross-tension test. Joints without crack propagation in the thickness direction were assigned a value of 0°.
3. Results and Discussion
3.1. Cross-Tension Strength for Different Electrode Shapes
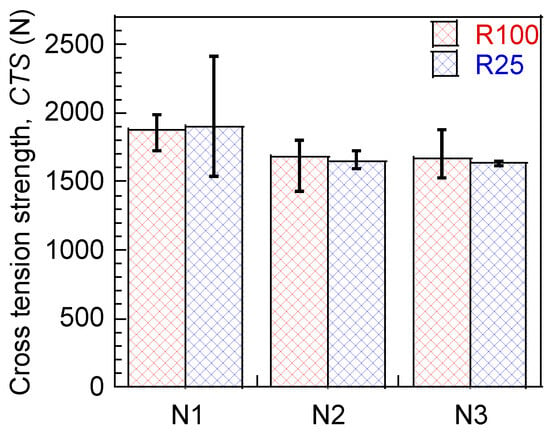
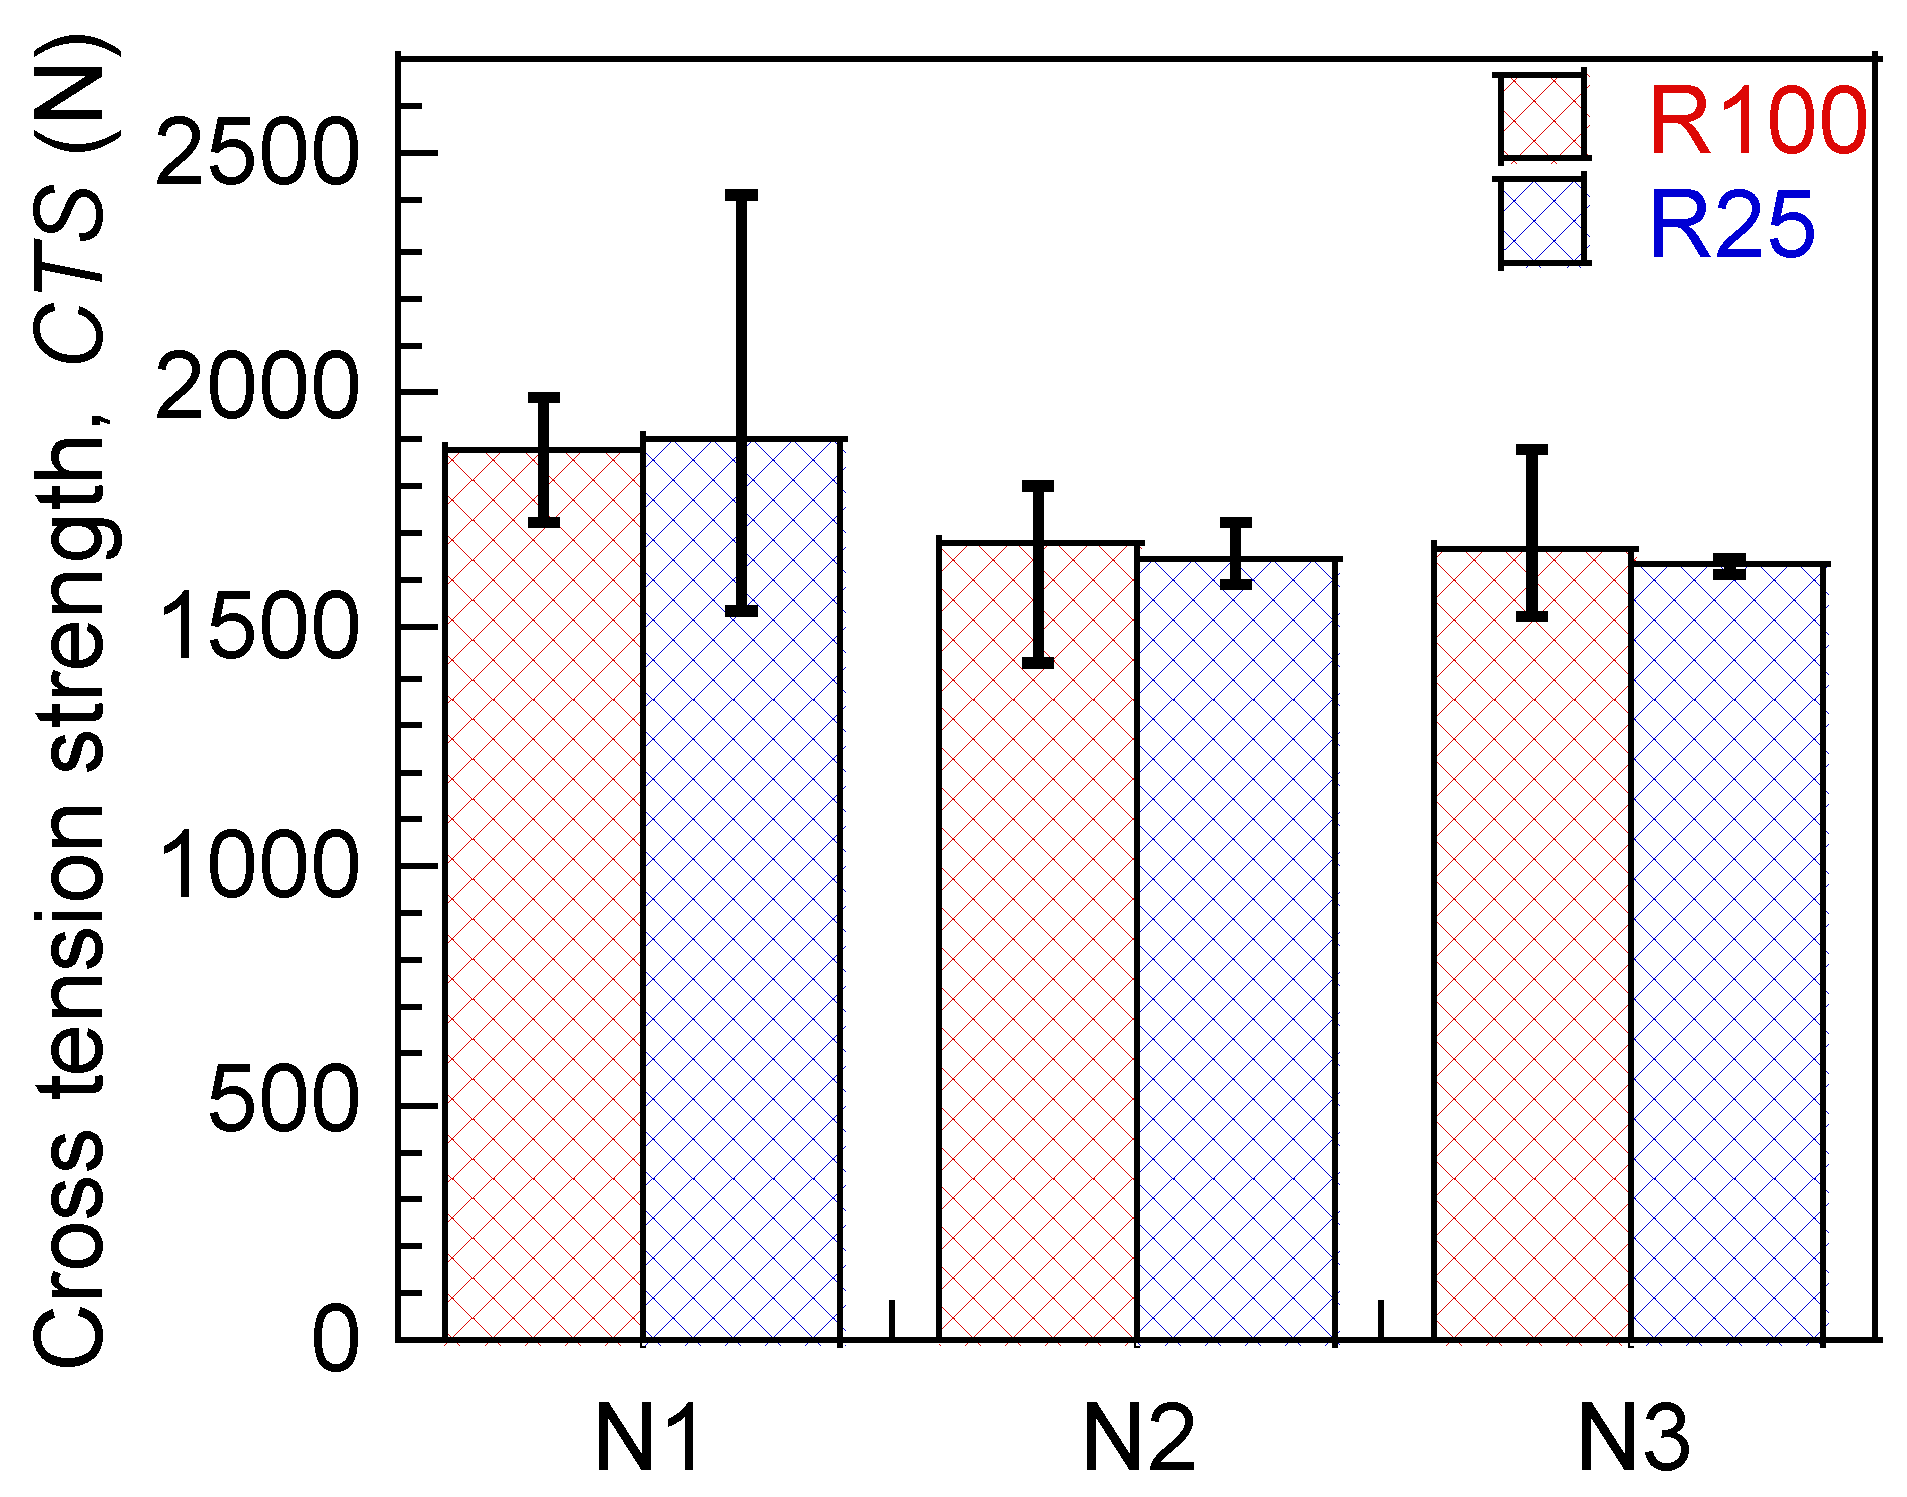
Figure 7 shows the cross-tension strength (CTS) for each electrode condition. CTS increased under the N1 condition, while similar values were observed for N2 and N3.
Figure 7.
CTS for each electrode shape. N1, N2, and N3 represent the welding sequence when welding continuously using the same electrode. This sequence was repeated three times.
3.2. Cross-Sectional Macro Photograph of the Joint After the Cross-Tension Test for Different Electrode Shapes
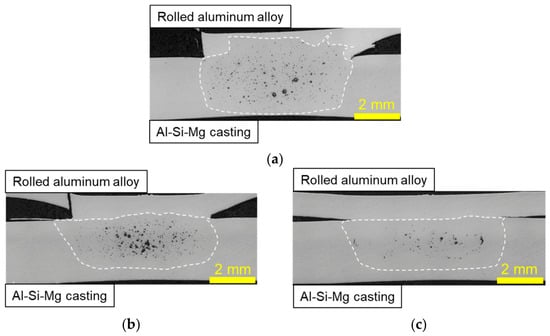
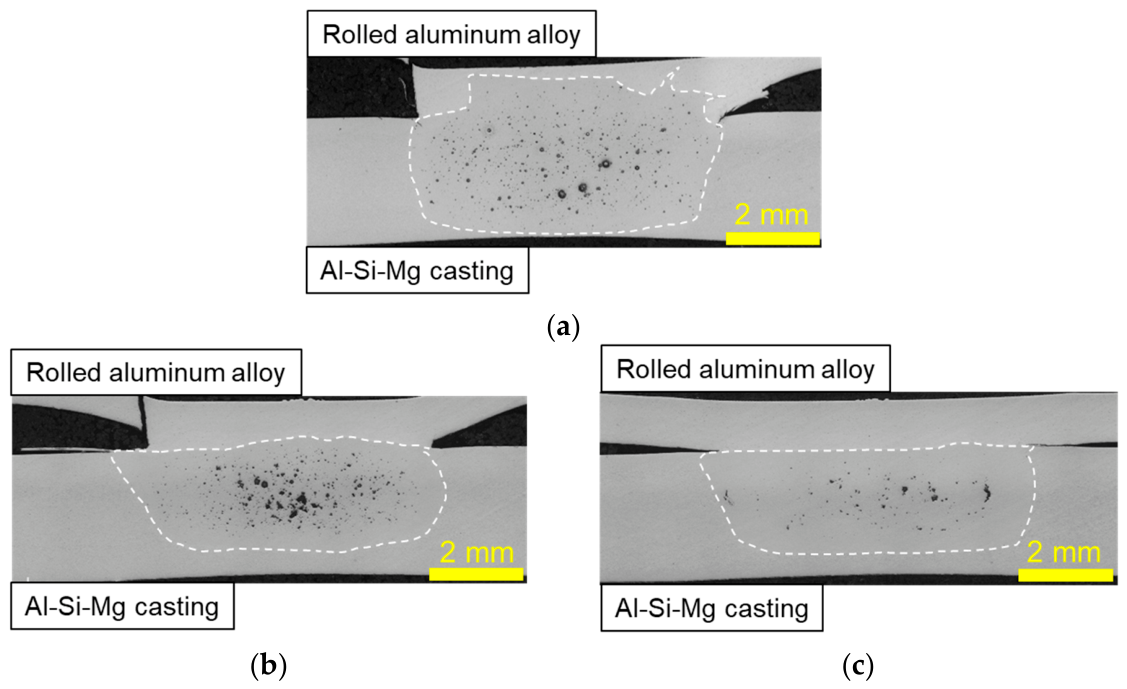
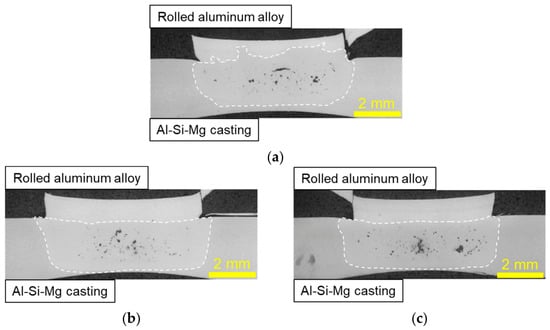
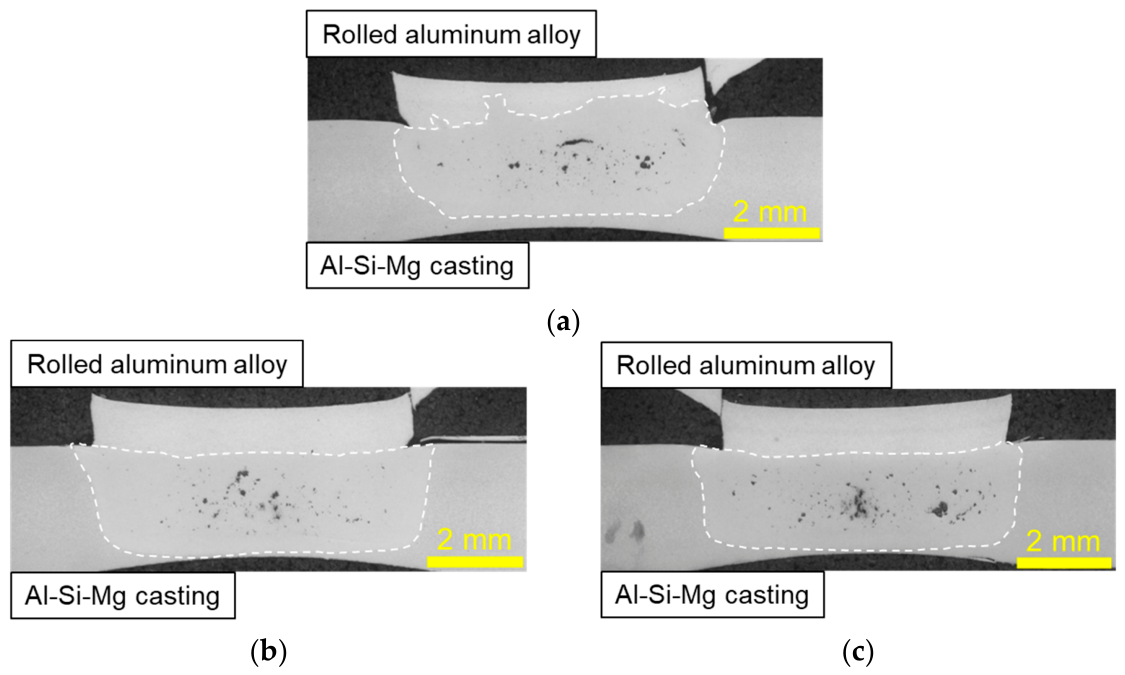
Cross-sectional observations (Figure 8 and Figure 9) revealed variations in penetration behavior depending on electrode conditions. Increased penetration into the rolled aluminum alloy was observed in N1, whereas reduced penetration was observed in N2 and N3. However, the correlation between penetration and CTS was weak, indicating that penetration is not the primary factor governing joint strength.
Figure 8.
Cross-sectional macro photograph of the R100 type after the cross-tension test: (a) the first joint to be welded (N1); (b) the second joint to be welded (N2); (c) the third joint to be welded (N3).
Figure 9.
Cross-sectional macro photograph of the R25 type after a cross-tension test: (a) the first joint to be welded (N1); (b) the second joint to be welded (N2); (c) the third joint to be welded (N3).
Figure 9 shows cross-sectional observations of the joints after the cross-tension test using an R25 electrode. As shown in Figure 9a, penetration into the rolled aluminum alloy increased in the N1 condition. In contrast, penetration decreased in the N2 and N3 conditions, as shown in Figure 9b,c. Although CTS increased in the N1 condition, the relationship between penetration and CTS was not clearly established. This suggests that penetration is not the dominant factor governing joint strength in these joints.
3.3. The Relationship Between Joint Properties and Joint Strength
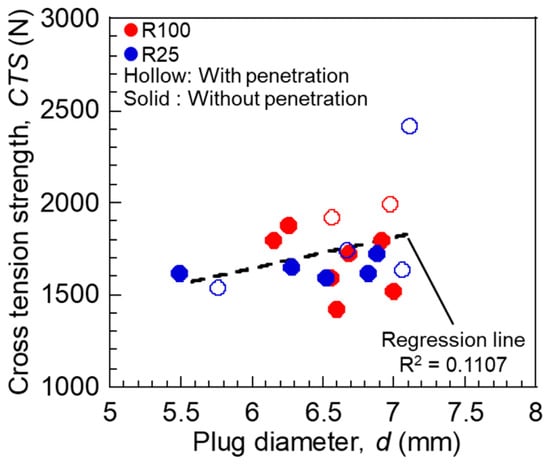
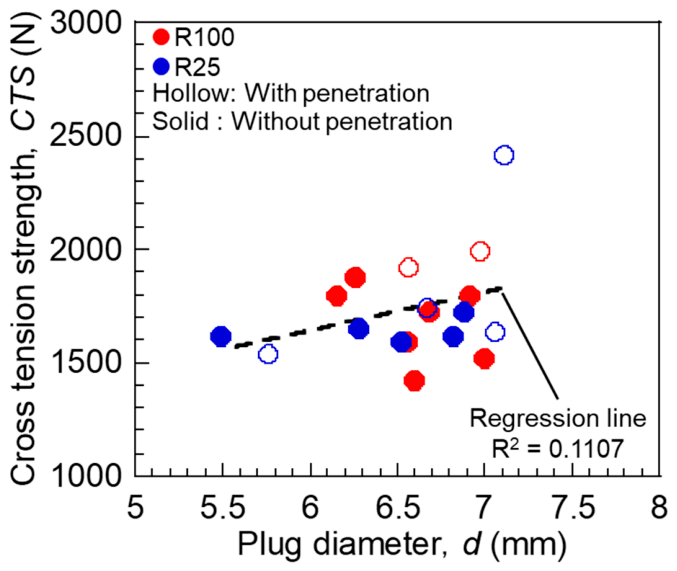
Figure 10 shows the relationship between plug diameter and CTS. The correlation was weak, suggesting that conventional parameters such as plug diameter do not govern joint strength in these joints.
Figure 10.
Relationship between plug diameter and CTS. The presence or absence of penetration into the rolled aluminum alloy, as observed in the cross-section, is indicated by the marker type. Joints showing penetration into the rolled aluminum alloy are indicated by hollow circles, and joints showing no penetration into the rolled aluminum are indicated by solid circles.
3.4. Effect of Rolled Aluminum Alloy Hardness on the Deformation Range of Rolled Aluminum Alloy
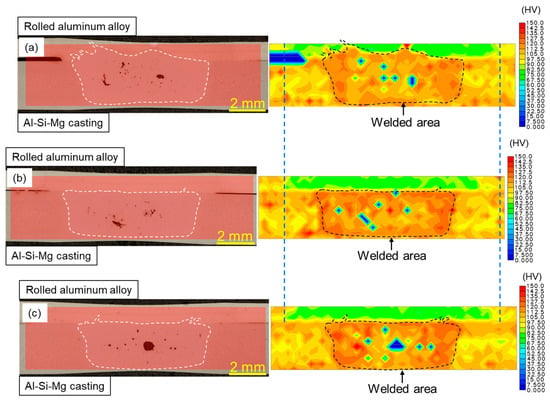
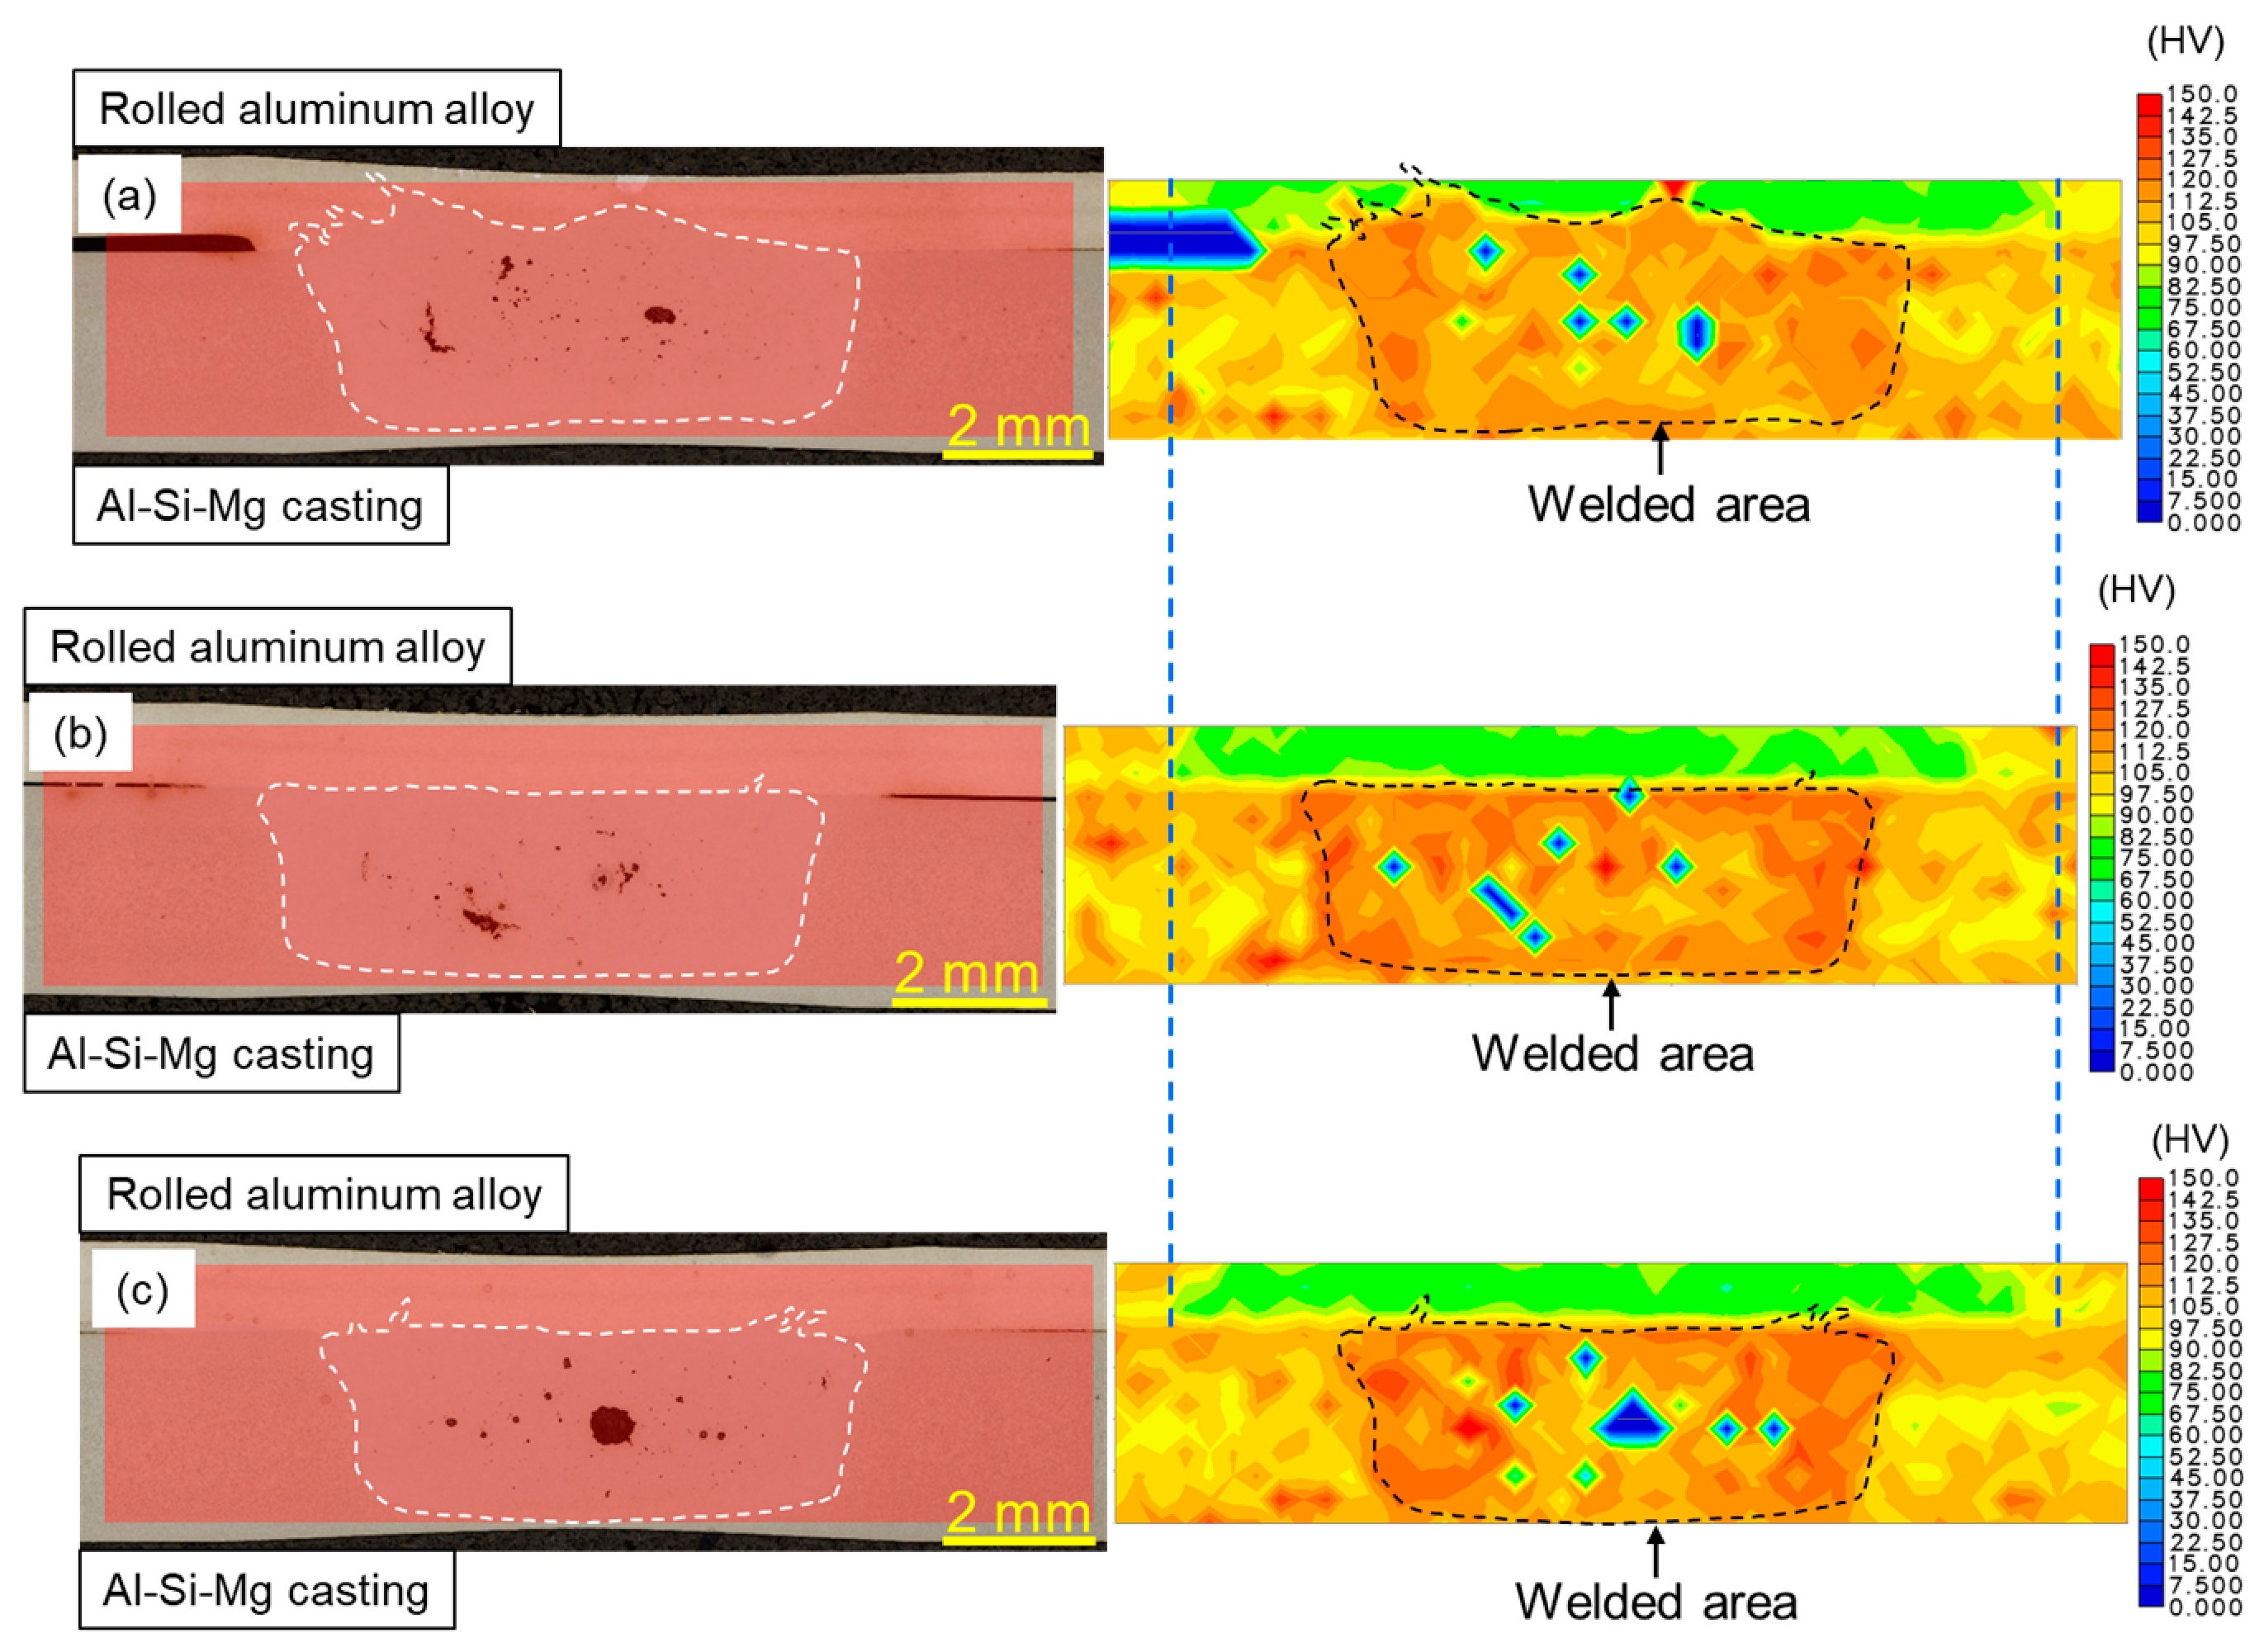
Figure 11 shows the hardness distribution of the joints. Softening of the rolled aluminum alloy is observed in all conditions, with the extent of the softening region varying among the joints. These results indicate that the size of the softening region affects the deformation range of the rolled aluminum alloy. Previous studies have reported that strain occurs in the softened region of aluminum alloys, making them more susceptible to deformation [10,11]. When the softening region is small, the deformation range is limited, resulting in strain localization in the thickness direction during the cross-tension test. In contrast, when the softening region expands, the deformation range increases, leading to a broader strain distribution in the radial direction. To quantify this effect, the deformation range of the rolled aluminum alloy was evaluated and correlated with CTS.
Figure 11.
Hardness map of the rolled aluminum alloy and Al-Si-Mg casting joints: (a) the first joint to be welded (N1); (b) the second joint to be welded (N2); (c) the third joint to be welded (N3).
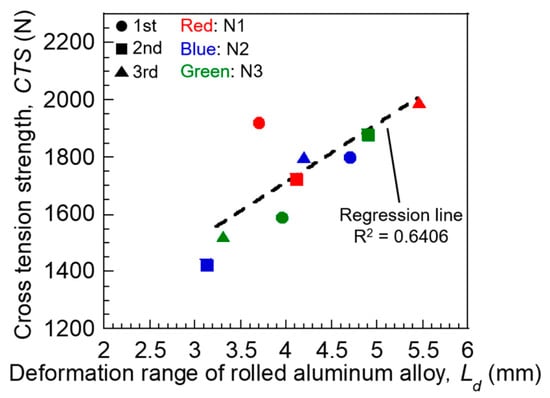
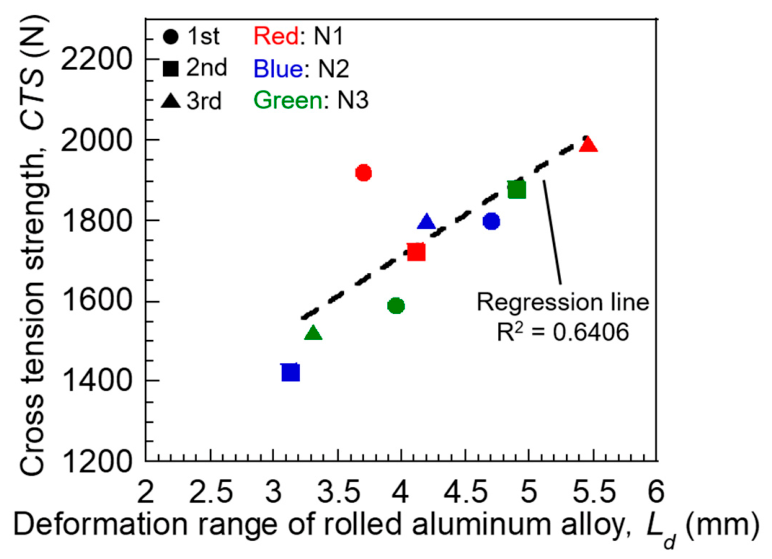
Figure 12 shows the relationship between deformation range and CTS. As shown in Figure 12, CTS increased with increasing deformation range of the rolled aluminum alloy.
Figure 12.
Relationship between the deformation range of rolled aluminum alloy and CTS. Circles indicate the first set, squares indicate the second set, and triangles indicate the third set; red indicates the first joint in each set, blue indicates the second joint, and green indicates the third joint.
3.5. Equivalent Plastic Strain Distribution
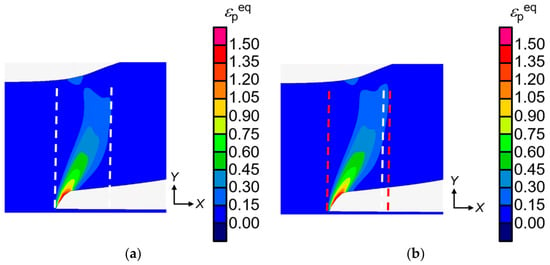
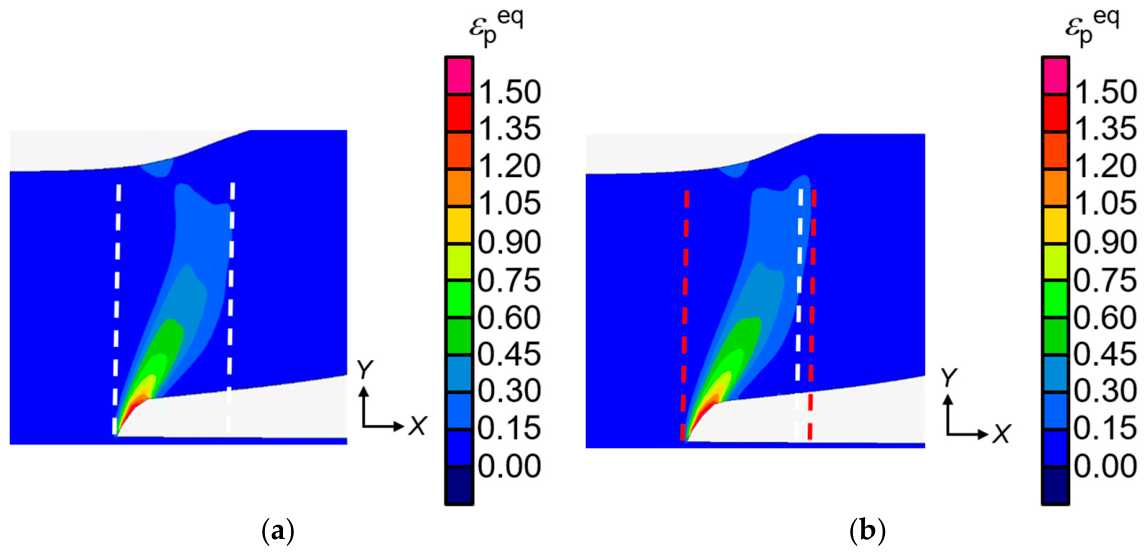
Figure 13 shows the distribution of equivalent plastic strain. Figure 13a represents a model with a reduced deformation range of the rolled aluminum alloy, while Figure 13b represents a model with an expanded deformation range. Compared with the reduced deformation range model, the expanded deformation range model exhibits a broader distribution of equivalent plastic strain extending radially within the rolled aluminum alloy.
Figure 13.
Distribution of the equivalent plastic strain: (a) reduction in the deformation range of the rolled aluminum alloy; (b) expansion in the deformation range of the rolled aluminum alloy. (The white dashed line indicates the range of equivalent plastic strain under conditions where the deformation range of the rolled aluminum alloy was reduced, while the red dashed line indicates the range of equivalent plastic strain under conditions where the deformation range of the rolled aluminum alloy was expanded).
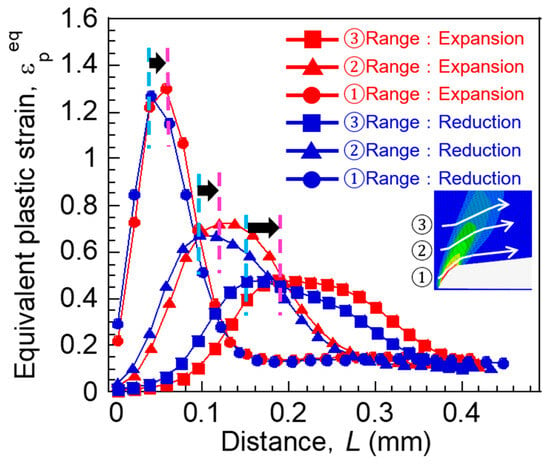
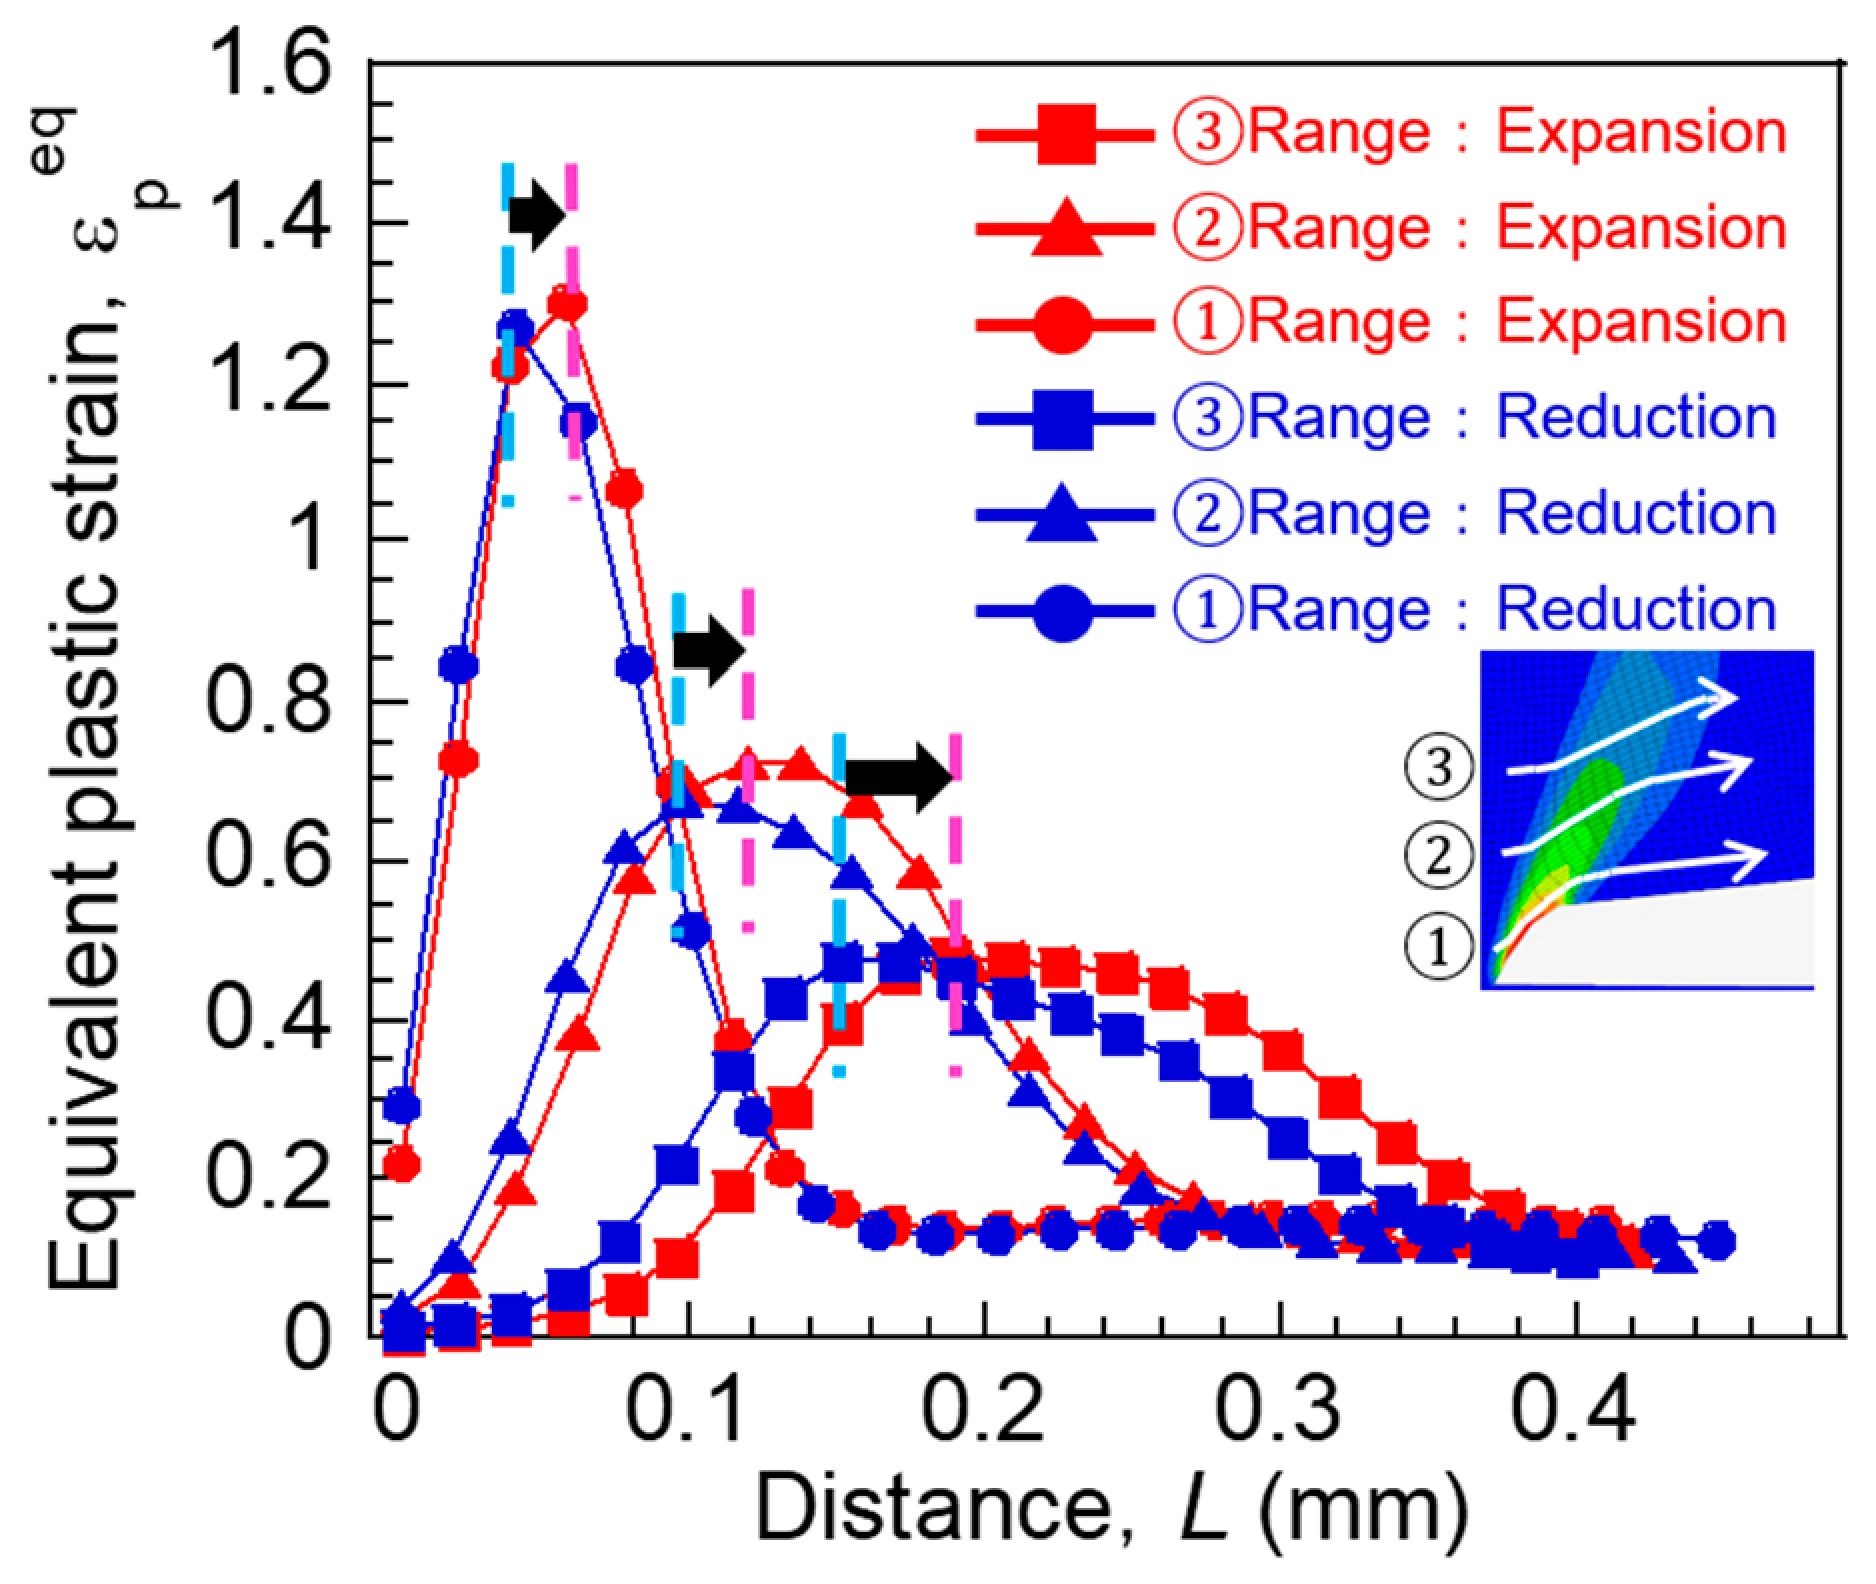
Figure 14 shows the measured equivalent plastic strain. Consistent with the simulation results, the equivalent plastic strain distribution expands radially in the model with an expanded deformation range.
Figure 14.
Equivalent plastic strain in the radial direction of the rolled aluminum alloy. The light blue dashed line indicates the point of maximum equivalent plastic strain in the model where the deformation range of the rolled aluminum alloy has been reduced, while the pink dashed line indicates the point of maximum equivalent plastic strain in the model where the deformation range of the rolled aluminum alloy has been expanded.
3.6. Crack Propagation Behavior
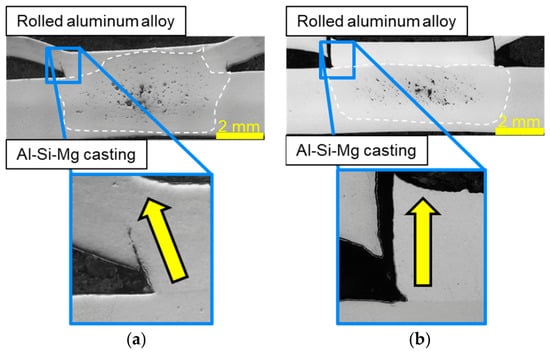
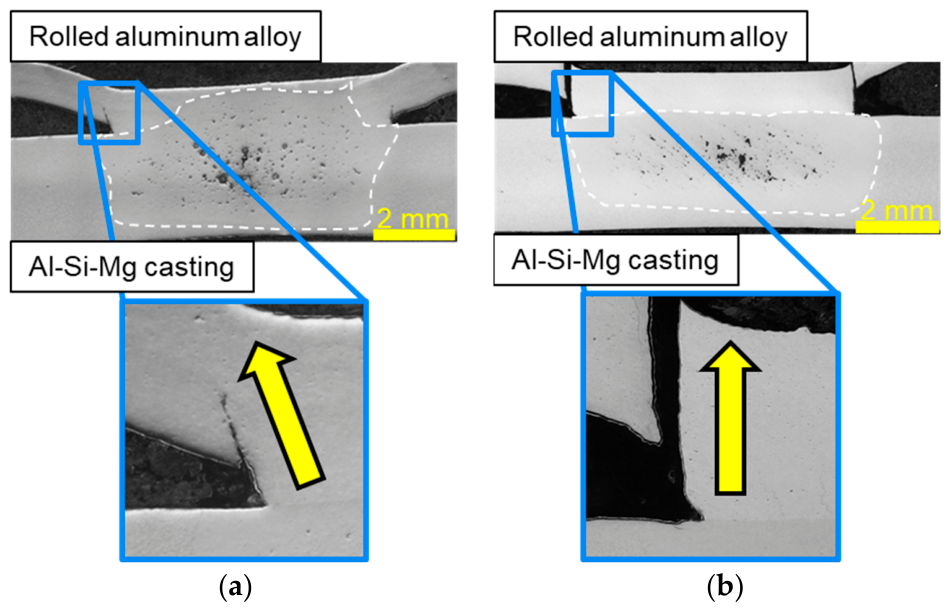
Figure 15 shows the region near the fracture surface after the cross-tension test. In the N1 condition, where the deformation range of the rolled aluminum alloy is larger, the crack propagates diagonally into the base metal, as shown in Figure 15a. In contrast, under the N2 condition, where the deformation range is smaller, the crack propagates perpendicular to the joint interface, as shown in Figure 15b.
Figure 15.
Cross-sectional observation near the fracture site of the rolled aluminum alloy: (a) a joint in which the deformation range of the rolled aluminum alloy is assumed to have increased; (b) a joint in which the deformation range of the rolled aluminum alloy is assumed to have decreased. (The arrows indicate the direction of crack propagation).
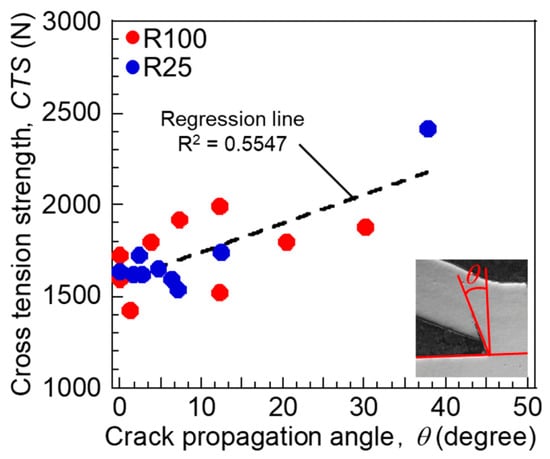
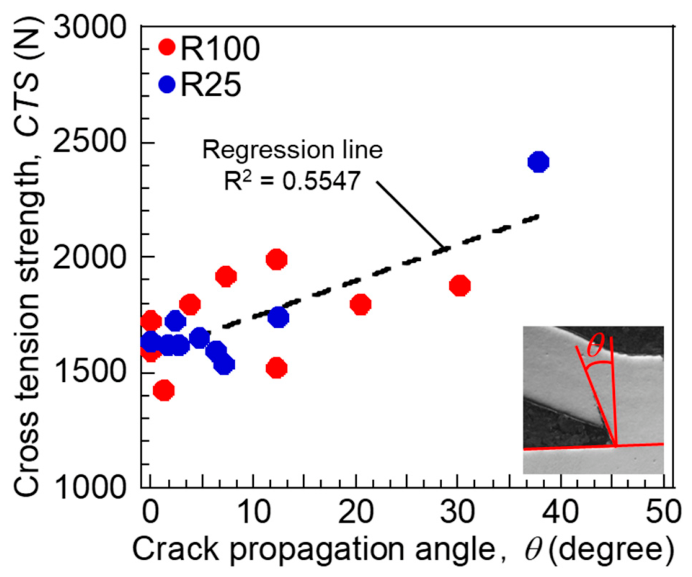
The relationship between crack propagation angle and CTS is shown in Figure 16. CTS increases with increasing crack propagation angle, indicating a strong correlation between crack propagation behavior and joint strength. These results suggest that the deformation range of the rolled aluminum alloy affects CTS through its influence on crack propagation behavior. In particular, the crack propagation angle tended to increase with increasing deformation range of the rolled aluminum alloy. However, optimization of the crack propagation angle through welding parameter control is still under investigation. Furthermore, additional experimental results and statistical validation are required to further confirm the validity of the findings in this study.
Figure 16.
Relationship between the crack propagation angle and CTS.
4. Conclusions
This study clarifies the factors governing joint strength in RSW joints between aluminum casting alloy and rolled aluminum alloy. The relationship between fracture morphology and joint characteristics was systematically investigated, and the main findings are summarized as follows:
- It was found that the cross-tension strength increased at N1 under both the R100 type and R25 type conditions;
- It was found that there is a weak correlation between plug diameter, penetration into the rolled aluminum alloy, and CTS;
- It was found that as the deformation range of the rolled aluminum alloy expanded, the distribution of corresponding equivalent plastic strain expanded in the radial direction of the rolled aluminum alloy;
- CTS increases as the crack propagation angle increases;
- The deformation range of the rolled aluminum alloy was found to strongly influence CTS.
Author Contributions
Conceptualization, N.T. and M.I.; methodology, N.T. and M.I.; validation, N.T., S.S., T.M., K.K., Y.W., T.T. and M.I.; investigation, N.T., S.S., T.M., K.K., Y.W., T.T. and M.I.; data curation, N.T. and S.S.; writing–original draft preparation, N.T.; writing–review and editing, N.T.; supervision, M.I.; project administration, M.I.; funding acquisition, M.I. All authors have read and agreed to the published version of the manuscript.
Funding
This research was funded by Nissan Moto Co., Ltd. through a collaborative research agreement with Osaka Institute of Technology.
Institutional Review Board Statement
Not applicable.
Informed Consent Statement
Not applicable.
Data Availability Statement
No new data were created or analyzed in this study. Data sharing is not applicable to this article.
Conflicts of Interest
This research was conducted as part of a collaborative research project funded by Nissan Motor Co., Ltd. Takeshi Matsukage, Keisuke Kinoshita, Yufu Watanabe and Taishi Tarui is employees of Nissan Motor Co., Ltd. Nissan Motor Co., Ltd. was involved in the study design, interpretation of the results, and review of the manuscript. The other authors declare no conflicts of interest.
References
- Anami, T. Aluminum applications for automotive body and next generation automobiles. Surf. Finish. Soc. Jpn. 2016, 6, 639–643. [Google Scholar] [CrossRef] [Scilit]
- Miller, W.S.; Zhuang, L.; Bottema, J.; Wittebrood, A.J.; De Smet, P.; Haszler, A.; Vieregge, A. Recent development in aluminium alloys for the automotive industry. Mater. Sci. Eng. A 2000, 280, 37–49. [Google Scholar] [CrossRef] [Scilit]
- Baser, T.A.; Umay, E.; Akinci, V. New trends in aluminum die casting alloys for automotive applications. Eurasia Proc. Sci. Technol. Eng. Math. 2022, 21, 79–87. [Google Scholar] [CrossRef] [Scilit]
- Xu, H.; Zhao, M.; Wang, R.; Han, L.; Cheng, X.; Fang, Y. The role of element segregation in the fracture mechanism and performance of spot-welded AlSi7MnMg aluminum alloy joints. Materials 2026, 19, 747. [Google Scholar] [CrossRef] [Scilit] [PubMed]
- Akihiro, H.; Kobayashi, K. Welding and joining processes for automobiles. Jpn. Inst. Light Met. 2006, 3, 184–188. [Google Scholar] [CrossRef] [Scilit]
- Wang, Y.; Yang, S. Effects of electrode combinations on RSW of 5182-O/AlSi10MnMg aluminum. Weld. J. 2022, 101, 54–66. [Google Scholar] [CrossRef] [Scilit]
- Epperlein, M.; Schiebahn, A.; Reisgen, U. Resistance spot welding of die-cast and wrought alloys: Improving weld spot quality through parameter optimization. Weld. World 2025, 69, 531–553. [Google Scholar] [CrossRef] [Scilit]
- Matsukage, T.; Tarui, T.; Iyota, M. Joining Mechanism of Resistance Spot Welded Joints of Aluminum Casting Alloy and 6000 Series Rolled Aluminum Alloy. Jpn. Weld. Soc. 2024, 3, 132–141. [Google Scholar] [CrossRef] [Scilit]
- JIS Z 3137; Specimen Dimensions and Procedure for Cross Tension Testing Resistance Spot and Embossed Projection Welded Joints. Japanese Standards Association: Tokyo, Japan, 2025.
- Cheng, J.; Song, G.; Zhang, X.; Liu, C.; Liu, L. Review of techniques for improvement of softening behavior of age-hardening aluminum alloy welded joints. Materials 2021, 14, 5804. [Google Scholar] [CrossRef] [Scilit] [PubMed]
- Yang, Q.; Liu, X.; Liu, Y.; Fan, X.; Shu, M. The flow softening behavior and deformation mechanism of AA7050 aluminum alloy. Mater. Trans. 2019, 60, 2041–2047. [Google Scholar] [CrossRef] [Scilit]

Disclaimer/Publisher’s Note: The statements, opinions and data contained in all publications are solely those of the individual author(s) and contributor(s) and not of MDPI and/or the editor(s). MDPI and/or the editor(s) disclaim responsibility for any injury to people or property resulting from any ideas, methods, instructions or products referred to in the content. |
© 2026 by the authors. Licensee MDPI, Basel, Switzerland. This article is an open access article distributed under the terms and conditions of the Creative Commons Attribution (CC BY) license.