


Abstract
This study examines the influence of the dynamic pressure control parameter in the nozzle during melt deposition onto the build platform (k-Factor), also known as Linear Advance or Pressure Advance in different firmware implementations, on the quality of parts produced using the Fused Deposition Modeling (FDM) technology. The investigation was conducted based on printed test specimens made from Ingeo Biopolymer 4043D, with k-Factor values varied in the range of 0.01 to 0.20 under comparable process conditions. Dimensional measurements were performed along the X and Y axes, and visual analysis was carried out to identify defects in the specimens. The results from statistical analysis and visual inspection reveal a clear correlation between the k-Factor value and part quality. An optimal balance between dimensional and geometric stability was achieved at k-Factor = 0.04, identifying it as a suitable value for the material and process conditions used.
1. Introduction
Additive manufacturing represents a production paradigm based on the layer-by-layer deposition of material to create geometrical objects with a high degree of customization. Among the numerous technologies, Fused Deposition Modeling (FDM) is one of the most preferred due to its cost-effectiveness, accessibility, and flexibility with regard to the thermoplastic materials used. Various sectors such as automotive engineering, education and science, medicine, aviation, and others employ FDM technology for the creation of prototypes or functional components [1,2].
The improvement in the quality of parts produced through FDM remains one of the key factors for enhancing the industrial applicability of the technology. Due to the numerous parameters influencing the printing process, it is essential to select them appropriately in order to achieve optimal results [3,4,5,6,7,8].
In an effort to reduce production time, increased printing speeds are often employed, which can lead to a deterioration in geometric accuracy and mechanical properties, and in some cases, even to print failure. This occurs due to a disruption in the synchronization between the time required to melt the plastic filament, the speed of the material feed system, and the time lag between the application of force and the response of the fluid flow, the movement of the extruder head, and the resulting inertial effects within the various systems.
Most manufacturers prefer the use of direct-drive extrusion systems over Bowden systems due to the improved control over the generated pressure. In direct-drive extruders, the shorter distance between the motor and the nozzle (typically between 5 and 15 cm) minimizes the elastic buildup in the filament, which is commonly observed in Bowden extruders, where the longer distance between the feeding mechanism and the nozzle (usually between 30 and 60 cm) delays pressure changes [9,10,11].
Most widely known firmware implementations include a compensation parameter (k-Factor, also known as Linear Advance in Marlin Firmware or Pressure Advance in Klipper Firmware), which controls the buildup of pressure inside the nozzle by adapting to the printing parameters [12,13,14,15,16]. When the printing speed changes, the pressure in the nozzle does not adjust instantaneously due to the inertial effects within the material feeding system. This necessitates compensation through correction mechanisms, such as:
- During acceleration of linear movements, the amount of extruded material is preemptively increased;
- During deceleration, the amount of extruded material is reduced, preventing excessive extrusion.
Proper calibration of the k-Factor is essential for achieving high print quality, especially in complex geometries with frequent changes in movement direction and translational speeds [17].
Its influence is significant on the quality of printed parts, as its effects can manifest in various ways—including the shape and dimensional accuracy of the part, surface irregularities or increased porosity, poor interlayer adhesion, reduced mechanical strength, susceptibility to thermal deformation, the emergence of internal localized stresses, and more [18,19,20,21,22,23].
2. Materials and Methods
This study aims to determine the changes in the quality of 3D-printed parts made from PLA material Ingeo Biopolymer 4043D, produced by NatureWorks, (NatureWorks, Plymouth, MN, USA) as a result of varying the value of the k-Factor parameter. Dimensional values and the geometric shape of the printed test specimens have been selected as the control parameters.
2.1. Analysis Parameters
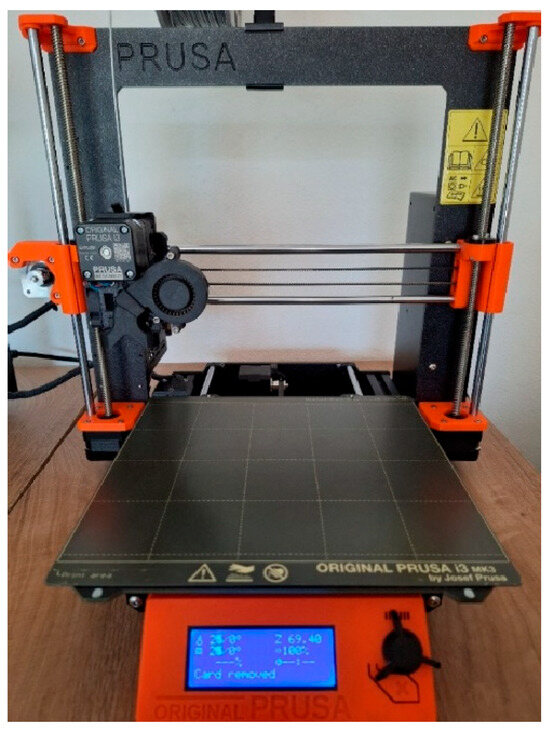
All specimens were printed on a Prusa MK3S+ 3D printer (Prusa Research, Prague, Czech Republic) equipped with a direct-drive extruder (Figure 1), using firmware version 3.14.1-8237 and a compensation parameter (k-Factor) of 1.5. This algorithm allows for more precise extruder operation compared to version 1.0, in which pressure fluctuations could be observed. Printing was carried out at an ambient temperature of 20 °C (±1 °C). The dimensions of the test specimens are 20 × 40 × 0.40 mm, selected in accordance with the technical specifications of the stepper motors used in the Prusa model—specifically, NEMA17 with 1.8° step angle. These dimensions are intended to ensure the extruder head reaches the designated maximum movement speed. The range of k-Factor values examined in this study spans from 0.01 to 0.20, with increments of 0.01. Table 1 presents the manufacturer’s recommended printing temperature values, while Table 2 outlines the process parameters defined for the investigation.
Figure 1.
Prusa MK3S+ 3D printer [24].
Table 1.
Recommended temperature settings [25].
Table 2.
Process parameters for analysis.
2.2. Methodology
For each value of the k-Factor parameter, 10 test specimens were printed and measured using a caliper with a Maximum Permissible Error of ±0.02 mm.
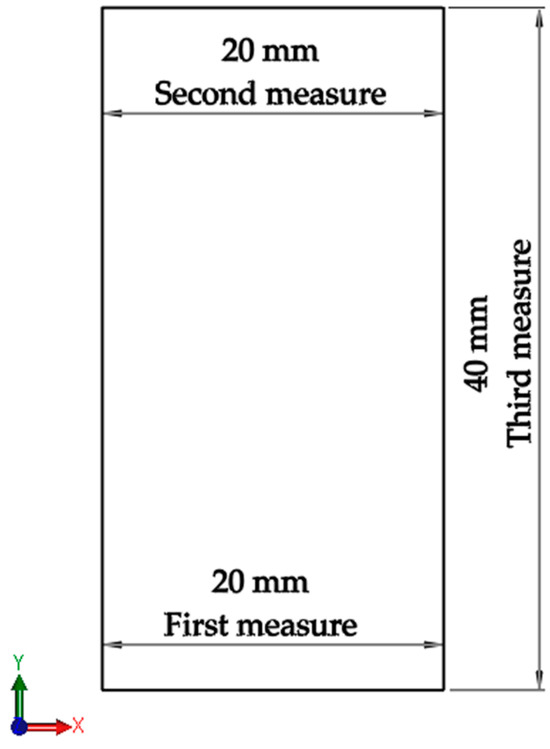
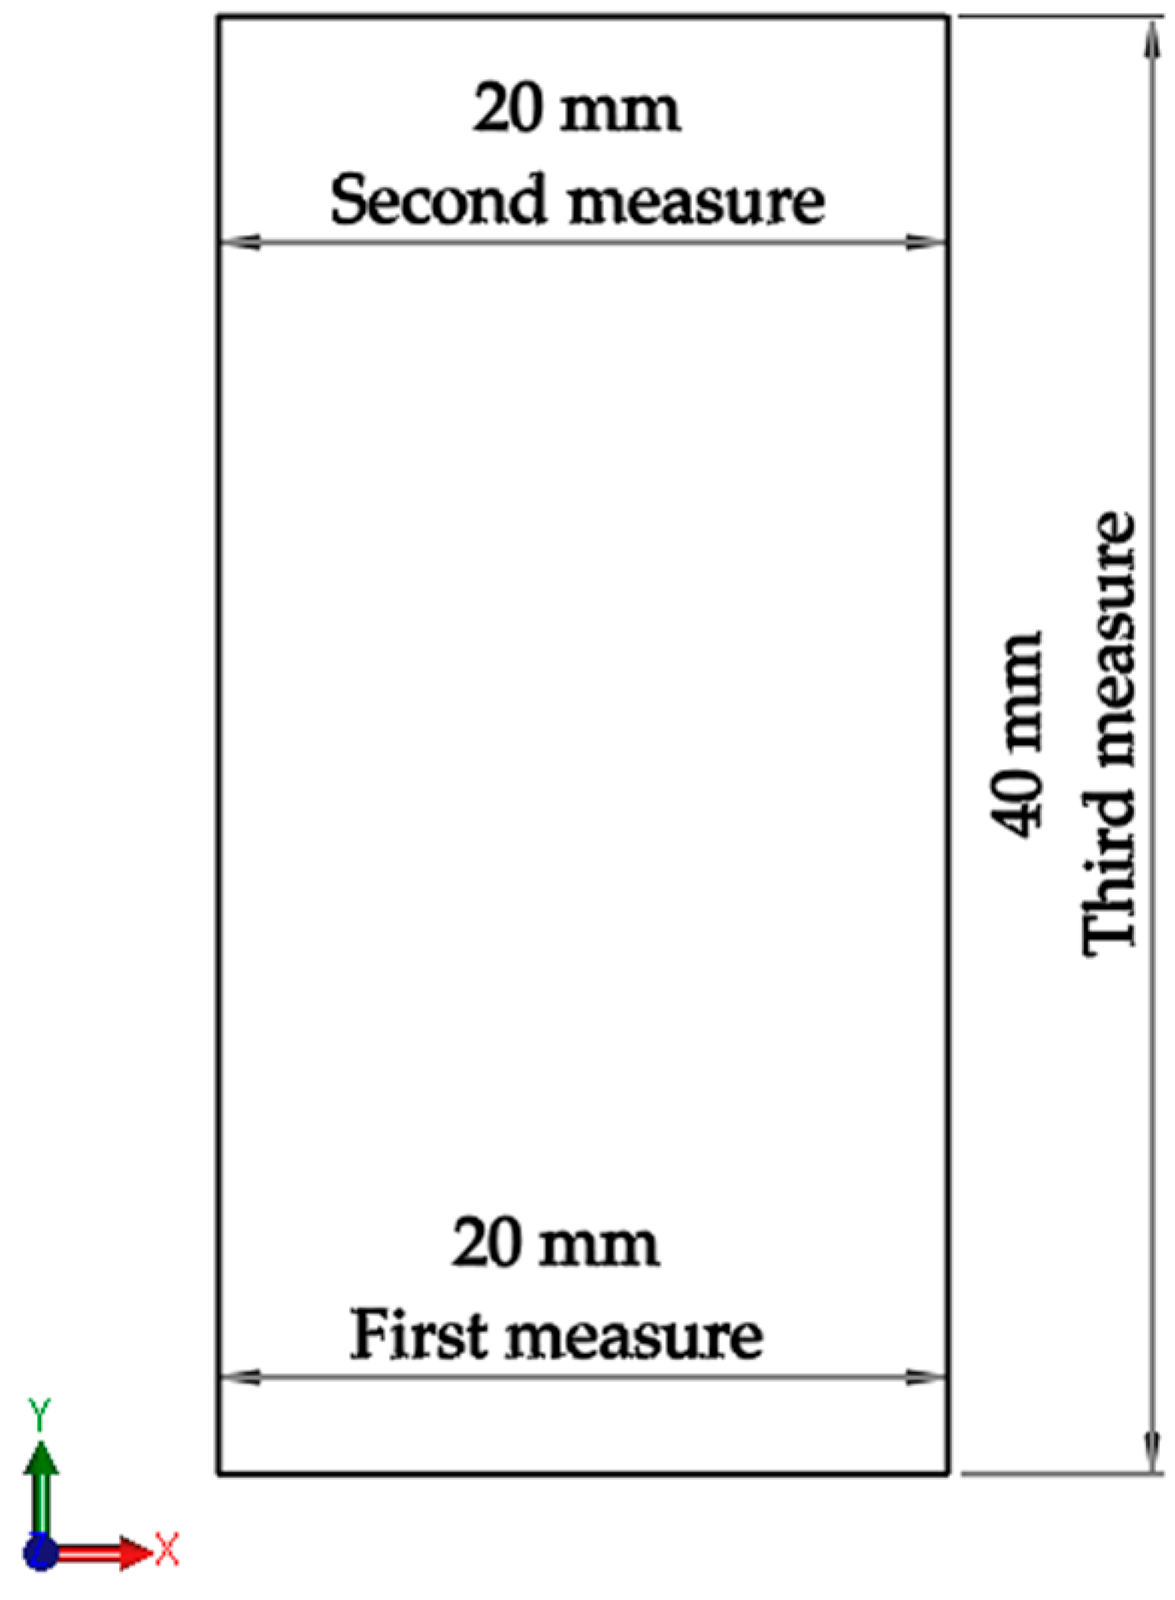
The parameters examined in this study include the geometric dimensions and shape of the printed parts, specifically the deviation from nominal dimensions along the X and Y axes and the absolute error. Regarding shape, visual changes or defects on the printed parts were monitored. Three measurements were taken for each test specimen—two along the X direction and one along the Y direction (Figure 2). Averaged values were used in the analysis to eliminate random measurement errors.
Figure 2.
Sequence of measurements.
After performing the measurements and recording the data along the different axes for each group of test specimens, the information was consolidated into a summary table. This table contains the sum of the averaged absolute errors and the combined standard deviation.
In addition to the described procedure, the experimental methodology follows a controlled single-factor design, where the k-Factor is the only variable parameter, while all other process conditions are kept constant. This approach ensures that the observed variations in the results can be directly attributed to the influence of the k-Factor.
To improve the reliability of the measurements, each specimen was measured multiple times, and the average values were used to minimize random errors. Furthermore, the use of ten specimens per k-Factor value allows for a representative statistical sample [19].
Data processing includes the calculation of mean deviation, mean absolute error, and combined standard deviation. These indicators are used to evaluate dimensional accuracy and process stability.
The experimental workflow can be summarized as follows:
- (1)
- preparation of printing parameters;
- (2)
- fabrication of specimens for each k-Factor value;
- (3)
- dimensional measurement;
- (4)
- data aggregation and statistical processing;
- (5)
- comparative analysis of results.
3. Results
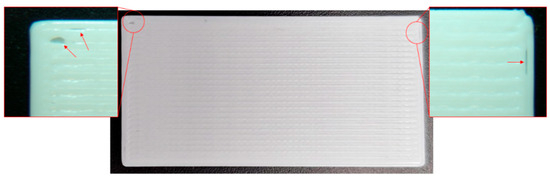
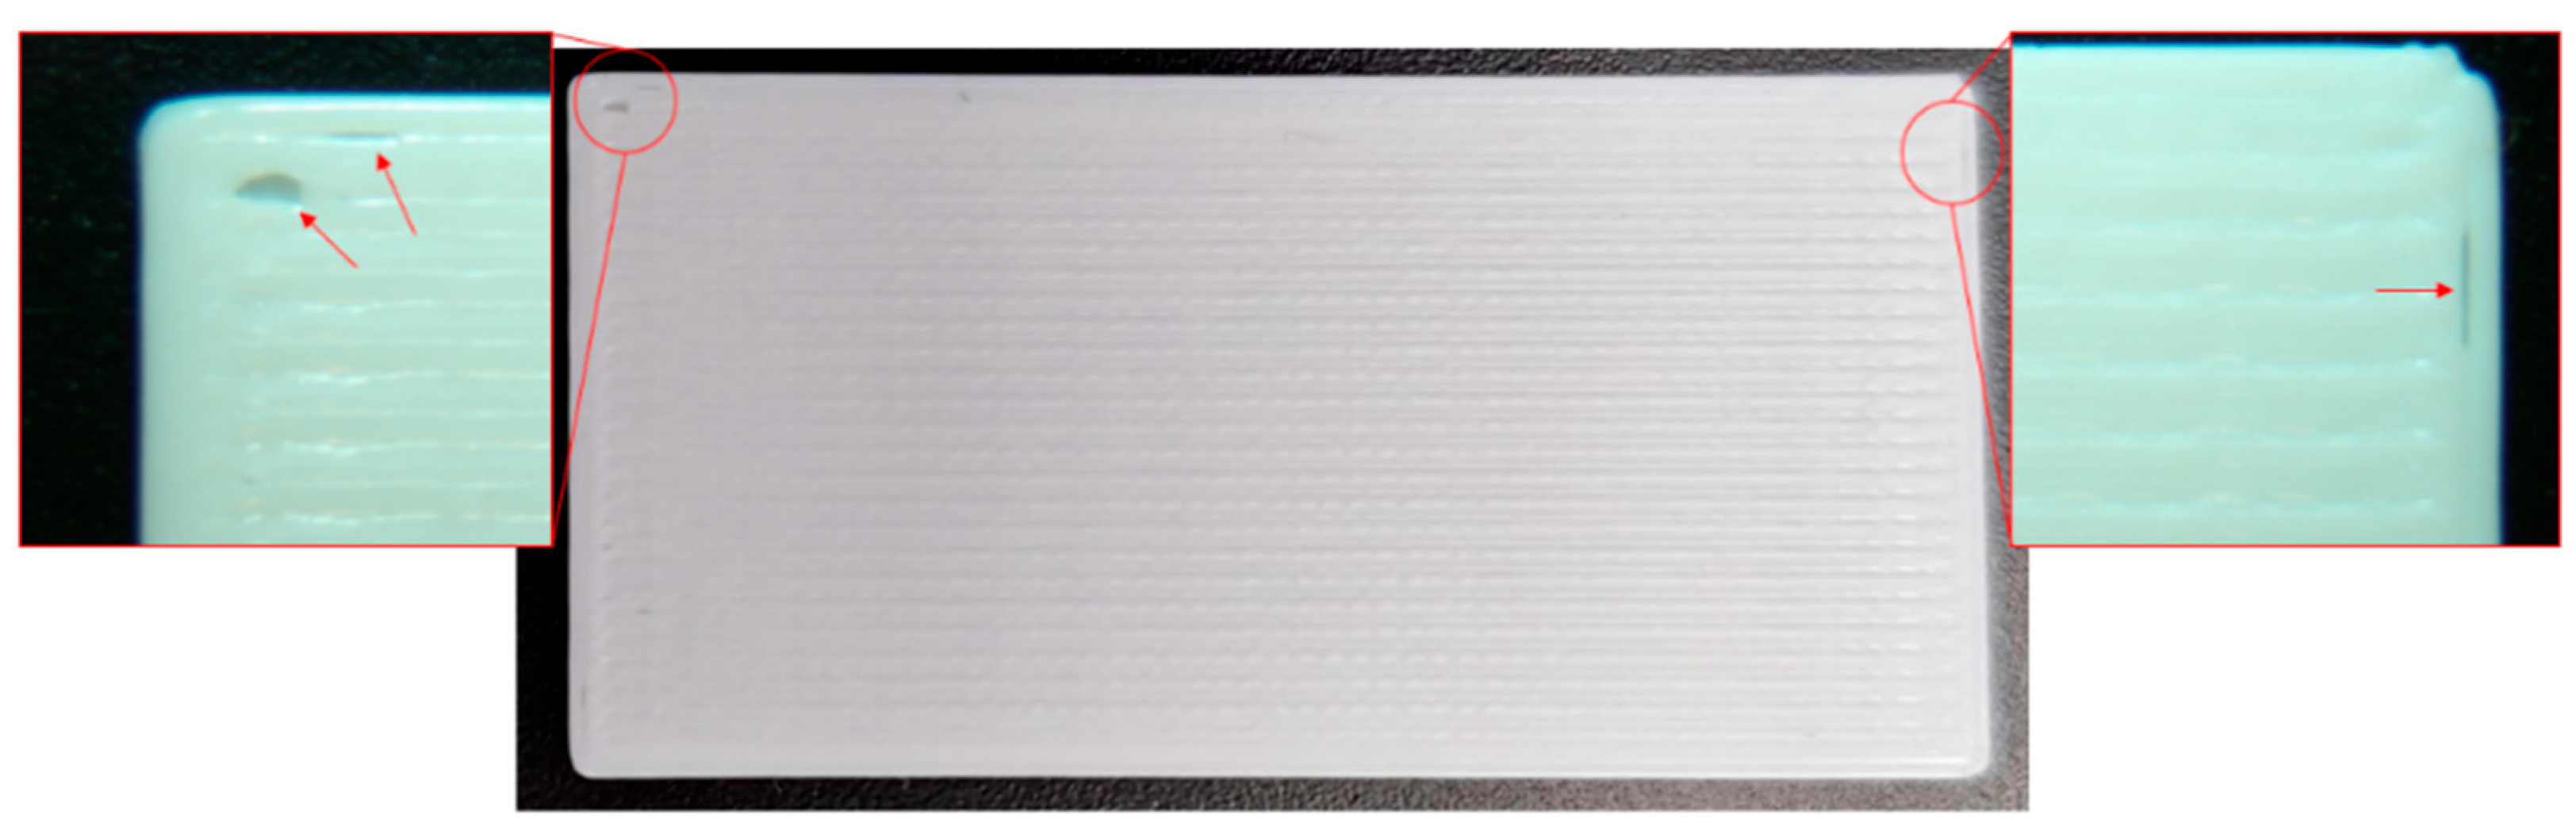
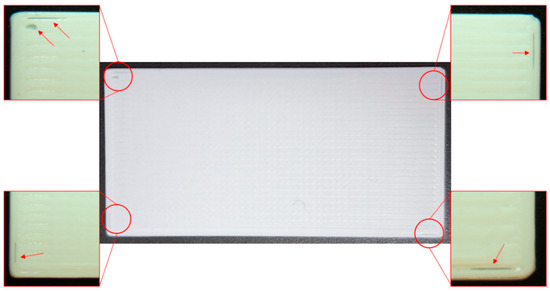
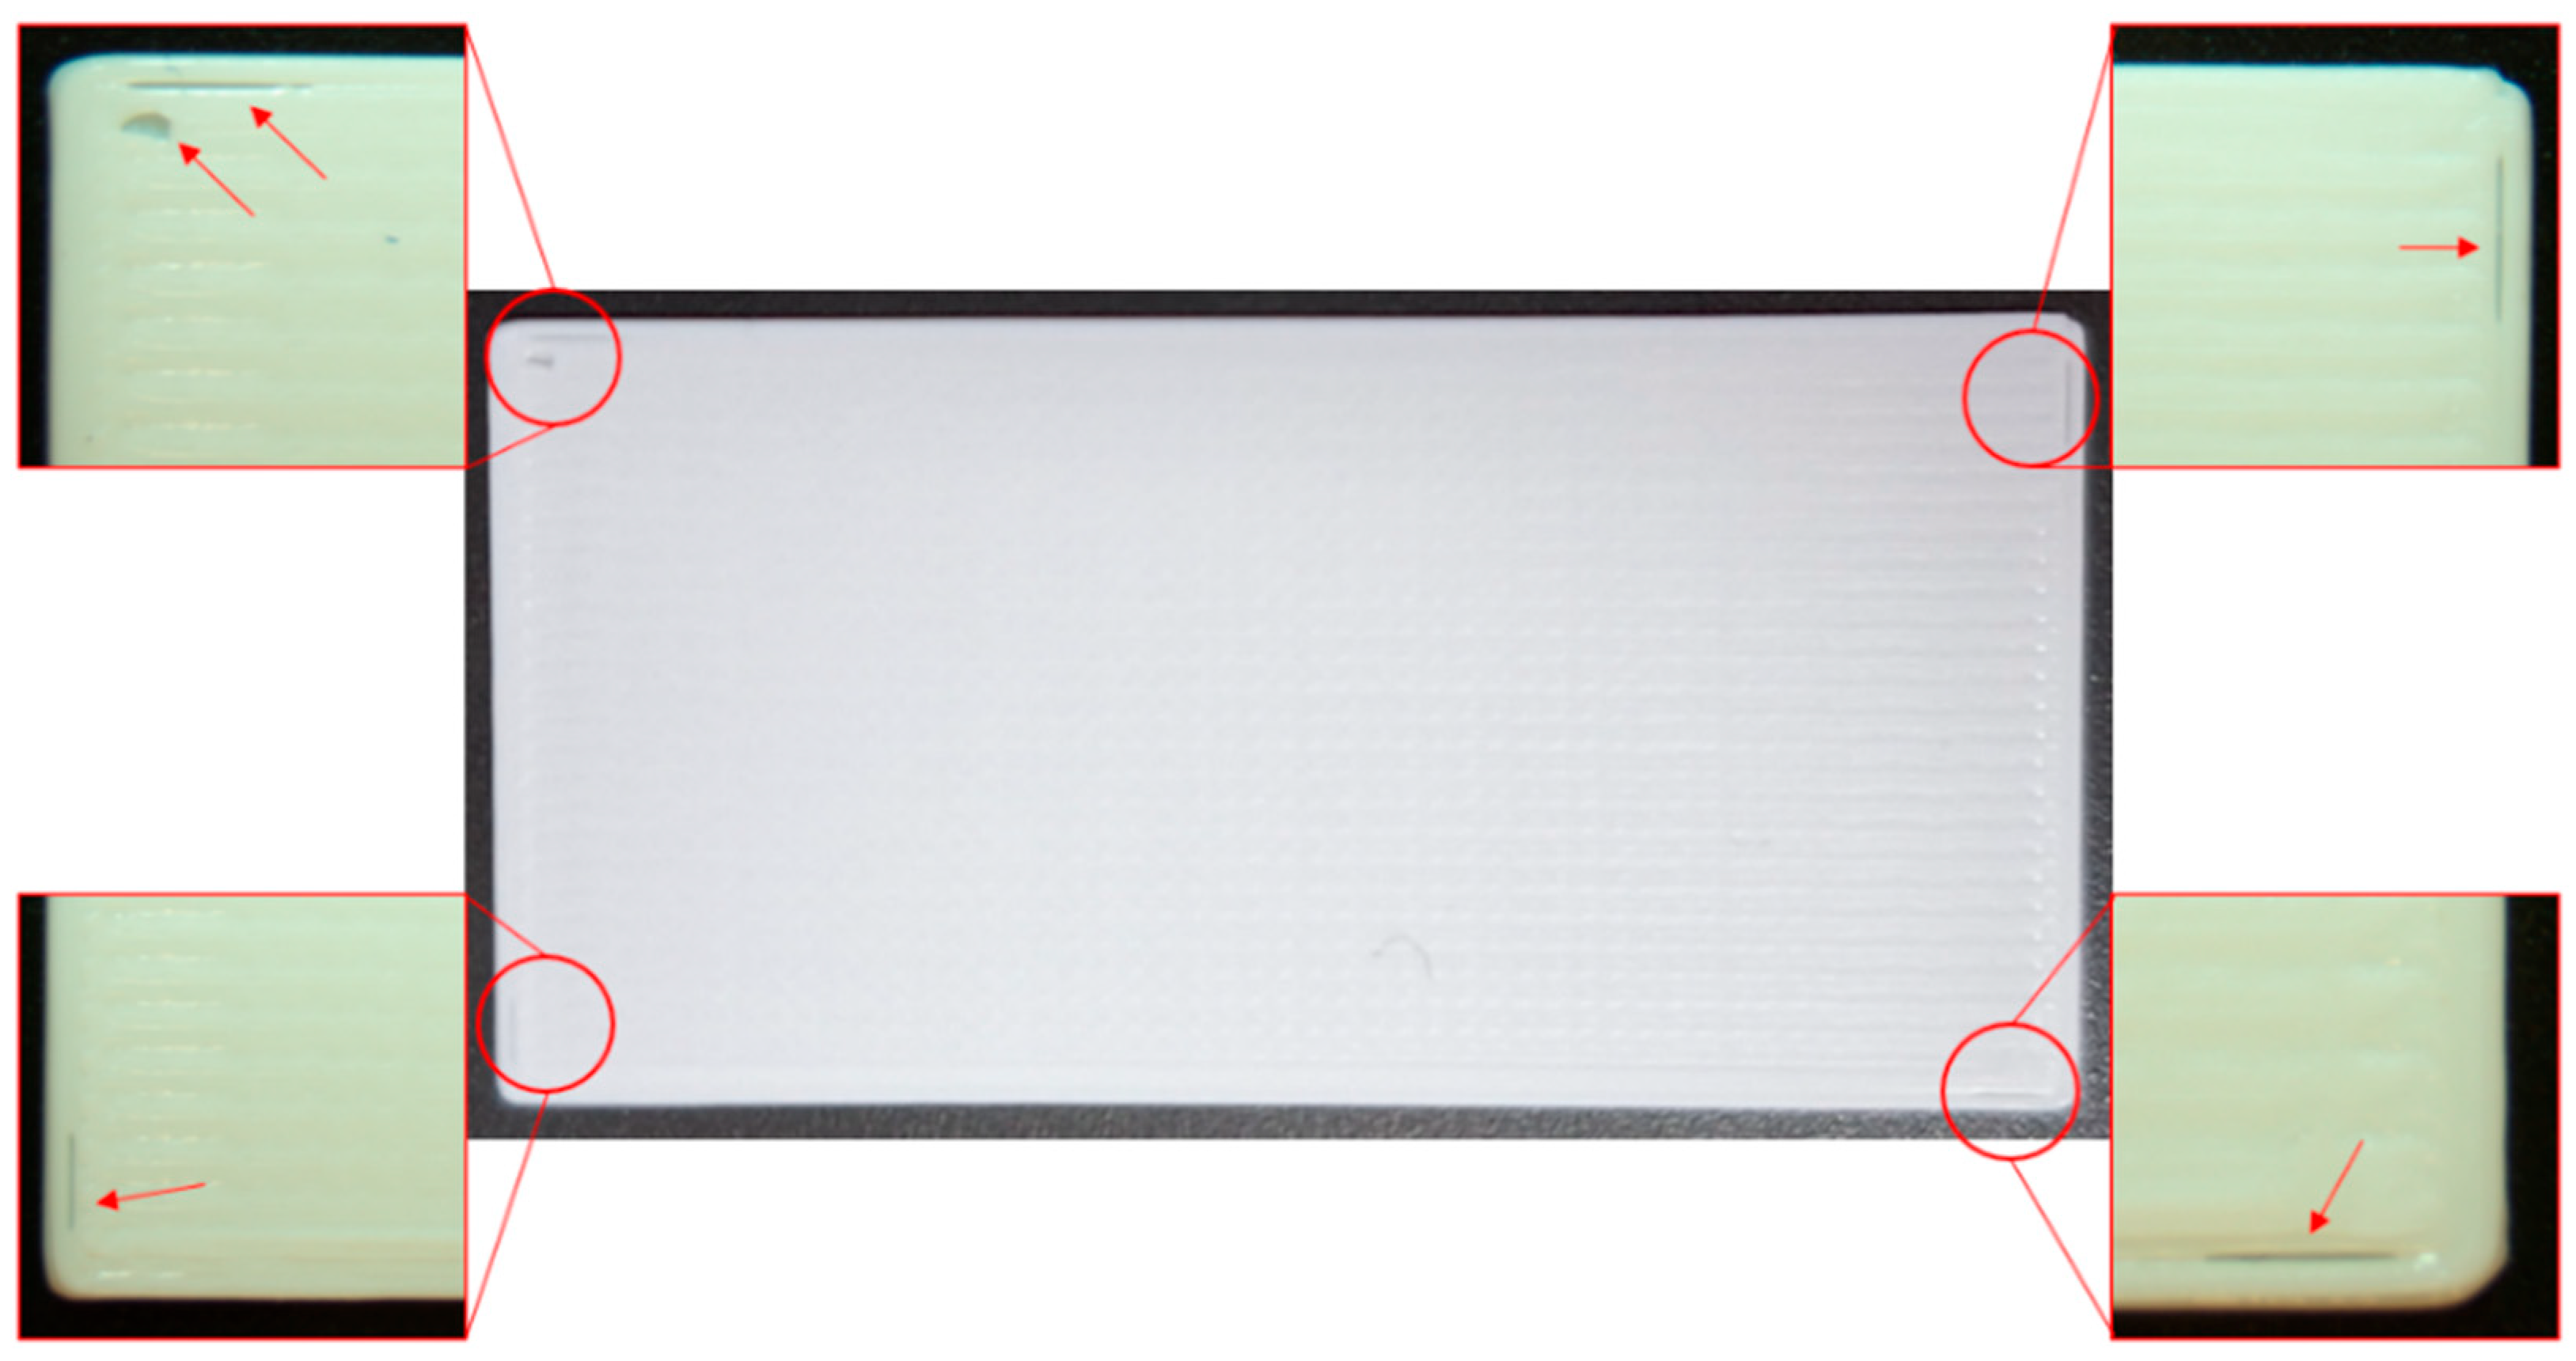
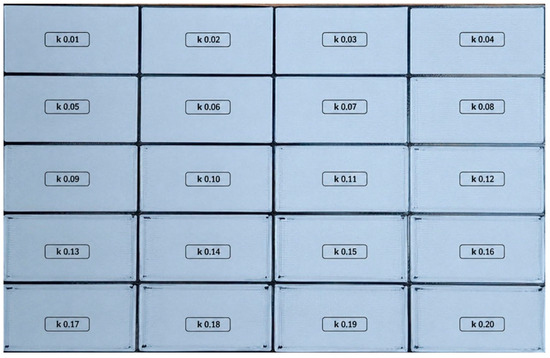
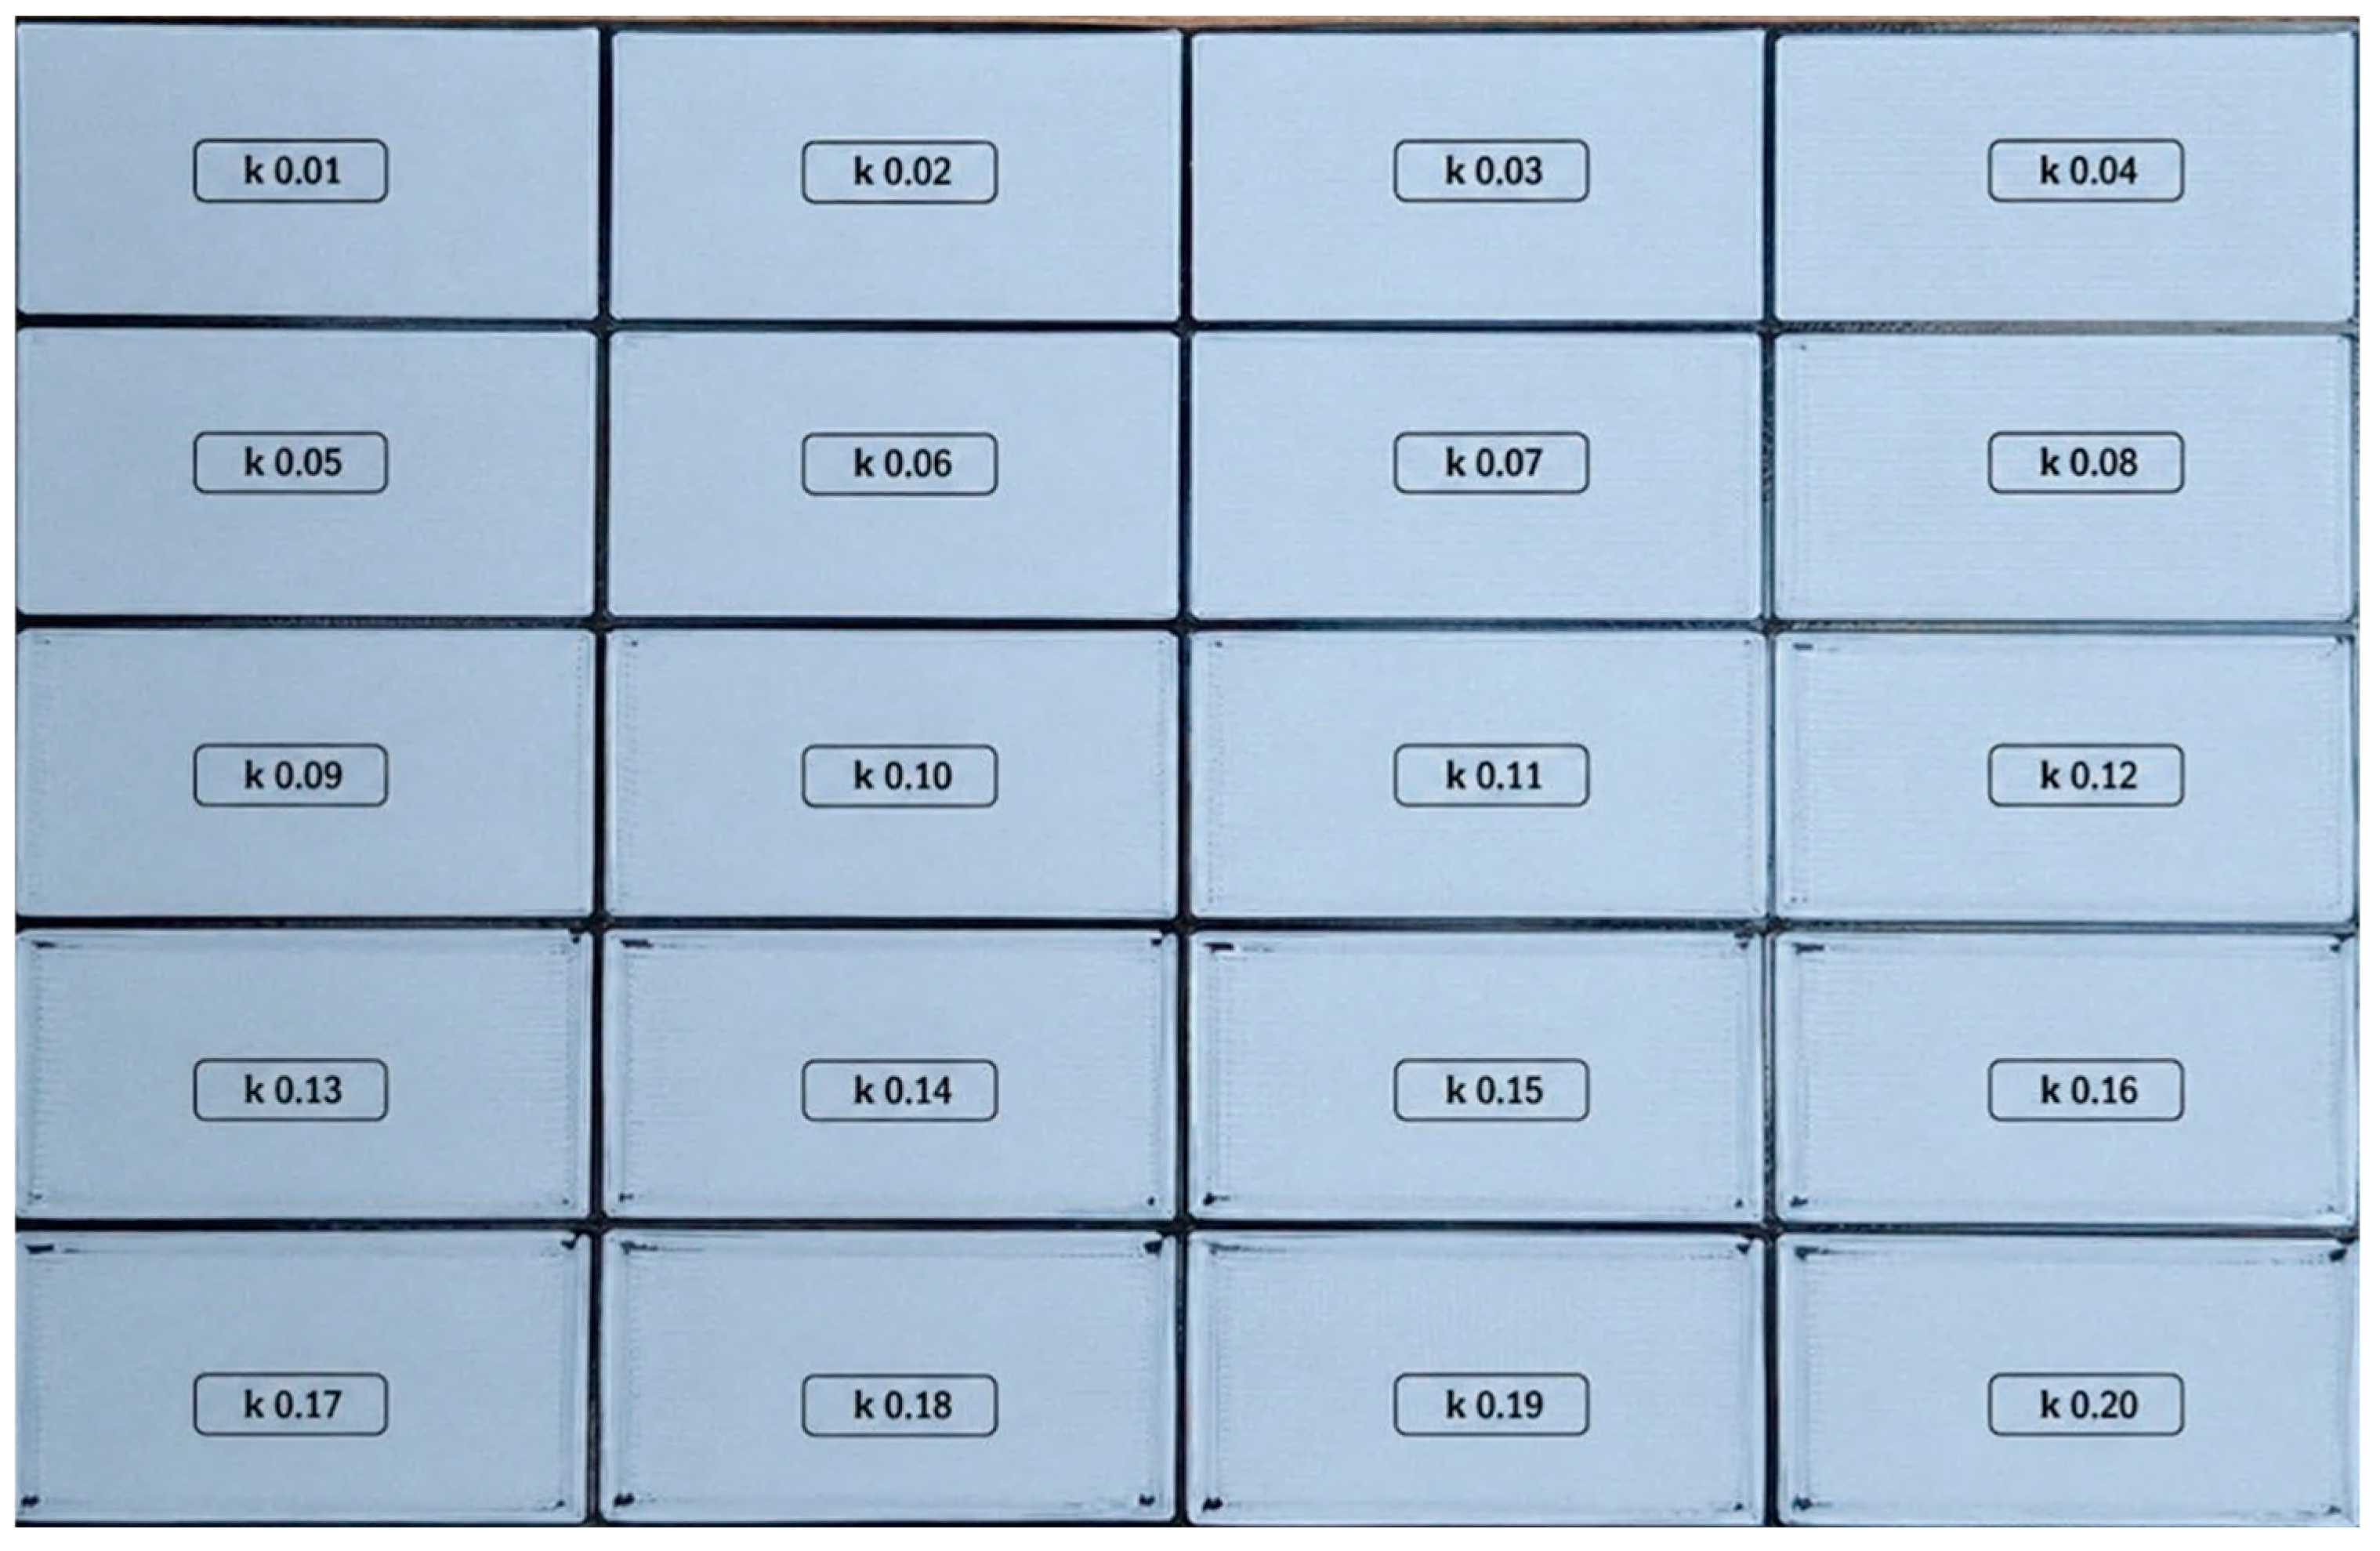
The conducted study found that when the k-Factor value exceeds 0.04, an increase in problematic areas becomes evident. Figure 3 and Figure 4 show test specimens with k-Factor values of 0.05 and 0.06, where zones of reduced quality are clearly visible. These defects are also observable in Figure 5, which presents test specimens covering the entire range of k-Factor values examined in the study.
Figure 3.
Specimen with k-Factor 0.05.
Figure 4.
Specimen with k-Factor 0.06.
Figure 5.
Specimens with different k-Factor values.
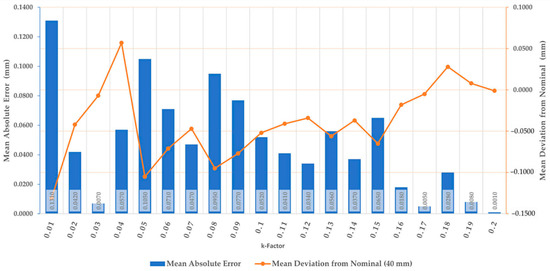
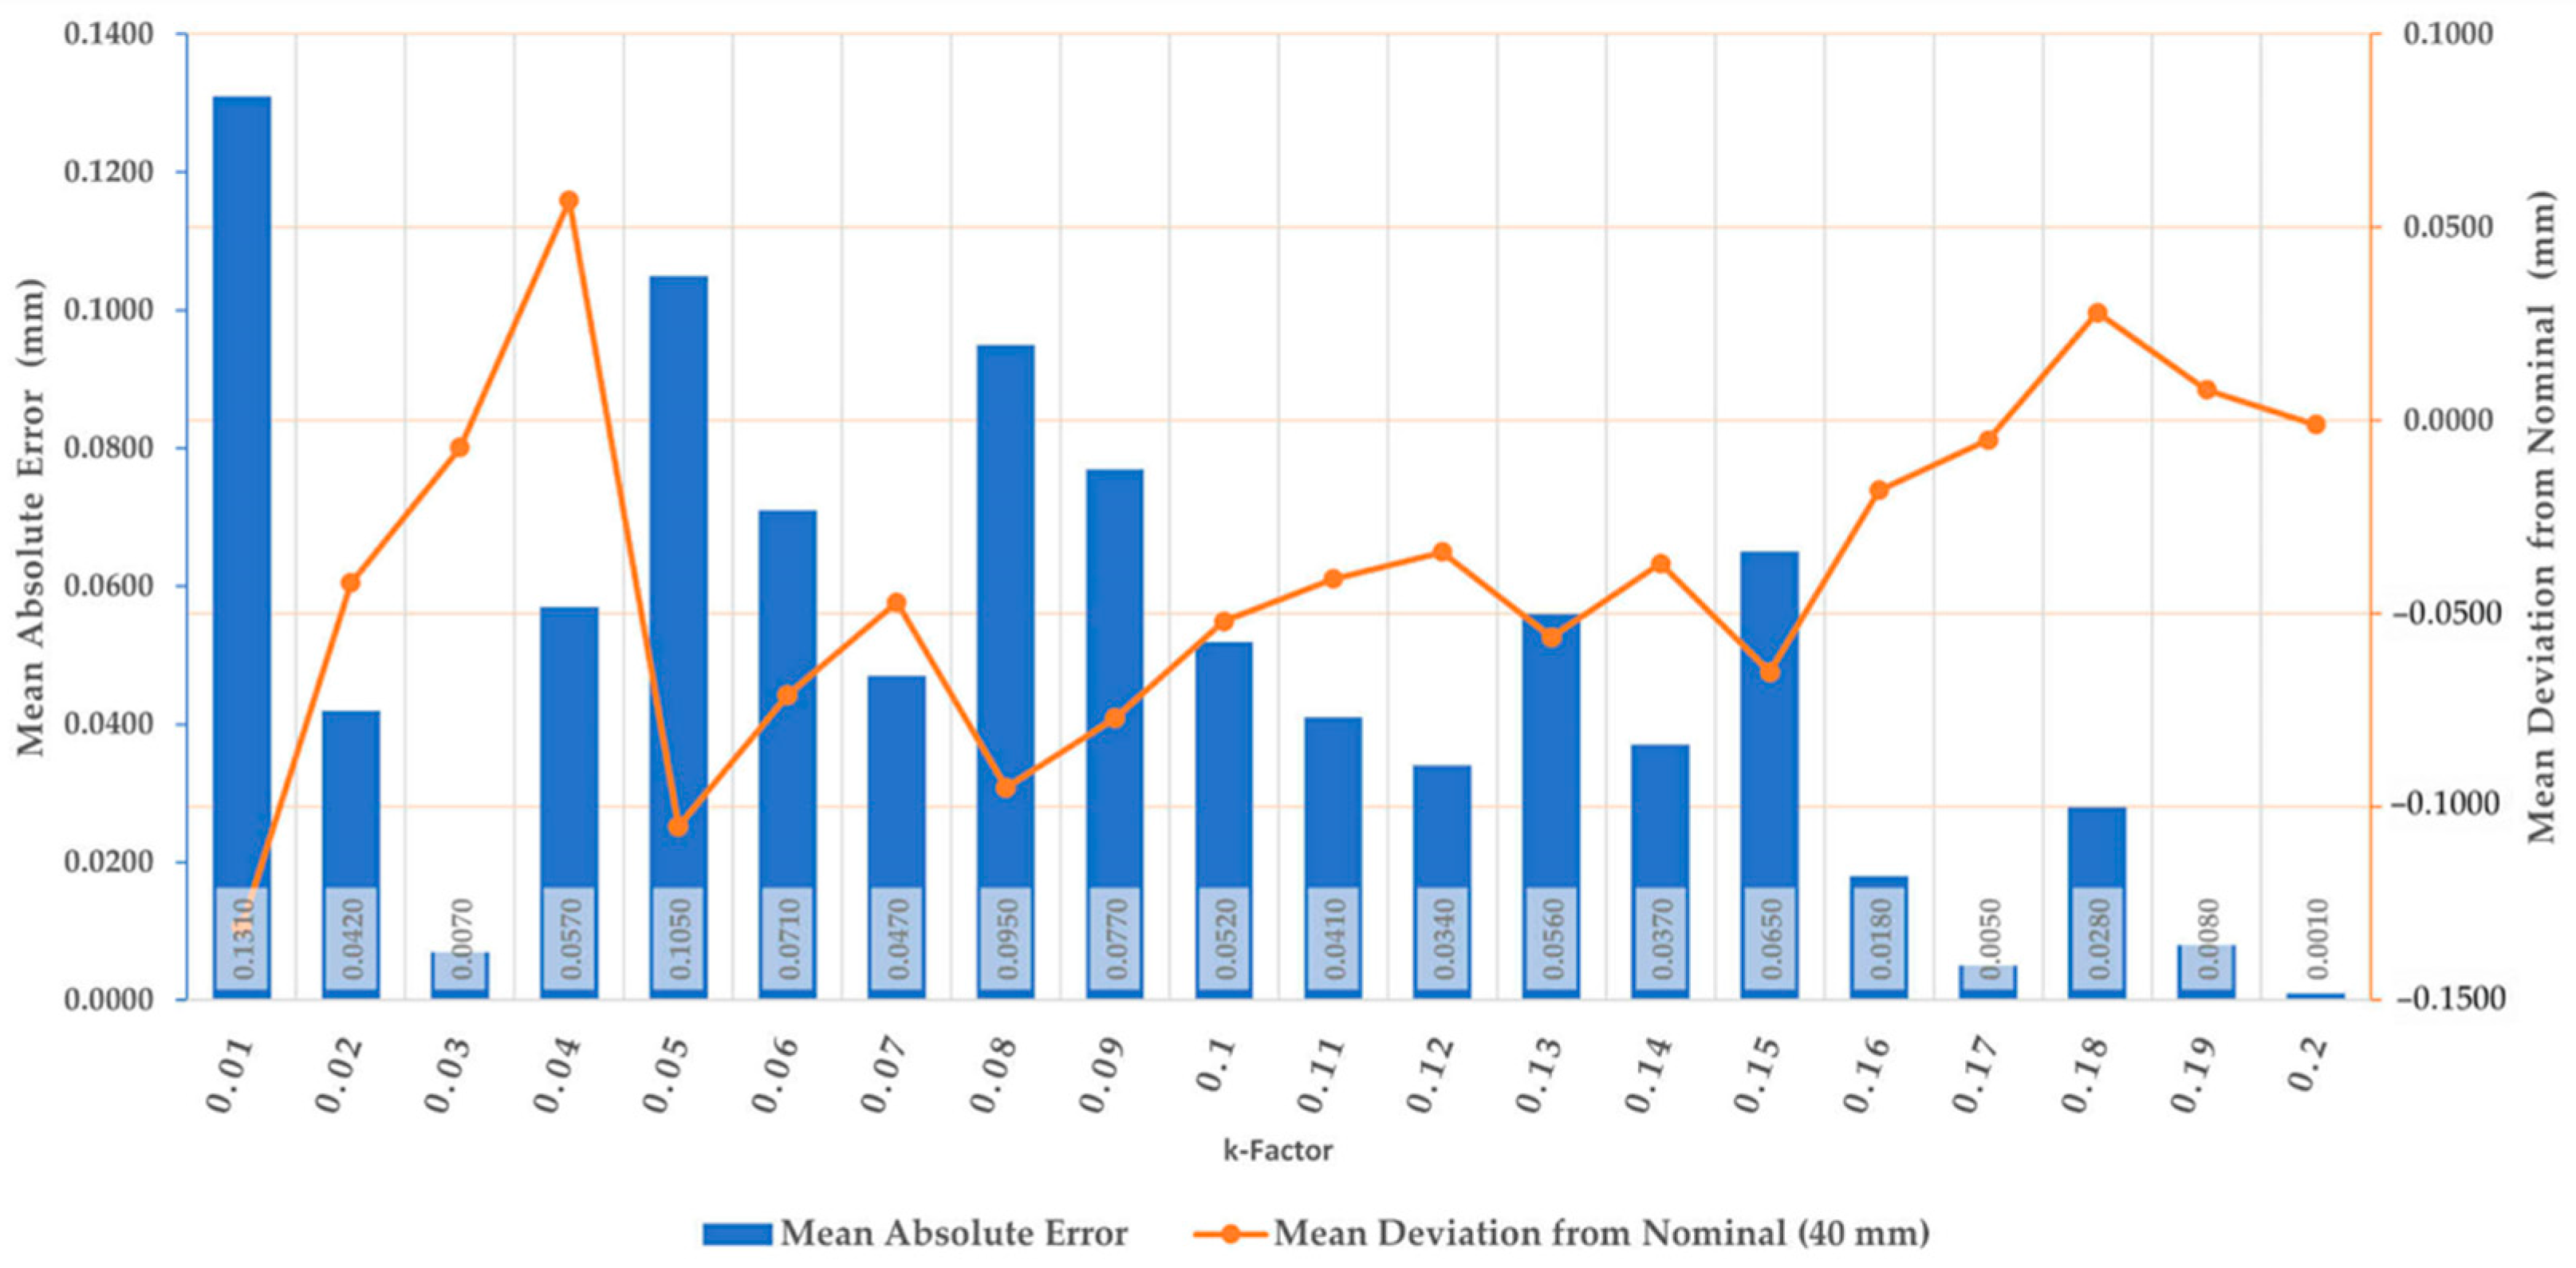
Table 3 presents the averaged measurement results for the specimen groups along the X direction, while Figure 6 shows a diagram visualizing these results.
Table 3.
The average results of the measurements of the groups in direction X.
Figure 6.
Diagram with visualization of the measurement results along.
The results indicate that the specimens with a k-Factor value of 0.04 exhibit the best performance among the tested range, showing no visible defects or changes in appearance.
Table 4 presents the measurement data along the Y direction, with the corresponding results visualized in the diagram shown in Figure 7. The data indicate that the lowest deviation along the Y axis was observed at a k-Factor value of 0.03.
Table 4.
The average results of the measurements of the groups in direction Y.
Figure 7.
Diagram with visualization of the measurement results along Y.
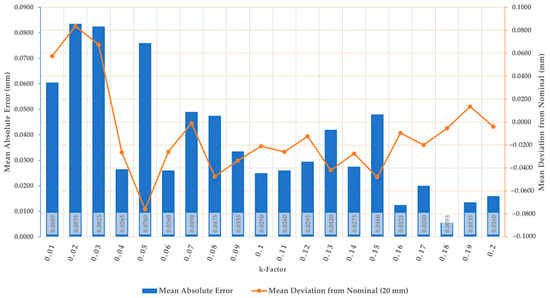
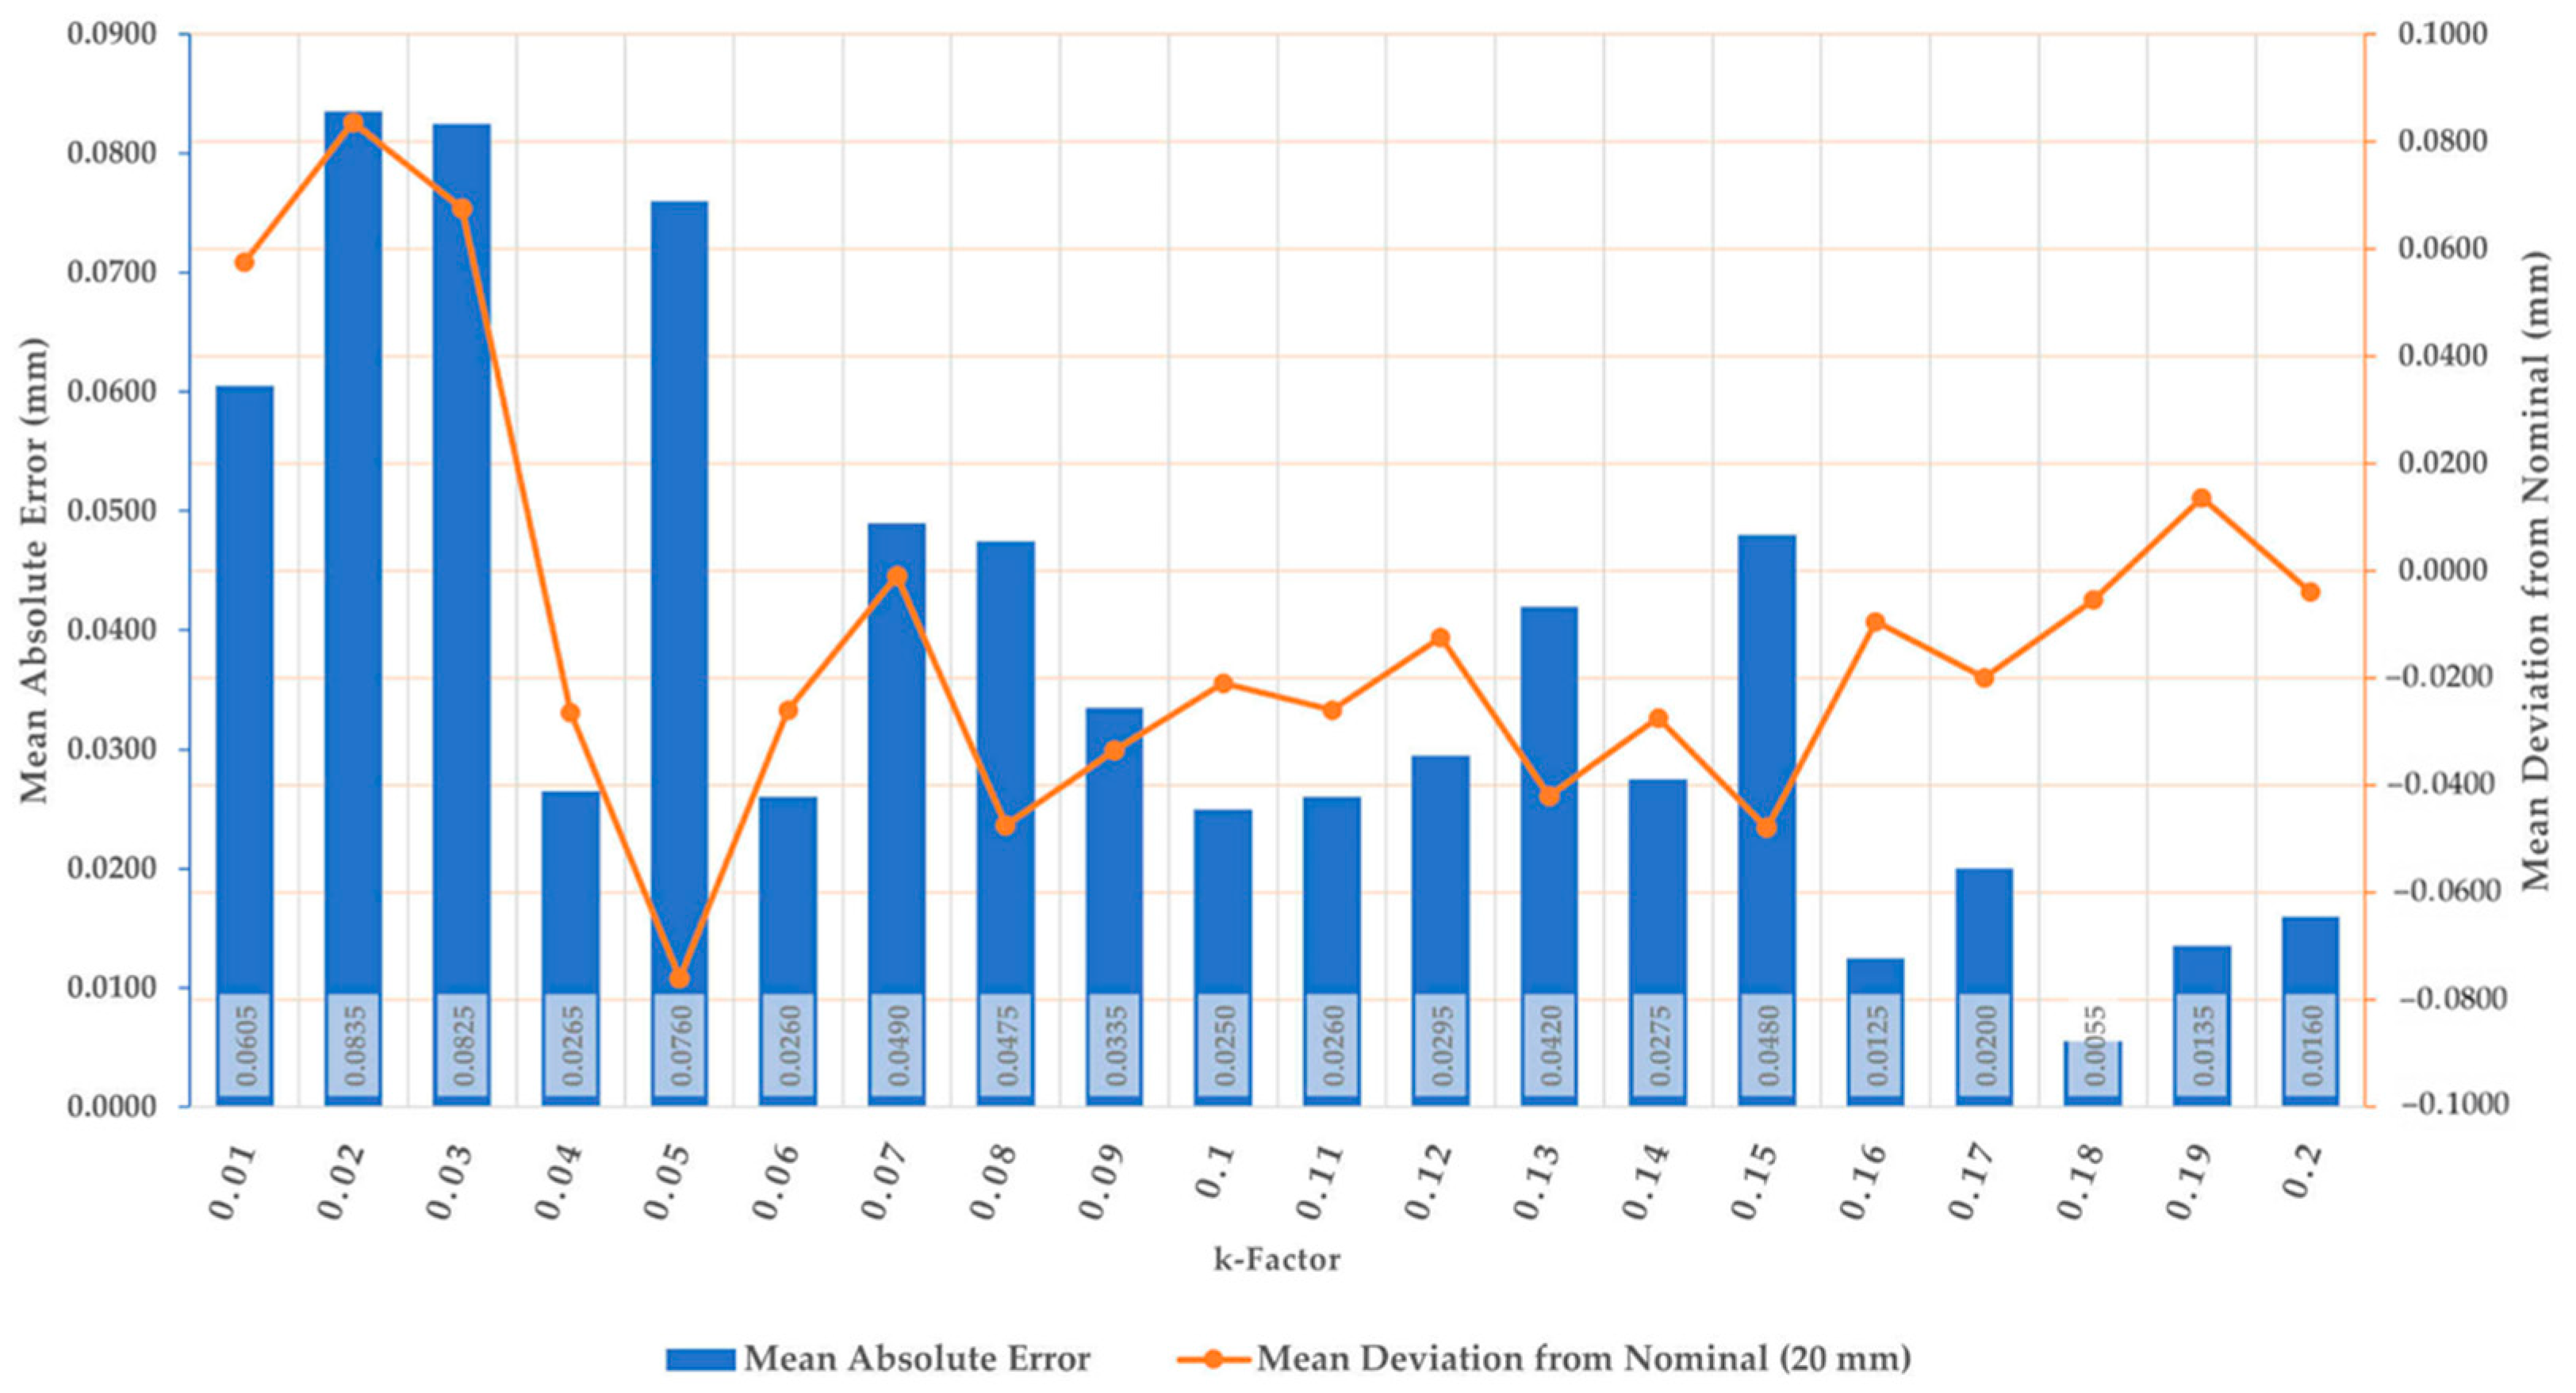
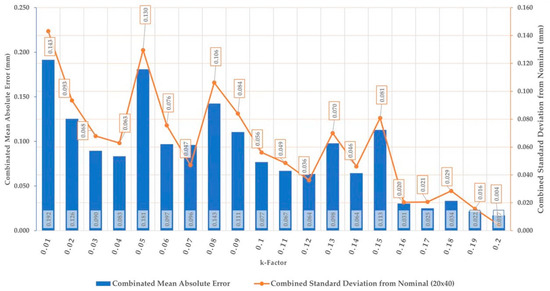
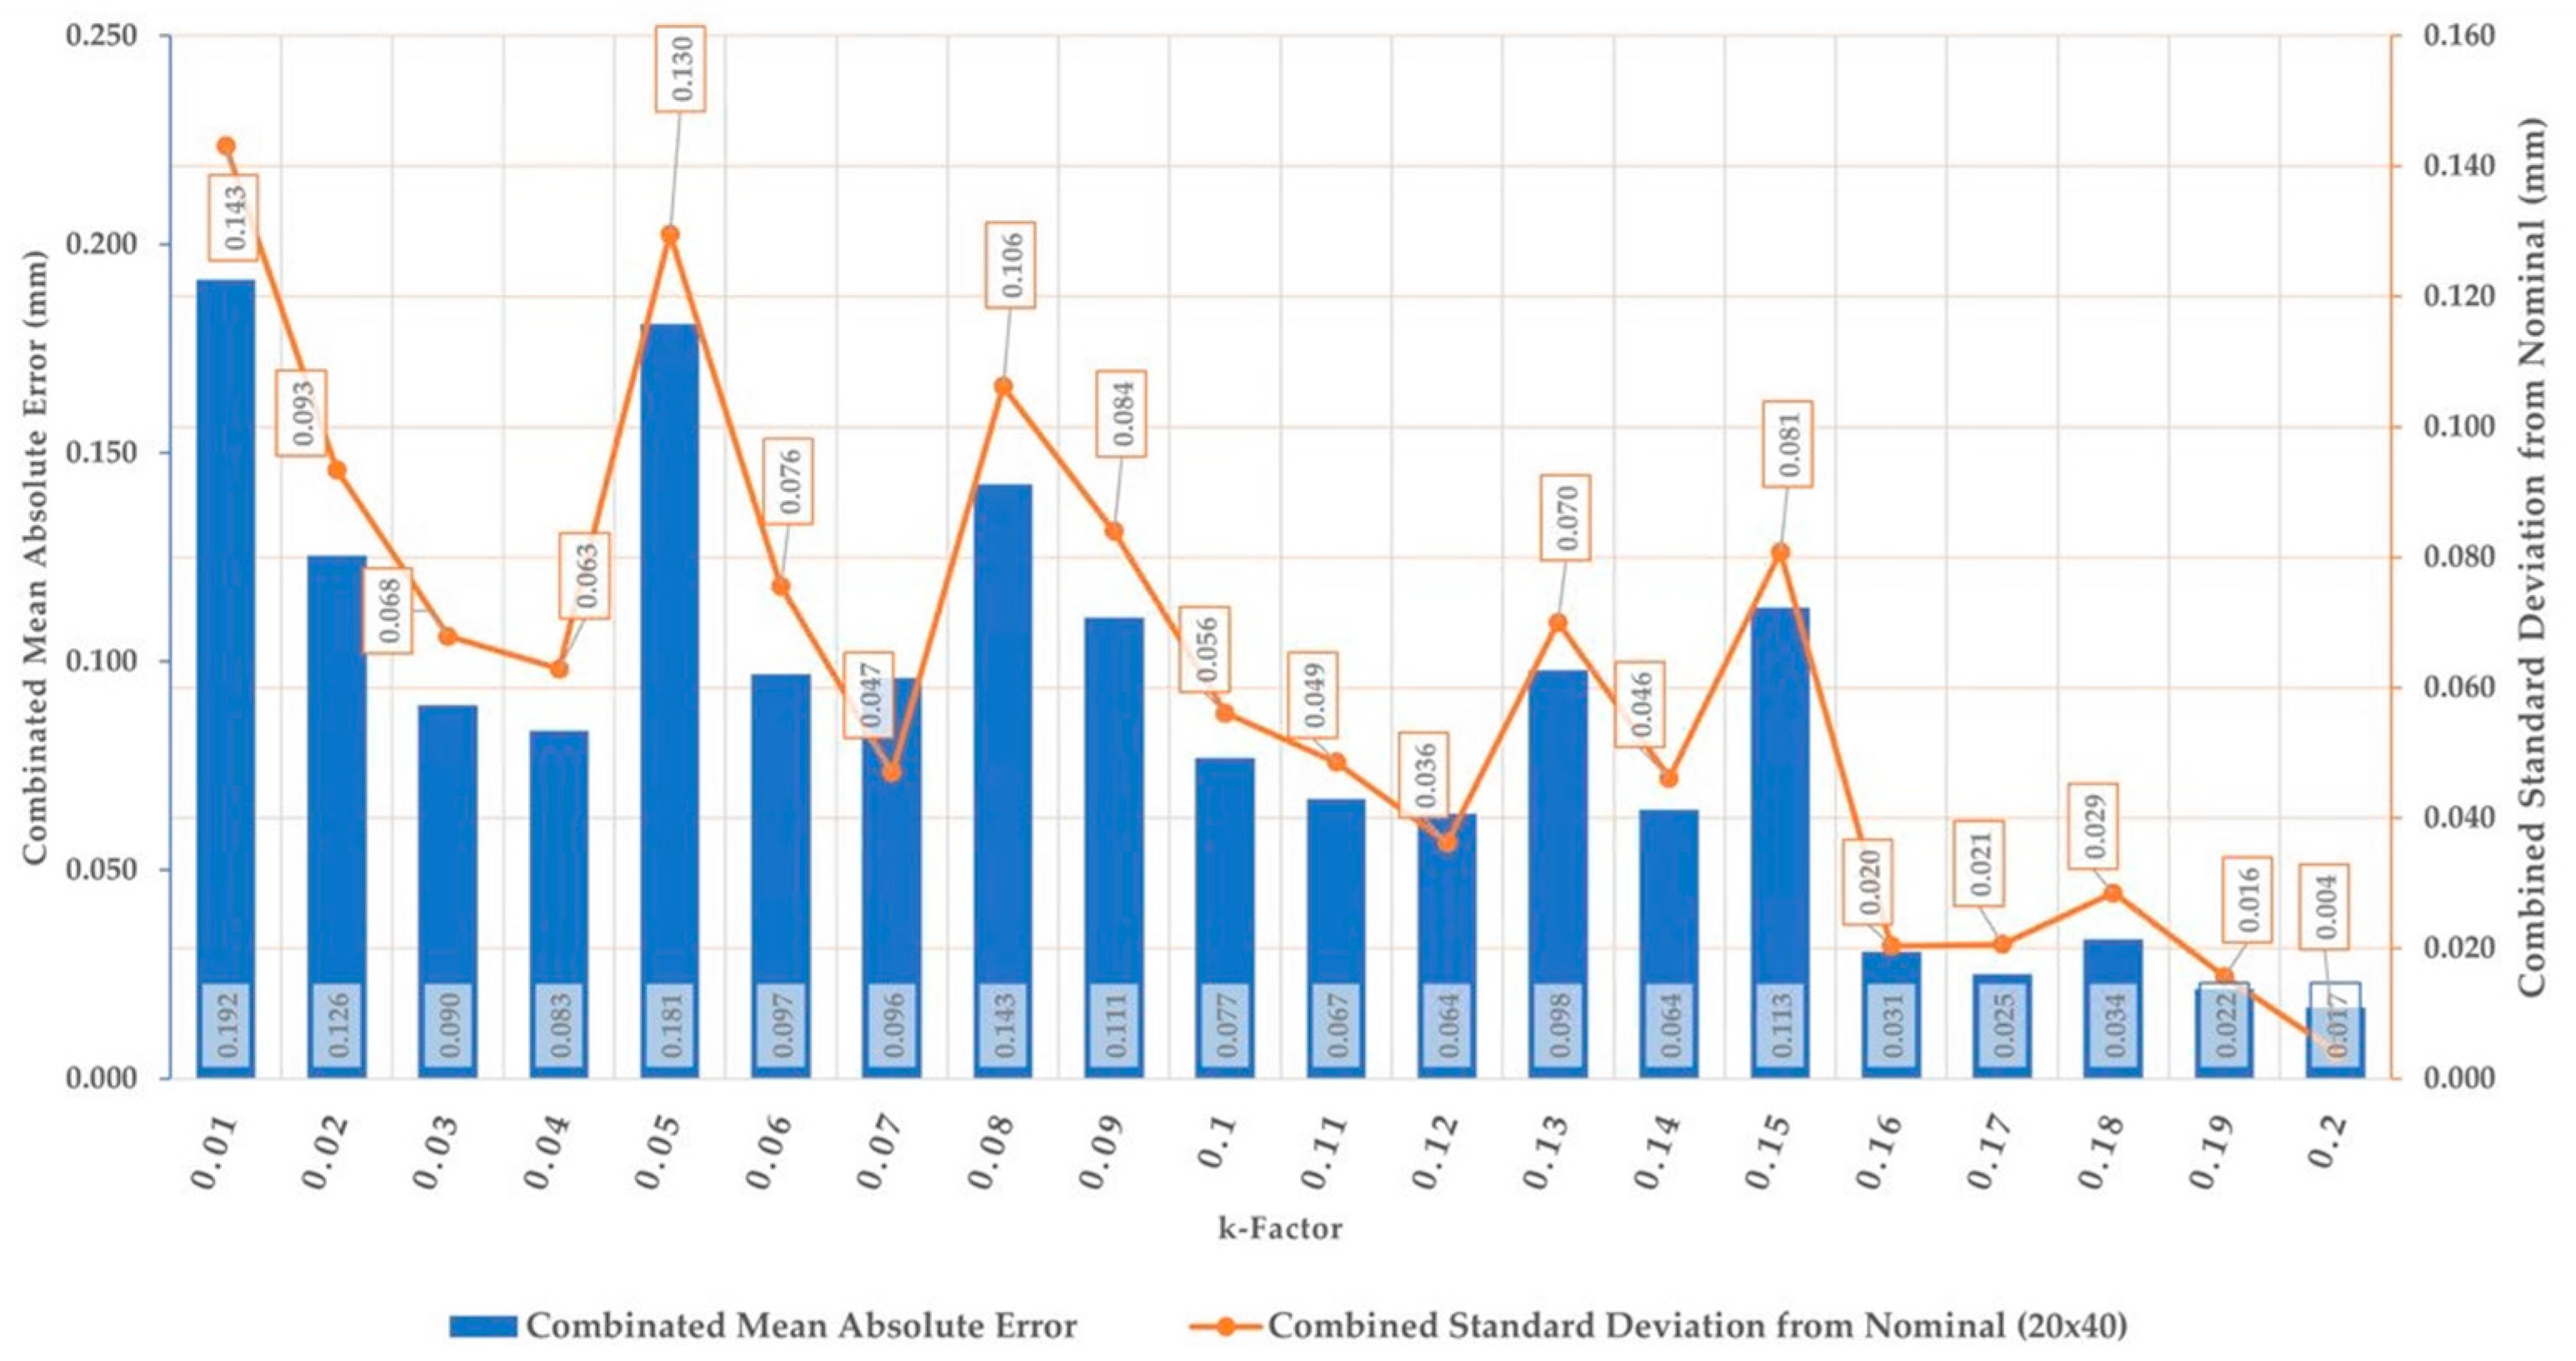
To summarize the results, the data were consolidated, and the resulting values are presented in Table 5 and Figure 8.
Table 5.
Combined measurement results.
Figure 8.
Diagram with visualization of the measurement combined results.
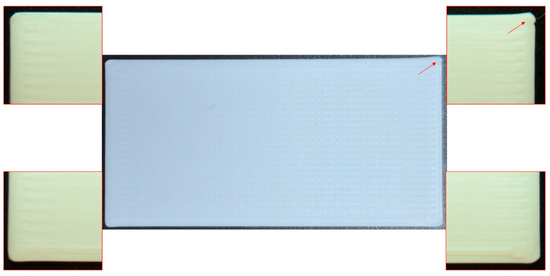
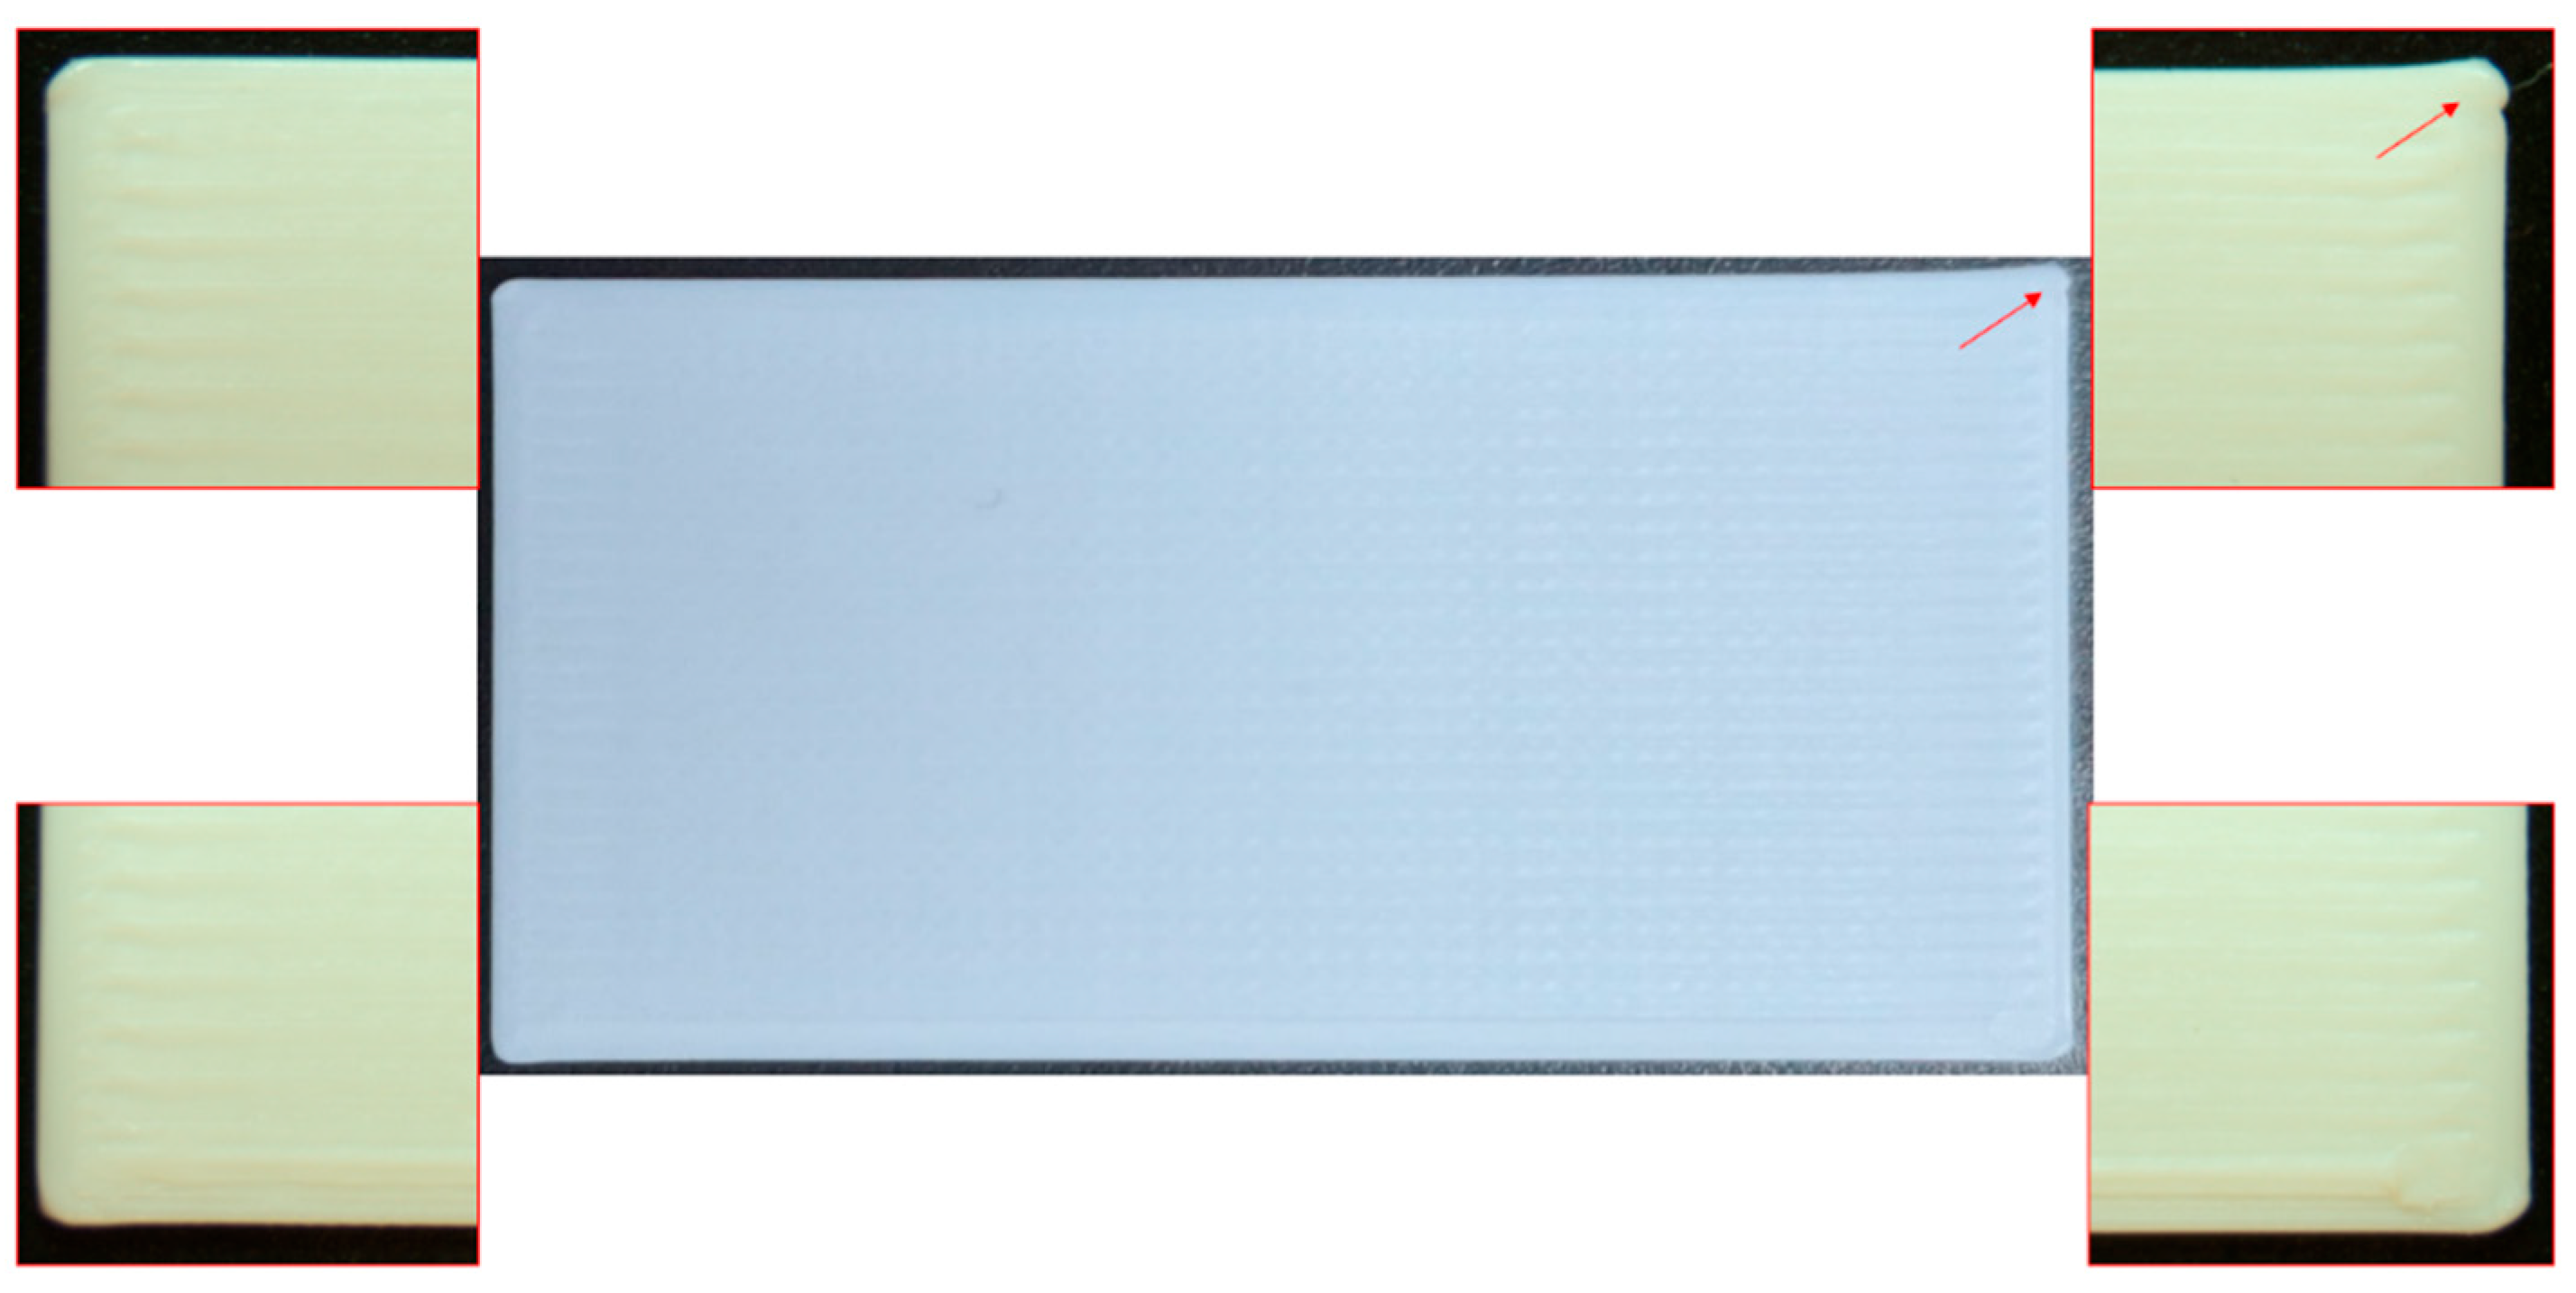
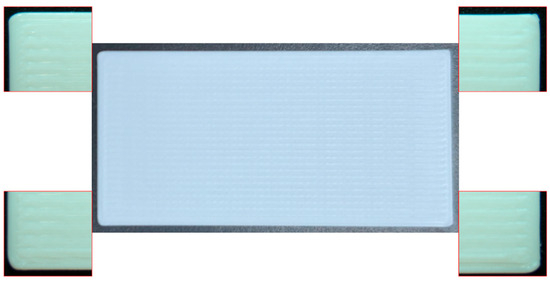
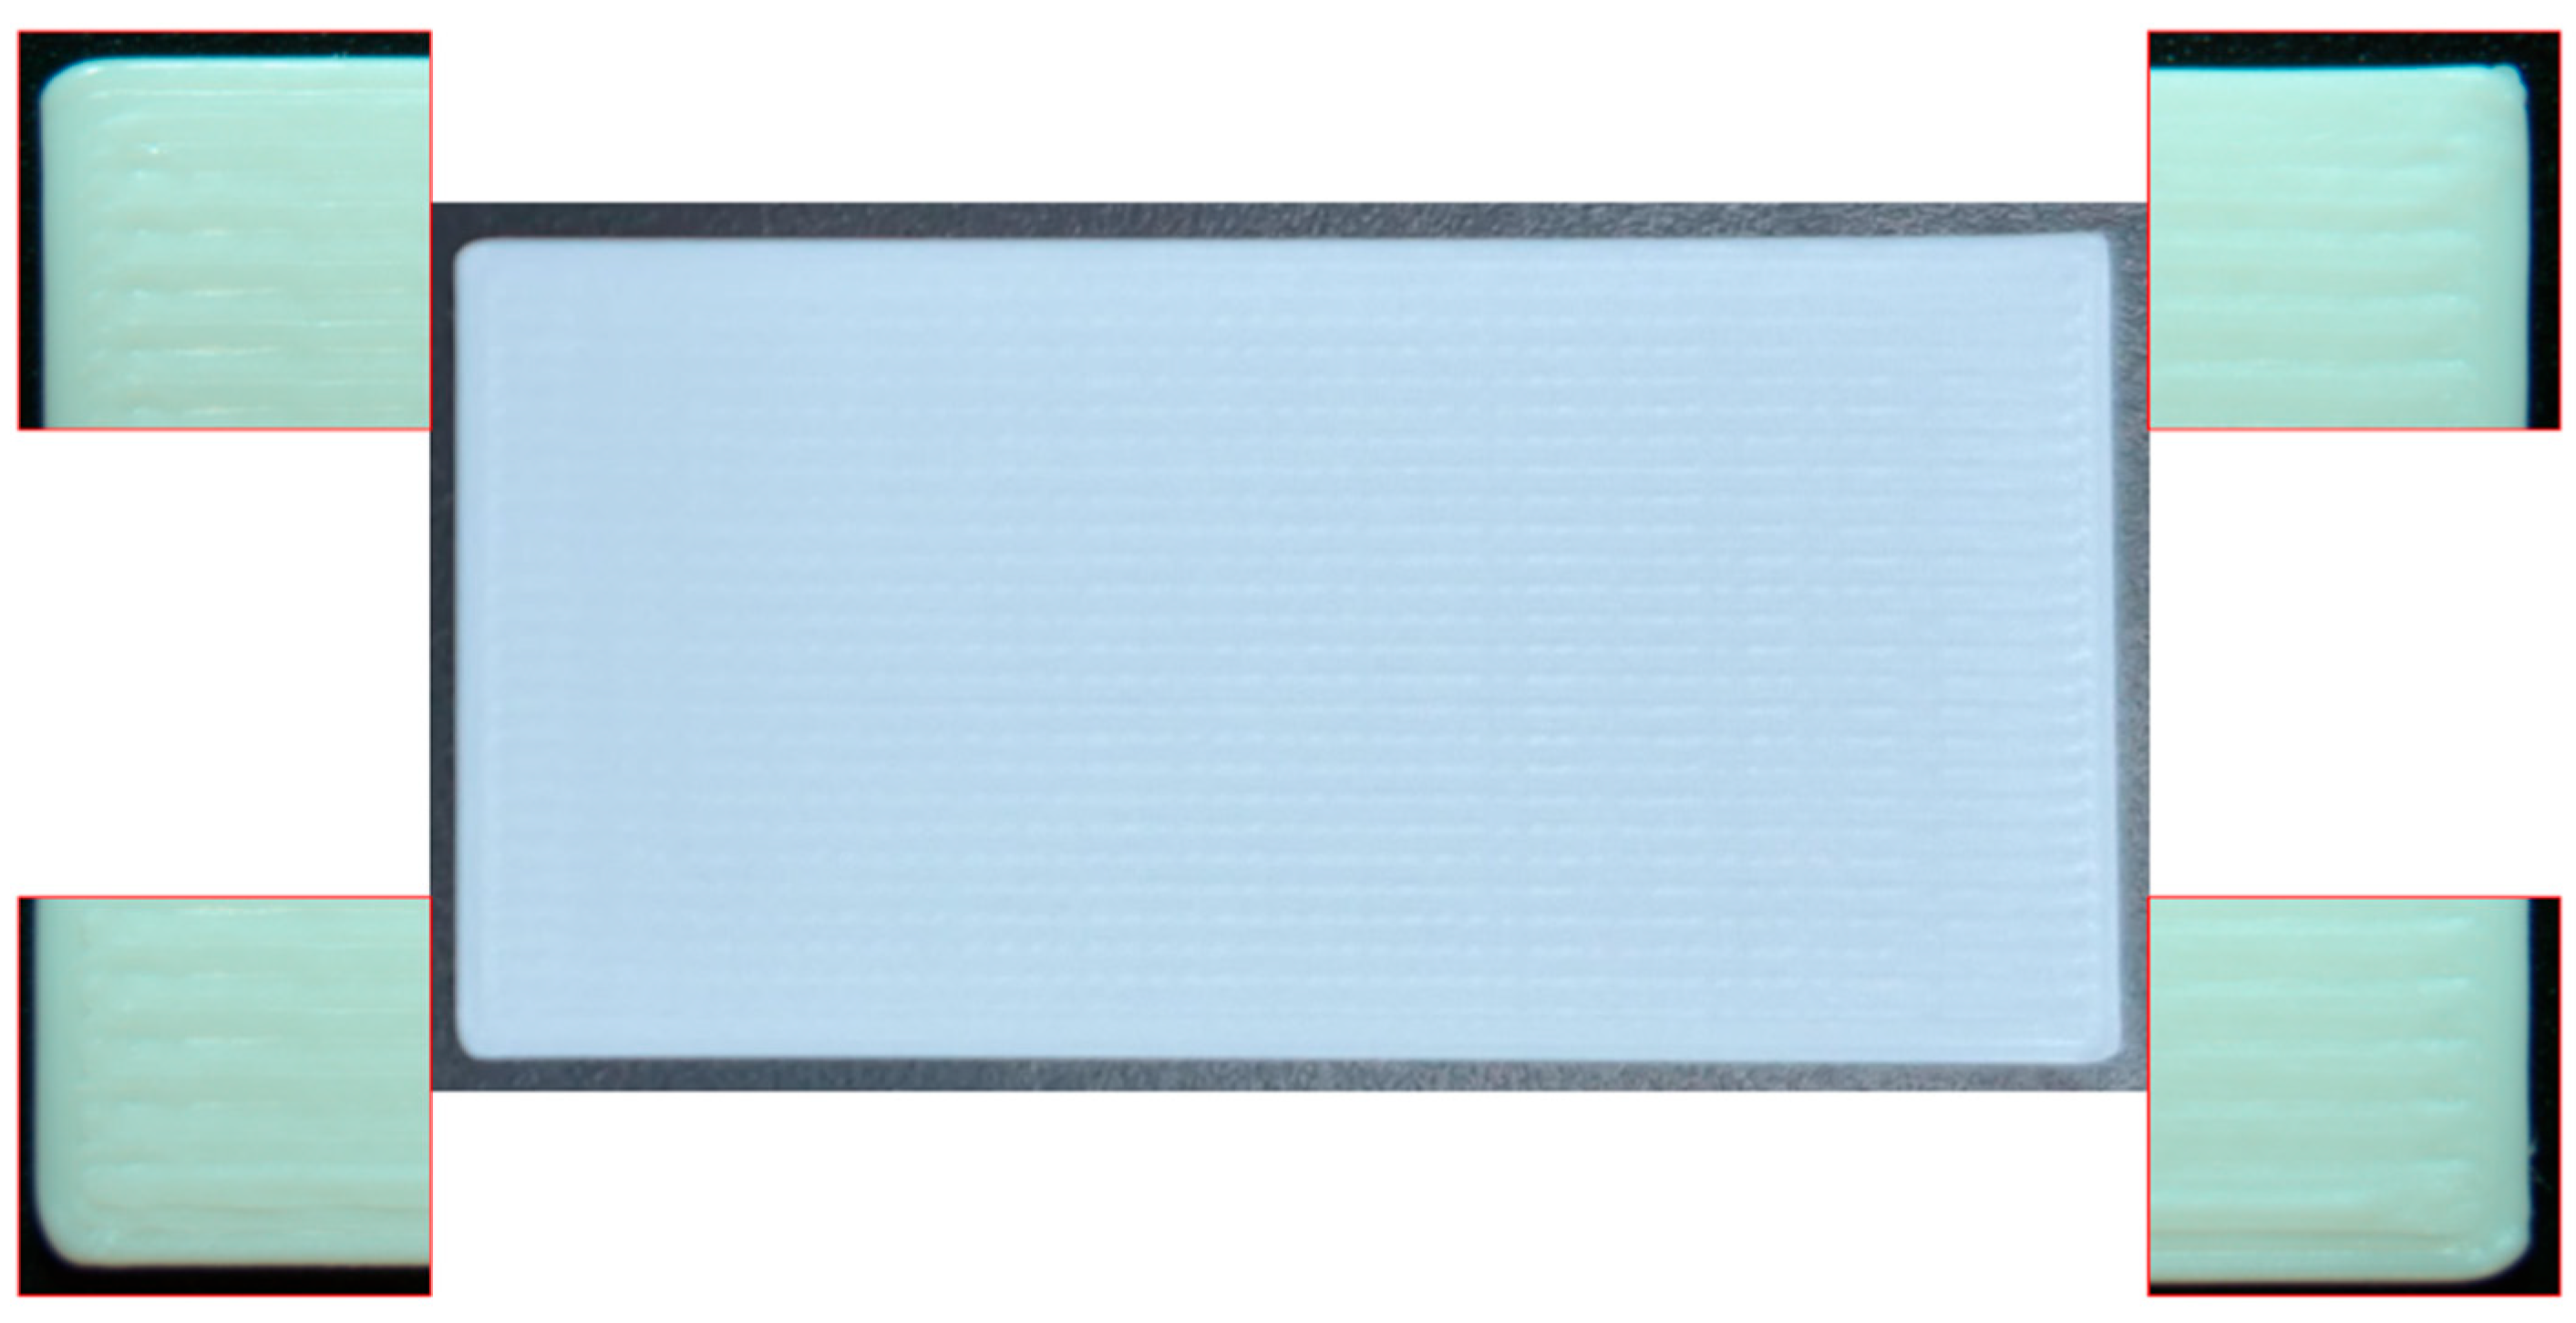
Upon examining the test specimens that yielded the best results—specifically those with k-Factor values of 0.03 and 0.04—it was found that a value of 0.03 resulted in excessive extrusion at the starting position (Figure 9). In contrast, no such issue was observed at a k-Factor value of 0.04, leading to improved part geometry (Figure 10).
Figure 9.
Specimen with a k-Factor value of 0.03 and the occurrence of over extrusion.
Figure 10.
Specimen with a k-Factor value of 0.04.
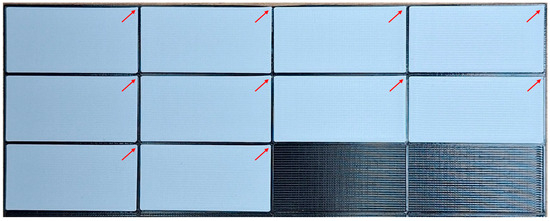
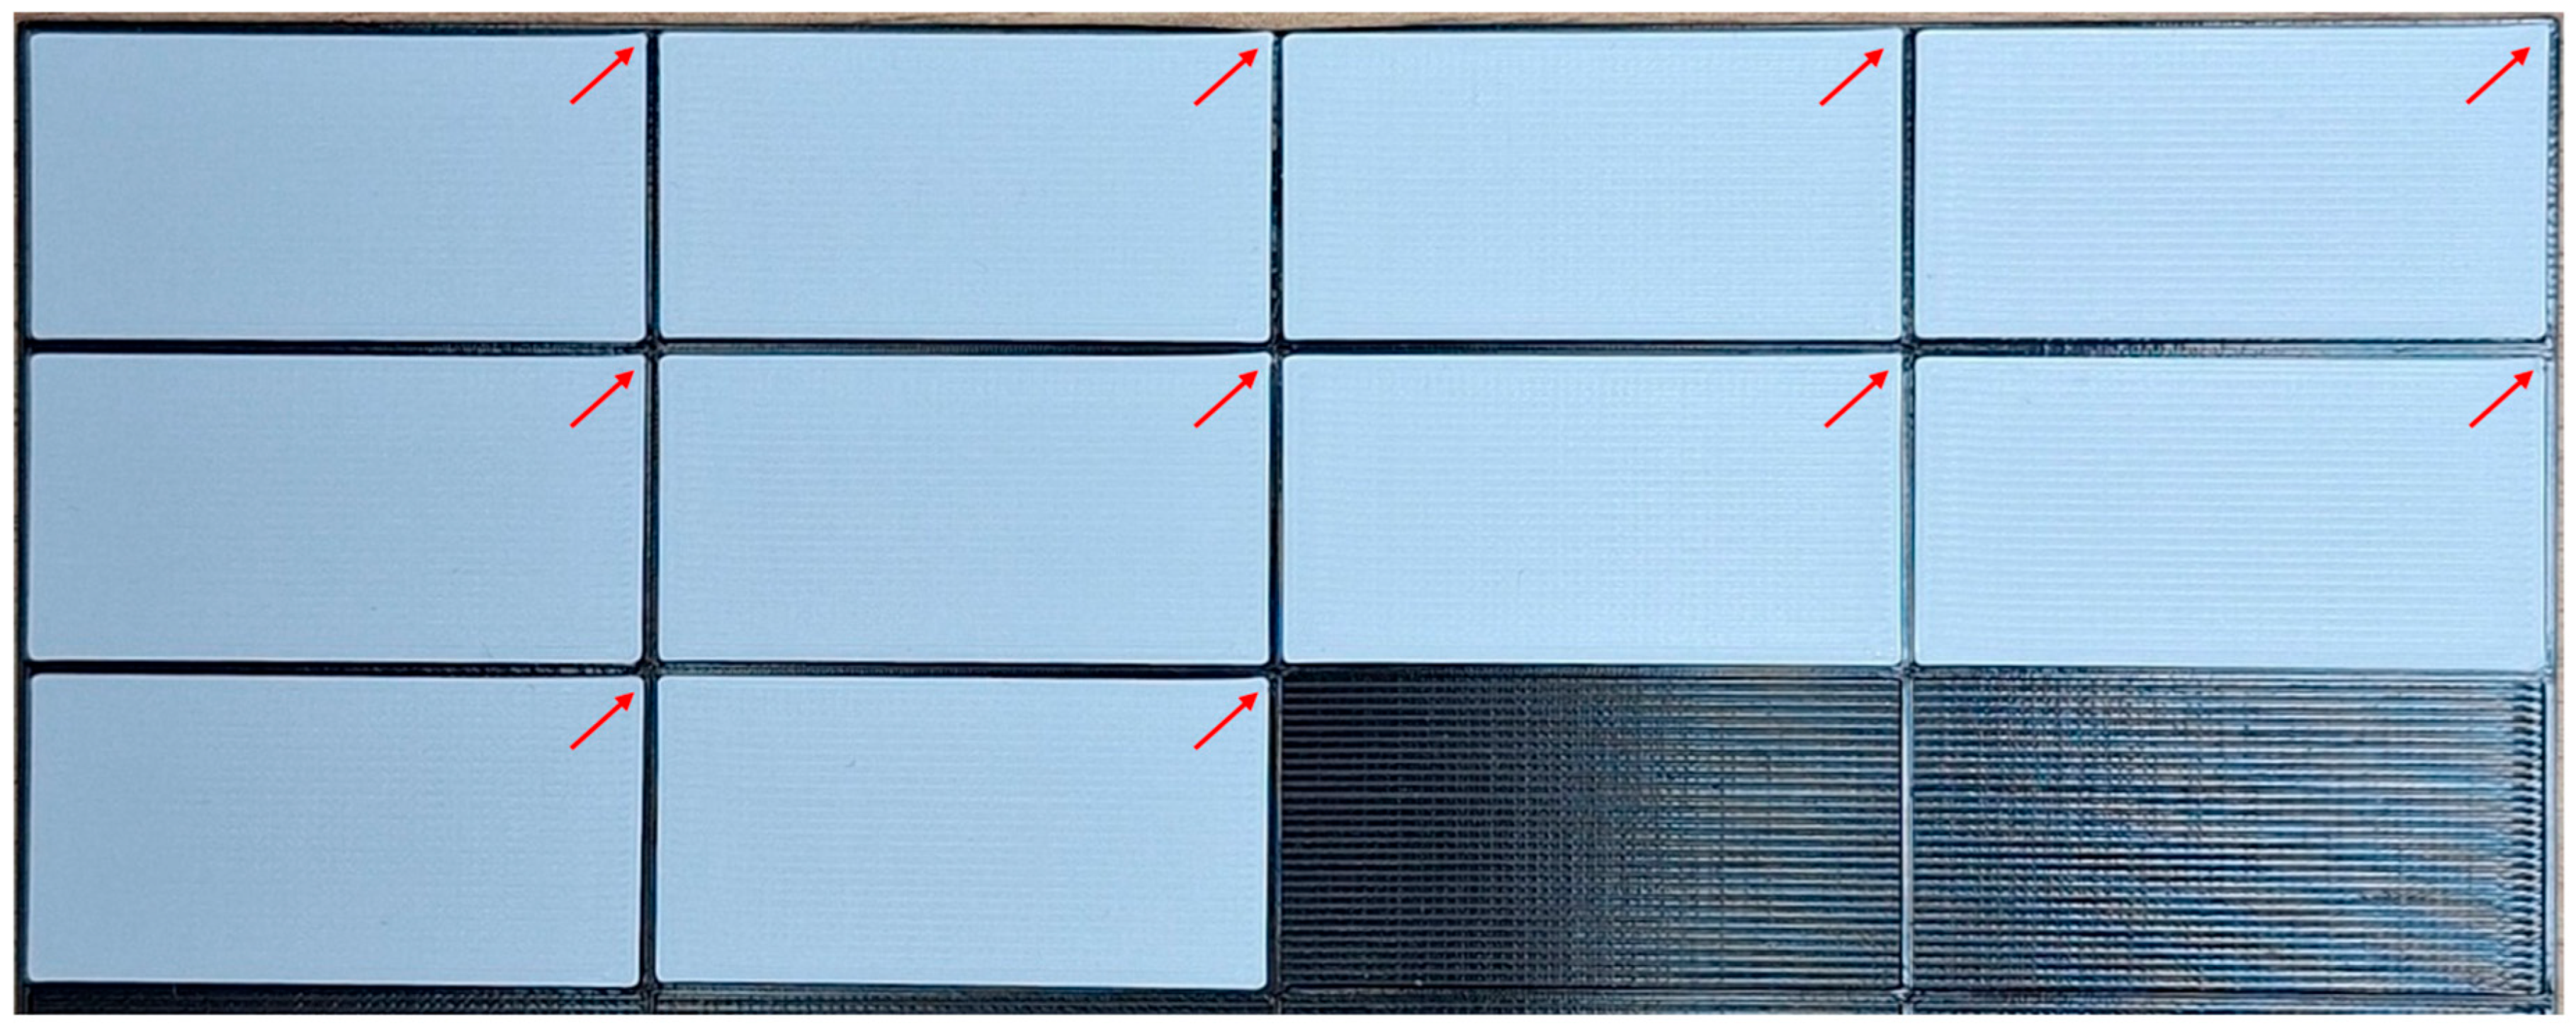
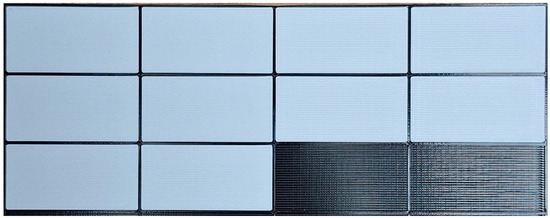
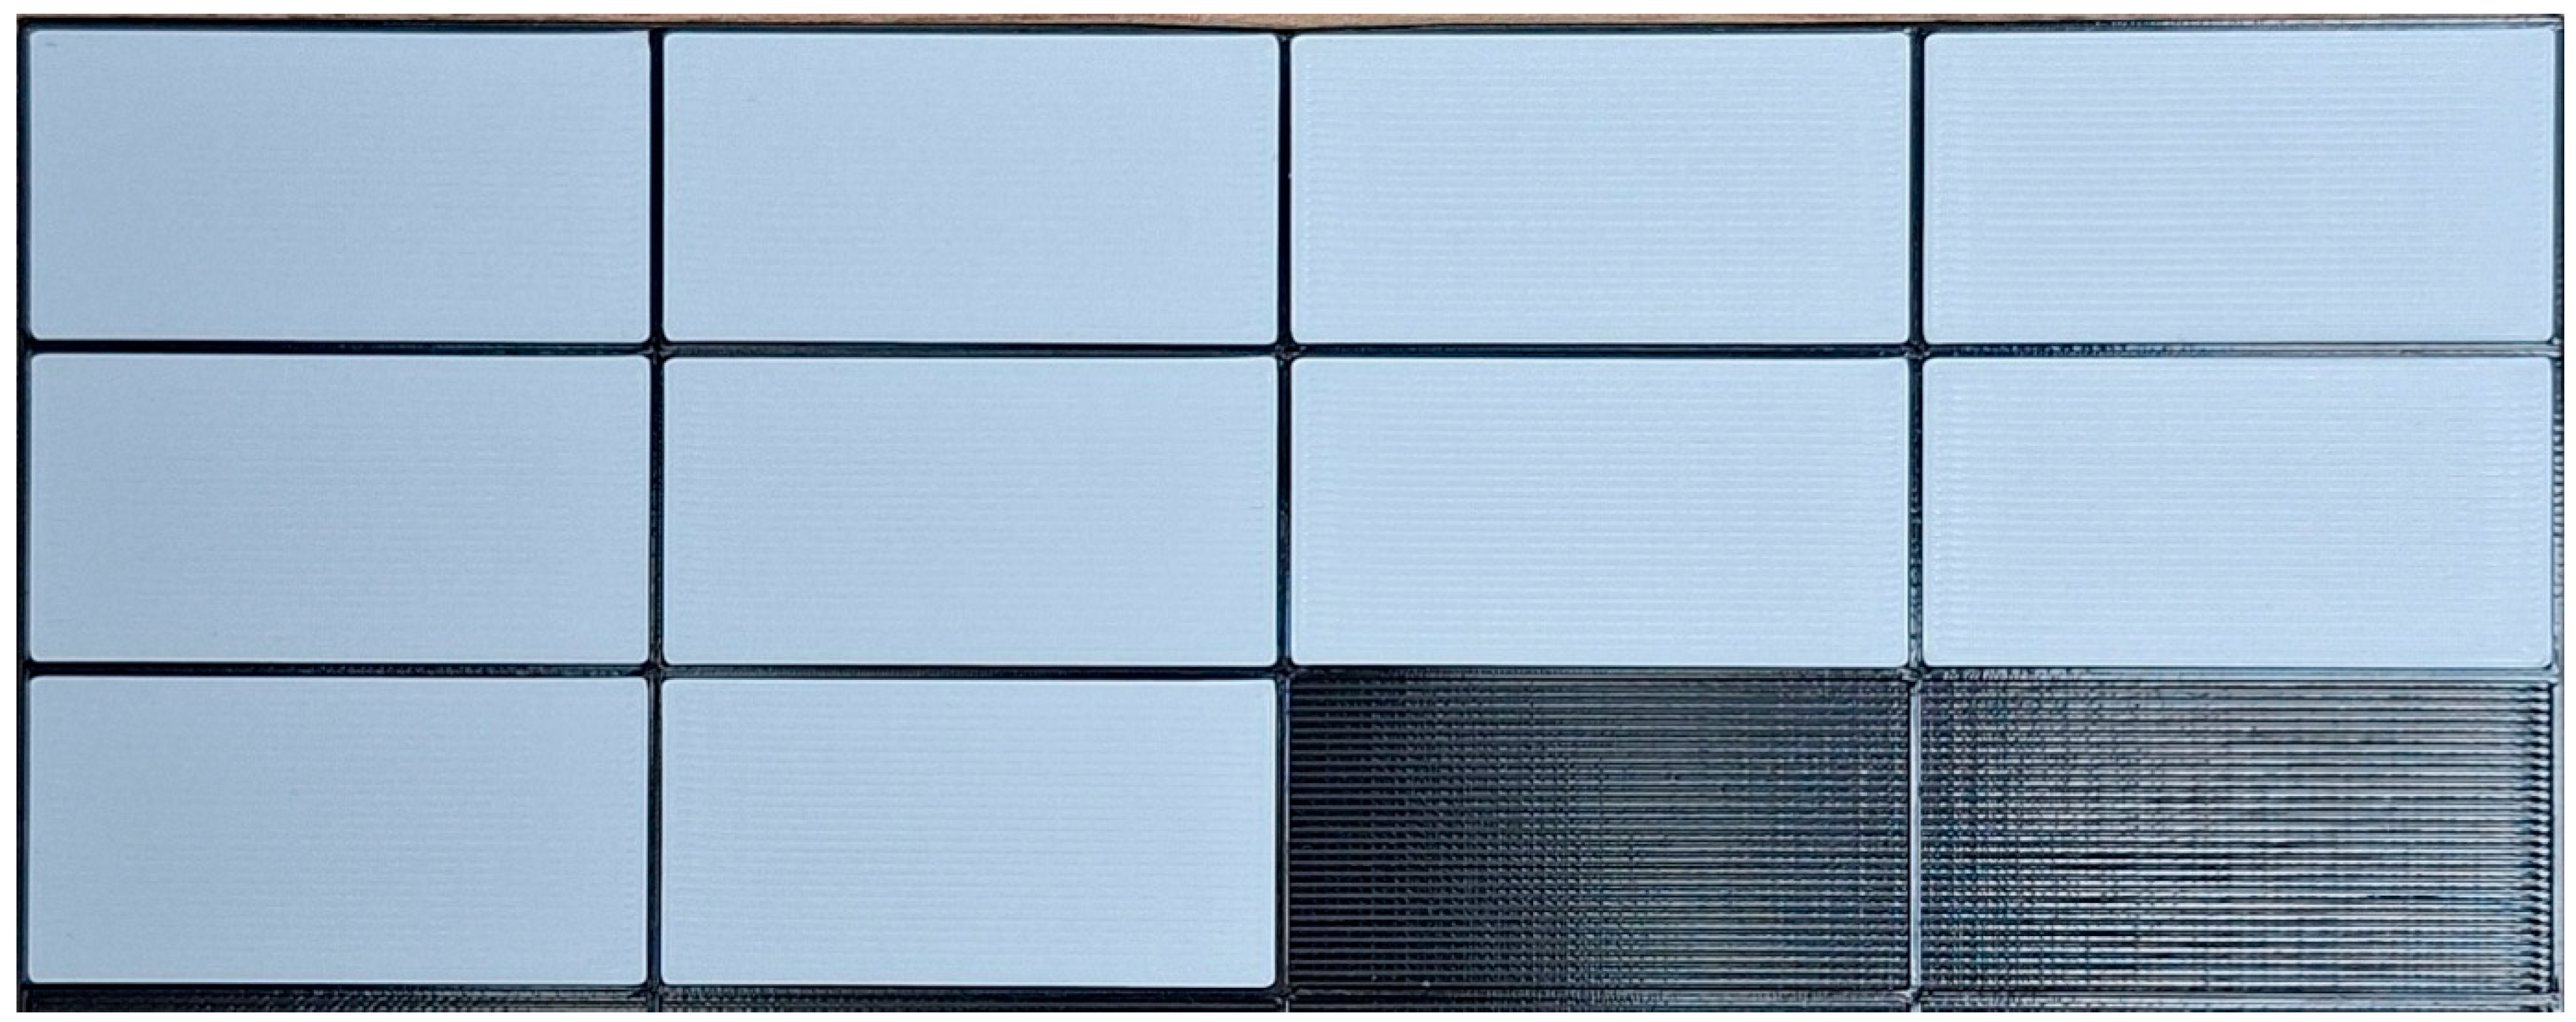
Figure 11 and Figure 12 display all test specimens with k-Factor values of 0.03 and 0.04, respectively. It is evident from the images that the specimens with a k-Factor of 0.03 exhibit a clearly raised area in one of the corners, while no such defect is observed in the specimens with a k-Factor of 0.04.
Figure 11.
All 10 specimens with a k-Factor of 0.03.
Figure 12.
All 10 specimens with a k-Factor of 0.04.
A more detailed interpretation of the obtained results reveals a consistent trend in the relationship between the k-Factor and dimensional accuracy. At lower k-Factor values (0.01–0.03), the deviations are primarily associated with insufficient pressure compensation, leading to over-extrusion at the beginning of movements and localized geometric inaccuracies.
In the intermediate range (0.04–0.10), the results demonstrate improved stability, with reduced mean absolute error and fewer visible defects. In particular, the k-Factor value of 0.04 provides the best balance between dimensional accuracy and surface quality, as confirmed by both quantitative measurements and visual inspection.
At higher k-Factor values (above 0.10), the results indicate increasing instability in extrusion behavior, which leads to inconsistent material deposition and the appearance of surface defects [21]. This is reflected in the increased variability observed in the measurement data.
Overall, the results suggest that the k-Factor has a nonlinear influence on print quality, with an optimal operating region rather than a single absolute value [20].
4. Discussion
The comparative results demonstrate that, under the specific process parameters defined in the study, a compensation parameter (k-Factor) value of 0.04 significantly improves the quality of the printed parts compared to other values. This research may contribute to the enhancement of algorithms used for calculating optimal k-Factor values in FDM technology [22].
The obtained results are consistent with findings reported in previous studies on extrusion control in FDM processes. Similar research indicates that improper pressure compensation leads to defects such as over-extrusion, dimensional inaccuracies, and poor surface quality.
For example, studies focusing on pressure advance and extrusion dynamics [12,13] report that optimal parameter tuning significantly improves dimensional stability and reduces material flow inconsistencies. Additionally, research on process parameter optimization [3,4] confirms that balanced parameter selection is critical for achieving high-quality printed parts.
In comparison to these studies, the present work provides a focused investigation on the k-Factor parameter for a specific PLA material (Ingeo 4043D), contributing experimental data that supports the importance of precise pressure control in FDM processes.
Due to the complexity of the processes involved in printing, a hypothesis can be proposed that the k-Factor value depends on the combination of multiple parameters, with key influencing factors likely being print speed, melting temperature, and nozzle diameter. These relationships will be examined in future studies.
Author Contributions
Conceptualization, B.B. and T.T.; methodology, B.B.; software, B.B.; validation, Z.K.; formal analysis, B.B.; investigation, B.B.; resources, Z.K.; data curation, Z.K.; writing—original draft preparation, T.T.; writing—review and editing, B.B., T.T.T. and T.T.; visualization, B.B. and T.T.T.; supervision, Z.K. and T.T.T.; project administration, Z.K.; funding acquisition, Z.K. All authors have read and agreed to the published version of the manuscript.
Funding
The equipment for the study is financed by the European Union-Next Generation EU, through the National Recovery and Resilience Plan of the Republic of Bulgaria, project № BG-RRP-2.004-0005. This work was supported by the project “CENTRE OF EXCELLENCE Universities for ScieNce, Informatics and Technologies in e-Society (UNITe)” (CoE UNITe, BG16RFPR002-1.014-0004-C02), funded by the Programme “Research, Innovation and Digitalisation for Smart Transformation”, co-funded by the European Union.
Institutional Review Board Statement
Not applicable.
Informed Consent Statement
Not applicable.
Data Availability Statement
The data presented in this study are available on request from the corresponding author.
Conflicts of Interest
The authors declare no conflicts of interest.
References
- Todorov, T.; Todorov, G.; Romanov, B. Design and Simulation of Mould Tools with Multi-Material Structure for Plastic Injection Moulding Based on Additive Technology. In 2019 International Conference on Creative Business for Smart and Sustainable Growth (CREBUS); IEEE: Sandanski, Bulgaria, 2019; pp. 1–6. [Google Scholar] [CrossRef] [Scilit]
- Todorov, T.; Bineva, K.; Romanov, B. Validation of Design and Ergonomics of a Protective Mask by Creating a Silicone Replication in a 3D Printed Mold Tool. In Machine and Industrial Design in Mechanical Engineering; Mechanisms and Machine Science; Rackov, M., Miltenović, A., Banić, M., Eds.; Springer Nature: Cham, Switzerland, 2025; Volume 174, pp. 335–344. [Google Scholar] [CrossRef] [Scilit]
- Mani, M.; Karthikeyan, A.G.; Kalaiselvan, K.; Muthusamy, P.; Muruganandhan, P. Optimization of FDM 3-D Printer Process Parameters for Surface Roughness and Mechanical Properties Using PLA Material. Mater. Today Proc. 2022, 66, 1926–1931. [Google Scholar] [CrossRef] [Scilit]
- Ng, N.Y.Z.; Abdul Haq, R.H.; Marwah, O.M.F.; Ho, F.H.; Adzila, S. Optimization of Polyvinyl Alcohol (PVA) Support Parameters for Fused Deposition Modelling (FDM) by Using Design of Experiments (DOE). Mater. Today Proc. 2022, 57, 1226–1234. [Google Scholar] [CrossRef] [Scilit]
- Zagorski, M.; Sofronov, Y.; Ivanova, D.; Dimova, K. Investigation of Different FDM/FFF 3D Printing Methods for Improving the Surface Quality of 3D Printed Parts. AIP Conf. Proc. 2022, 2449, 060001. [Google Scholar] [CrossRef] [Scilit]
- Sahoo, S.; Sutar, H.; Senapati, P.; Shankar Mohanto, B.; Ranjan Dhal, P.; Kumar Baral, S. Experimental Investigation and Optimization of the FDM Process Using PLA. Mater. Today Proc. 2023, 74, 843–847. [Google Scholar] [CrossRef] [Scilit]
- Kadhum, A.H.; Al-Zubaidi, S.; AlKareem, S.S.A. Optimization of Mechanical Properties and Surface Characteristics of PLA+ 3D Printing Materials. Int. J. Chem. Eng. 2023, 2023, 8887905. [Google Scholar] [CrossRef] [Scilit]
- Nagendran, J. Effect of Printing Parameters of 3D Printed PLA Parts on Mechanical Properties. J. Eng. Res. ICMMM Spec. Issue 2021. [Google Scholar] [CrossRef] [Scilit]
- Moetazedian, A.; Budisuharto, A.S.; Silberschmidt, V.V.; Gleadall, A. CONVEX (CONtinuously Varied EXtrusion): A New Scale of Design for Additive Manufacturing. Addit. Manuf. 2021, 37, 101576. [Google Scholar] [CrossRef] [Scilit]
- Patel, A.; Taufik, M. Extrusion-Based Technology in Additive Manufacturing: A Comprehensive Review. Arab. J. Sci. Eng. 2024, 49, 1309–1342. [Google Scholar] [CrossRef] [Scilit]
- Azhar, M.A.M.; Sukindar, N.A.; Ani, M.H.; Anuar, H.B.; Kamaruddin, S.B.; Shaharuddin, S.I.S.; Mustafa, M.Y.; Adesta, E.Y.T.; Arief, R.K.; Sulaiman, M.H. Review on Fused Deposition Modelling Extruder Types with Their Specialities in Filament Extrusion Process. In Proceeding of 5th International Conference on Advances in Manufacturing and Materials Engineering; Springer Nature: Singapore, 2023; pp. 407–413. [Google Scholar] [CrossRef] [Scilit]
- Pressure Advance—Klipper Documentation. Available online: https://www.klipper3d.org/Pressure_Advance.html (accessed on 3 December 2025).
- Sineos, S. Linear Advance. Marlin Firmware. Available online: https://marlinfw.org/docs/features/lin_advance.html (accessed on 3 December 2025).
- Tronvoll, S.A.; Popp, S.; Elverum, C.W.; Welo, T. Investigating Pressure Advance Algorithms for Filament-Based Melt Extrusion Additive Manufacturing: Theory, Practice and Simulations. Rapid Prototyp. J. 2019, 25, 830–839. [Google Scholar] [CrossRef] [Scilit]
- Kazmer, D.; Peterson, A. Compressibility in Fused Deposition Modeling. In Society of Plastics Engineering Annual Technical Conference, Additive Manufacturing Division; Society of Plastics Engineers: Danbury, CT, USA, 2022. [Google Scholar]
- Uitz, O.; Leng, R.; Pan, T.; Zhao, X.; Oridate, A.; Seepersad, C.; Ounaies, Z.; Frecker, M. Reactive Extrusion Additive Manu-fac-turing (REAM) of Functionally Graded Magneto-Active Thermoset Composites. Addit. Manuf. 2023, 67, 103486. [Google Scholar] [CrossRef] [Scilit]
- Syrlybayev, D.; Perveen, A.; Talamona, D. Fused deposition modelling: Effect of extrusion temperature on the accuracy of print. Mater. Today Proc. Date 2021, 44, 832–837. [Google Scholar] [CrossRef] [Scilit]
- Zimenko, K.V.; Afanasev, M.Y.; Kolesnikov, M.V. Pressure Control in Material Extrusion Additive Manufacturing. Naučno-Teh. Vestn. Inf. Tehnol. Meh. I Opt. 2022, 22, 929–940. [Google Scholar] [CrossRef] [Scilit]
- Mohamed, O.A.; Masood, S.H.; Bhowmik, J.L. Optimization of fused deposition modeling process parameters for dimensional accuracy using I-optimality criterion. Measurement 2016, 81, 174–196. [Google Scholar] [CrossRef] [Scilit]
- Gupta, A.; Taufik, M. The effect of process parameters in material extrusion processes on the part surface quality: A review. Mater. Today Proc. Date 2022, 50, 1234–1242. [Google Scholar] [CrossRef] [Scilit]
- Fu, Y.; Downey, A.; Yuan, L.; Huang, H. Real-time structural validation for material extrusion additive manufacturing. Addit. Manuf. 2023, 65, 103409. [Google Scholar] [CrossRef] [Scilit]
- Gharehpapagh, B.; Dilberoglu, U.; Yaman, U.; Dolen, M. Adaptive Toolpath Generation for Material Extrusion Additive Manufac-turing Using a Nozzle with Rectangular Orifice. Addit. Manuf. 2023, 78, 103873. [Google Scholar] [CrossRef] [Scilit]
- Lendvai, L.; Fekete, I.; Rigotti, D.; Pegoretti, A. Experimental Study on the Effect of Filament-Extrusion Rate on the Structural, Mechanical and Thermal Properties of Material Extrusion 3D-Printed Polylactic Acid (PLA) Products. Prog. Addit. Manuf. 2025, 10, 619–629. [Google Scholar] [CrossRef] [Scilit]
- Bankov, B.; Todorov, T.T.; Todorov, G. A Functional Model Printing Approach Optimized for Cost-Efficiency Using FDM Technology. In Proceedings of the 14th International Scientific Conference TechSys 2025—Engineering, Technologies and Systems; MDPI: Basel, Switzerland, 2025. [Google Scholar] [CrossRef] [Scilit]
- Ingeo Biopolymer 4043D Technical Data Sheet. Available online: https://share.google/dAsiYbE6BRHuMjjBh (accessed on 3 December 2025).

Disclaimer/Publisher’s Note: The statements, opinions and data contained in all publications are solely those of the individual author(s) and contributor(s) and not of MDPI and/or the editor(s). MDPI and/or the editor(s) disclaim responsibility for any injury to people or property resulting from any ideas, methods, instructions or products referred to in the content. |
© 2026 by the authors. Licensee MDPI, Basel, Switzerland. This article is an open access article distributed under the terms and conditions of the Creative Commons Attribution (CC BY) license.