


Abstract
This paper introduces a sophisticated stochastic methodology grounded in a lattice rule featuring an optimized generating vector, which has been rigorously developed and comprehensively analyzed. At the heart of this investigation lies the Unified Danish Eulerian Model (UNI-DEM), an extensive large-scale mathematical framework designed to accurately capture the complex physical and chemical processes occurring within the atmosphere. The proposed lattice-based approach is systematically compared against state-of-the-art techniques, including the modified Sobol sequence and the Fibonacci lattice rule. The comparative analysis demonstrates the superiority of the proposed method in the estimation of high-dimensional integrals, highlighting its enhanced robustness and computational efficiency. These characteristics render it particularly well-suited for the computation of sensitivity indices, which are crucial for ensuring the reliability of scientific models. Furthermore, the study employs variance-based sensitivity analysis methods, notably the Sobol technique, to quantify the influence of input parameters on model outputs rigorously. A comprehensive experimental evaluation is undertaken, integrating advanced Monte Carlo algorithms in conjunction with stochastic scrambling strategies to further enhance computational performance. In addition, the research examines the effects of varying emission levels on key atmospheric pollutants such as ammonia, ozone, ammonium sulfate, and ammonium nitrate, with particular emphasis on major European urban centers exhibiting diverse geographical and environmental conditions. These results underscore the critical importance of sensitivity analysis in validating model accuracy and elucidating the intricate relationships between input parameters and environmental outcomes.
1. Introduction
According to established definitions in the literature [1,2,3,4,5], Sensitivity Analysis (SA) investigates how uncertainties or variations in model input data propagate to and affect the accuracy and reliability of model outputs. Such perturbations in input parameters may stem from a multitude of sources, including but not limited to measurement errors, instrumental inaccuracies, data approximations, numerical discretization, and data compression artifacts.
Conducting real-world experiments to study these effects is often impractical, given the high costs, substantial time requirements, and the need for specialized personnel and sophisticated equipment. As a result, mathematical and computational modeling have become indispensable tools for exploring and describing complex natural and engineered systems [6,7]. In this context, sensitivity analysis plays a pivotal role in assessing model robustness and in guiding model refinement and validation efforts.
A fundamental element of SA is the computation of total sensitivity indices (SIs), which quantitatively express the contribution of each input parameter, including interactions, to the output variance [8,9,10,11,12]. From a mathematical perspective, the estimation of these indices typically reduces to the evaluation of high-dimensional integrals [13,14,15,16], a task that presents considerable computational challenges.
Among the available numerical approaches, Monte Carlo (MC) methods have proven particularly effective and widely applicable for approximating such multidimensional integrals [17,18,19,20,21,22]. These stochastic techniques are not only fundamental to sensitivity analysis but also find extensive applications across diverse domains and many other scientific and engineering fields. The simplest variant, known as Crude Monte Carlo (CRU) [23,24,25,26,27,28,29], serves as a foundational baseline for developing more sophisticated MC-based algorithms. Quasi-Monte Carlo (QMC) methods [13,16] have emerged as a powerful alternative to traditional Monte Carlo techniques for high-dimensional numerical integration tasks, including global sensitivity analysis. Unlike classical Monte Carlo methods that rely on pseudorandom sequences, QMC methods utilize low-discrepancy sequences—such as Sobol’, Halton, or Faure sequences—that are designed to fill the integration domain more uniformly. This enhanced uniformity leads to significantly faster convergence rates, often approaching compared to the standard of Monte Carlo, where n is the number of samples and d is the problem dimension. In the context of variance-based sensitivity analysis, QMC methods enable more accurate and efficient estimation of Sobol’ sensitivity indices, which quantify the contribution of each input parameter and their interactions to the overall output variance. The superior performance of QMC is particularly evident in models with smooth integrands or when evaluating high-dimensional integrals typical in environmental, engineering, and financial simulations. Moreover, techniques such as scrambling and digital shifts can be applied to low-discrepancy sequences to retain their deterministic uniformity while providing error estimation capabilities akin to stochastic approaches. In this paper we will use another technique based on tuning the generator [30]. Overall these properties make QMC an attractive and robust tool for practitioners aiming to perform reliable and computationally efficient global sensitivity analyses.
The primary objective of the present study is to design and rigorously evaluate an advanced Monte Carlo-based framework for the efficient estimation of Sobol’ sensitivity indices within high-dimensional environmental modeling contexts. In particular, we introduce an enhanced lattice rule technique that leverages an optimized generating vector constructed through a component-by-component algorithm incorporating order-dependent weights. This innovative strategy is especially suited to complex atmospheric simulation models such as the Unified Danish Eulerian Model (UNI-DEM), which involve smooth yet highly intricate integrands due to nonlinear chemical interactions and spatially varying emissions.
The proposed methodology is systematically applied to assess the sensitivity of atmospheric pollutant concentrations—including key species such as ozone, ammonia, ammonium sulfate, and ammonium nitrate—to variations in anthropogenic-emission rates and chemical reaction kinetics. By improving the accuracy and computational efficiency of sensitivity index estimations, this work aims to facilitate more reliable environmental policy assessments and deepen the understanding of critical processes governing atmospheric chemistry and pollutant dispersion.
2. Materials and Methods
The input dataset for SA was produced from simulations of a large-scale mathematical framework for long-range atmospheric pollutant transport—the Unified Danish Eulerian Model (UNI-DEM) [31,32].
We consider that this mathematical model can be expressed through a model mapping:
where denotes the vector of input parameters with a joint probability density function (p.d.f.) . Furthermore, the inputs are assumed to be independent (i.e., mutually non-correlated), and the density is regarded as known, even in situations where the components are not inherently random. Under this interpretation, the response becomes a random variable as well, since it is generated by applying f to the random vector , and therefore possesses its own p.d.f.
The Sobol methodology relies on splitting an integrable model function f into a hierarchy of components with increasing dimensionality [4]:
where is a constant. The expansion (2) is known as the ANOVA representation of provided that each term is selected to satisfy [4]:
This constraint ensures uniqueness of the decomposition on the right-hand side of (2), with . The associated quantities
are referred to as the total variance and the corresponding partial variances, respectively. In the same spirit, the total variance can be written as a sum of these partial contributions: . Within the Sobol framework, the primary sensitivity measures are the Sobol global sensitivity indices [3,4], defined as
In addition, the total sensitivity index (TSI) for an input is introduced in [3,4] as
where is termed the main effect (first-order sensitivity index) of , and denotes the sensitivity index of order j. The higher-order components quantify interaction effects among the uncertain inputs , with , in their contribution to the output variance. Hence, performing global sensitivity analysis in this setting amounts to evaluating the total sensitivity indices (5) at the desired order, which—via (3) and (4)—reduces to the computation of multidimensional integrals.
3. The Stochastic Approaches
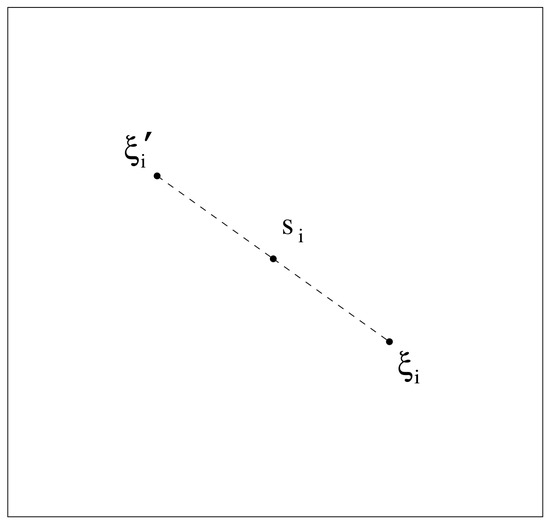
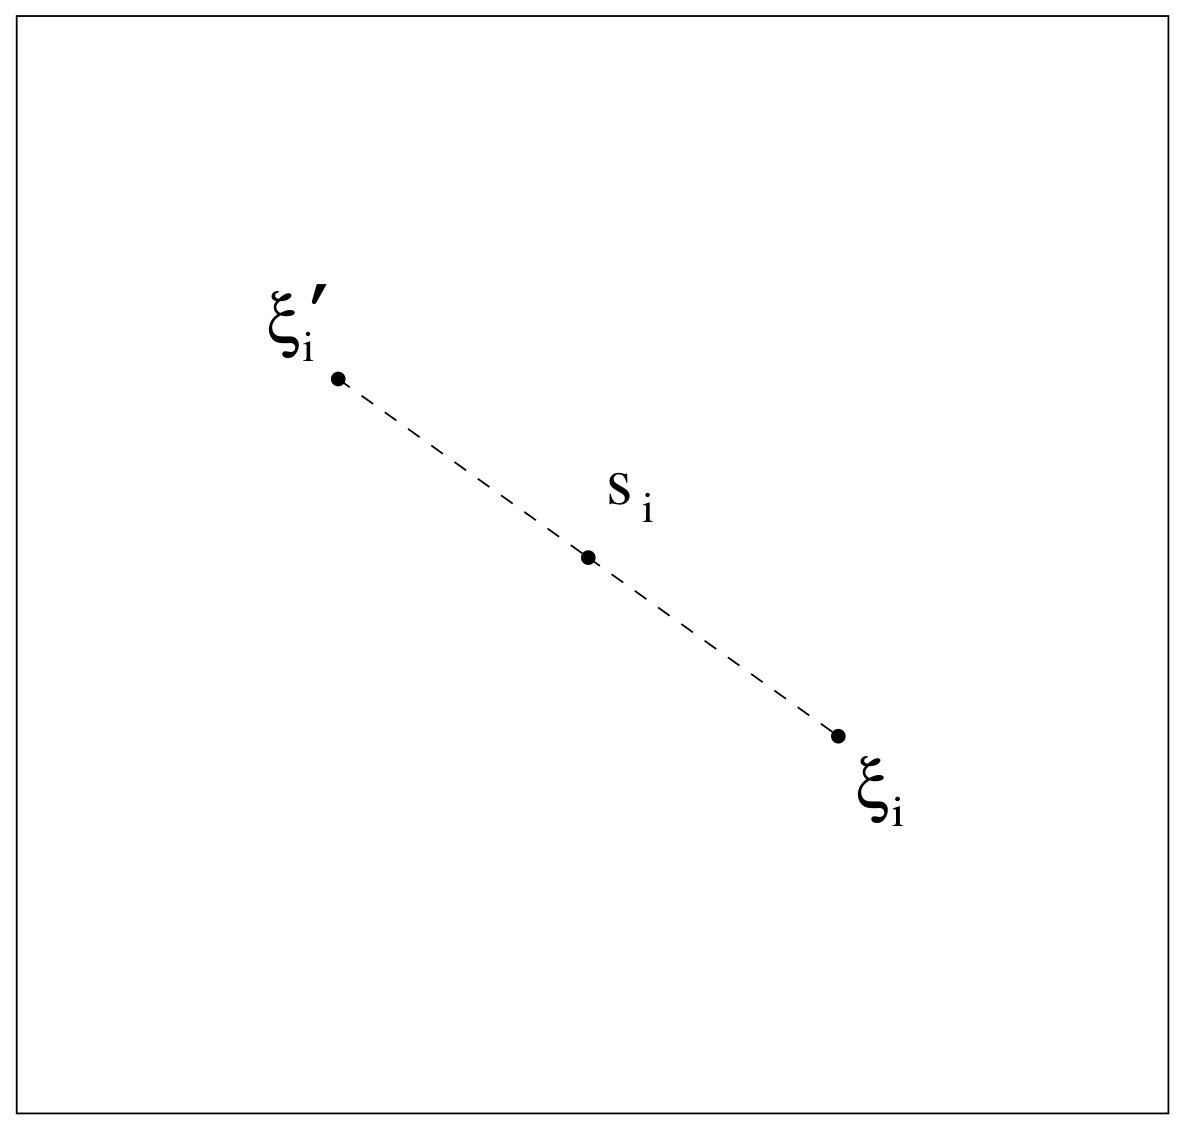
The concept in the two-dimensional case for MCA-MSS-2-S is illustrated in Figure 1.
Figure 1.
Generation of a pseudorandom point .
We will employ a technique akin to stratified symmetrized Monte Carlo [16]. The approach relies on a modified Sobol sequence generated via a shaking procedure. To date, it is regarded among the most effective available schemes for evaluating sensitivity indices. The underlying idea in the two-dimensional setting, for the MCA-MSS-1 algorithm, is depicted in Figure 1. Accordingly, the integral can be estimated [23] by
It has been established that the MCA-MSS-2-S algorithm attains the optimal convergence rate for continuous functions possessing continuous first derivatives and uniformly bounded second derivatives [24]. So far, this method has produced some of the strongest empirical performance in sensitivity index estimation [23].
Next, we adopt the so-called lattice method. To present the rank-1 lattice rule, we use the standard construction [33,34]:
where N is an integer with , is the generating vector, and z denotes the fractional part of z.
For the definition of the and see [35].
We say that belongs to the class of functions for and , if f is a periodic function with period 1 for each of its components , defined over the unit cube , and its Fourier coefficients satisfy the following inequalities:
where
and the constant c does not depend on
The discrepancy and the “worst-case” error are two most important characteristics for improving the quality of the lattice sequences. Consider the point set in and . Assume that and . Then the discrepancy of the set is defined as
For the worst-case error is defined as [35,36]
The quantity and the discrepancy are similar measures of the quality of the lattice point set.
The quantity and the discrepancy can be viewed as closely related indicators of the quality of a lattice point set. The presence of lattice constructions exhibiting both a small discrepancy and a small worst-case integration error is strongly intertwined [35]. Korobov and Bakhvalov [36,37] showed that when N is prime, one can choose the generating vector optimally such that
In 1959, Bakhvalov [37] established that there exists an optimal way to select the generating vector :
and for , , and do not depend on N.
The generating vector , which satisfies (10), is an optimal generating vector [35] and the main difficulty lies in the construction of the optimal vectors for very high dimensions.
The initial generating vector used in constructing our LR is formed of the generalized Fibonacci numbers for the given dimension, and we refer to the resulting scheme as L-FIB. It is a sum of previous s terms from this sequence:
and the following initial conditions hold:
L-FIB will use the following generating vector [35,38]:
where we assume that
and () is the term of the s-dimensional Fibonacci sequence [35].
We next focus on a particular lattice rule, namely the tuned scheme (M-TUNED), which is built upon the component-by-component (CBC) construction framework [30,39,40,41]. Using this approach, we obtain an (approximately) optimal generating vector for rank-1 lattice rules with a prime number of points and order-dependent weights.
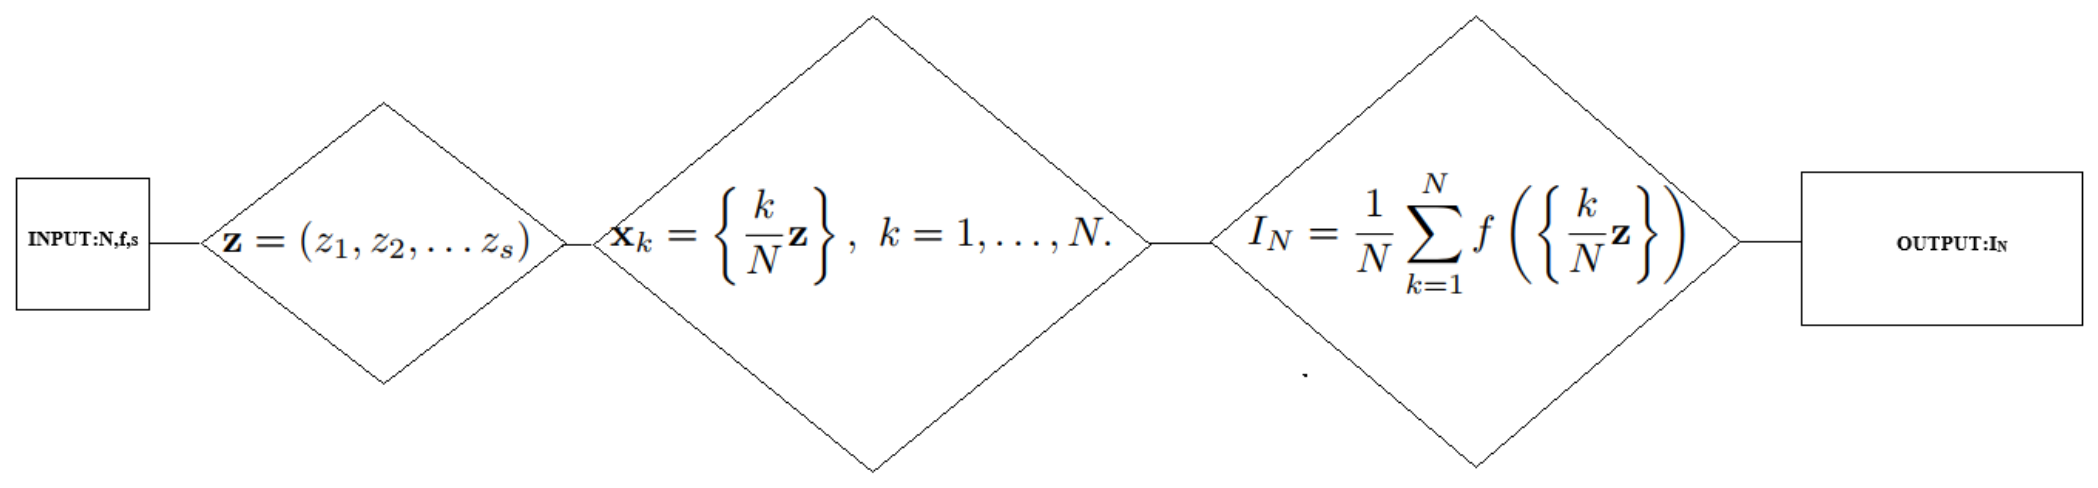
In the first stage of the procedure, an s-dimensional generating vector is computed via the fast CBC algorithm described by Dirk Nuyens [42].
In the second step of the algorithm we generate the points of lattice rule using the formula And at the third and last steps of the algorithm an approximate value of the multidimensional integral is evaluated using the formula:
The method has an optimal rate of convergence [35,42]:
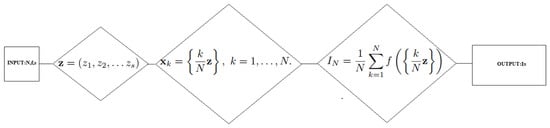
The steps of the method are given in the flowchart in Figure 2.
Figure 2.
A flowchart of the algorithm.
4. Case Study—UNI-DEM Model
The input dataset for SA was generated from simulations of a large-scale mathematical model for long-range air-pollutant transport—the Unified Danish Eulerian Model (UNI-DEM). UNI-DEM is formulated mathematically [43,44,45] through the following system of partial differential equations:
The number of q equations in this system is equal to the number of pollutants studied by the model. The other dimensions included in the model are described below:
- —pollutant concentrations;
- —wind components along the coordinate axes;
- —diffusion coefficients;
- —space emissions;
- —dry and wet deposit coefficients, respectively ();
- —nonlinear functions describing chemical reactions between pollutants.
The efficient MC algorithms for multidimensional numerical integration described above have been applied to sensitivity studies of concentration variations in air pollutants with respect to emission levels and some chemical reactions rates.
4.1. Sensitivity Studies with Respect to Emission Levels
Firstly we will study the sensitivity of the model output (in terms of mean monthly concentrations of several important pollutants) with respect to variation in input emissions of the anthropogenic pollutants. The anthropogenic input emissions consist of four different components as follows:
The output of the model is the mean monthly concentration of the following 3 pollutants:
- —ozone ();
- —ammonia ();
- —ammonium sulphate and ammonium nitrate ().
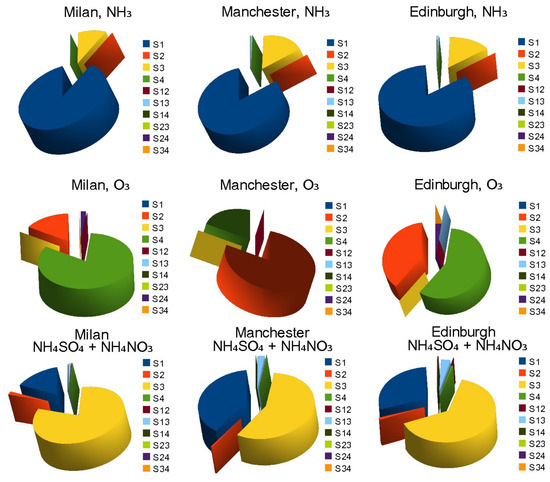
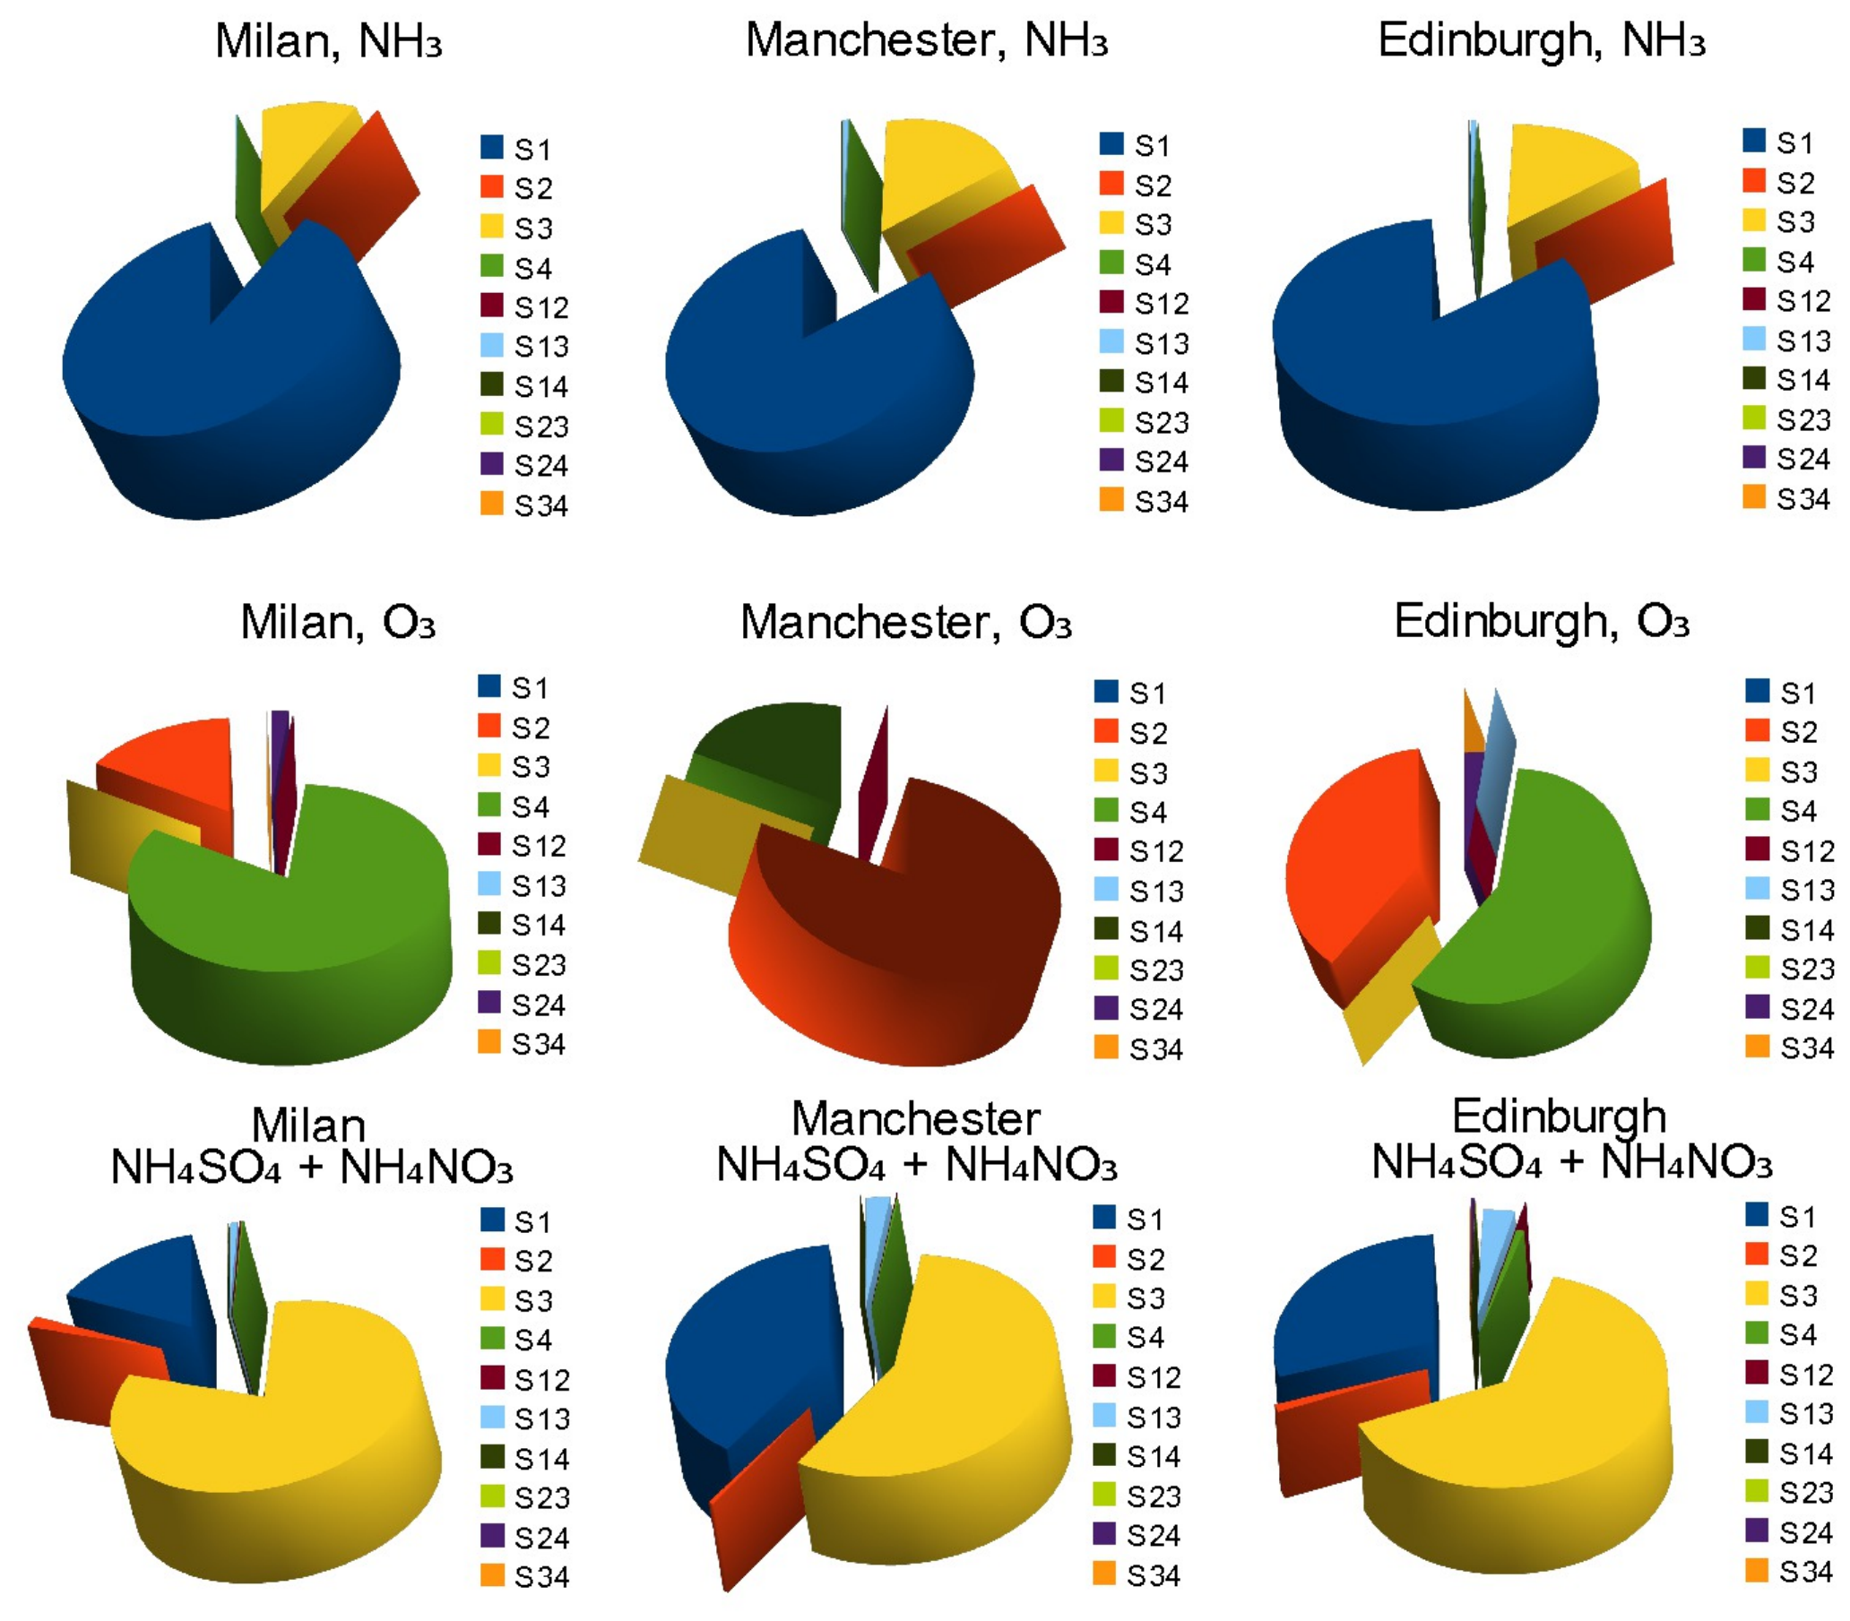
In our particular case we are interested in sensitivity studies of the mean monthly concentrations of ammonia in Milan. For an in-depth analysis, see the results for the first- and second-order sensitivity indices of ammonia, ozone, and ammonium sulphate and ammonium nitrate in Milan, Manchester, and Edinburgh represented graphically in Figure 3.
Figure 3.
Pie chart representation of first- and second-order sensitivity indices.
The domain under consideration is the 4-dimensional hypercubic domain .
The estimated quality is denoted by EQ. The relative errors and computational times for the approximate evaluation of the quantities , total variance, and first-order and total sensitivity indices using various stochastic approaches for numerical integration are presented in Table 1, Table 2 and Table 3, respectively. The quantity is represented by the 4-dimensional integral whereas the rest of quantities are represented by double integrals.
Table 1.
Relative errors and computational times for the approximate evaluation of .
Table 2.
Relative errors for the approximate evaluation of the total variance .
Table 3.
Relative errors for estimation of sensitivity indices of input parameters using various stochastic approaches ().
Table 1 summarizes the relative errors obtained in the approximate evaluation of the integral quantity using three different stochastic numerical integration techniques: the modified Sobol’ sequence with two-level scrambling (MSS-2S), a tuned Monte Carlo-based method (M-TUNED), and the Fibonacci lattice rule (L-FIB). The errors are reported for progressively increasing sample sizes (, , , and ). This comparative analysis provides insight into both the convergence rates and practical accuracy of the different approaches in high-dimensional settings.
At the lowest sample size (), the MSS-2S method already achieves a remarkably low relative error of , which is substantially smaller than the errors of M-TUNED () and L-FIB (). This striking initial accuracy highlights the exceptional space-filling properties of the Sobol’ sequence and the effectiveness of scrambling in variance reduction, even with a very limited number of points. When increasing to , all methods show clear improvement. MSS-2S remains the most accurate, reducing its relative error to . Both M-TUNED and L-FIB achieve an error of , showing a significant decrease compared to their respective errors at , though still lagging behind MSS-2S. This indicates that while these methods benefit from more points, the quasi-Monte Carlo approach of MSS-2S still provides a sharper error reduction. At , MSS-2S attains an even smaller error of , confirming its rapid convergence and strong asymptotic behavior. M-TUNED reduces its error to , showing a steady improvement, and L-FIB reaches . Although the gap to MSS-2S narrows slightly, MSS-2S continues to exhibit superior accuracy, particularly important for applications requiring precise integral estimates. Finally, at the highest resolution considered (), MSS-2S achieves an exceptionally low relative error of , reflecting near machine-precision level accuracy in this context. The errors for M-TUNED and L-FIB are reduced to and , respectively. At this stage, both M-TUNED and L-FIB demonstrate comparable performance, but MSS-2S still maintains a clear advantage.
Overall, these results underline the exceptional performance of MSS-2S, which consistently exhibits the lowest relative errors across all tested sample sizes. The rapid convergence of MSS-2S makes it highly suitable for problems requiring very high accuracy, such as environmental and atmospheric modeling where small deviations can lead to significantly different conclusions about pollutant dispersion or chemical reaction dynamics. The M-TUNED method shows robust performance as the sample size grows, indicating that it is a viable choice in scenarios where very large point sets can be utilized, and where computational resources permit. Meanwhile, L-FIB shows reliable but slower convergence, suggesting it is better suited to applications where moderate accuracy is acceptable or where lattice rules are preferred for algorithmic simplicity. These findings emphasize the critical importance of method selection in high-dimensional numerical integration tasks. The superior performance of MSS-2S, particularly at smaller n, makes it a preferred approach when computational efficiency and precision are paramount.
Table 2 reports the relative errors for the approximate evaluation of the total variance using three different stochastic numerical integration approaches: the modified Sobol’ sequence with two-level scrambling (MSS-2S), a tuned Monte Carlo-based method (M-TUNED), and the Fibonacci-based lattice rule (L-FIB). The results are shown for sample sizes , , , and , enabling a detailed analysis of the convergence behavior and numerical efficiency of each method.
At the smallest sample size (), the MSS-2S method already demonstrates a substantially lower relative error () compared to M-TUNED () and L-FIB (). This strong performance at low n underscores the superior space-filling properties of low-discrepancy sequences, further enhanced by scrambling techniques that reduce variance and improve uniformity, even with limited computational resources. As the number of points increases to , the relative errors decrease across all methods, reflecting convergence to the true variance value. MSS-2S continues to maintain the lowest error at , while M-TUNED improves significantly to , and L-FIB reduces to . However, the gap between MSS-2S and the other methods remains large, highlighting its superior accuracy and faster convergence rate. At , MSS-2S achieves a remarkably low error of , indicating high numerical precision and confirming its excellent asymptotic behavior. M-TUNED reduces its error further to , showing steady improvement as the sample size increases. L-FIB, although converging, exhibits a higher error of , suggesting that its convergence rate is slower and it remains more sensitive to the integrand’s structure. For the largest considered sample size (), MSS-2S achieves an error of only , reflecting extremely high accuracy suitable for demanding sensitivity analysis and uncertainty quantification applications. M-TUNED shows continued improvement, reducing its error to , demonstrating its potential as a competitive method at higher n values. L-FIB also converges further to , narrowing the gap slightly but still trailing behind the other two methods.
These results collectively illustrate the clear advantages of MSS-2S. Its consistently lower errors, particularly at small and moderate sample sizes, make it the preferred choice when computational efficiency and precision are both critical. The strong performance of M-TUNED at larger sample sizes suggests it is a viable alternative when the computational budget permits larger n, providing robust convergence without the need for sophisticated lattice constructions. In contrast, L-FIB, while exhibiting steady improvement with increasing n, converges more slowly. This slower convergence can be attributed to the simpler structure of Fibonacci-based lattice rules, which do not incorporate explicit optimization of generating vectors or advanced scrambling techniques. In summary, these findings emphasize the importance of careful integration method selection in the context of total variance estimation, especially when accurate sensitivity indices are essential for model validation, environmental risk assessment, or policy-related decision-making.
Table 3 presents the relative errors associated with the estimation of both first-order () and total-effect () sensitivity indices of input parameters using various stochastic approaches with a fixed sample size of approximately . The methods evaluated include the standard random vector Monte Carlo approach (RV), the modified Sobol’ sequence with two-level scrambling (MSS-2-S), a tuned Monte Carlo-based method (M-TUNED), and the Fibonacci-based lattice rule (L-FIB).
For the first-order indices, shows the clearest advantage of M-TUNED, achieving an exceptionally low relative error of , significantly outperforming MSS-2-S () and L-FIB (). The RV method performs poorly in this case with a very high error of , underscoring its limitations in high-dimensional or variance-sensitive integrals. Regarding , the performance is more varied. While RV performs well here (error of ), M-TUNED yields a high error (), suggesting possible difficulty in capturing effects of this specific input parameter, potentially due to nonlinearities or weak contributions to variance. MSS-2-S achieves a moderate error (), and L-FIB performs slightly better than M-TUNED but still shows a relatively high error (). For , both M-TUNED and L-FIB achieve the lowest error (), outperforming MSS-2-S () and RV (). This suggests that lattice-based approaches and tuned sampling may be particularly effective for this parameter, possibly due to smoother or more regular integrand structure. In contrast, reveals significant challenges across all methods. M-TUNED shows the highest error (), indicating severe convergence issues for this parameter. MSS-2-S also performs poorly (), as does L-FIB (). Interestingly, RV achieves a relatively small error (), possibly benefiting from a fortuitous cancelation of errors in this specific setup. When examining total-effect indices (), M-TUNED again generally performs well. For , it achieves a very low error (), better than MSS-2-S () and L-FIB (), highlighting its effectiveness in capturing both main effects and higher-order interactions. For , MSS-2-S performs best (), followed by RV (). Both M-TUNED and L-FIB show higher errors ( and , respectively), again reflecting challenges in resolving this particular parameter’s contribution. In , M-TUNED attains the lowest error (), outperforming MSS-2-S () and L-FIB (). This suggests a clear advantage of the tuned approach in accurately capturing higher-order effects for this parameter. Finally, for , MSS-2-S yields the smallest error (), followed by RV (), while both M-TUNED and L-FIB exhibit large errors ( and , respectively), again revealing difficulties in estimating the total contribution of this parameter.
Overall, these results underscore several key observations. First, the method shows highly variable performance, performing unexpectedly well in certain parameters but generally exhibiting high instability. MSS-2-S and M-TUNED consistently demonstrate superior accuracy for most indices, with MSS-2-S especially excelling in total-effect indices that involve capturing global variance contributions. L-FIB, while improving with sample size, generally shows higher errors and slower convergence. These findings highlight the importance of selecting an appropriate stochastic approach based on the specific integrand structure and the sensitivity measure of interest. The superior convergence properties of quasi-Monte Carlo methods like MSS-2-S and the strong targeted performance of M-TUNED make them highly attractive for complex environmental and engineering models, especially when accurate global sensitivity analysis is critical.
4.2. Sensitivity Studies with Respect to Chemical Reactions Rates
In this part we will study the sensitivity of the ozone concentration in Genova according to the rate variation in some chemical reactions: ## (time-dependent) and (time independent) reactions of the condensed CBM-IV scheme [43]. The simplified chemical equations of these reactions are as follows:
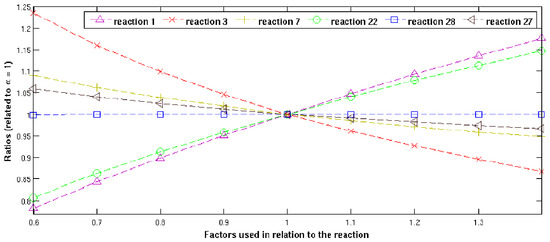
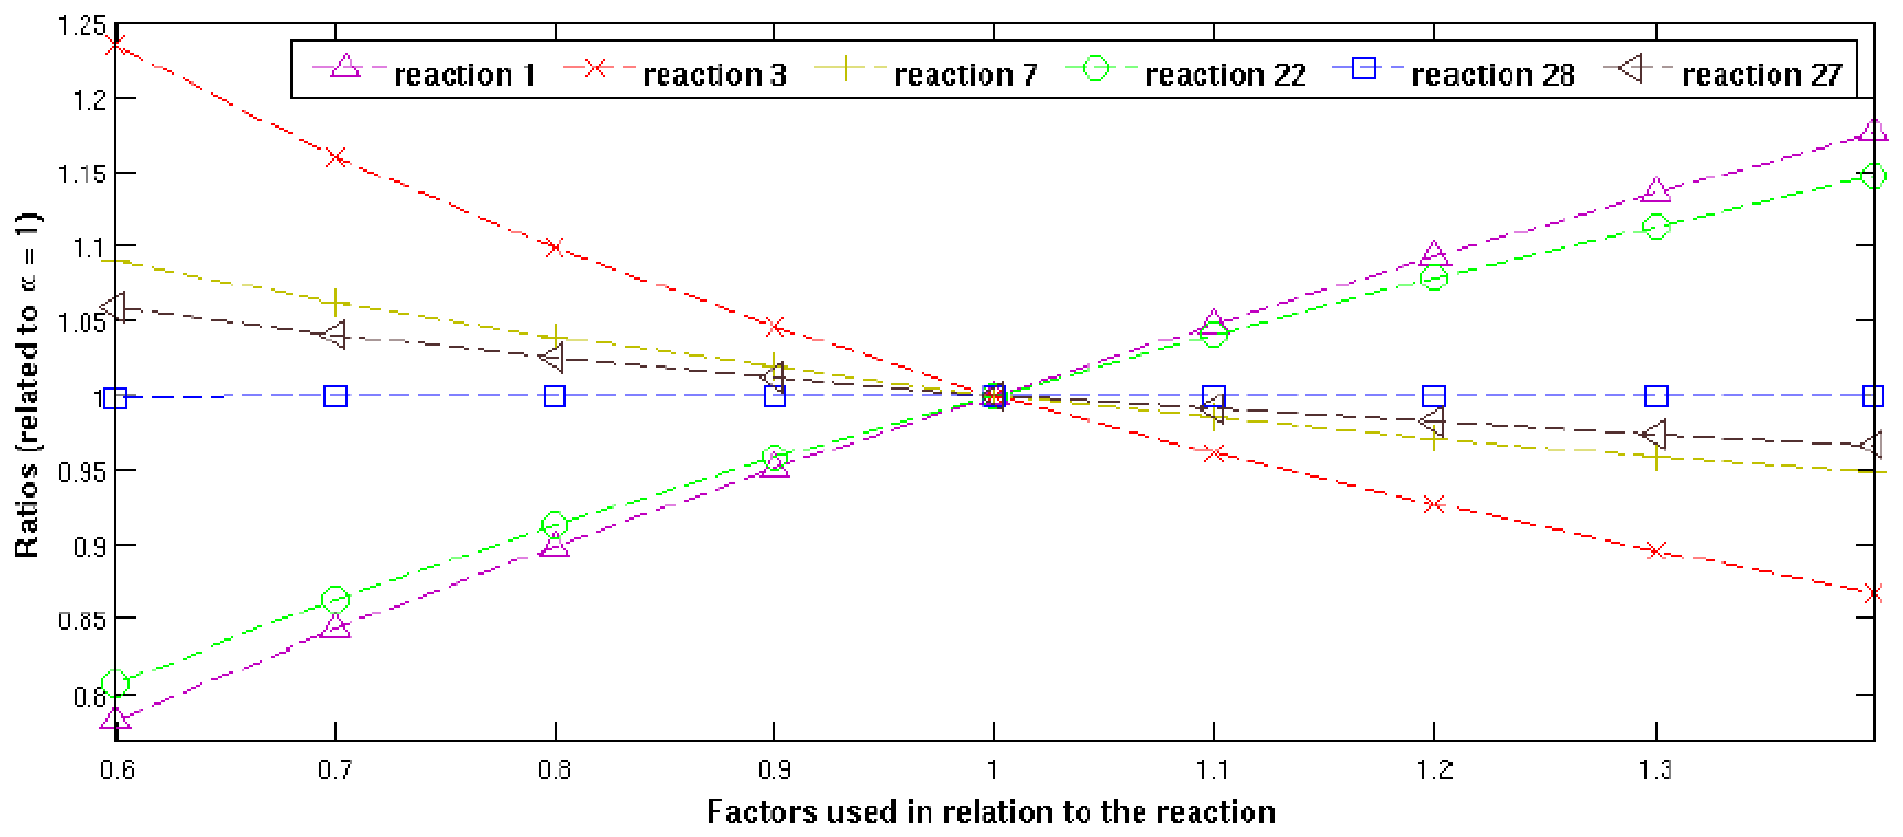
The domain under consideration is the 6-dimensional hypercubic domain ). Polynomials of second degree have been used again as an approximation tool [8]. The study of the impact of changes in ozone concentrations on chemical rates for Genova on July 1998 is shown in Figure 4.
Figure 4.
Chemical rate changes at varying ozone concentrations (Genova, July 1998).
The relative errors and computational times for the approximate evaluation of the quantities , total variance, and first-order and total sensitivity indices using various stochastic approaches for numerical integration are presented in Table 4, Table 5 and Table 6, respectively. Firstly, we should specify that the quantity is represented by the 6-dimensional integral, whereas the rest of the quantities under consideration are represented by double integrals.
Table 4.
Relative errors and computational times for the approximate evaluation of .
Table 5.
Relative errors for the approximate evaluation of the total variance .
Table 6.
Relative errors for estimation of sensitivity indices of input parameters using various stochastic approaches ().
Table 4 presents the relative errors associated with the approximate evaluation of the quantity of interest using various stochastic integration techniques and different numbers of sampling points n. The methods under comparison are the modified Sobol’ sequence with two-level scrambling (MSS-2-S), the lattice rule with an optimized generating vector (M-TUNED), and the Fibonacci-based lattice rule (L-FIB).
The table shows relative errors for four different sample sizes, namely , , , and , allowing for an analysis of convergence behavior and accuracy scaling. For the smallest sample size (), the MSS-2-S method achieves a remarkably low relative error of , significantly outperforming both M-TUNED () and L-FIB (). This demonstrates the strong initial efficiency of MSS-2-S, attributed to its low-discrepancy sequence and effective scrambling, which reduce variance even at low point counts. As the number of points increases to , all methods exhibit a substantial reduction in error. MSS-2-S continues to provide the lowest error at , closely followed by M-TUNED at , while L-FIB achieves . This illustrates that M-TUNED begins to approach the performance of MSS-2-S when more points are used, thanks to its carefully optimized generating vector that enhances uniformity and reduces integration error. At , MSS-2-S maintains a clear advantage with a very small error of . Although M-TUNED records a slightly higher error of , it still exhibits good convergence behavior, indicating its robustness in higher resolution settings. L-FIB, while improved, still lags with an error of , suggesting a slower convergence rate and higher sensitivity to integrand structure. Finally, for the largest sample size (), MSS-2-S reports an error of , slightly higher than its value at , which may reflect small fluctuations due to stochastic error or integrand oscillations. M-TUNED achieves an error of , confirming its continued convergence and strong overall accuracy. L-FIB shows an error of , further reduced but still higher compared to the other methods.
The overall trend demonstrates that the MSS-2-S method consistently provides the highest accuracy across all sample sizes. Its performance is attributed to its superior space-filling properties and variance reduction techniques (scrambling), which make it particularly well-suited for smooth integrands as encountered in environmental and atmospheric models. The M-TUNED method also performs robustly, showing a comparable convergence trend to MSS-2-S at higher point counts, making it a competitive alternative when optimized lattice rules are favored due to computational or implementation considerations. In contrast, while L-FIB exhibits steady improvement as n increases, its higher initial errors and slower convergence highlight limitations in effectively capturing complex integrand behavior with its simpler structure. These results collectively emphasize the importance of careful selection of integration schemes in high-dimensional sensitivity analysis and model calibration tasks. The demonstrated superiority of MSS-2-S, along with the promising performance of M-TUNED, underlines their suitability for applications requiring high precision, such as pollutant concentration assessments and policy-driven environmental simulations.
Table 5 summarizes the relative errors associated with the approximate evaluation of the total variance , which is estimated to be approximately , using different stochastic approaches and various sample sizes n. The methods compared include the modified Sobol’ sequence with two-level scrambling (MSS-2-S), a tuned Monte Carlo-based method (M-TUNED), and the lattice rule based on a Fibonacci construction (L-FIB). The relative errors are presented for four increasing sample sizes, , , , and , to evaluate the convergence behavior and accuracy of each approach.
For small sample sizes (), the MSS-2-S method already shows strong performance, achieving the lowest relative error of , slightly outperforming M-TUNED (). In contrast, L-FIB exhibits a significantly larger error of , indicating limited effectiveness at very low sample resolutions. This result highlights the advantage of the MSS-2-S sequence’s superior uniformity and low-discrepancy properties, which are crucial in scenarios with restricted computational budgets. As the number of points increases to , a marked improvement in accuracy is observed across all methods. MSS-2-S continues to lead with a very low error of , while M-TUNED shows an error of . L-FIB, although still trailing, exhibits a significant reduction in error to , demonstrating its convergence but at a slower rate compared to the quasi-Monte Carlo-based approaches. At , MSS-2-S again delivers the best performance with a minimal error of . This extremely low value indicates excellent convergence and the effectiveness of scrambling techniques in reducing variance. M-TUNED achieves an error of , while L-FIB reduces its error to , showing a consistent but gradual convergence trend. Finally, at the highest considered sample size (), both MSS-2-S and M-TUNED attain nearly equivalent and exceptionally small errors of , demonstrating that M-TUNED can catch up in accuracy given sufficient points. Meanwhile, L-FIB further improves, reaching an error of . However, it still lags behind the other two methods in terms of precision.
Overall, these results clearly highlight the superior performance and faster convergence of MSS-2-S, particularly for moderate to high sample sizes. The effectiveness of the scrambling and the low-discrepancy properties make it highly suitable for high-precision variance estimation. The M-TUNED method also shows robust performance, especially at larger n, suggesting that it is a viable alternative when large sample sizes are computationally affordable. In contrast, while L-FIB does improve with increasing n, its slower convergence and initially high error values suggest it is less efficient for accurately estimating total variance in high-dimensional problems. These findings underscore the importance of selecting integration rules that are well-suited to the smoothness and dimensionality of the integrand, especially in environmental modeling contexts where high accuracy in variance estimation is critical for reliable sensitivity analysis and model validation.
Table 6 presents the relative errors associated with the estimation of sensitivity indices of input parameters using various stochastic approaches, based on a sample size of approximately . The considered methods include the standard Random Vector (RV) technique, the Modified Sobol’ Sequence with two-level scrambling (MSS-2-S), the lattice rule with optimized order-dependent weights (M-TUNED), and the Fibonacci-based lattice rule (L-FIB).
The results are reported for first-order indices (), total-effect indices (), and selected second-order interaction indices (). Each index quantifies the contribution of individual or interacting input parameters to the variance of the model output.
For the first-order indices, the M-TUNED method consistently exhibits the lowest relative errors across most parameters, indicating superior accuracy in capturing the individual effects of inputs. For example, for , M-TUNED achieves an error of , significantly lower than that of RV (), MSS-2-S (), and L-FIB (). Similar trends are observed for , , and , confirming the robustness of M-TUNED in high-dimensional settings.
A notable exception is , where both M-TUNED and MSS-2-S result in very large errors (), while RV performs better in this particular case. This suggests potential challenges in capturing the effect of certain inputs when their contribution is extremely small or the variance is dominated by other factors.
Regarding total-effect indices, M-TUNED again outperforms other approaches, particularly for and , where it achieves errors of and , respectively. The relative errors for L-FIB and MSS-2-S remain higher, especially in complex or strongly nonlinear interactions.
For interaction indices (, , , and ), M-TUNED generally achieves the smallest errors, confirming its ability to capture not only main effects but also higher-order interactions. For instance, is estimated to have an error of using M-TUNED, compared to using MSS-2-S and using L-FIB.
Overall, the analysis clearly demonstrates that the M-TUNED method, based on an optimized lattice rule with order-dependent weights, offers significant improvements in accuracy and stability for sensitivity analysis of high-dimensional environmental models. Its enhanced performance, especially for small and interaction effects, makes it a reliable choice for rigorous uncertainty quantification tasks in complex atmospheric simulations such as those involving UNI-DEM.
5. Conclusions
In summary, the primary contribution of this work lies in the development and application of a novel rank-1 refined lattice method, equipped with a tuned generating vector derived through a component-by-component construction approach with order-dependent weights. This methodology introduces a significant innovation within the field of environmental modeling, and particularly in the context of the UNI-DEM framework, where the high dimensionality and intricate nature of the integrands pose substantial computational challenges.
The proposed lattice rule is constructed using a CBC algorithm that leverages a prime number of points, ensuring good distribution properties and minimizing integration error even in high-dimensional spaces. Comparative analysis reveals that this technique achieves remarkable improvements in computational efficiency relative to other existing lattice-based approaches, and in many scenarios matches or surpasses the performance of advanced quasi-Monte Carlo methods such as the modified Sobol’ sequence. These advantages become especially prominent when analyzing chemical reaction rates within UNI-DEM, where the complexity and dimensionality of the integrals significantly increase.
Beyond its technical merits, this study underscores the critical importance of systematically investigating the relationships between input parameters and model outputs to assess the reliability and predictive capacity of large-scale environmental models. In this context, the sensitivity analysis conducted here focuses on evaluating the effects of varying emission levels on major atmospheric pollutants, including ammonia, ozone, ammonium sulfate, and ammonium nitrate, across a diverse set of major European metropolitan areas with differing geographical and meteorological characteristics. To rigorously quantify these effects, variance-based sensitivity analysis techniques—most notably the Sobol’ method—are utilized to derive global sensitivity indices (SIs), which comprehensively capture the contribution of each input parameter and their interactions to the output variability.
Author Contributions
Conceptualization, V.T.; methodology, V.T.; investigation, V.T.; writing—original draft preparation, V.T.; writing—review and editing, V.T.; supervision, V.T.; project administration, V.T. and M.S.; funding acquisition, M.S. All authors have read and agreed to the published version of the manuscript.
Funding
The authors would like to thank the Research and Development Sector at the Technical University of Sofia for the financial support.
Institutional Review Board Statement
Not applicable.
Informed Consent Statement
Not applicable.
Data Availability Statement
The data are contained within the article.
Acknowledgments
Venelin Todorov was partially supported by University-Wide Research Grant No. OUF-RD-15/2025 at Prof. Dr. Assen Zlatarov Burgas State University: “Extraction of Expert Knowledge through Innovative Analytical Methods” and by the Centre of Excellence in Informatics and ICT under Grant No. BG16RFPR002-1.014-0018, financed by the Research, Innovation and Digitalization for Smart Transformation Programme 2021–2027 and co-financed by the European Union. Methodology is supported by BNSF under Projects KP-06-N82/4 and KP-06-N62/6.
Conflicts of Interest
The authors declare no conflicts of interest.
References
- Ferretti, F.; Tarantola, A.S.S. Trends in sensitivity analysis practice in the last decade. J. Sci. Total Environ. 2016, 568, 666–670. [Google Scholar] [CrossRef] [Scilit]
- Saltelli, A. Making best use of model valuations to compute sensitivity indices. Comput. Phys. Commun. 2002, 145, 280–297. [Google Scholar] [CrossRef] [Scilit]
- Saltelli, A.; Tarantola, S.; Campolongo, F.; Ratto, M. Sensitivity Analysis in Practice: A Guide to Assessing Scientific Models; Halsted Press: New York, NY, USA, 2004. [Google Scholar]
- Sobol, I.M. Sensitivity estimates for nonlinear mathematical models. Math. Model. Comput. Exp. 1993, 1, 407–414. [Google Scholar]
- Sobol, I.M.; Tarantola, S.; Gatelli, D.; Kucherenko, S.; Mauntz, W. Estimating the approximation error when fixing unessential factors in global sensitivity analysis. Reliab. Eng. Syst. Saf. 2007, 92, 957–960. [Google Scholar] [CrossRef] [Scilit]
- Gery, M.; Whitten, G.; Killus, J.; Dodge, M. A photochemical kinetics mechanism for urban and regional scale computer modelling. J. Geophys. Res. 1989, 94, 12925–12956. [Google Scholar] [CrossRef] [Scilit]
- Homma, T.; Saltelli, A. Importance Measures in Global Sensitivity Analysis of Nonlinear Models. Reliab. Eng. Syst. Saf. 1996, 52, 1–17. [Google Scholar] [CrossRef] [Scilit]
- Dimov, I.T.; Georgieva, R.; Ostromsky, T.; Zlatev, Z. Variance-based Sensitivity Analysis of the Unified Danish Eulerian Model According to Variations of Chemical Rates. In Numerical Analysis and Its Applications; Dimov, I., Faragó, I., Vulkov, L., Eds.; Springer: Berlin/Heidelberg, Germany, 2013; Volume 8236, pp. 247–254. [Google Scholar]
- Dimov, I.T.; Georgieva, R.; Ostromsky, T.; Zlatev, Z. Sensitivity Studies of Pollutant Concentrations Calculated by UNI-DEM with Respect to the Input Emissions. Cent. Eur. J. Math. Methods Large Scale Sci. Comput. 2013, 11, 1531–1545. [Google Scholar] [CrossRef] [Scilit]
- Ostromsky, T.; Dimov, I.T.; Georgieva, R.; Zlatev, Z. Air pollution modelling, sensitivity analysis and parallel implementation. Int. J. Environ. Pollut. 2011, 46, 83–96. [Google Scholar] [CrossRef] [Scilit]
- Ostromsky, T.; Dimov, I.T.; Georgieva, R.; Zlatev, Z. Parallel computation of sensitivity analysis data for the Danish Eulerian Model. In Proceedings of the 8th International Conference LSSC’11, LNCS-7116; Springer: Berlin/Heidelberg, Germany, 2012; pp. 301–309. [Google Scholar]
- Ostromsky, T.; Dimov, I.T.; Marinov, P.; Georgieva, R.; Zlatev, Z. Advanced sensitivity analysis of the Danish Eulerian Model in parallel and grid environment. In Proceedings of the 3rd International Conference AMiTaNS’11, AIP Conference Proceedings, Albena, Bulgaria, 20–25 June 2011; Volume 1404, pp. 225–232. [Google Scholar]
- Dimov, I. Monte Carlo Methods for Applied Scientists; World Scientific: Hackensack, NJ, USA; London, UK; Singapore, 2008; 291p. [Google Scholar]
- Dimov, I.; Atanassov, E. What Monte Carlo models can do and cannot do efficiently? Appl. Math. Model. 2007, 32, 1477–1500. [Google Scholar]
- Dimov, I.T.; Georgieva, R.; Ostromsky, T.; Zlatev, Z. Advanced Algorithms for Multidimensional Sensitivity Studies of Large-scale Air Pollution Models based on Sobol Sequences. Comput. Math. Appl. 2013, 65, 338–351. [Google Scholar] [CrossRef] [Scilit]
- Sobol, I. Numerical Methods Monte Carlo; Nauka: Moscow, Russia, 1973. [Google Scholar]
- Antonov, I.; Saleev, V. An economic method of computing LPτ-sequences. USSR Comput. Math. Phy. 1979, 19, 252–256. [Google Scholar] [CrossRef] [Scilit]
- Boutchaktchiev, V. Inferred Loss Rate as a Credit Risk Measure in the Bulgarian Banking System. Mathematics 2025, 13, 1462. [Google Scholar] [CrossRef] [Scilit]
- Fidanova, S. Simulated Annealing: A Monte Carlo Method for GPS Surveying. In Computational Science—ICCS 2006. ICCS 2006; Lecture Notes in Computer Science; Alexandrov, V.N., van Albada, G.D., Sloot, P.M.A., Dongarra, J., Eds.; Springer: Berlin/Heidelberg, Germany, 2006; Volume 3991. [Google Scholar]
- Joe, S.; Kuo, F. Remark on Algorithm 659: Implementing Sobol’s quasirandom sequence generator. ACM Trans. Math. Softw. 2003, 29, 49–57. [Google Scholar] [CrossRef] [Scilit]
- Karaivanova, A.; Atanassov, E.; Gurov, T.; Stevanovic, R.; Skala, K. Variance reduction MCMs with application in environmental studies: Sensitivity analysis. AIP Conf. Proc. 2008, 1067, 549–558. [Google Scholar] [CrossRef] [Scilit]
- Karaivanova, A.; Dimov, I.; Ivanovska, S. A quasi-Monte Carlo method for integration with improved convergence. In International Conference on Large-Scale Scientific Computing; Springer: Berlin/Heidelberg, Germany, 2001; pp. 158–165. [Google Scholar]
- Dimov, I.T.; Georgieva, R. Monte Carlo Method for Numerical Integration Based on Sobol’ Sequences, Numerical Methods and Applications; LNCS 6046; Dimov, I., Dimova, S., Kolkovska, N., Eds.; Springer: Berlin/Heidelberg, Germany, 2011; pp. 50–59. [Google Scholar]
- Dimov, I.T.; Georgieva, R. Multidimensional Sensitivity Analysis of Large-Scale Mathematical Models. In Numerical Solution of Partial Differential Equations: Theory, Algorithms, and Their Applications; Springer Proceedings in Mathematics & Statistics 45; Iliev, O.P., Margenov, S.D., Minev, P.D., Vassilevski, P.S., Zikatanov, L.T., Eds.; Springer Science+Business Media: New York, NY, USA, 2013; pp. 137–156. [Google Scholar]
- Dimov, I.; Georgieva, R. Monte Carlo algorithms for evaluating Sobol’ sensitivity indices. Math. Comput. Simul. 2010, 81, 506–514. [Google Scholar] [CrossRef] [Scilit]
- Karaivanova, A.; Dimov, I. Error analysis of an adaptive Monte Carlo method for numerical integration. Math. Comput. Simul. 1998, 47, 201–213. [Google Scholar] [CrossRef] [Scilit]
- Owen, A. Randomly Permuted (t, m, s)-nets and (t, s)-sequences. In Monte Carlo and Quasi-Monte Carlo Methods in Scientific Computing; 106 in Lecture Notes in Statistics; Springer: New York, NY, USA, 1995; pp. 299–317. [Google Scholar]
- Owen, A. Scrambled net variance for integrals of smooth functions. Ann. Stat. 1997, 25, 1541–1562. [Google Scholar] [CrossRef] [Scilit]
- Owen, A. Variance and Discrepancy with Alternative Scramblings. ACM Trans. Comput. Logic. 2002, 5, 1–16. [Google Scholar]
- Baldeaux, J.; Dick, J.; Leobacher, G.; Nuyens, D.; Pillichshammer, F. Efficient calculation of the worst-case error and (fast) component-by-component construction of higher order polynomial lattice rules. Numer. Algorithms 2012, 59, 403–431. [Google Scholar]
- Dimov, I.; Zlatev, Z. Testing the sensitivity of air pollution levels to variations of some chemical rate constants. Notes Numer. Fluid Mech. 1997, 62, 167–175. [Google Scholar]
- The Danish Eulerian Model. Available online: http://www2.dmu.dk/AtmosphericEnvironment/DEM/ (accessed on 28 January 2026).
- Sloan, I.H.; Joe, S. Lattice Methods for Multiple Integration; Oxford University Press: Oxford, UK, 1994. [Google Scholar]
- Sloan, I.H.; Kachoyan, P.J. Lattice methods for multiple integration: Theory, error analysis and examples. SIAM J. Numer. Anal. 1987, 24, 116–128. [Google Scholar] [CrossRef] [Scilit]
- Wang, Y.; Hickernell, F.J. An historical overview of lattice point sets. In Monte Carlo and Quasi-Monte Carlo Methods 2000; Fang, K.T., Niederreiter, H., Hickernell, F.J., Eds.; Springer: Berlin/Heidelberg, Germany, 2002; pp. 158–167. [Google Scholar]
- Korobov, N.M. Number-Theoretic Methods in Approximate Analysis; Fizmatgiz: Moscow, Russia, 1963. (In Russian) [Google Scholar]
- Bahvalov, N. On the Approximate Computation of Multiple Integrals. Vestn. Mosc. State Univ. 1959, 4, 3–18. [Google Scholar]
- Hua, L.K.; Wang, Y. Applications of Number Theory to Numerical Analysis; Springer: Beijing, China; New York, NY, USA, 1981. [Google Scholar]
- Cools, R.; Kuo, F.; Nuyens, D. Constructing Embedded Lattice Rules for Multivariate Integration. SIAM J. Sci. Comput. 2006, 28, 2162–2188. [Google Scholar] [CrossRef] [Scilit]
- Nuyens, D.; Cools, R. Fast algorithms for component-by-component construction of rank-1 lattice rules in shift-invariant reproducing kernel Hilbert spaces. Math. Comp. 2006, 75, 903–920. [Google Scholar] [CrossRef] [Scilit]
- Sloan, I.H.; Reztsov, A.V. Component-by-component construction of good lattice rules. Math. Comp. 2002, 71, 263–273. [Google Scholar]
- Kuo, F.Y.; Nuyens, D. Application of quasi-Monte Carlo methods to elliptic PDEs with random diffusion coefficients—A survey of analysis and implementation. Found. Comput. Math. 2016, 16, 1631–1696. [Google Scholar] [CrossRef] [Scilit]
- Zlatev, Z. Computer Treatment of Large Air Pollution Models; KLUWER Academic Publishers: Dordrecht, The Netherlands; Boston, UK; London, UK, 1995. [Google Scholar]
- Zlatev, Z.; Dimov, I.T.; Georgiev, K. Three-dimensional version of the Danish Eulerian model. Z. Angew. Math. Mech. 1996, 76, 473–476. [Google Scholar]
- Zlatev, Z.; Dimov, I.T. Computational and Numerical Challenges in Environmental Modelling; Elsevier: Amsterdam, The Netherlands, 2006. [Google Scholar]

Disclaimer/Publisher’s Note: The statements, opinions and data contained in all publications are solely those of the individual author(s) and contributor(s) and not of MDPI and/or the editor(s). MDPI and/or the editor(s) disclaim responsibility for any injury to people or property resulting from any ideas, methods, instructions or products referred to in the content. |
© 2026 by the authors. Licensee MDPI, Basel, Switzerland. This article is an open access article distributed under the terms and conditions of the Creative Commons Attribution (CC BY) license.