


Abstract
This article offers a conceptual overview and functional analysis of the author’s web-based application LolyDash, a tool for managing personal finances through structured dashboards for expenses, income, notes, and group fundraising. The main features of the system, its advantages over traditional financial tracking solutions, visual analytical tools, and categorization and planning mechanisms, and its integration capabilities via webhook are described. This article argues for the need for modern digital tools for financial literacy in the context of the growing complexity of personal financial management. This article examines the concept of a web-based financial diary that integrates functionalities for managing expenses, income, financial notes, and group payments within a single information system. The main components of the system, its advantages over traditional financial management methods, and the potential for future development through the integration of artificial intelligence are analyzed.
1. Introduction
In modern society, personal finance management has become one of the most challenging daily activities. The increasing complexity of financial products, the diversity of income sources, and ever-changing consumption patterns require effective tools for tracking, analyzing, and planning [1]. Studies show that a significant portion of households in developed and developing economies experience difficulties in managing their monthly budget, which leads to over-indebtedness, lack of savings, and unpreparedness for financial crises [2].
Traditional methods of keeping a financial diary—paper notebooks, Microsoft Excel and Google Sheets spreadsheets—offer limited analytical capabilities and require significant manual effort. The emergence of specialized web-based applications for personal finance management represents a qualitative leap in the accessibility and functionality of such tools [3].
This article analyzes LolyDash and describes an author’s web-based financial management platform, developed with a focus on simplicity, visual clarity, and flexibility. The purpose of this publication is to describe the architectural solutions, functional characteristics and competitive advantages of the system while also outlining the prospects for its future development with the integration of artificial intelligence.
2. Need for Digital Tools for Financial Management
2.1. Challenges Facing Modern Financial Management
Financial literacy has been recognized by the Organization for Economic Co-operation and Development (OECD) as a key competency of the 21st century [4]. However, research shows systemic deficits in individuals’ ability to budget, manage debt, and make informed investment decisions. According to a 2015 Standard & Poor’s report, only 52% of the world’s adult population can be described as financially literate [5].
The psychological barriers to effective financial behavior are well documented in behavioral economics. Hyperbolic discounting, the sunk cost effect, and cognitive biases lead to systematic underestimation of expenses and overestimation of income [6]. Technological solutions can partially compensate for these cognitive limitations through automated tracking, visualization, and reminders.
2.2. Evolution of Personal Finance Management (PFM) Tools
The Personal Finance Management (PFM) application market has undergone a significant transformation over the past decade. Pioneers in the sector such as Mint (2006) and YNAB (You Need a Budget, 2004) set standards, which were subsequently developed by mobile applications such as Revolut, N26 and numerous regional solutions [7]. The trend is towards greater personalization, richer visualization and tighter integration with banking systems.
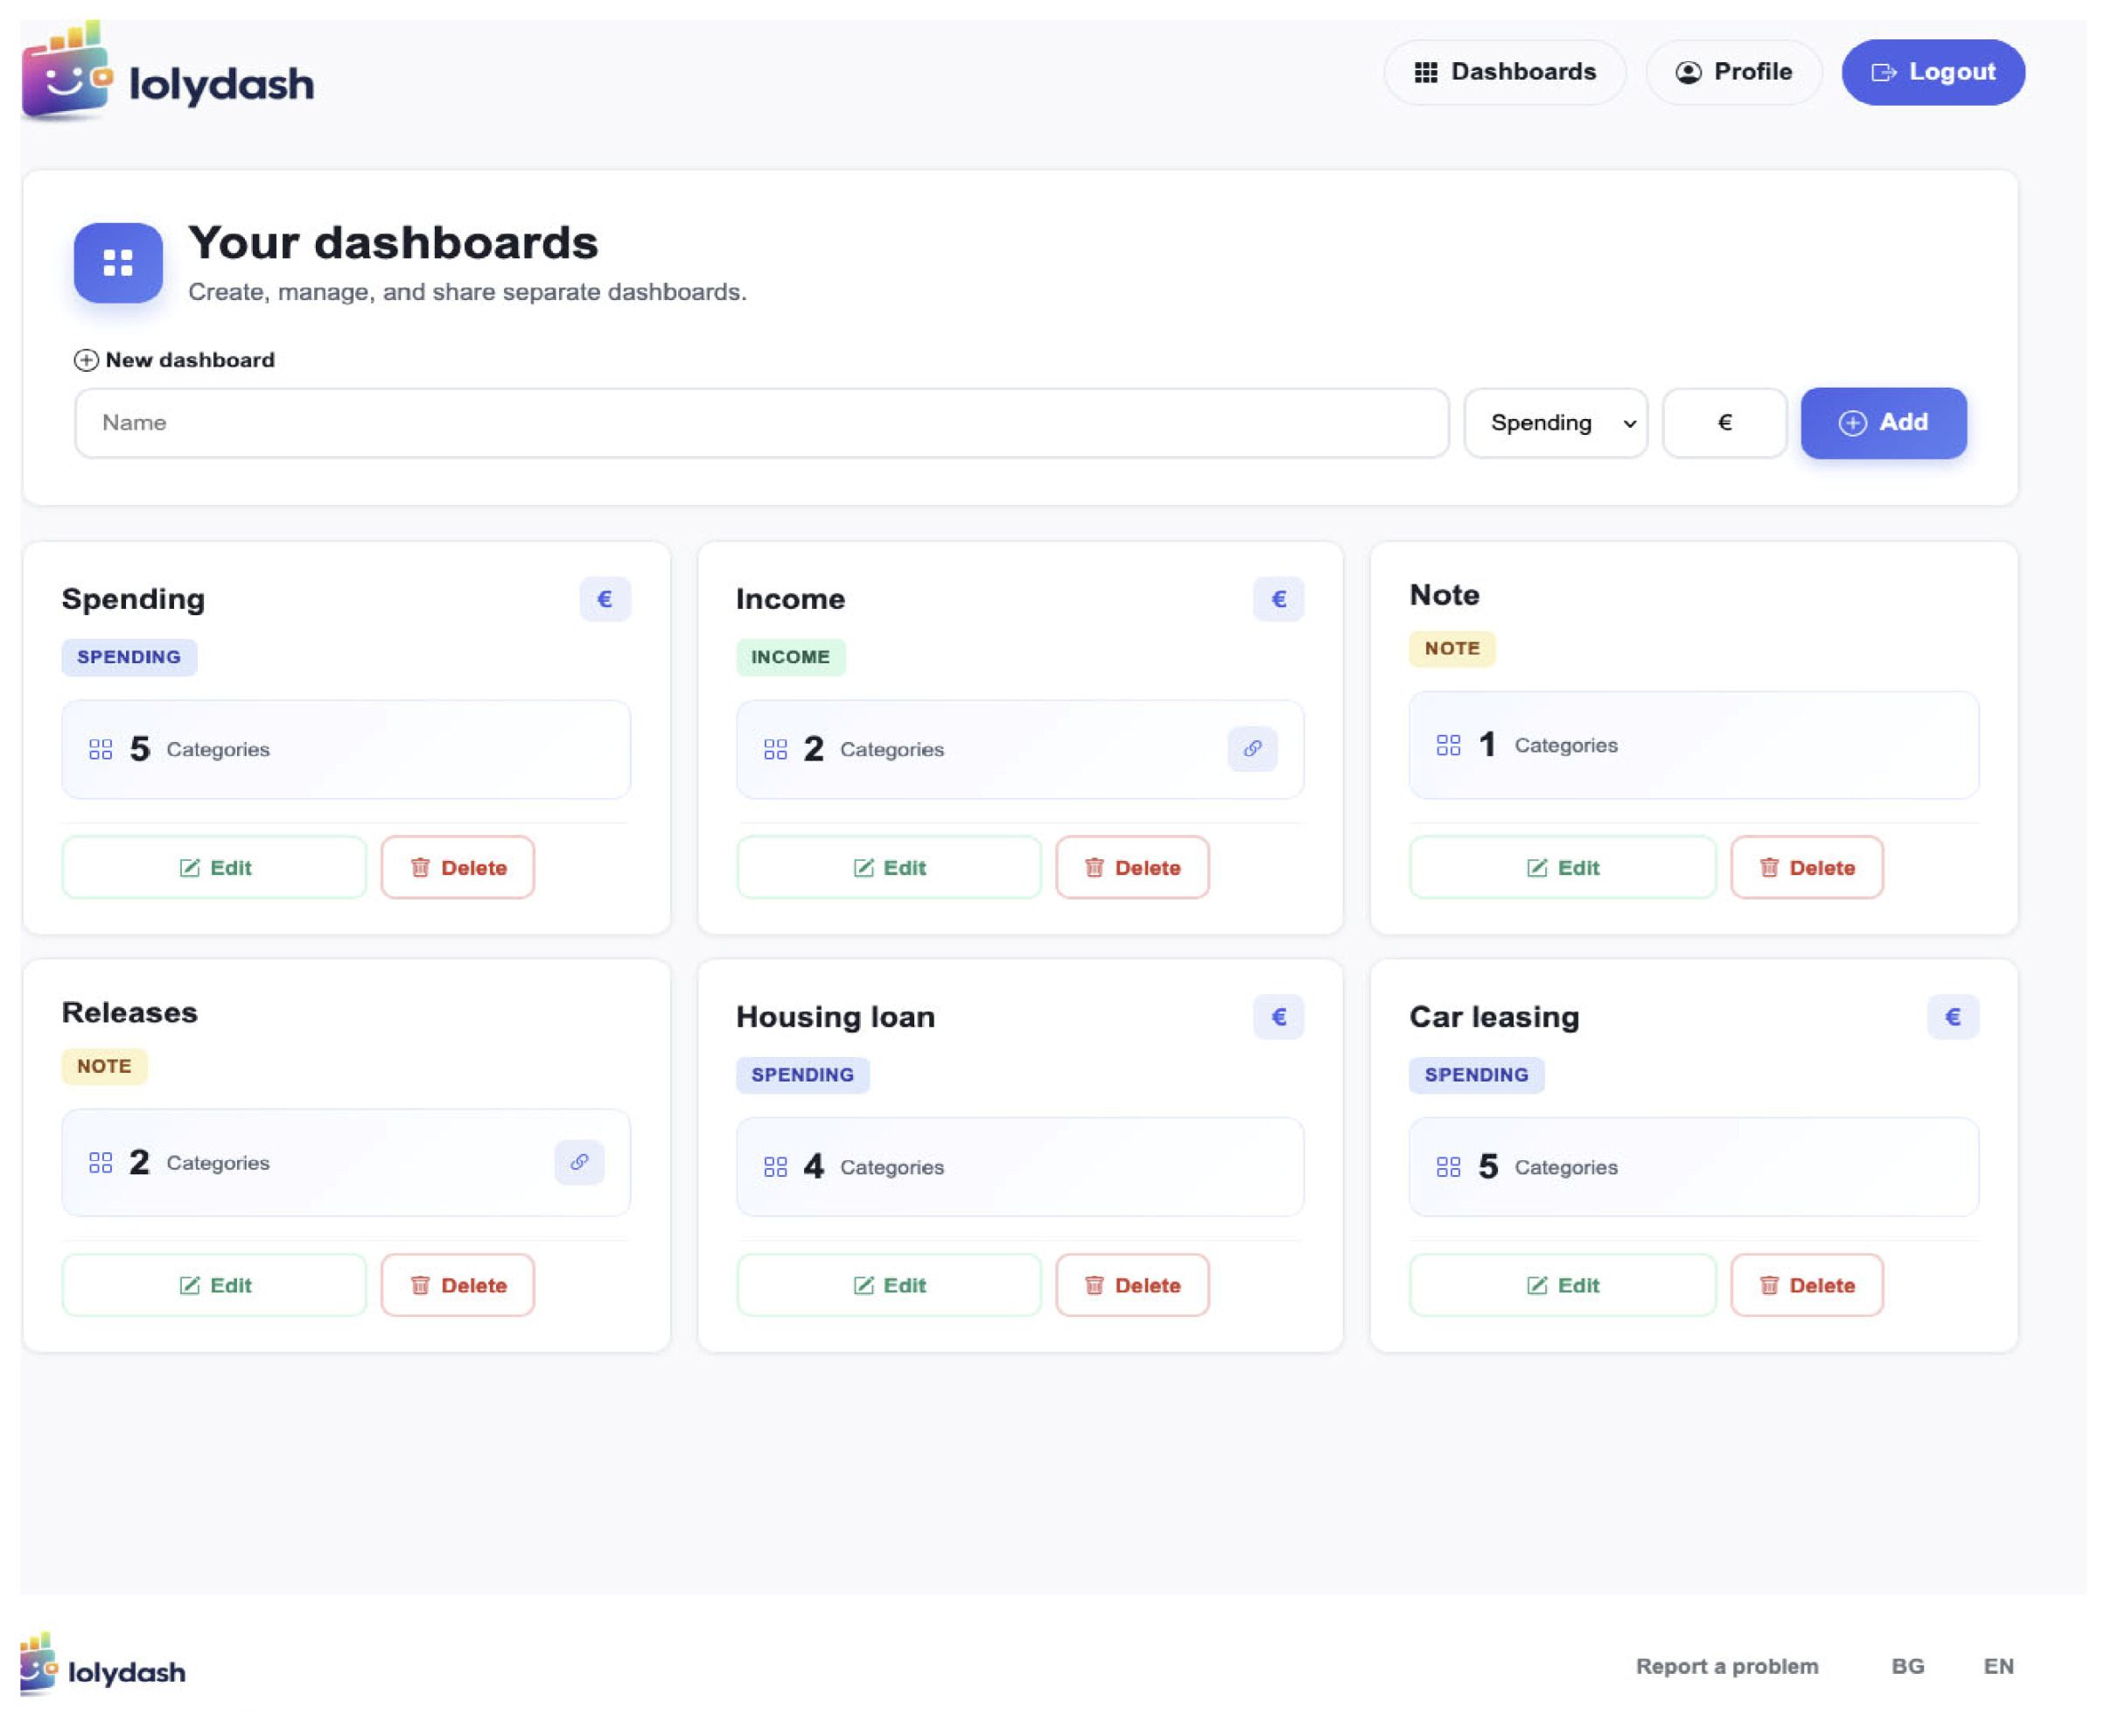
Among the key requirements for modern PFM tools, researchers point out: intuitive user interface, multidimensional categorization, historical analysis, forecasting and sharing within the household or group [8]. LolyDash addresses all these requirements within a single web-based platform. Figure 1 shows the LolyDash main interface. The presented interface illustrates the home dashboard of a web-based personal finance management system in which the user has the opportunity to create and manage multiple separate financial diaries. The central part of the screen visualizes the available dashboards, organized into separate cards, with each card representing a specific financial category—for example, expenses, income, and notes or specific financial commitments such as a home loan or car lease.
Figure 1.
LolyDash main interface—managing multiple custom dashboards.
The system allows the creation of a new dashboard by entering a name and selecting a type (e.g., expenses or income) and currency, which provides flexibility and customization according to the user’s needs. Each dashboard contains information about the number of categories, which facilitates the structuring of data and supports subsequent analysis.
The interface is designed with an emphasis on clarity and accessibility, using visual elements and color indicators to distinguish between data types. The presence of edit and delete buttons allows for quick content management, which is key to maintaining up-to-date and accurate financial information.
3. System Architecture and Design
3.1. Conceptual Model
LolyDash is built on the concept of multi-board financial management. The central point of the system is the Dashboard Manager, from which the user creates and manages separate financial contexts. Each dashboard has its own configuration, type and set of categories, allowing for simultaneous management of household budgets, business expenses and specialized financial records [9].
The system supports four main types of dashboards: Spending, Income, Notes and Cashier. This typology reflects the real financial roles and information needs of users, from daily tracking of spending to complex management of group payments.
3.2. Multi-Table Architecture
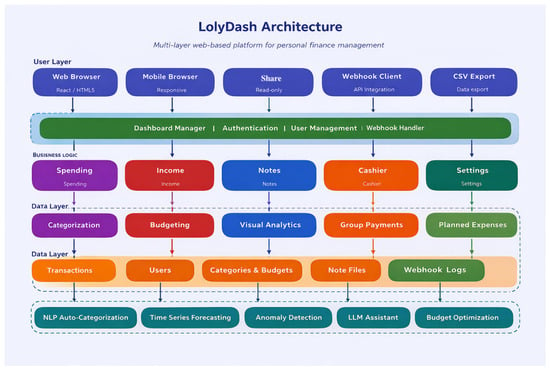
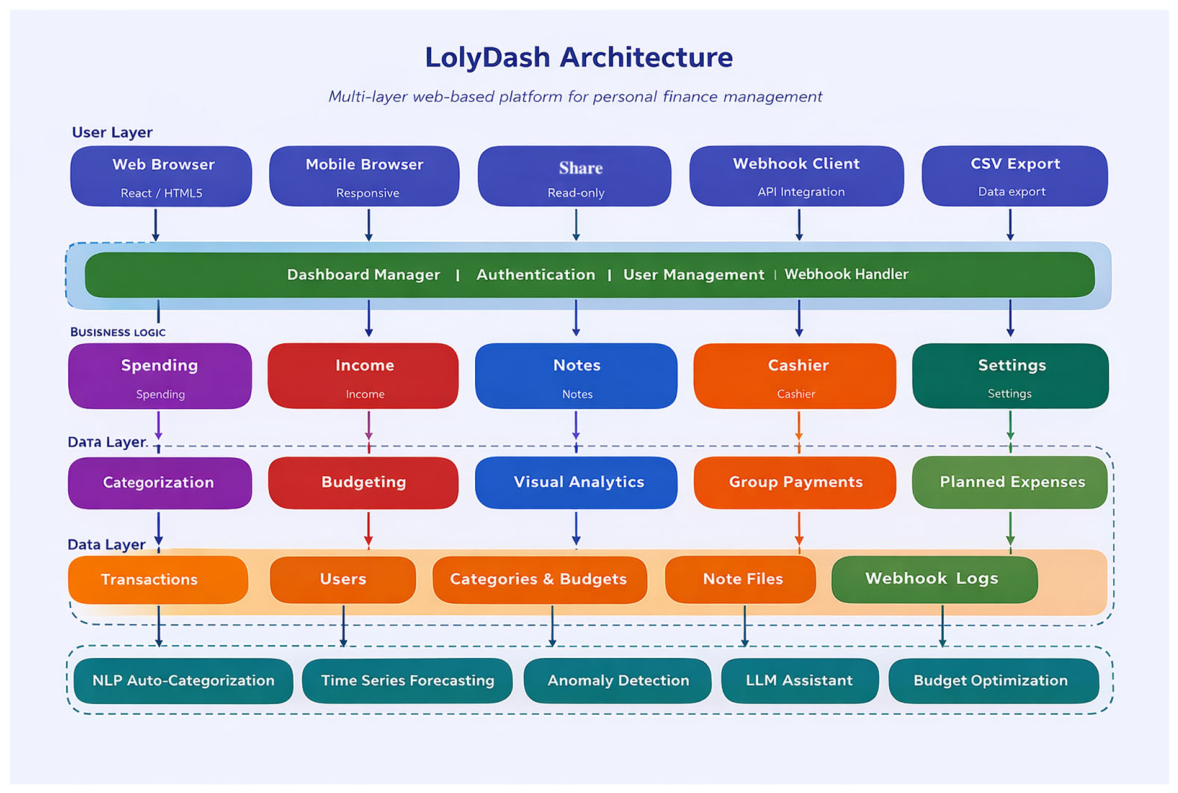
Figure 2 shows a diagram of the LolyDash architecture. The multi-table approach is a key architectural solution that distinguishes LolyDash from its competitors. Instead of a single, monolithic database for all financial data, the system allows for a logical separation of financial flows by semantic domains. For example, a household can maintain separate boards for basic expenses, car expenses, mortgages, and children’s activities—each with different categories, budgets, and access.
Figure 2.
LolyDash architecture—layered platform structure.
From an information architecture perspective, this solution follows the principle of “separation of responsibilities” (Separation of Concerns), widely applied in modern software engineering. It reduces the cognitive load of the user and provides more precise analytics at every level.
3.3. Database Structure
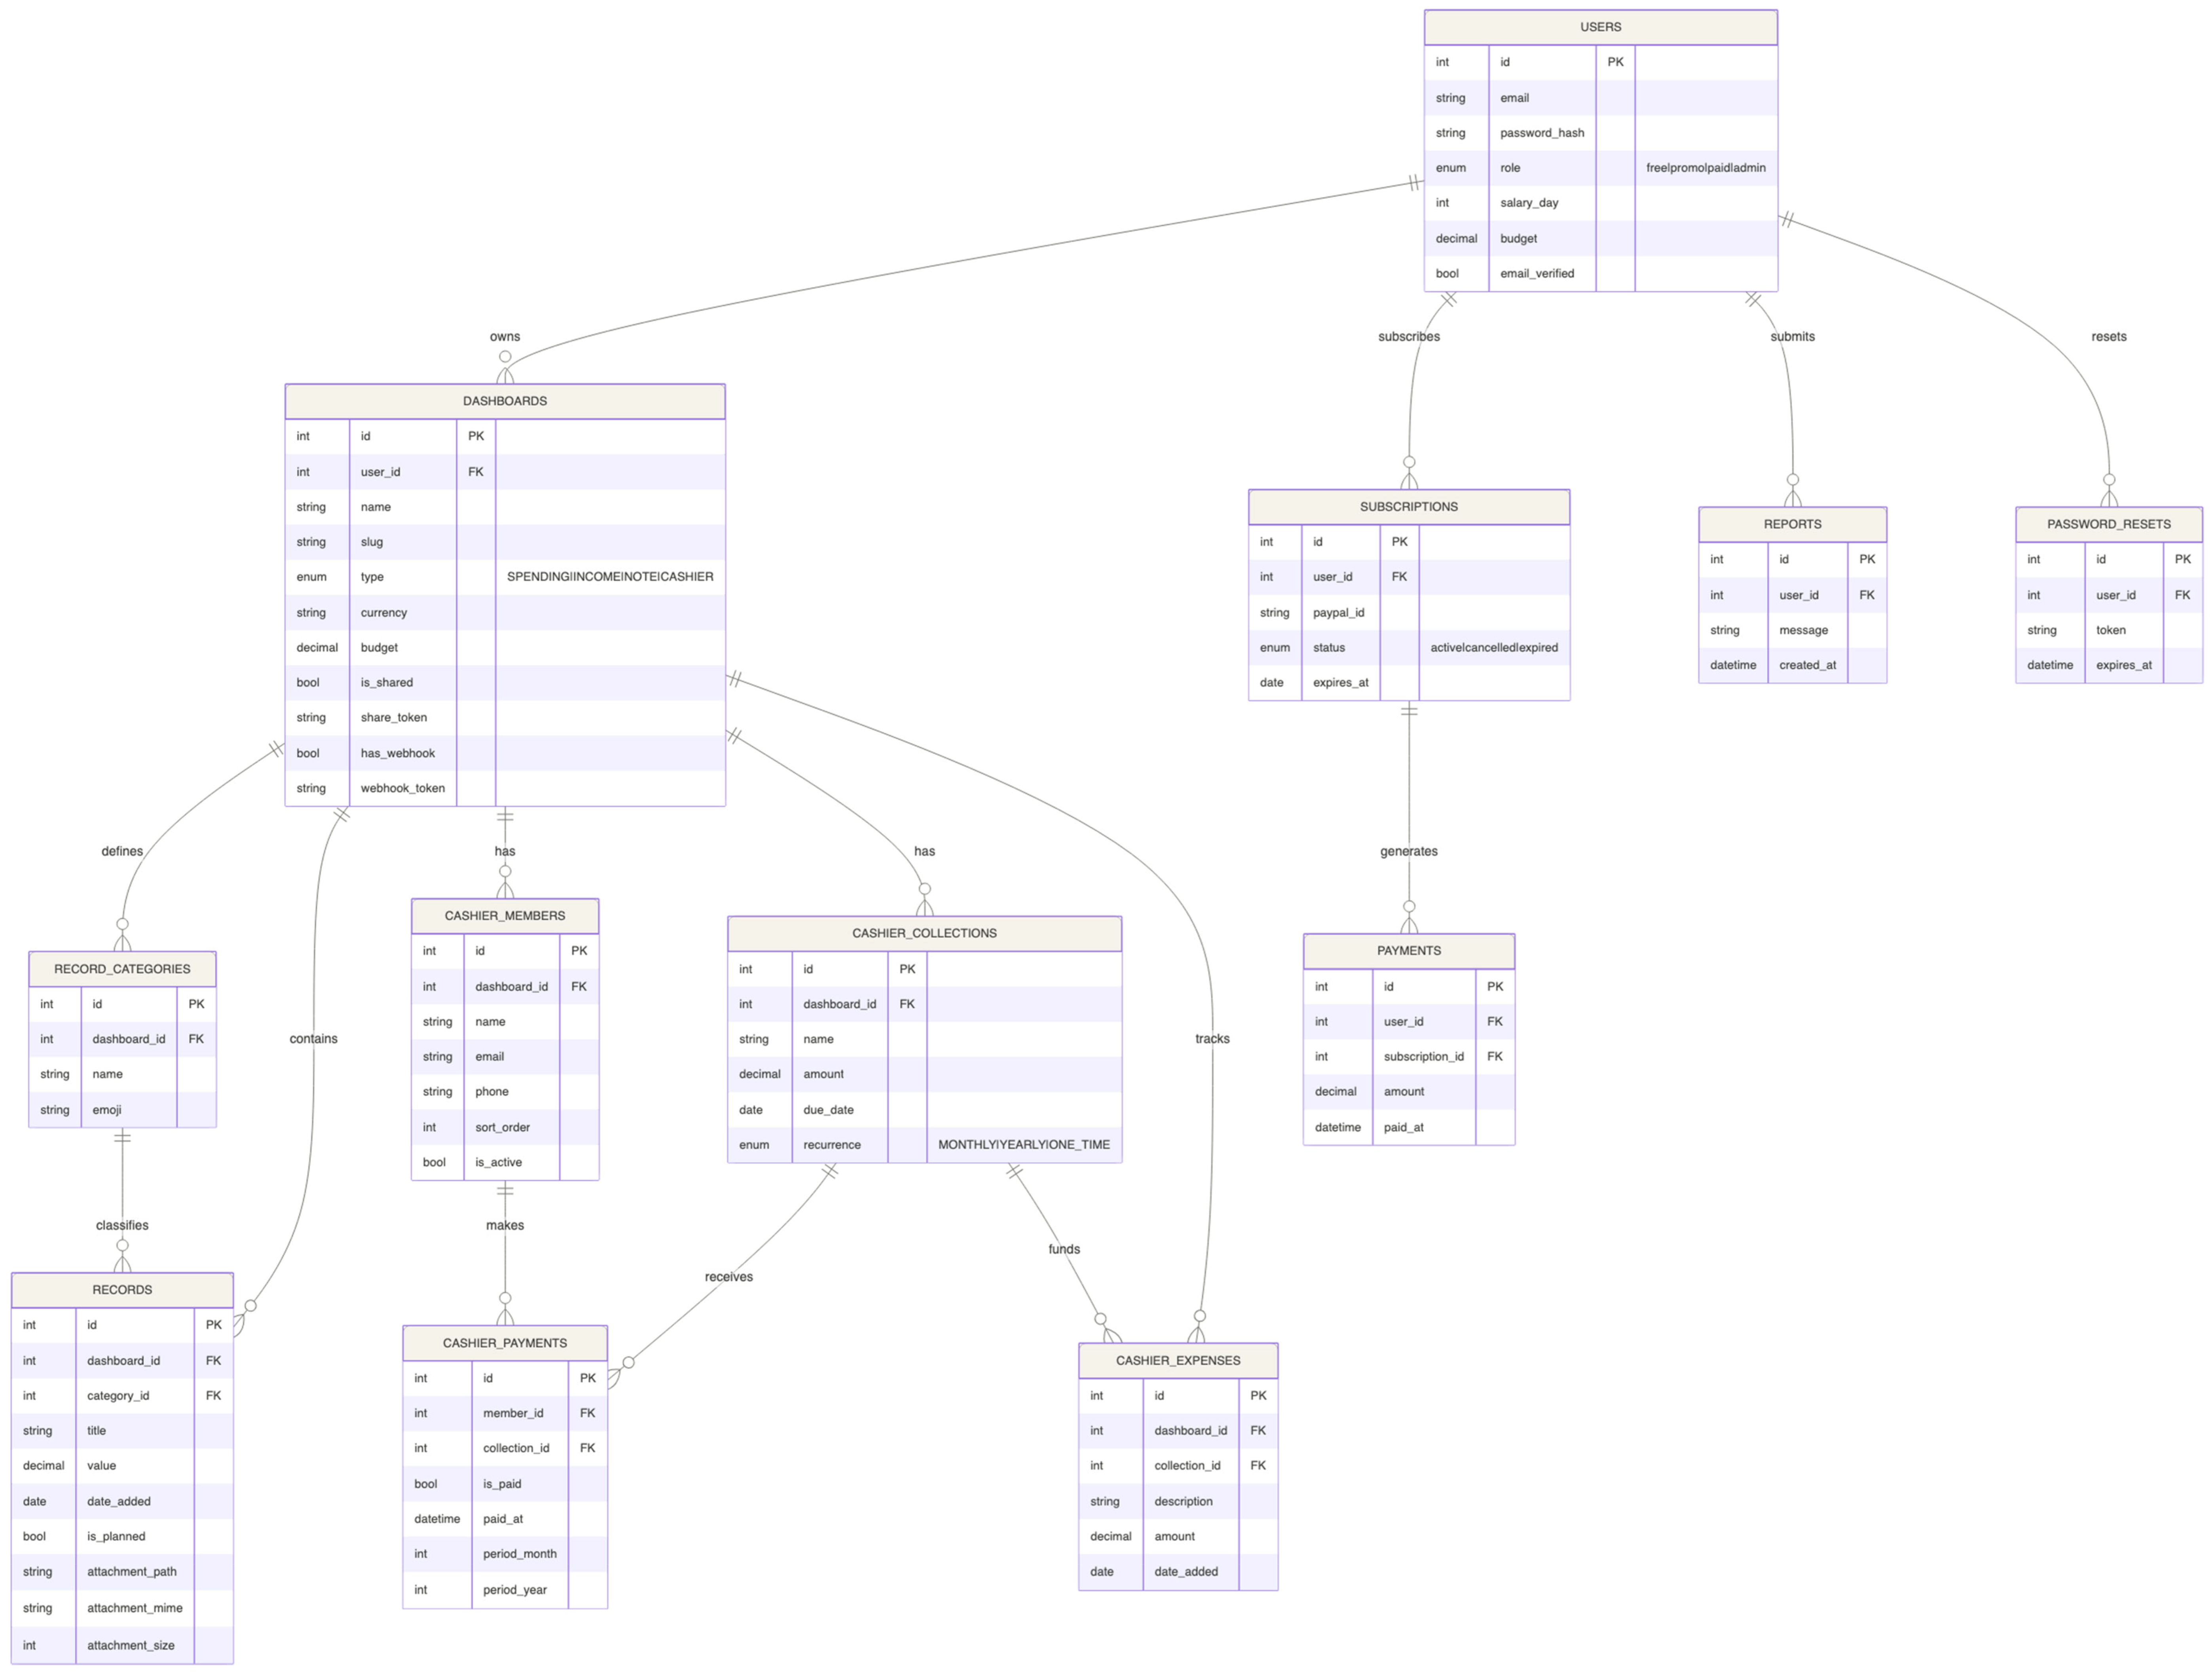
The LolyDash system is backed by a relational MySQL database consisting of twelve tables organized around three functional domains: user management, financial tracking, and group cashier operations. The users table stores account credentials, role (free, promo, paid, admin), and email verification status. Financial preferences such as salary_day and budget are stored as user-level defaults, overridable at the dashboard level.
The dashboards table is the central configuration entity. Each record defines a financial context identified by a URL-friendly slug, a currency, an optional monthly budget, and a type field defined as an ENUM with four values: SPENDING, INCOME, NOTE, and CASHIER. Two security-relevant flag pairs control external access: is_shared with a share_token for read-only public links and has_webhook with a webhook_token for automated data ingestion from external systems.
The record_categories table defines the categorization taxonomy per dashboard. Each category is scoped to a specific dashboard via dashboard_id and supports an optional emoji field for visual identification in the user interface.
The records table holds all financial transactions across all dashboard types. Key fields include value (DECIMAL 10,2), date_added, a boolean is_planned flag for pre-registered future payments, and optional file attachment metadata (attachment_path, attachment_mime, attachment_size). The foreign keys category_id and dashboard_id link each record to its classification context.
For the Cashier module, four dedicated tables implement group payment logic: cash-ier_members (participants in a group collection, storing name, email, phone, sort order, and active status); cashier_collections (named collection obligations with an amount, op-tional due_date, and recurrence type as ENUM: MONTHLY, YEARLY, ONE_TIME); cashier_payments (individual payment status per member per collection, including is_paid, paid_at, and optional period_month/period_year fields for recurring payment tracking); and cashier_expenses (expenditures from collected funds, linked optionally to a specific collection).
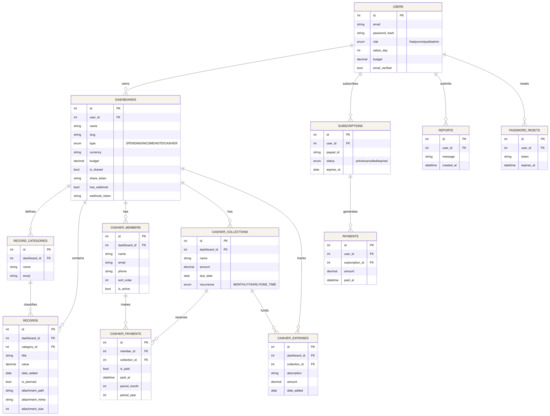
Supporting tables include password_resets (token-based account recovery), subscriptions and payments (PayPal-based subscription management), and reports (user-submitted feedback). Figure 3 presents the entity-relationship diagram of the core database structure.
Figure 3.
Entity-relationship diagram of the core database structure.
4. Functional Characteristics of the Main Modules
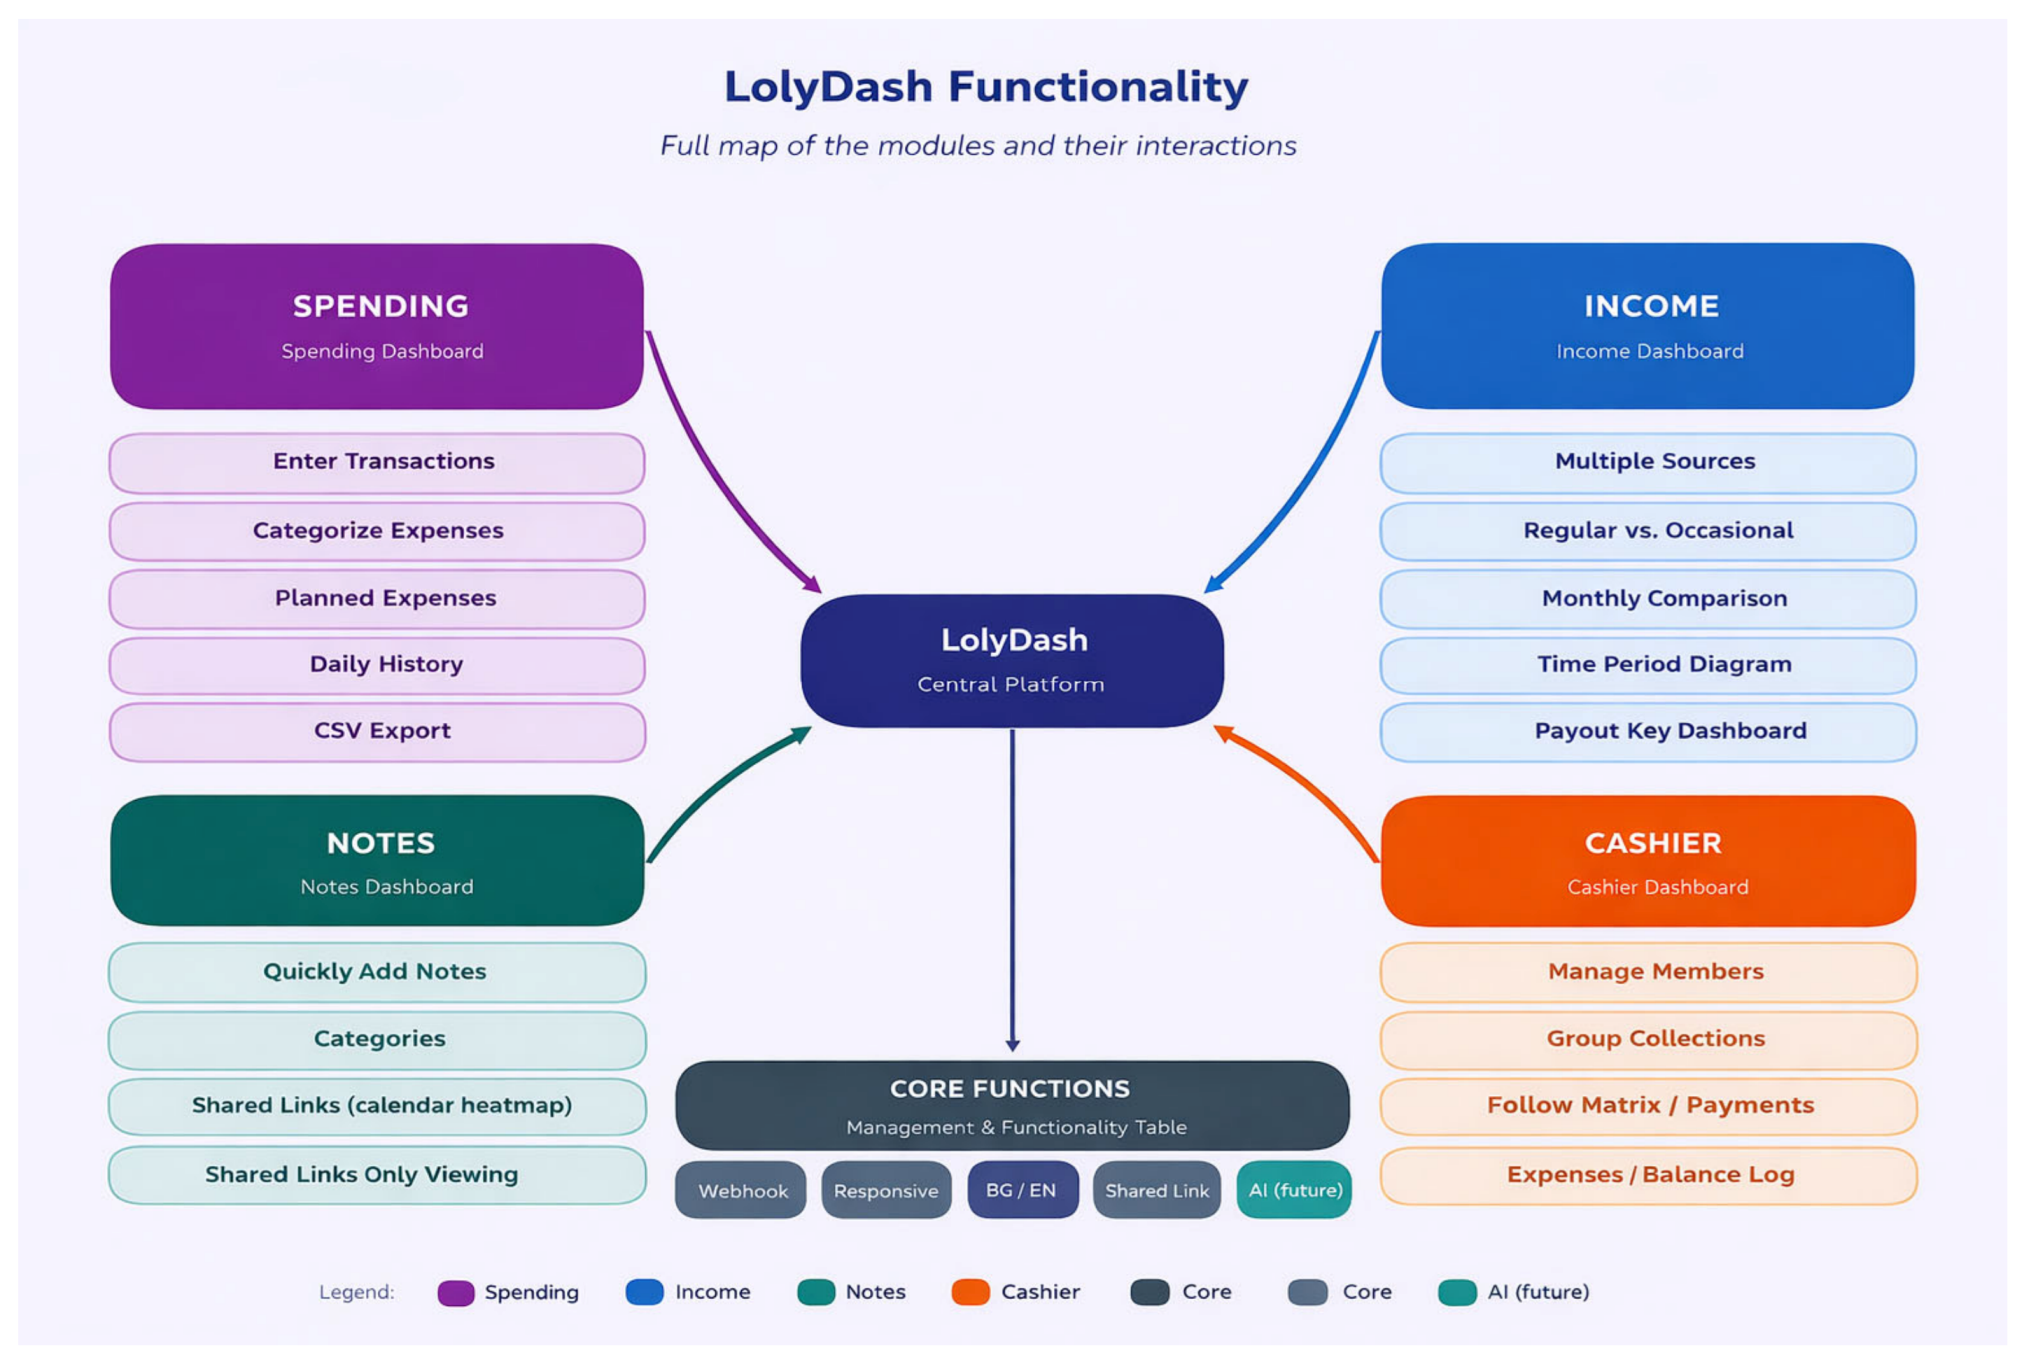
Figure 4 presents a functional map of LolyDash, containing modules and the corresponding interconnections between them.
Figure 4.
LolyDash functional map—modules and interconnections.
4.1. Spending Dashboard
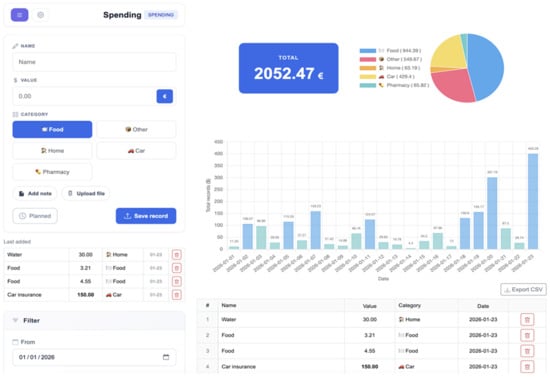
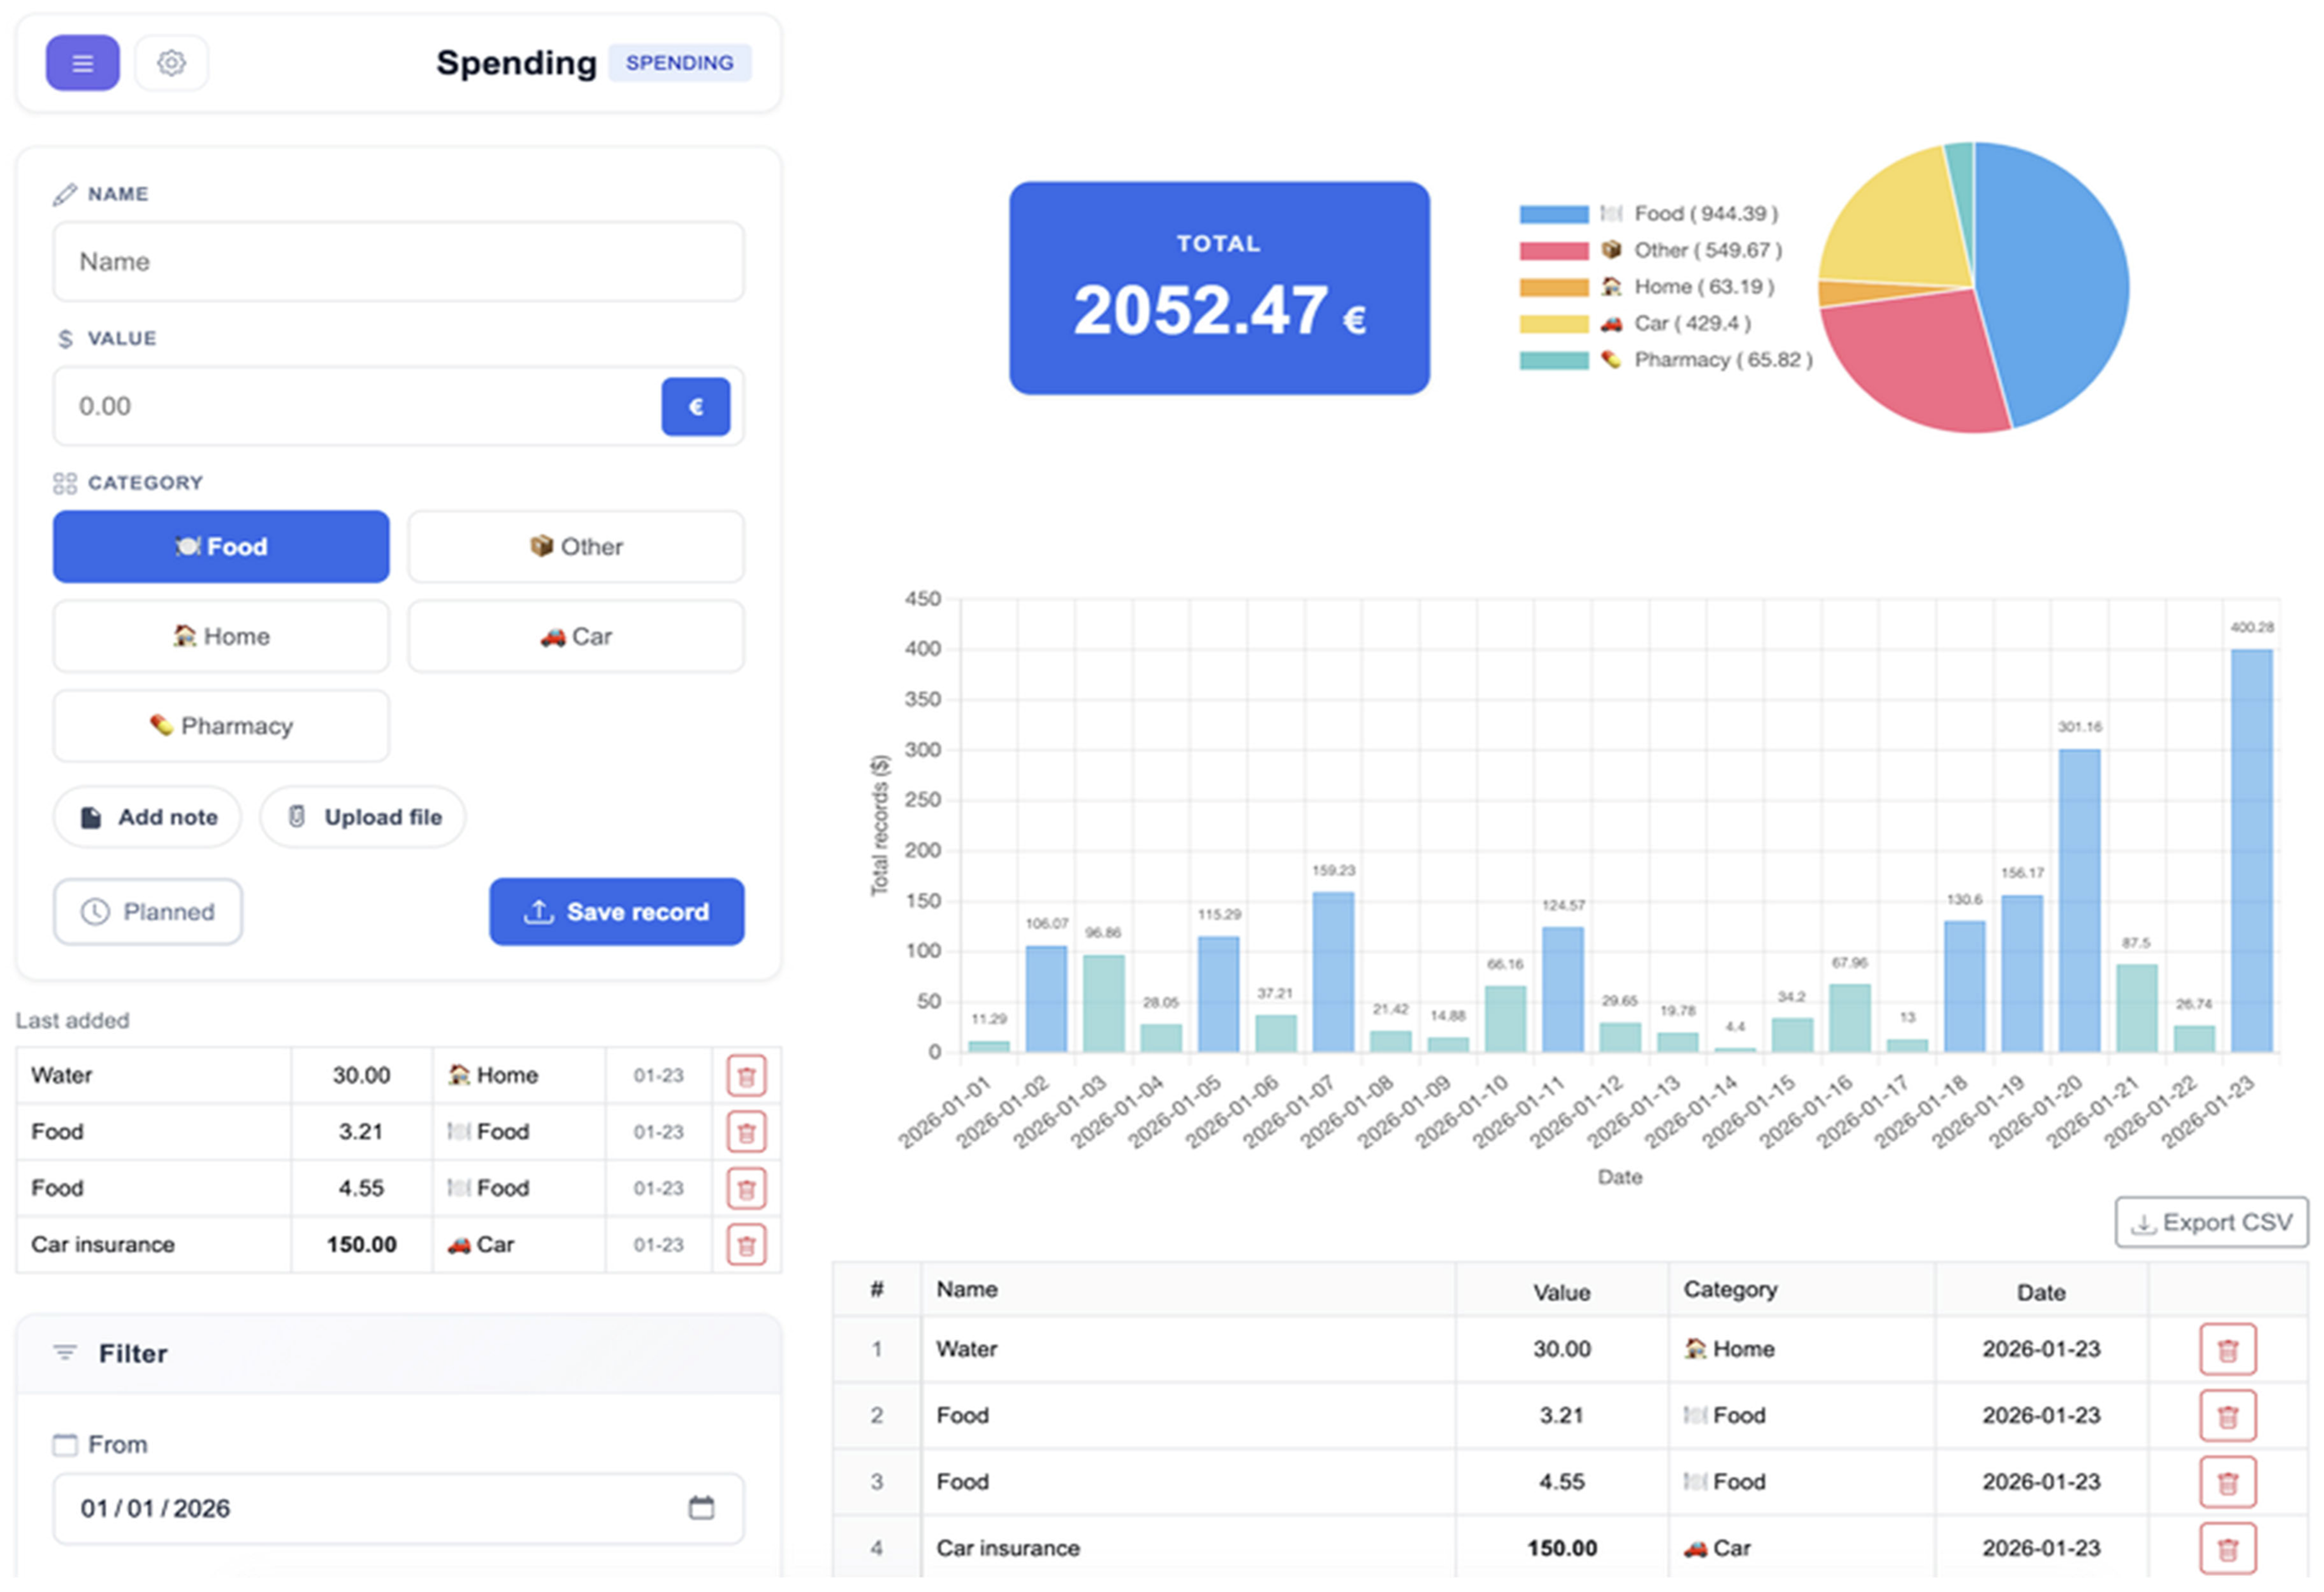
The Spending Dashboard (Figure 5) is the main module of the system, designed for the daily registration and analysis of cash flows in the direction of outgoing payments. The user enters transactions with a name, value, category and date. The system supports adding notes to the records and attaching files (for example, photos of receipts).
Figure 5.
Expense Dashboard—transaction entry, pie chart, and time histogram.
The visual analysis in the dashboard includes a summary amount for a selected period, a pie chart with distribution by category and a time histogram showing daily expenses. These visualizations allow for quick identification of financial anomalies and trends. The Planned Payments function allows for the pre-registration of recurring bills.
An important feature is the export of data in CSV format, which allows for further processing in spreadsheets or specialized analytical tools. Filtering by period, category and value provides flexible extraction of targeted subsets of data for analysis.
4.2. Income Dashboard
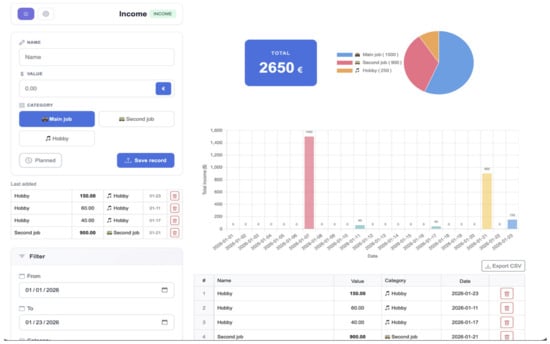
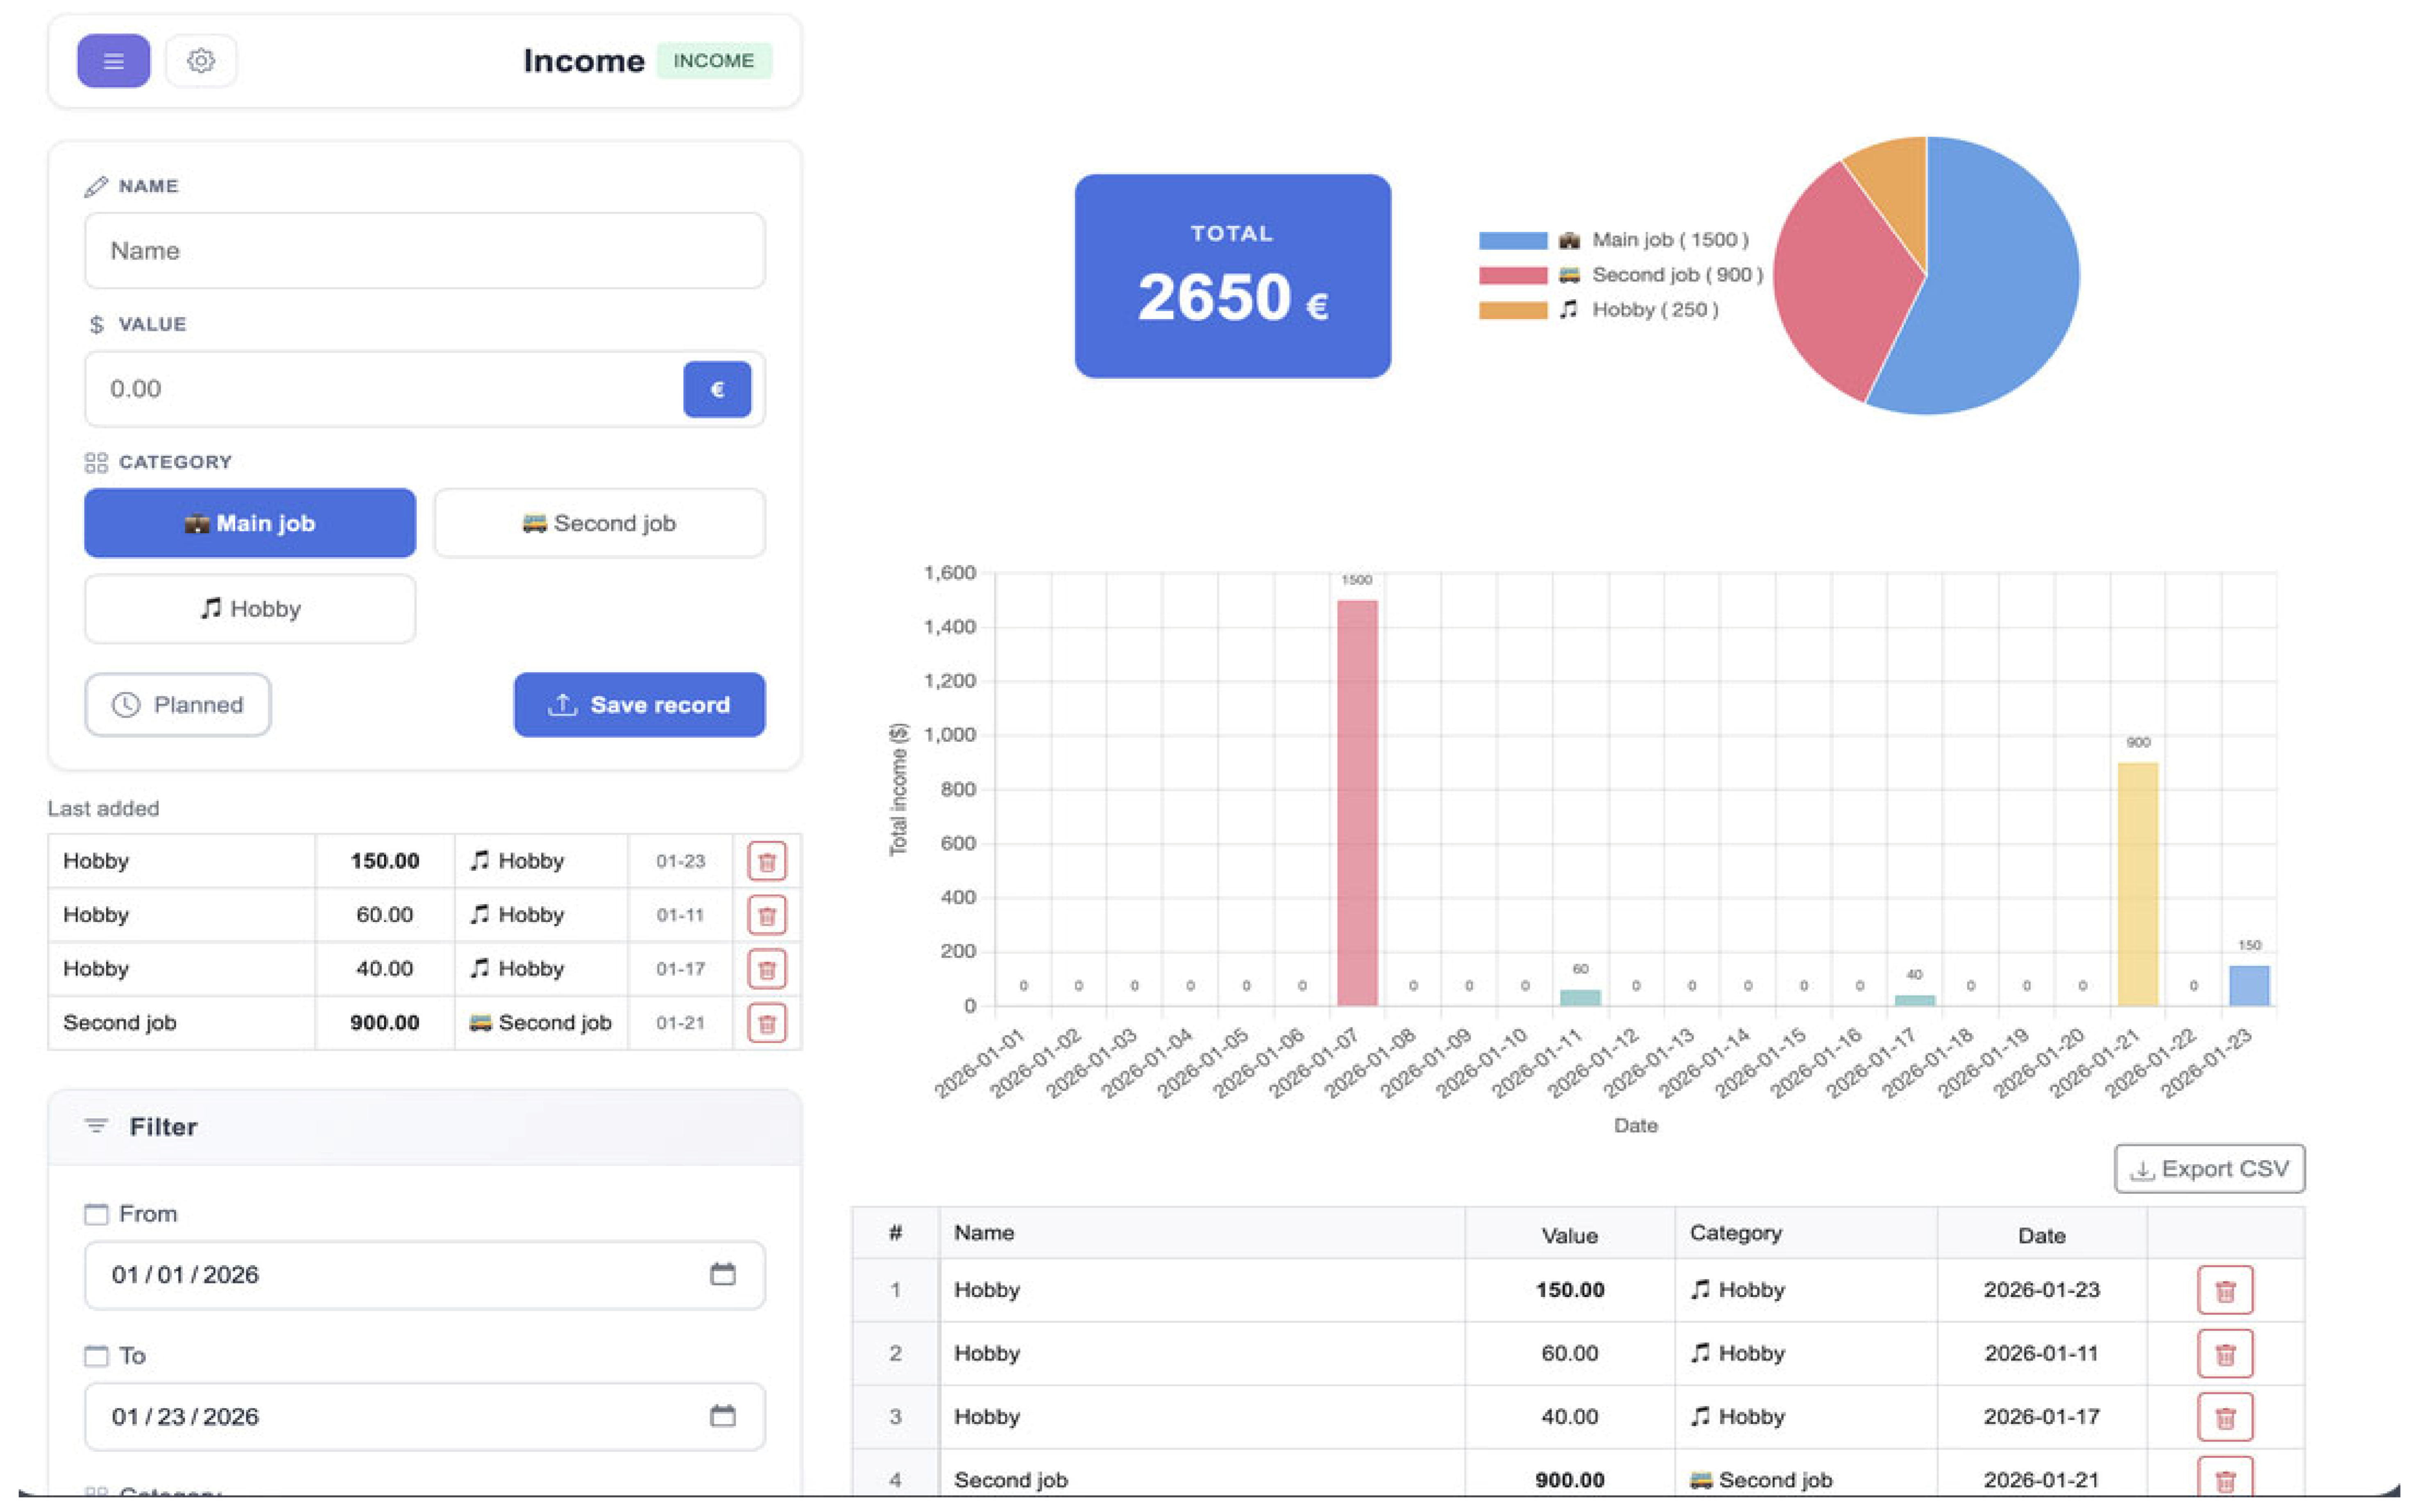
The Income Dashboard (Figure 6) follows a similar architecture to the Expense Dashboard but is adapted for incoming cash flows. Multiple income categories are supported, including base salary, additional employment, hobbies, rent, investment returns, etc. This multidimensional categorization is essential for users with diversified incomes, as is typical of the gig economy [10].
Figure 6.
Income Dashboard—category structure diagram and historical overview.
The month-by-month comparative analysis provided by the time chart allows for the identification of seasonal trends and structural changes in income. The histogram visualizes the distribution of income by day, which is particularly useful when managing irregular income.
4.3. Notes Dashboard
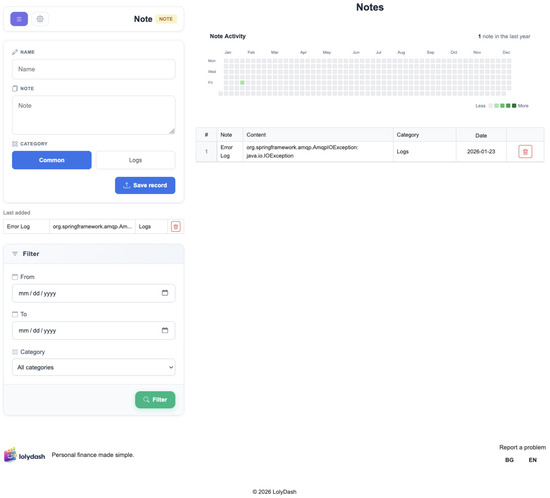
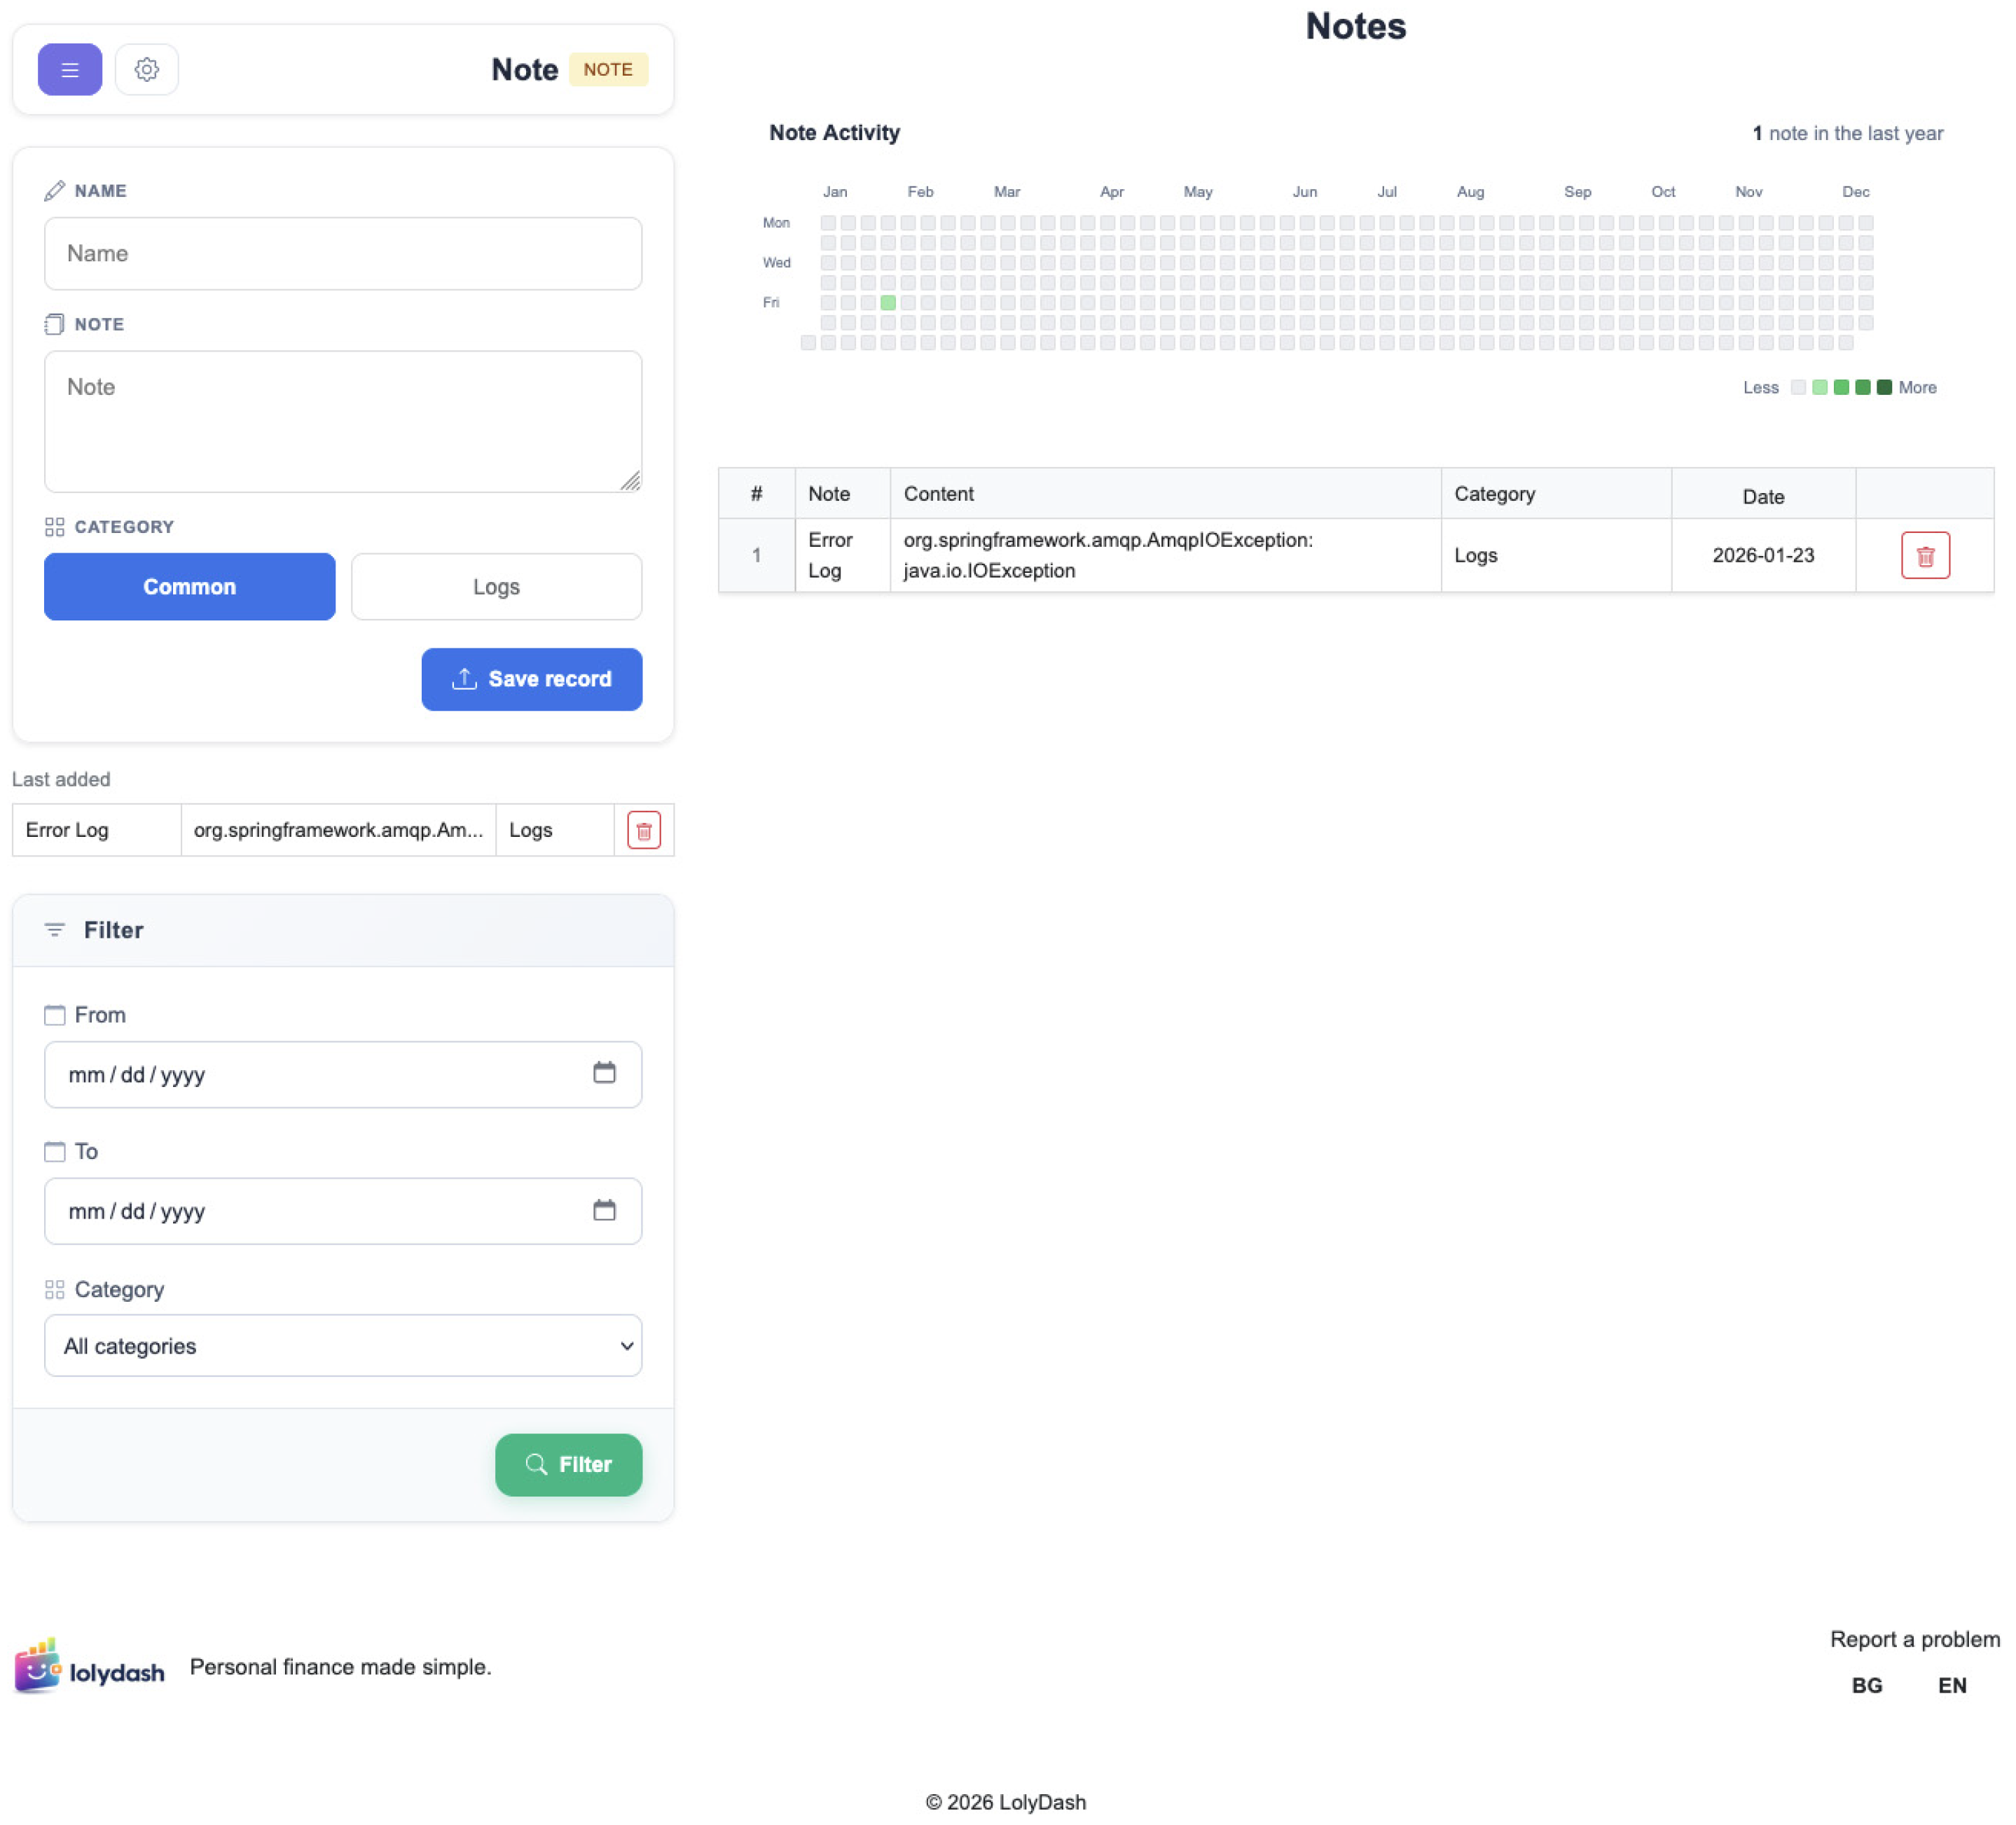
The Notes Dashboard (Figure 7) is a structured repository for textual financial information. Unlike transactional dashboards, the basic unit here is a text note with a category, date, and free content. Applications include recording financial goals, recording verbal agreements, and logging errors in bank statements or system logs.
Figure 7.
Notes board—activity map and structured financial notes record.
A unique visualization in the module is the “activity map”—a calendar heatmap, showing the intensity of notes by day for the last 12 months. This visualization is borrowed from code management tools and adapted for the financial context. It provides a quick overview of the regularity of the user’s financial engagement.
4.4. Cashier Dashboard—Group Payment Management
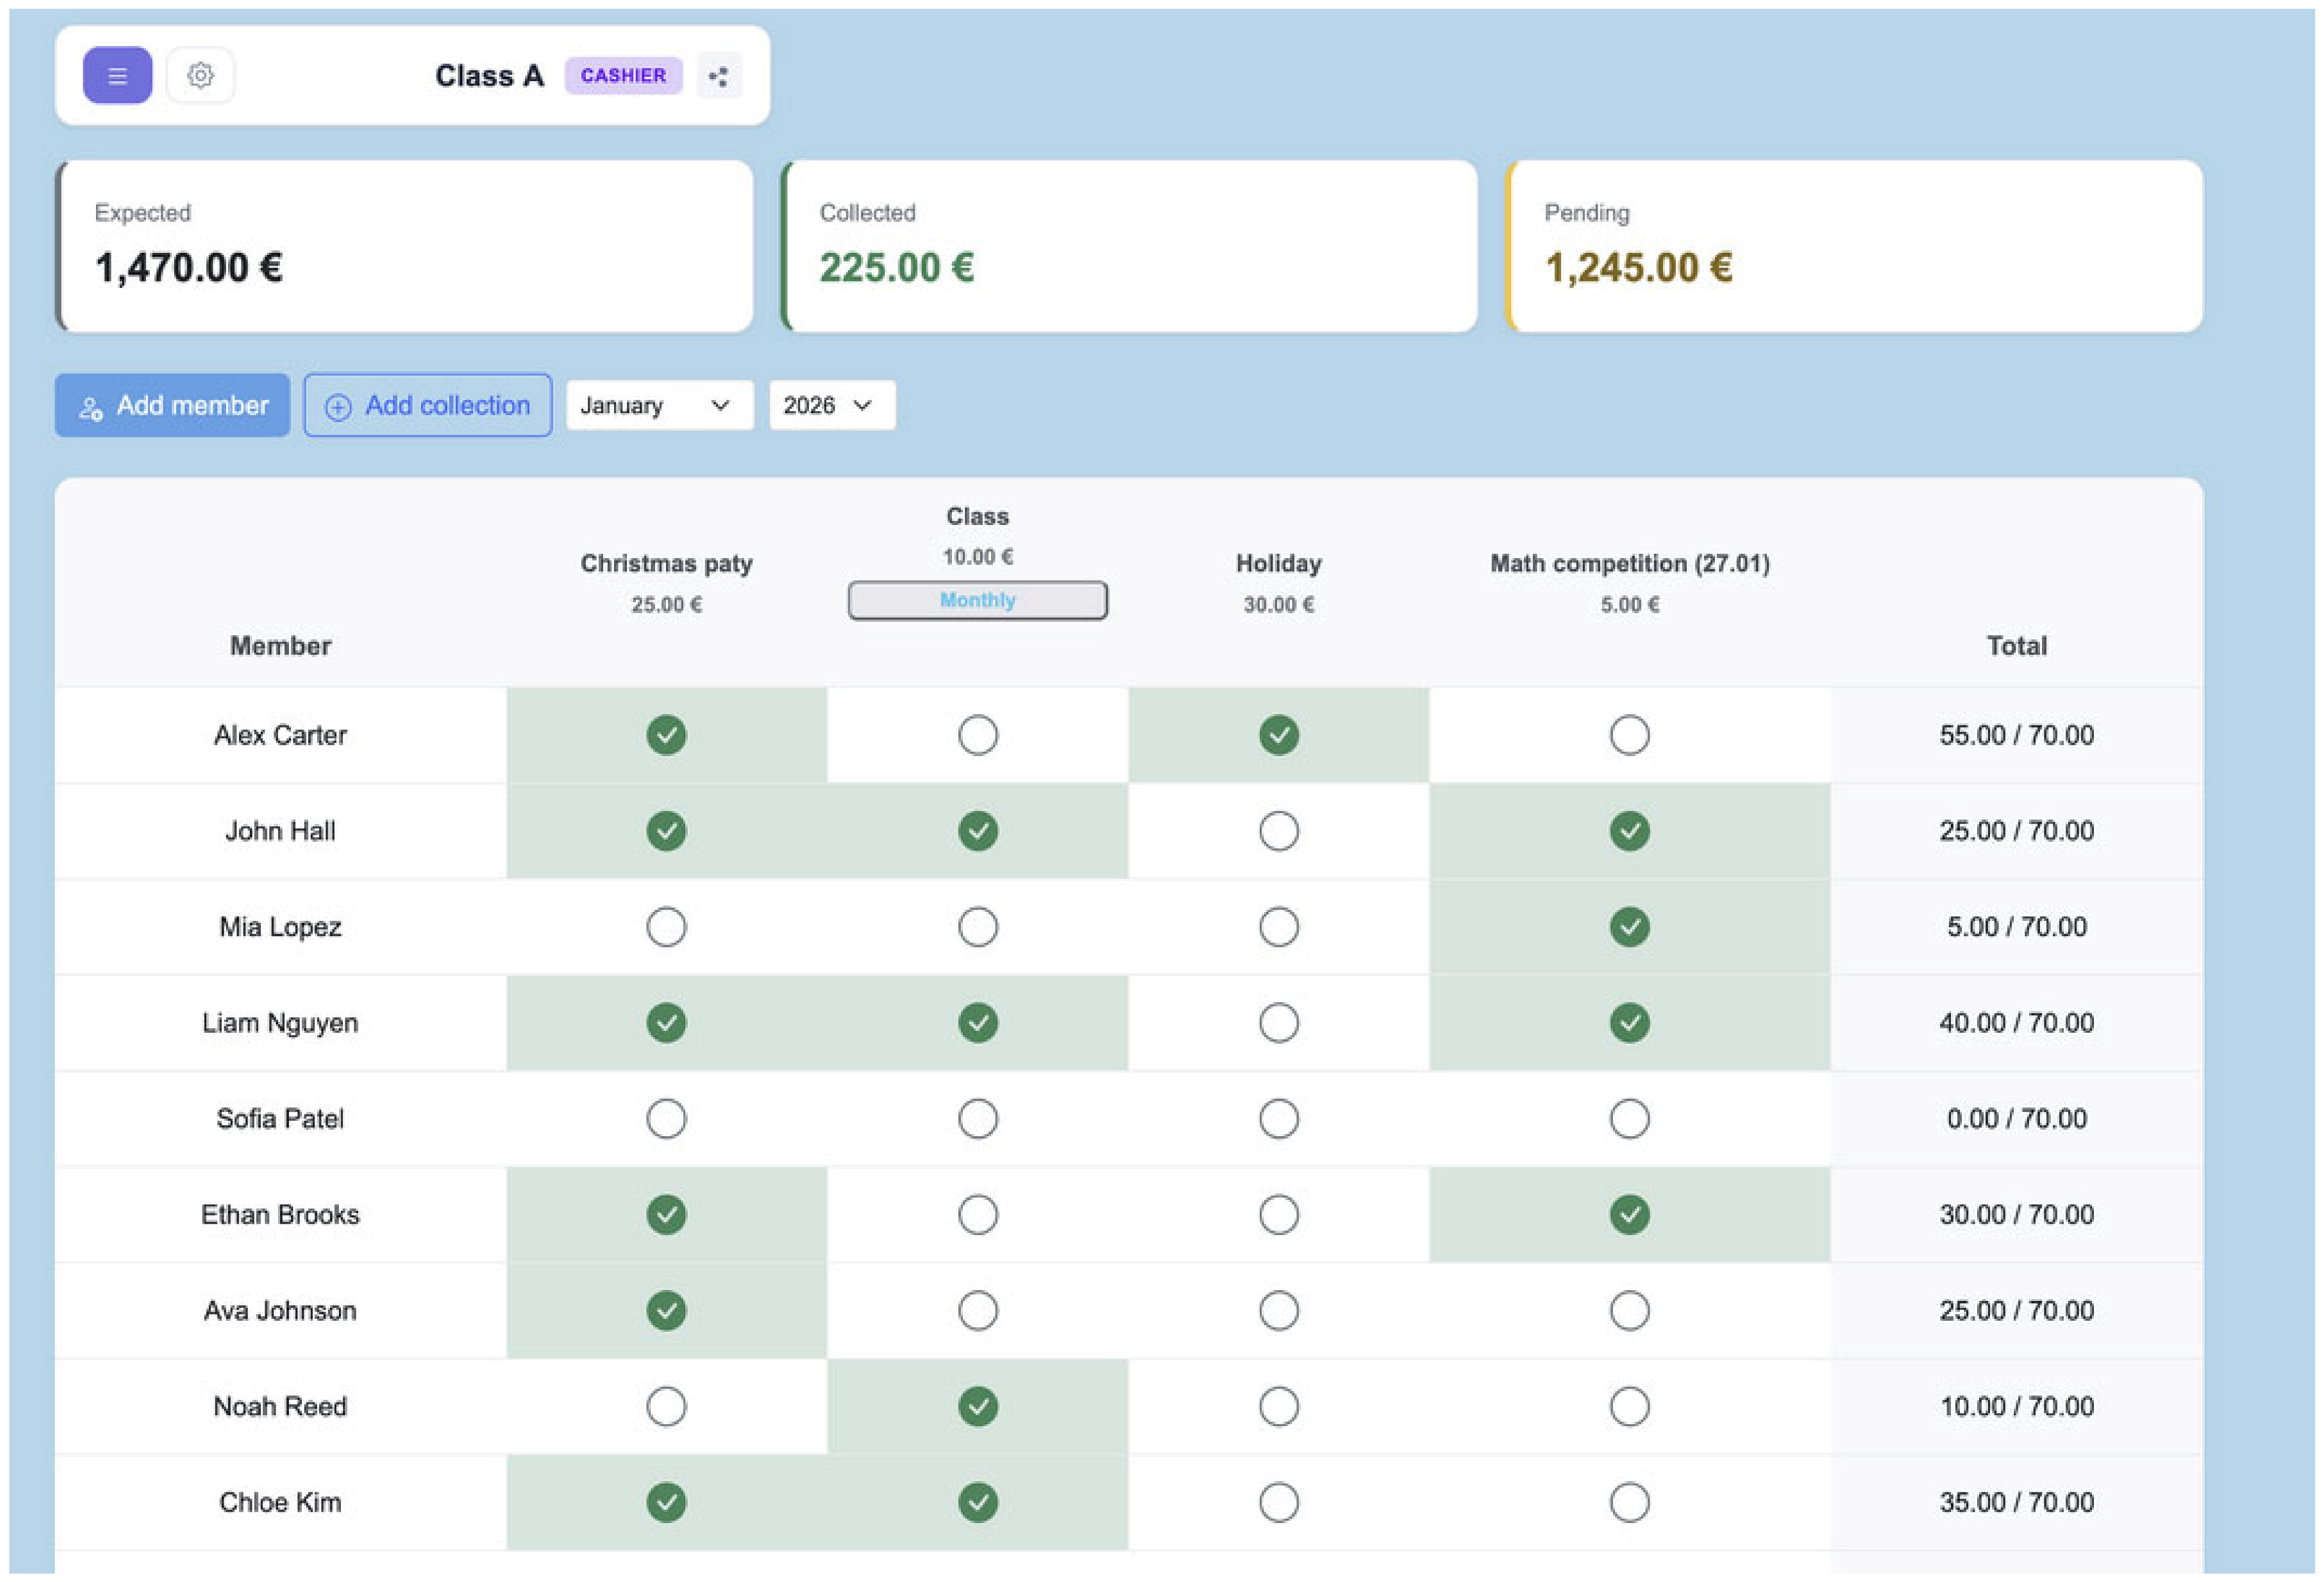
The Cashier Dashboard is a specialized module for managing collective financial operations—class funds, club fees, group trips and the like. The system supports member management, defining collections with different amounts and periodicity, tracking individual payments and managing expenses from collected funds.
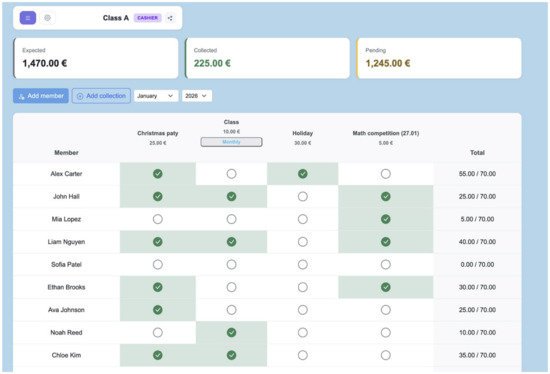
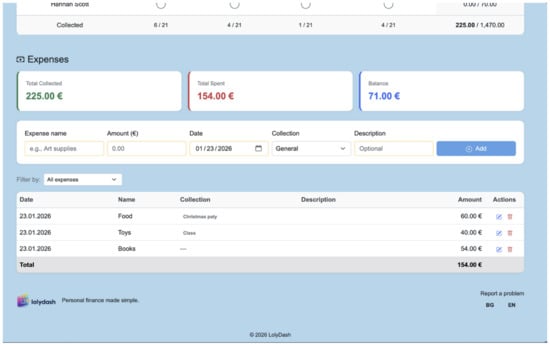
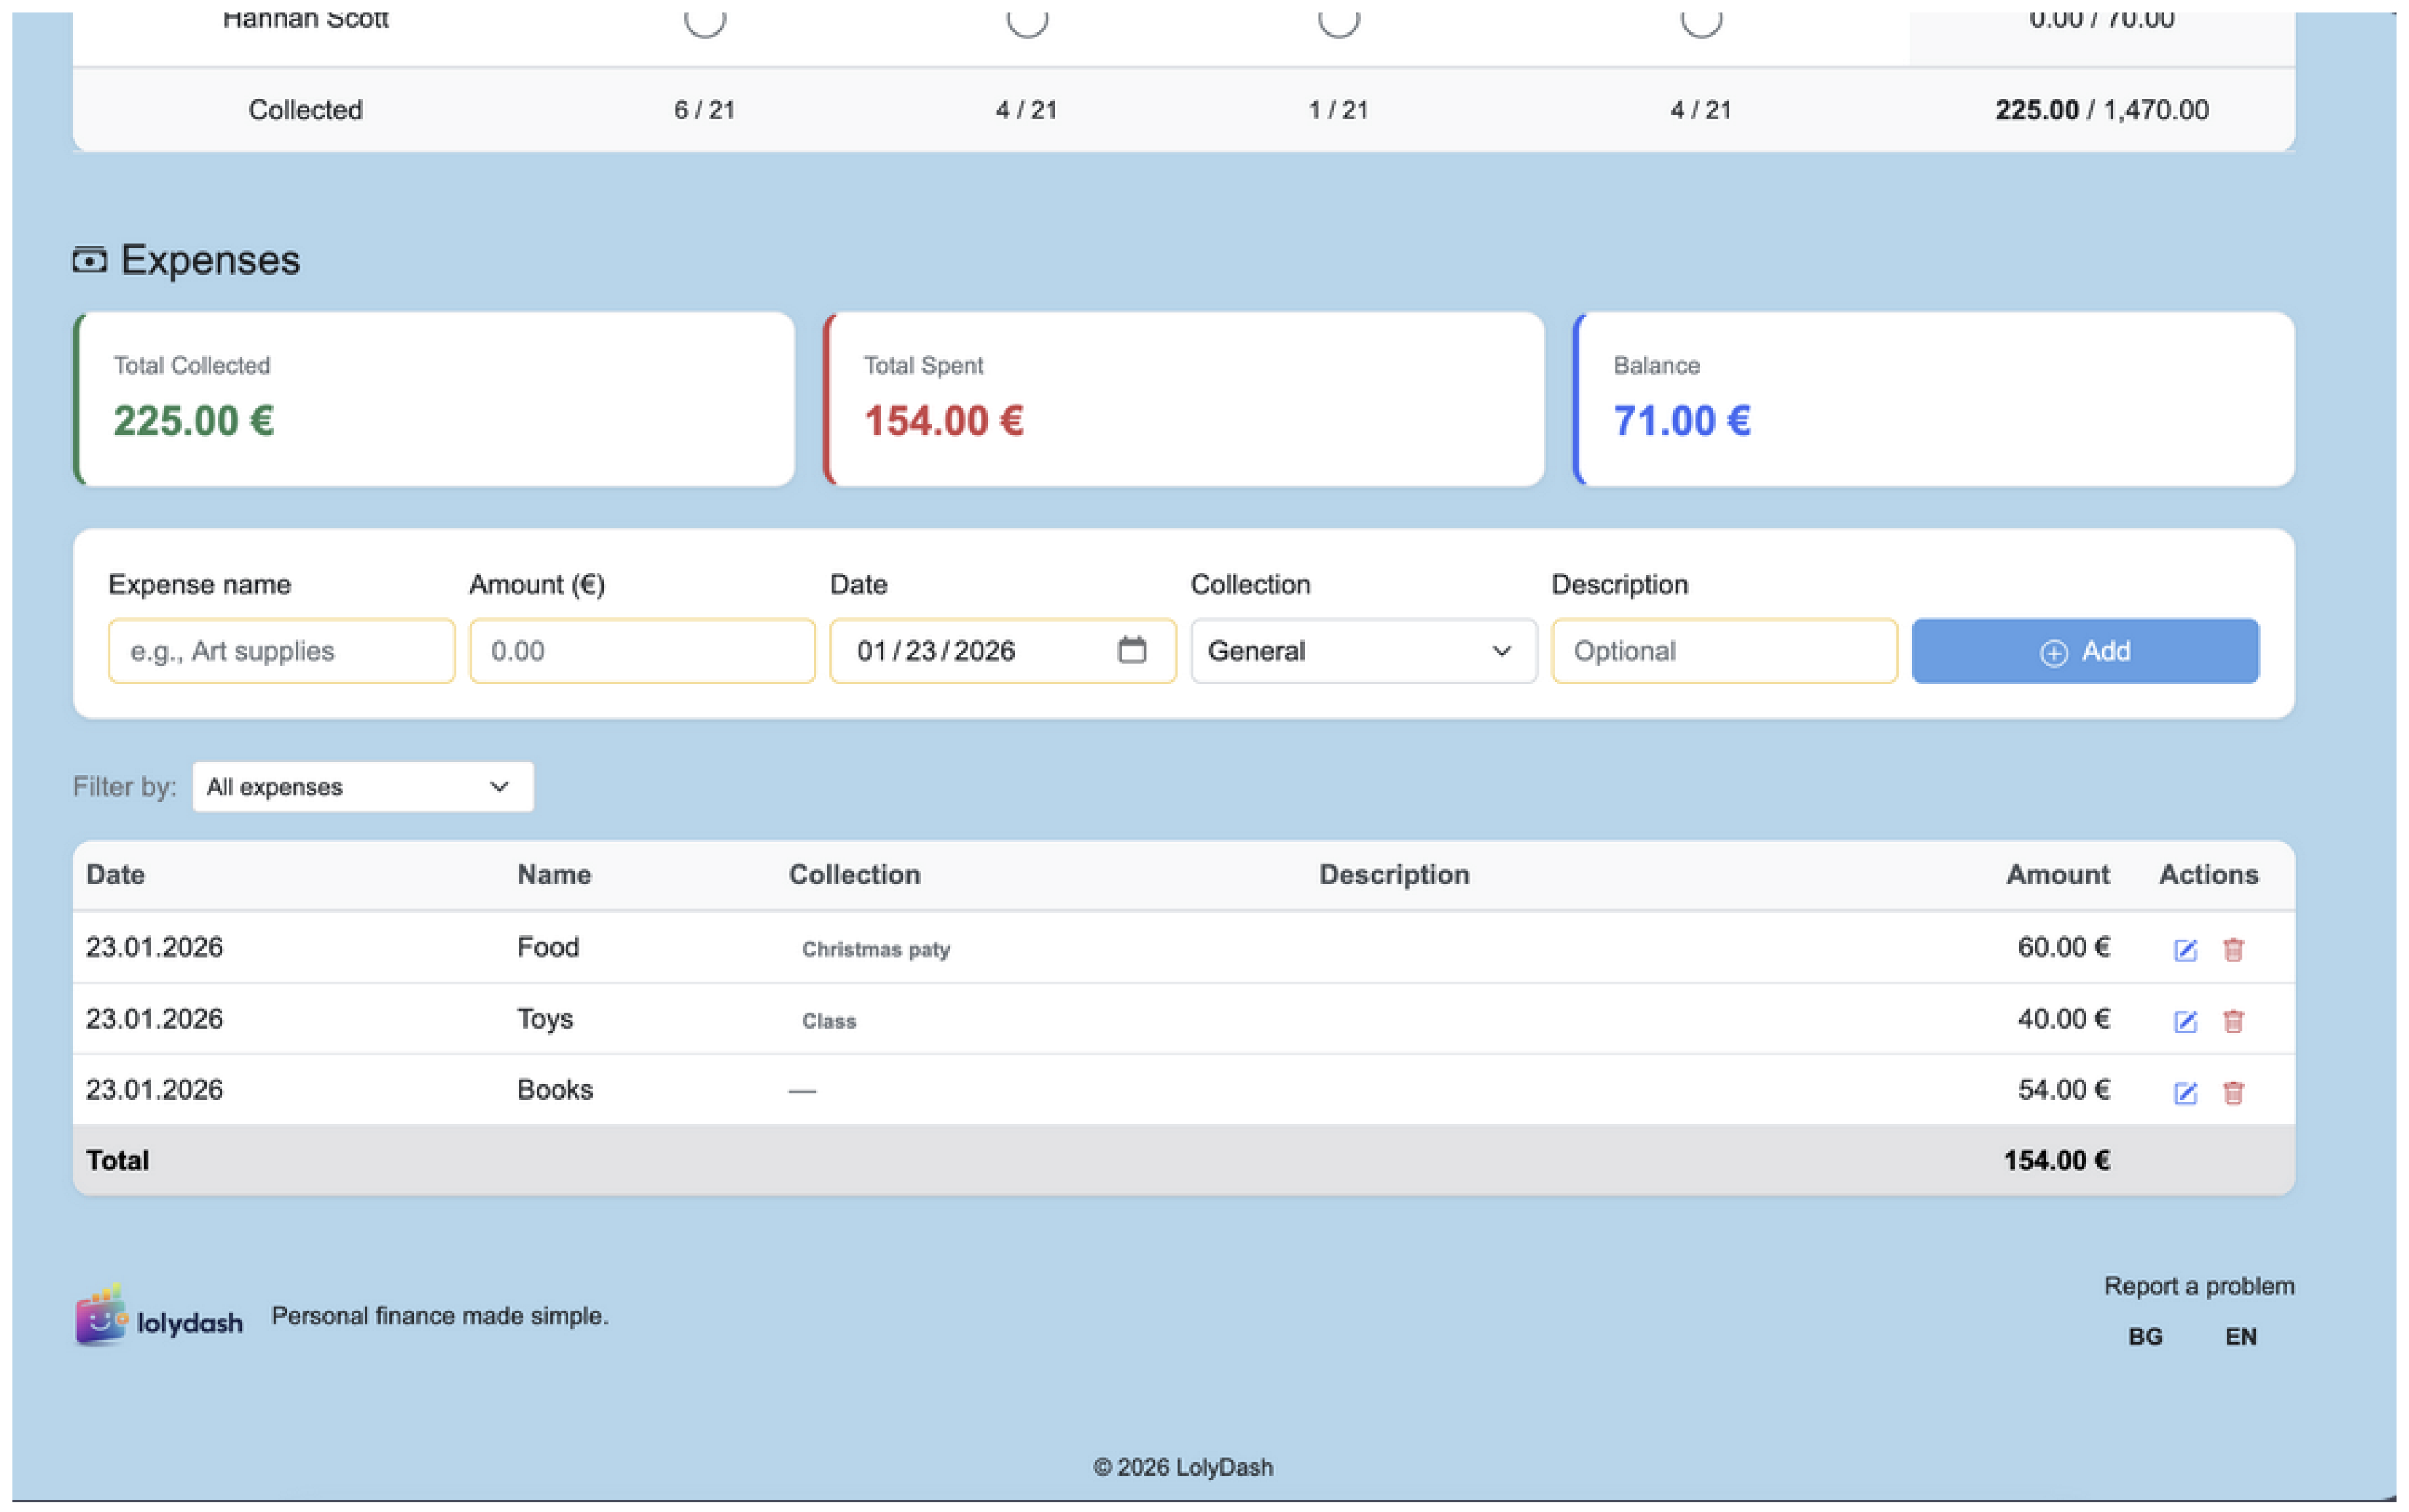
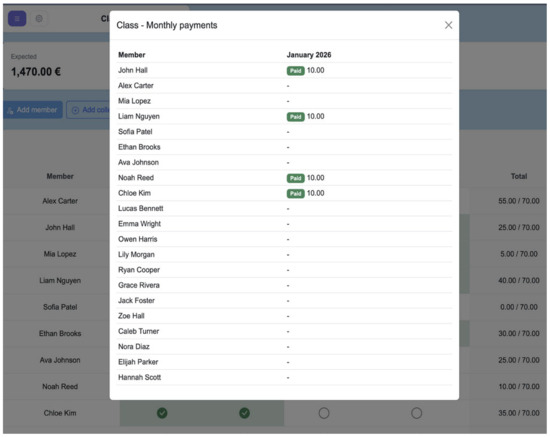
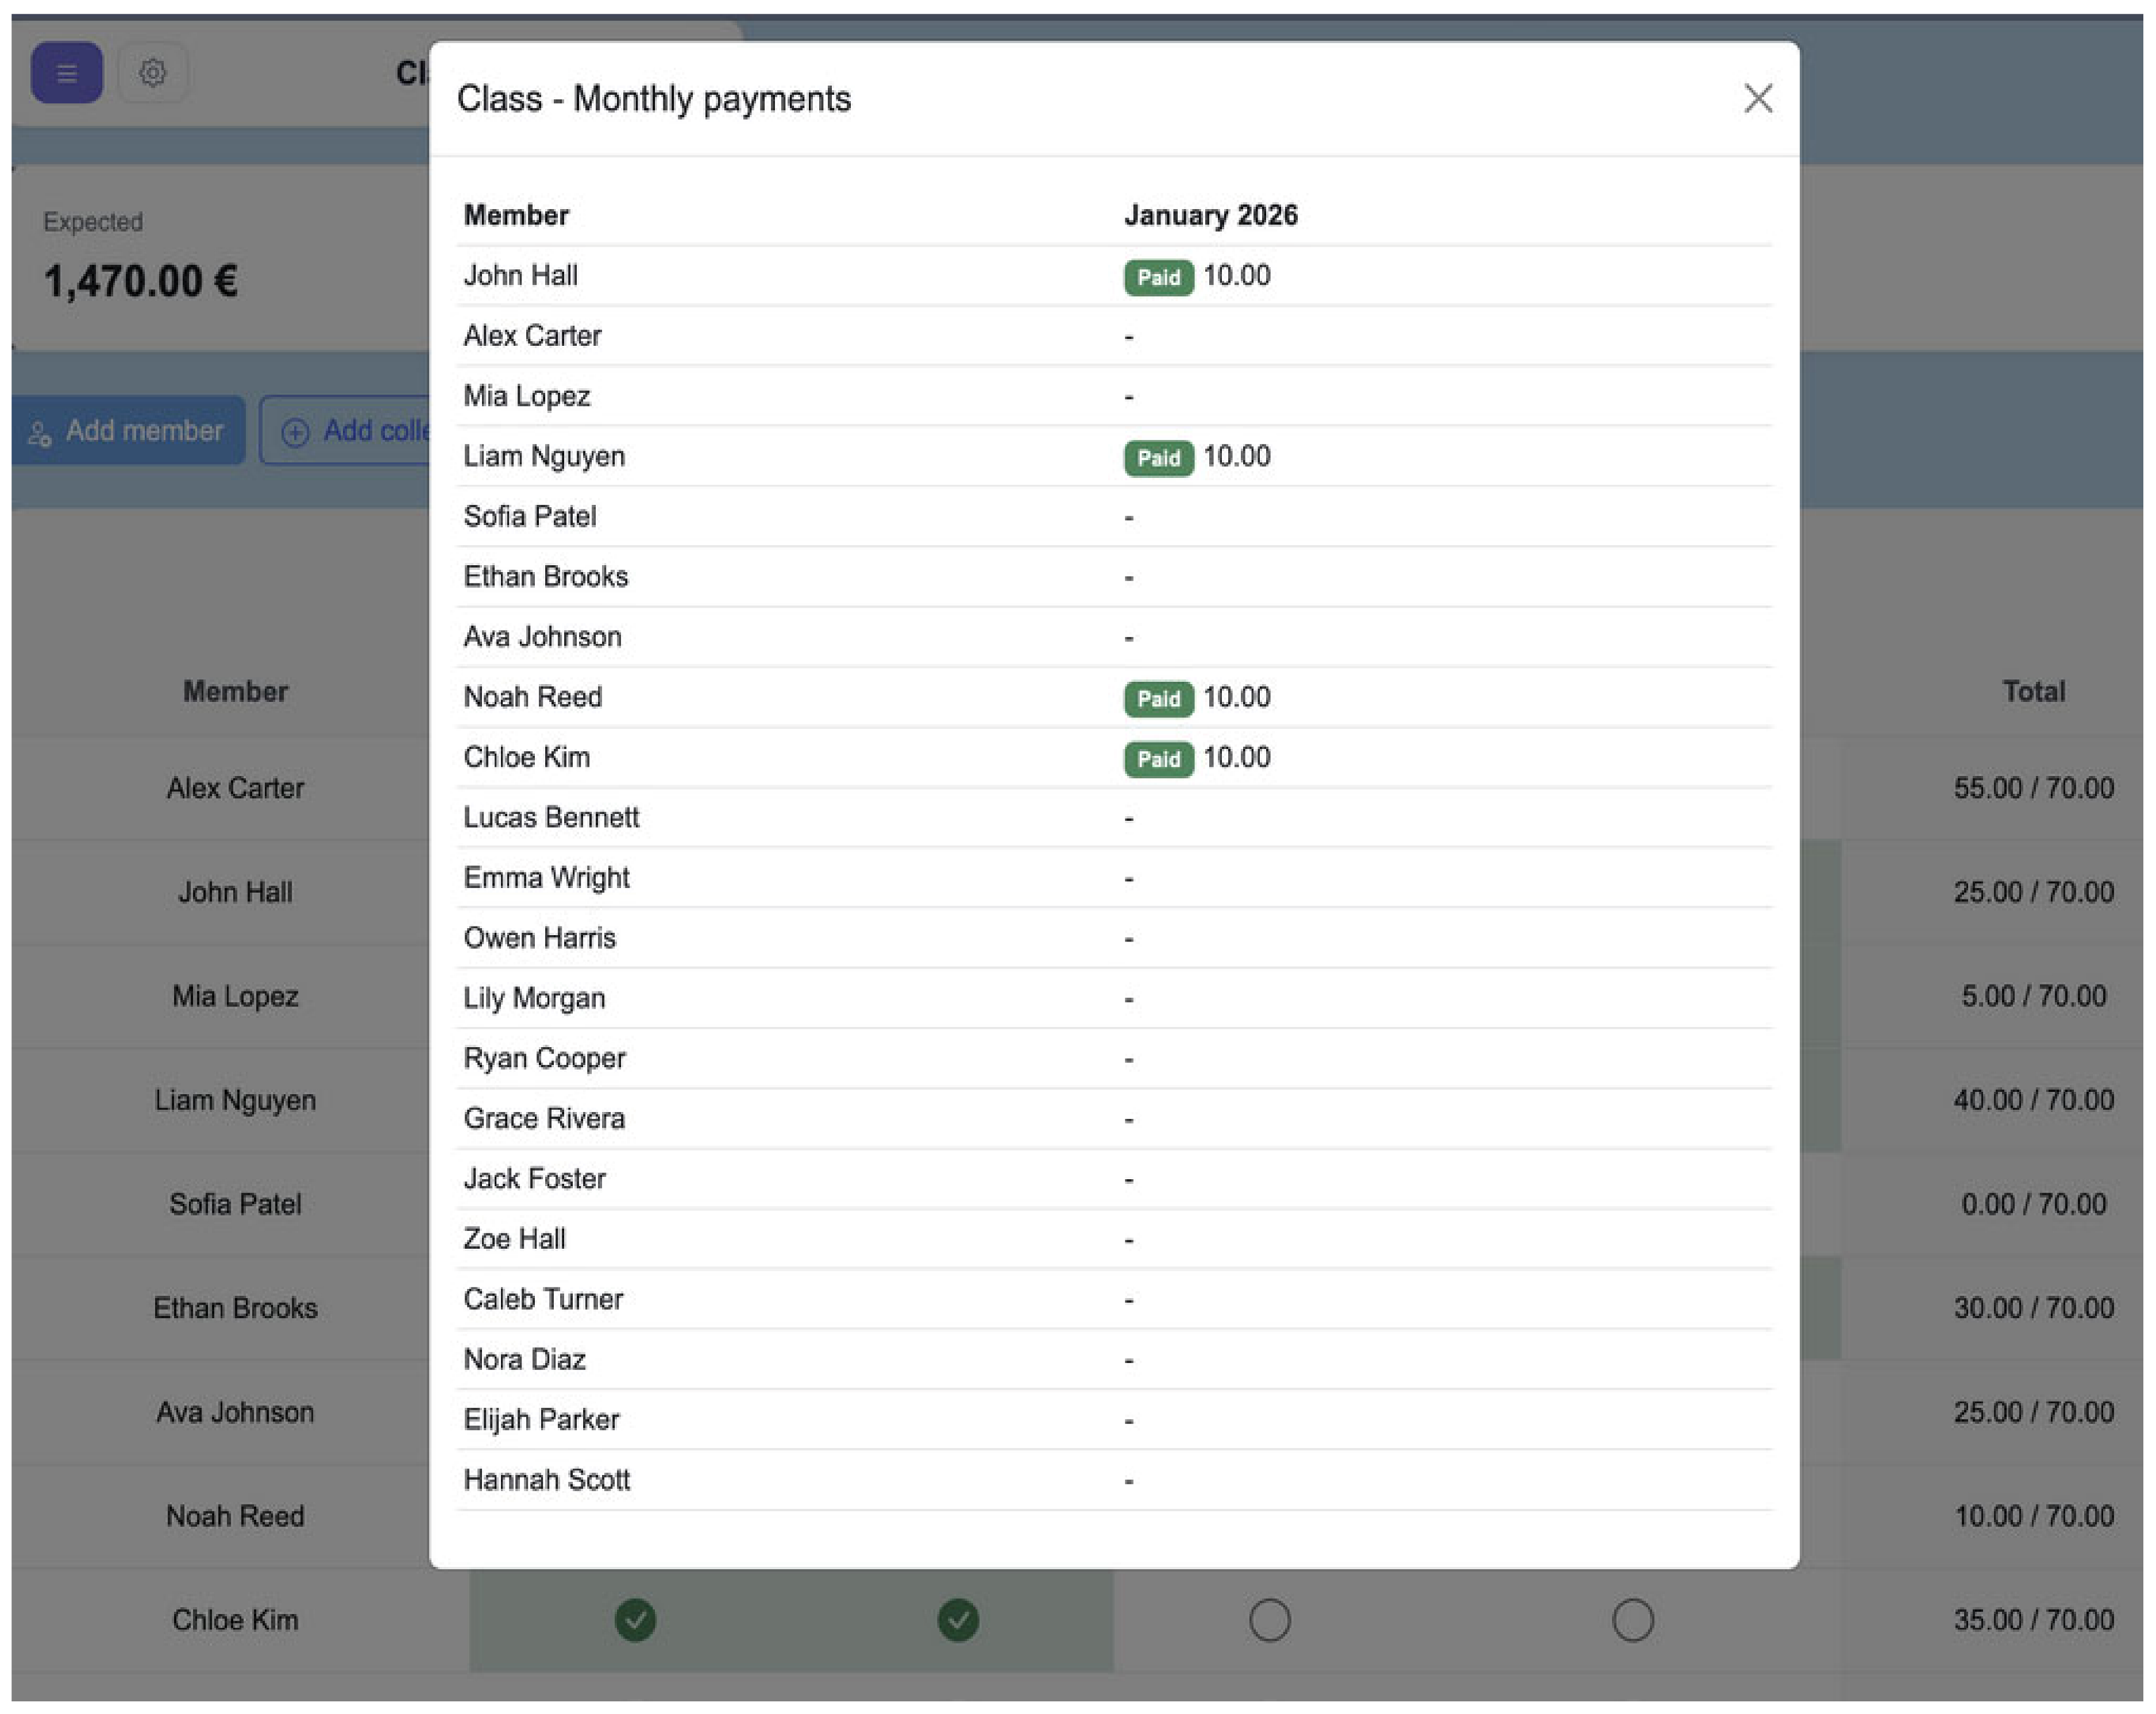
The matrix view of the dashboard (Figure 8) provides a clear visualization of “who paid what”—each row represents a member, and the columns correspond to the different collections. Checkmarks in green mark payments made, while unfilled circles indicate pending amounts. The top bar displays the three key financial indicators: expected amount, collected amount and pending amount. Figure 9 presents the recorded expenses in the Cashier Dashboard, visualizing the total funds collected, the expenses incurred and the current balance for clearer financial control. In Figure 10, this view presents the monthly payments of each member in the “Cashier” group, clearly showing which obligations have been paid and which remain outstanding.
Figure 8.
Treasurer Dashboard—matrix view of payments by member and collections.
Figure 9.
Cashier Dashboard—Expenses module with balance between funds collected and spent.
Figure 10.
Monthly payments—detailed status view by member.
5. Competitive Advantages over Existing Solutions
5.1. Comparative Analysis
The PFM tools market offers numerous solutions with different functionality and pricing models. LolyDash positions itself with a unique combination of features that sets it apart from its main competitors. The key competitive advantages include:
Multi-table architecture: The separation of financial data by semantic contexts is rarely found in competitive solutions. Most applications offer a single database with categories, which limits flexibility in complex financial structures.
- −
- Integrated Cashier module: Group payment management is almost completely neglected by the main PFM applications. LolyDash fills this market niche with a functional and intuitive module.
- −
- Webhook integration: Webhook support allows for the automation of data entry from external systems, such as bank statements, POS terminals or corporate ERP systems. This is a functionality typical of corporate solutions, but it is rarely available in personal PFM tools.
- −
- Shareable boards: The ability to generate shareable read-only links allows for transparent financial collaboration between partners, roommates, or family members.
- −
- Personalized categorization with emojis: Visual identification of categories through emojis significantly speeds up the recognition and input process, especially for mobile use.
5.2. Visual Analytics as a Competitive Advantage
Research in the field of visual analytics shows that graphical representations of financial data are significantly more effective than tabular ones in identifying trends and anomalies [11]. LolyDash integrates interactive pie charts for category distribution, time histograms for daily values, and activity maps for the regularity of entries.
These visualizations are not just decorative elements—they have measurable functional value. The pie chart allows for quick identification of dominant spending categories and comparison of them with desired proportions. The time histogram reveals periodic peaks in spending associated with certain days of the month (bill payments, weekend shopping).
6. Prospects for Artificial Intelligence Integration
6.1. Rationale for AI Integration
Artificial intelligence and machine learning represent the next logical evolutionary step in the development of PFM platforms. While the current generation of tools provides excellent means for tracking and visualizing historical data, AI can transform platforms from passive recorders to active financial advisors [12].
AI integration into LolyDash can follow the following architectural framework: (1) a data collection and normalization layer (already available), (2) an analytical AI layer for processing and modeling, (3) a layer for personalized recommendations and predictions, and (4) an interface layer for presenting AI insights.
6.2. Specific AI Functionalities for Future Development
Automatic categorization: A trained Natural Language Processing (NLP) model can automatically suggest a category based on the transaction name. The user approves or corrects the suggestion, and the model is improved through a reinforcement learning mechanism.
Expense forecasting: Time series models such as ARIMA or LSTM neural networks can analyze historical data and generate forecasts of upcoming monthly expenses by category. These forecasts provide an early warning of the risk of exceeding the budget.
Personalized financial recommendations: Based on spending analysis, the system can identify specific areas for optimization—for example, excessive spending on food compared to users with a similar profile, or irregular savings. Recommendations can be ranked by potential financial impact.
Anomaly detection: Anomaly detection algorithms can identify unusual transactions—potential fraud, erroneous duplications or atypical behavior. Such systems are already standard in the banking sector and can be adapted for the PFM context.
AI assistant (chatbot): Integration of a Large Language Model (LLM) as a financial assistant will allow users to ask questions in natural language: “How much did I spend on food this year?”, “When was the last time I paid for insurance?”, “How do my expenses compare to last month?” Such dialogic interfaces significantly lower the barrier to accessing financial information.
Budget optimization: The system can offer optimized budgets based on declared financial goals (saving a certain amount, paying off a loan, traveling) and historical data. The optimization algorithm balances between desired goals and realistic constraints based on observed spending patterns.
6.3. Technical Challenges
Implementing AI in a PFM context poses specific technical challenges. The quality of predictions is directly dependent on the quantity and quality of historical data—new users with few transactions will receive less reliable recommendations. A cold start mechanism should address this anomaly. Confidentiality of financial data is a critical aspect of AI integration. Any data transfer to cloud AI services must comply with the requirements of GDPR and national data protection legislation. An alternative is the use of on-device AI models, albeit with lower computing power. A further avenue for future investigation concerns the attitudes of potential users toward the adoption of a web-based financial diary. Given that the information recorded in such a tool is inherently sensitive—covering income levels, spending habits, and financial obligations—understanding users’ willingness to store and share this data in a digital environment is of critical importance. A dedicated user study, drawing on technology acceptance models (TAM) or privacy calculus theory, could assess the trade-off between perceived utility and perceived privacy risk. Such research would provide empirical grounding for predicting the market potential of the platform and informing design decisions around data minimization, local storage options, and access control transparency.
7. Conclusions
This article demonstrates that LolyDash represents a mature and functional response to the real needs of users for personal finance management in the digital age. The multi-tab architecture, integrated Cashier module, rich visualizations and webhook integration build a competitive offering that is difficult to replicate from monolithic PFM solutions.
The system successfully combines ease of use with functional depth—basic transaction entry is accessible to any user, while advanced analysis, planning and integration functions satisfy the needs of more demanding users.
The future development of the platform through AI integration is logical and well-founded. Technological readiness—an available structured database, categorized transactions, and time series data—is a solid foundation for building an AI layer. The implementation of the described functionalities will transform LolyDash from a tracking tool into a personalized financial assistant.
Financial literacy is a civic competence of utmost importance in the modern world. Tools like LolyDash, by making financial management more accessible, intuitive, and effective, contribute to increasing this literacy and to better financial well-being of individuals and households.
Author Contributions
Conceptualization, S.D. and M.D.; methodology, S.D.; software, S.D.; validation, S.D.; formal analysis, M.D.; investigation, M.D.; resources, M.D.; data curation, S.D.; writing—original draft preparation, S.D. and M.D.; writing—review and editing, M.D.; visualization, S.D.; supervision, S.D.; project administration, S.D.; funding acquisition, S.D. All authors have read and agreed to the published version of the manuscript.
Funding
This study was financed by the European Union–NextGenerationEU through the National Recovery and Resilience Plan of the Republic of Bulgaria (project № BG-RRP-2.004-0001-C01).
Institutional Review Board Statement
Not applicable.
Informed Consent Statement
Informed consent was obtained from all subjects involved in the study.
Data Availability Statement
No new data were created or analyzed in this study. Data sharing is not applicable to this article.
Conflicts of Interest
The authors declare no conflict of interest.
References
- Atkinson, A.; Messy, F.A. Measuring Financial Literacy: Results of the OECD/International Network on Financial Education (INFE) Pilot Study; OECD Working Papers on Finance, Insurance and Private Pensions, No. 15; OECD Publishing: Paris, France, 2012. [Google Scholar] [CrossRef]
- Lusardi, A.; Mitchell, O.S. The economic importance of financial literacy: Theory and evidence. J. Econ. Lit. 2014, 52, 5–44. [Google Scholar] [CrossRef] [Scilit] [PubMed]
- Krah, R.Y.; Forson, R.; Quaye, I. Personal financial management practices among university students. Int. Rev. Manag. Mark. 2018, 8, 43–50. [Google Scholar] [CrossRef] [Scilit] [PubMed]
- OECD. OECD/INFE 2020 International Survey of Adult Financial Literacy; OECD: Paris, France, 2020. [Google Scholar]
- Klapper, L.; Lusardi, A.; van Oudheusden, P. Financial Literacy Around the World: Insights from the Standard & Poor’s Ratings Services Global Financial Literacy Survey; World Bank Group: Washington, DC, USA, 2015. [Google Scholar]
- Thaler, R.H.; Sunstein, C.R. Nudge: Improving Decisions About Health, Wealth, and Happiness; Yale University Press: New Haven, CT, USA, 2008. [Google Scholar]
- Kara, A.; Tunali, C.B.; Ozdil, O. Digital personal finance management apps: A comparative review. J. Financ. Technol. 2021, 3, 112–128. [Google Scholar]
- Liébana-Cabanillas, F.; Marinkovic, V.; de Luna, I.R.; Kalinic, Z. Predicting the determinants of mobile payment acceptance: A hybrid SEM-neural network approach. Technol. Forecast. Soc. Change 2018, 129, 117–130. [Google Scholar] [CrossRef] [Scilit]
- Sommerville, I. Software Engineering, 10th ed.; [Separation of Concerns principle]; Pearson Education: London, UK, 2016. [Google Scholar]
- Farrell, D.; Greig, F. Paychecks, Paydays, and the Online Platform Economy: Big Data on Income Volatility; JPMorgan Chase & Co. Institute: New York, NY, USA, 2016. [Google Scholar]
- Few, S. Show Me the Numbers: Designing Tables and Graphs to Enlighten, 2nd ed.; Analytics Press: Piedmont, CA, USA, 2012. [Google Scholar]
- Philippon, T. The FinTech Opportunity; BIS Working Papers No. 655; Bank for International Settlements: Basel, Switzerland, 2019. [Google Scholar]
Disclaimer/Publisher’s Note: The statements, opinions and data contained in all publications are solely those of the individual author(s) and contributor(s) and not of MDPI and/or the editor(s). MDPI and/or the editor(s) disclaim responsibility for any injury to people or property resulting from any ideas, methods, instructions or products referred to in the content. |
© 2026 by the authors. Licensee MDPI, Basel, Switzerland. This article is an open access article distributed under the terms and conditions of the Creative Commons Attribution (CC BY) license.