


Abstract
Locomotor pathologies modify the dynamic parameters of the gait cycle; yet quantitative plantar pressure data for everyday walking remain limited. This study analyses how the incidence of locomotor disorders affects total plantar force and pressure in different walking conditions, using recordings acquired with an RSScan pressure platform. A cohort of 37 subjects performed simulated walking tasks, and a PostgreSQL–Python pipeline computed per-cycle total force and pressure and summarized them by age, shoe size, walking type, and pathology incidence. Results indicate systematic differences in dynamic load patterns between normal and simulated walking types, supporting pressure-based gait analysis as a practical tool for clinical assessment.
1. Introduction
Gait analysis is used in different assessments in sports and rehabilitation, custom design insoles and orthoses. Quantitative analysis of spatiotemporal parameters, ground reaction forces, and plantar pressure distribution provides objective measures of functional performance and compensatory strategies during walking. In musculoskeletal and foot disorders such as osteoarthritis or hallux valgus, characteristic alterations in plantar loading patterns and pressure–time integrals have been reported, underlining the clinical value of pressure-based gait assessment. However, most existing studies focus on specific pathologies or local pressure indices, with fewer analyses relating the overall incidence of locomotor pathologies to aggregate dynamic parameters such as total force and total pressure across different walking conditions [1,2,3,4].
Previous work has shown that plantar pressure and ground-reaction-force–derived parameters can differentiate between normal and unstable gait and provide norm-referenced values for clinical interpretation [5,6]. A bibliometric study was carried out to map research on sustainable gait analysis technologies in healthcare. Articles and reviews from 2015 to 2025 were retrieved from Web of Science (October 2025) using keywords combining gait analysis, wearable/IMU sensors, sustainability terms, and AI/machine learning, yielding 625 relevant publications from an initial ~12,000 records after filtering [7].
There are studies with different pathologies and results from researchers using different methods, but the results are conclusive that gait analysis is a useful tool for clinical assessment and interpretation. Yet, relatively few analyses relate the incidence of heterogeneous locomotor pathologies to aggregate dynamic parameters such as total force and total pressure across everyday walking tasks.
The aim of this study is to analyze how the incidence of locomotor pathologies influences dynamic gait parameters derived from RSScan (RSscan International NV, Olen, Belgium) pressure platform recordings in normal walking and four simulated types of walking that show restrictions on gait similar to those of pathologies. We examined how these aggregate force and pressure measures vary with walking type, age, shoe size, and the presence of locomotor pathology, in order to identify clinically relevant patterns in dynamic loading.
2. Methods
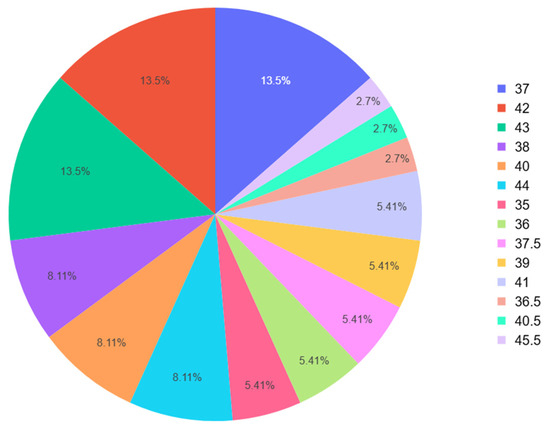
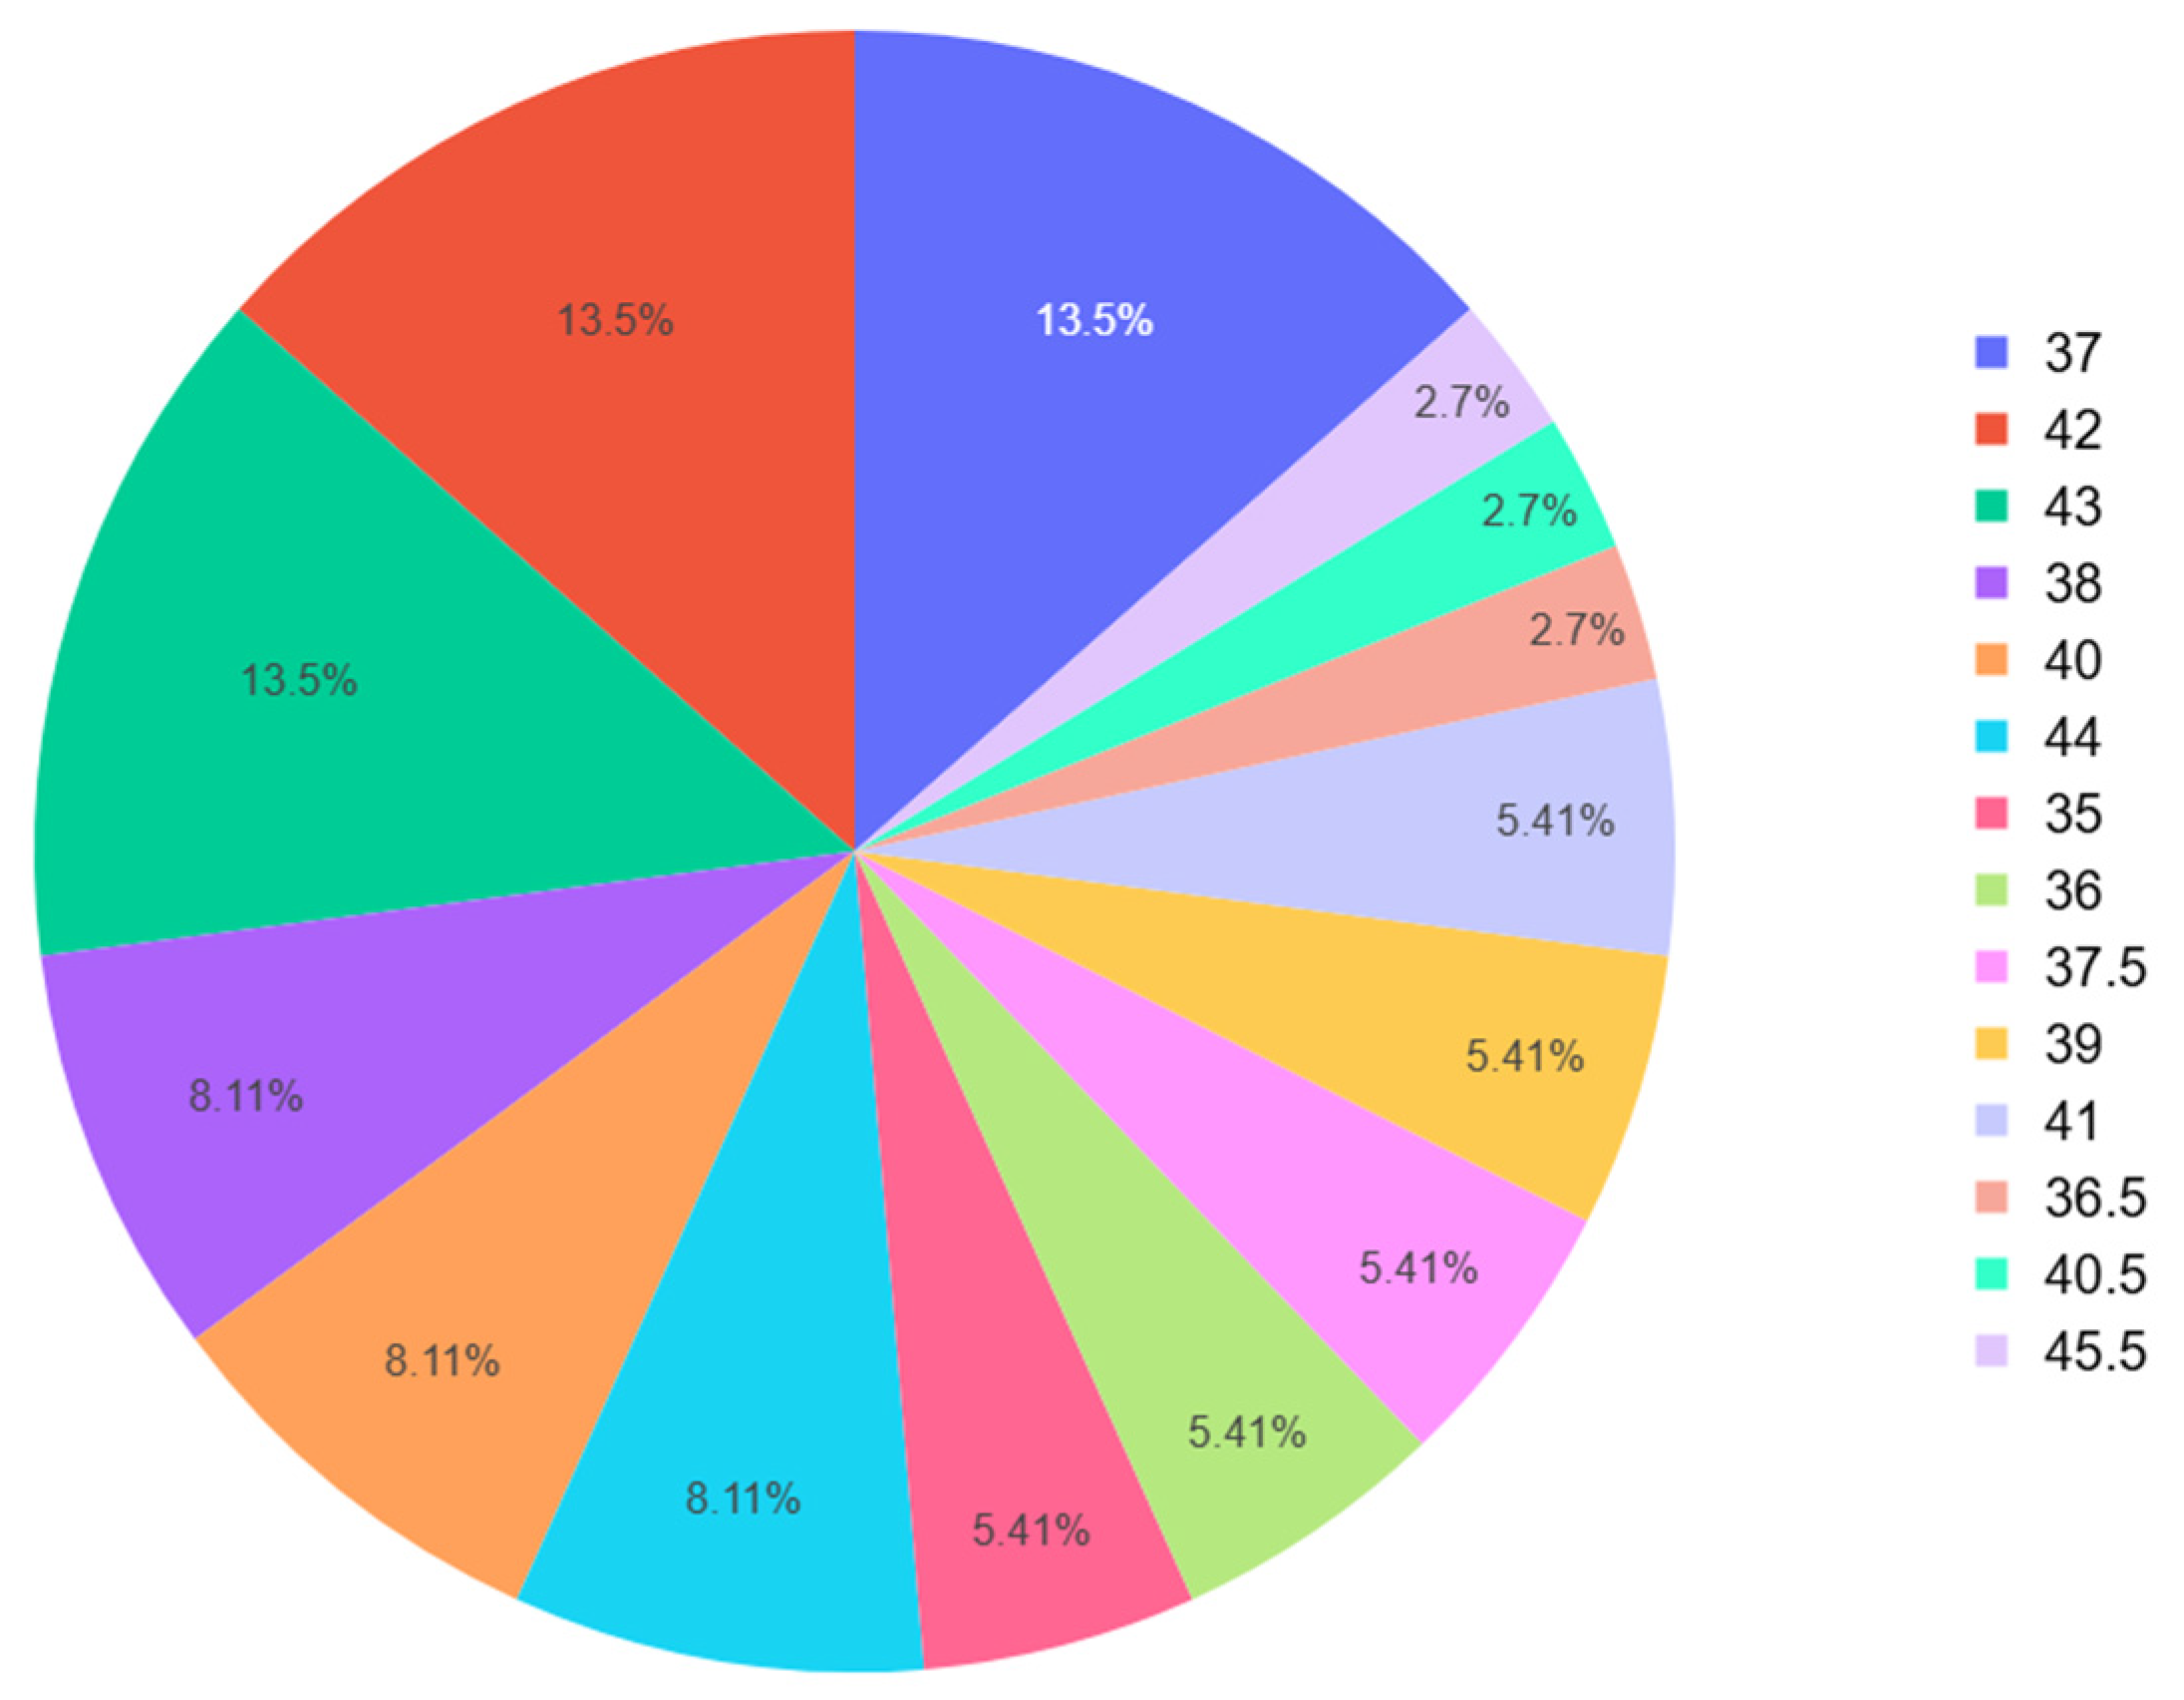
Gait data was recorded for the 37 subjects with an RSScan footscan platform designed to measure dynamic plantar pressure. The information needed for calibration of the RSScan platform includes weight, shoe size, date of birth. Figure 1 shows the distribution of shoe sizes of the participants. From this, we can conclude that we have more participants with larger shoe sizes (approx. 56%) than smaller shoe sizes (approx. 44%). The age of the subjects ranged between 20 and 71, most of them being between 20 and 40. The subjects performed each type of walking three times, wearing day-to-day shoes. They were selected as healthy individuals without medical conditions and asked simply to simulate the four types of walking described above.
Figure 1.
Shoe size distribution.
2.1. RSScan Platform
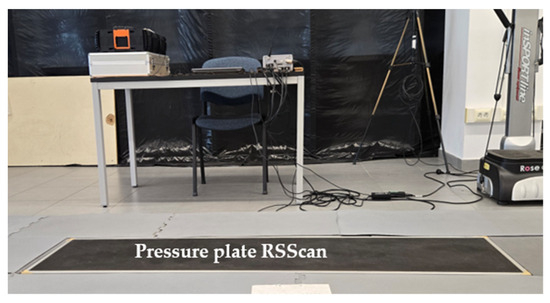
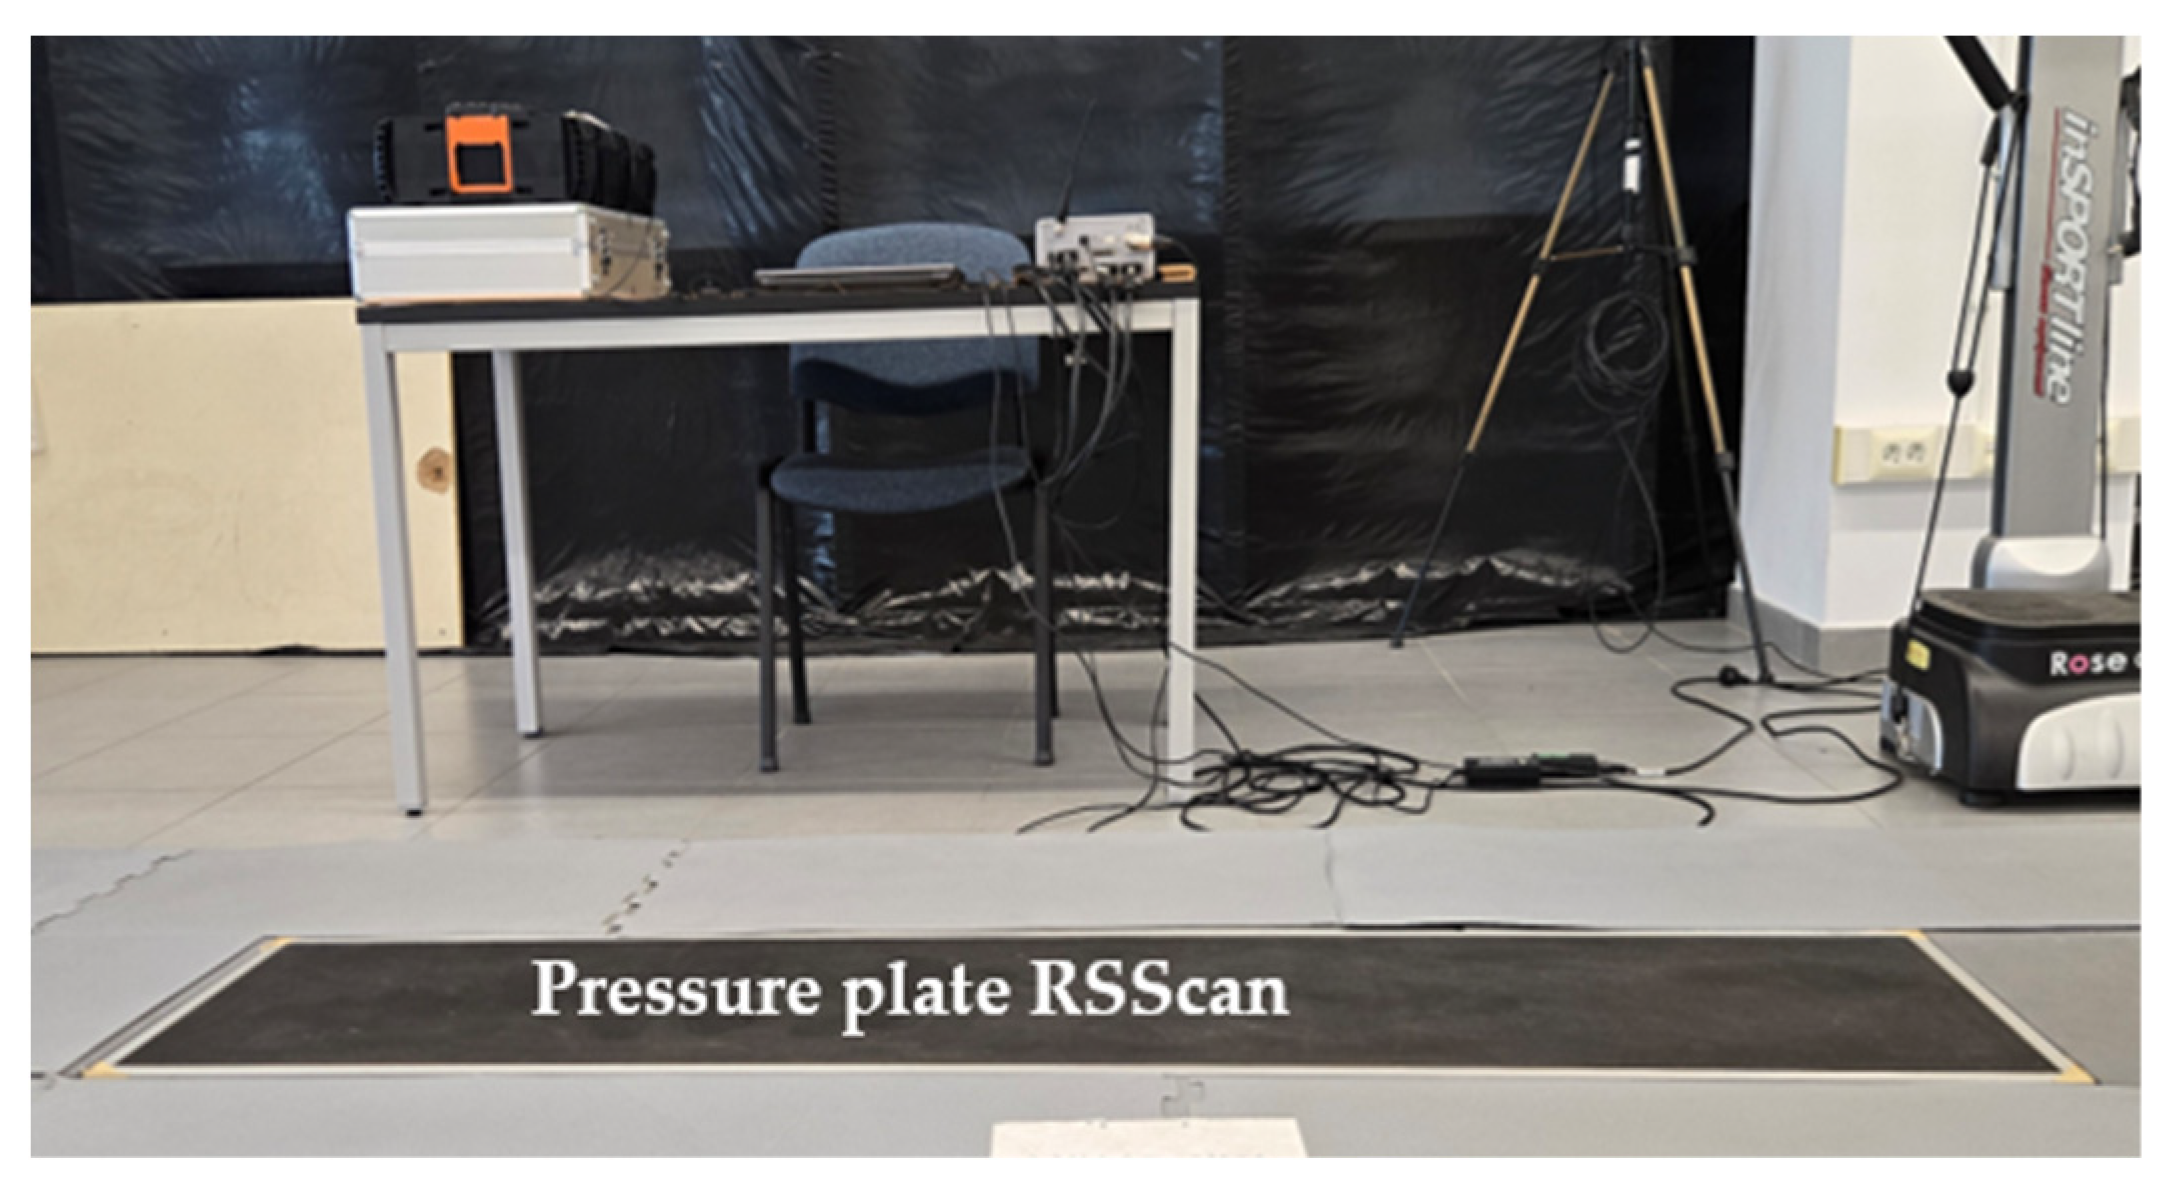
The RSScan platform is a plantar pressure mapping plate 2 m long with over 10,000 sensors. This needs to be calibrated for each person with specific parameters mentioned above. For the experiment, we used the setup from Figure 2, within controlled temperature, light and humidity, located in the Research and Development Institute of the University. During each trial, subjects completed one normal walking condition and four simulated walking conditions (marching walking (MW), simulated Parkinson’s Disease Walking (PDW), high knee walking (HKW), and added step walking (ASW)), designed to reproduce clinically relevant gait alterations. The system was calibrated according to the manufacturer’s recommendations, and raw pressure frames were exported in RSscan file format for subsequent processing.
Figure 2.
Setup for the experiment (RSScan platform and computer linked to it).
2.2. Numerical Processing and Comparative Analysis of Parameters
Exported RSscan files were imported into a PostgreSQL relational database via a custom Python script. For each valid footprint, per-step total force and plantar pressure parameters were computed by summing the sensor contributions across all active measurement points. Data were subsequently aggregated by walking condition (NW, MW, PDW, KRW, ASW) and by foot side (left, right), yielding minimum, maximum, and mean values for both total force and total pressure per condition. Descriptive statistics were computed in Python (version 3.11, Python Software Foundation, Wilmington, DE, USA) using the Pandas library, and results were exported to structured spreadsheet format for comparative analysis and figure generation. Descriptive statistics (minimum, maximum, and mean) were computed for total force and total plantar pressure, grouped by walking condition and foot side (left, right). All-feet aggregate values were derived directly from raw per-step observations. Statistical analysis was performed using Python with the Pandas library. Figures were generated using Plotly (version 6.6.0, Plotly Technologies Inc., Montréal, QC, Canada). No inferential statistical tests were applied at this stage.
3. Results
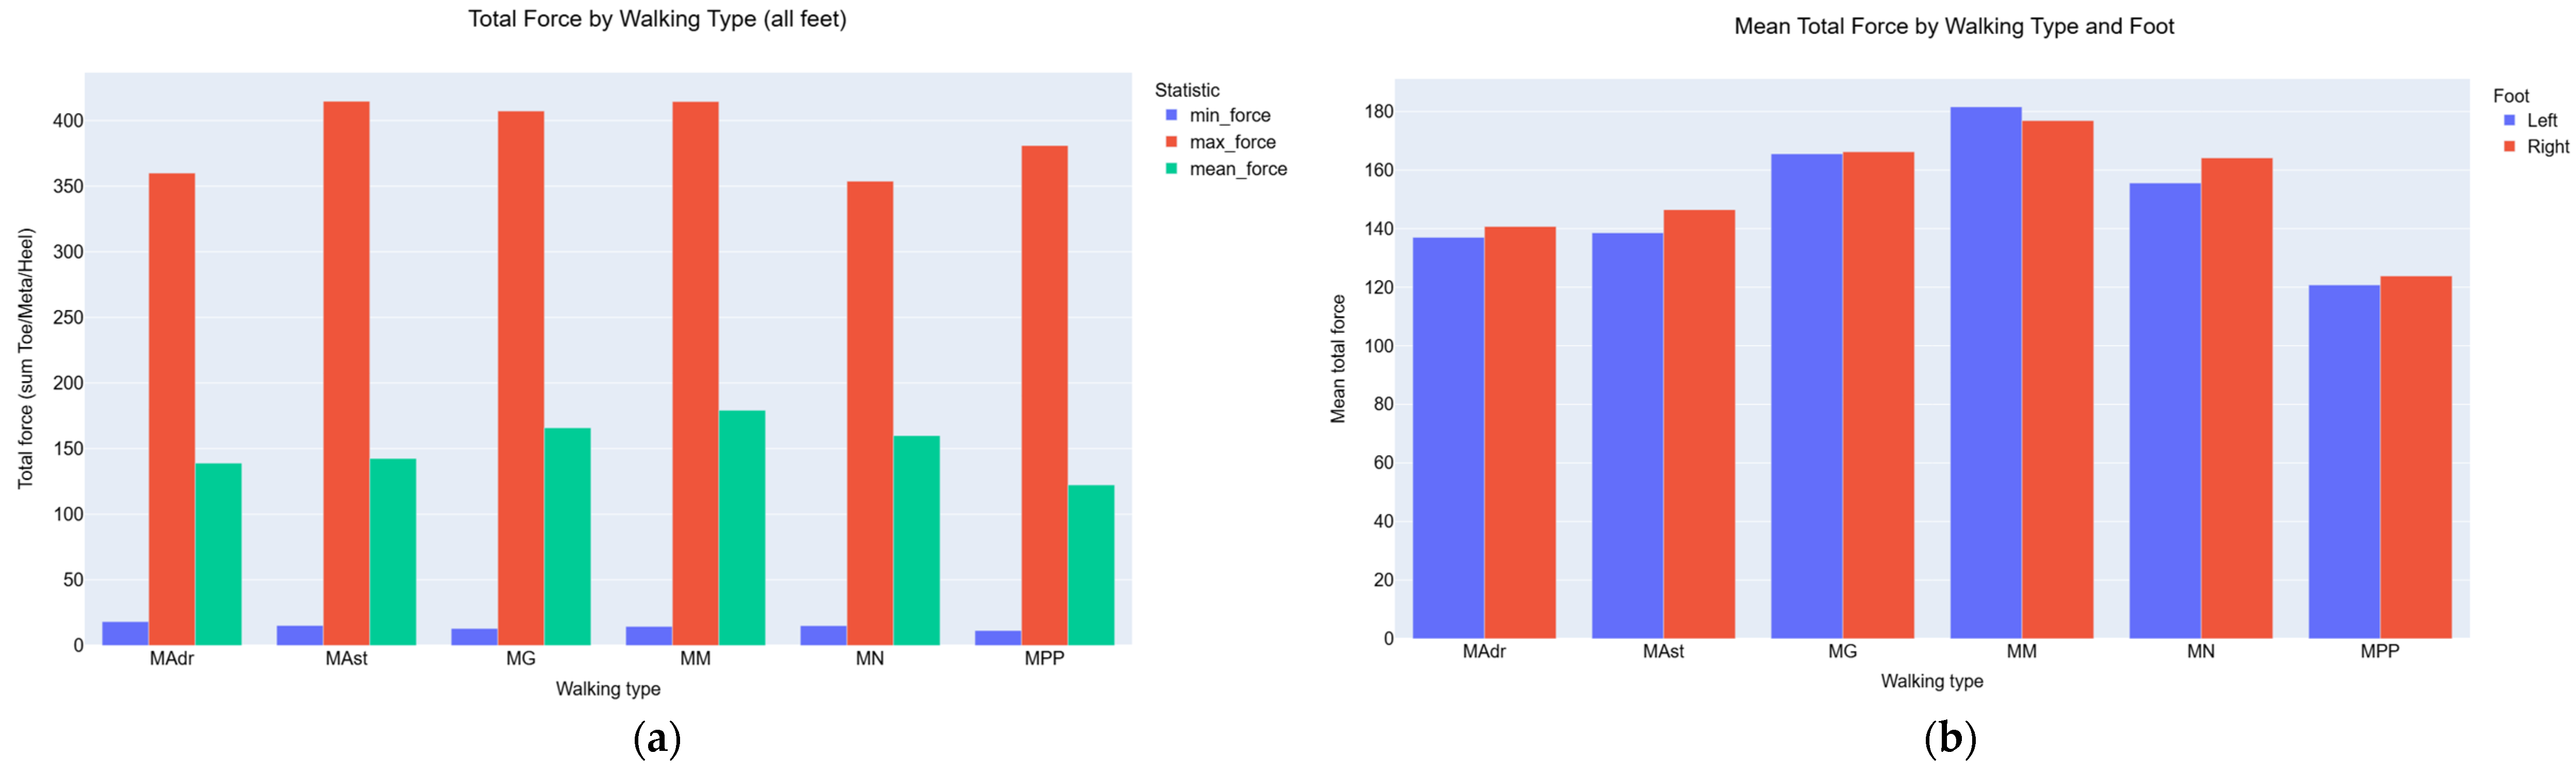
From all subjects and experiments, we extracted a table with minimum, maximum and mean force and pressure for different walking types. Figure 3a shows the total force by walking type for all feet and Figure 3b shows the same but represented for both left and right feet. From Figure 3a, we can observe that in added step walking, the maximum force is greater than in normal walking, but the mean value for marching walking shows more force applied. Figure 3b shows that total plantar force was consistently higher in the right limb across all walking conditions, indicating a systematic side dominance in dynamic loading. This is in line with previous work reporting that able-bodied gait is not perfectly symmetric and that dominant and non-dominant legs play different functional roles during stance and propulsion.
Figure 3.
Representation of force values within the all-walking types (a) Total force for all feet (left and right) and all walking types; (b) Mean force by walking type and foot.
Large epidemiological studies also show that most right-handed adults are right-leg or right-foot dominant, which is consistent with the higher loading we observed under the right foot in our mainly right-handed sample [8,9,10].
A standard deviation of the walking types from normal walking was applied, taken as the reference for the participants of the experiment. In Table 1, are represented the mean values of the walking types, the standard force deviation and the difference from NW. The standard deviation of total force quantifies step-to-step variability in plantar loading for each walking condition; higher values indicate less consistent force patterns across cycles, whereas lower values indicate more repeatable loading. From this theory, we can observe that KRW is the most unstable type of walking and can cause differences in the walking patterns, yet the most stable is the simulated Parkinson’s disease walking. This is somewhat to be expected because in that condition the center of force mass changes, the body is not straight, the steps are not large so the equilibrium is more stable through this type of walking than the rest.
Table 1.
Standard deviation of force of the walking types from normal walking.
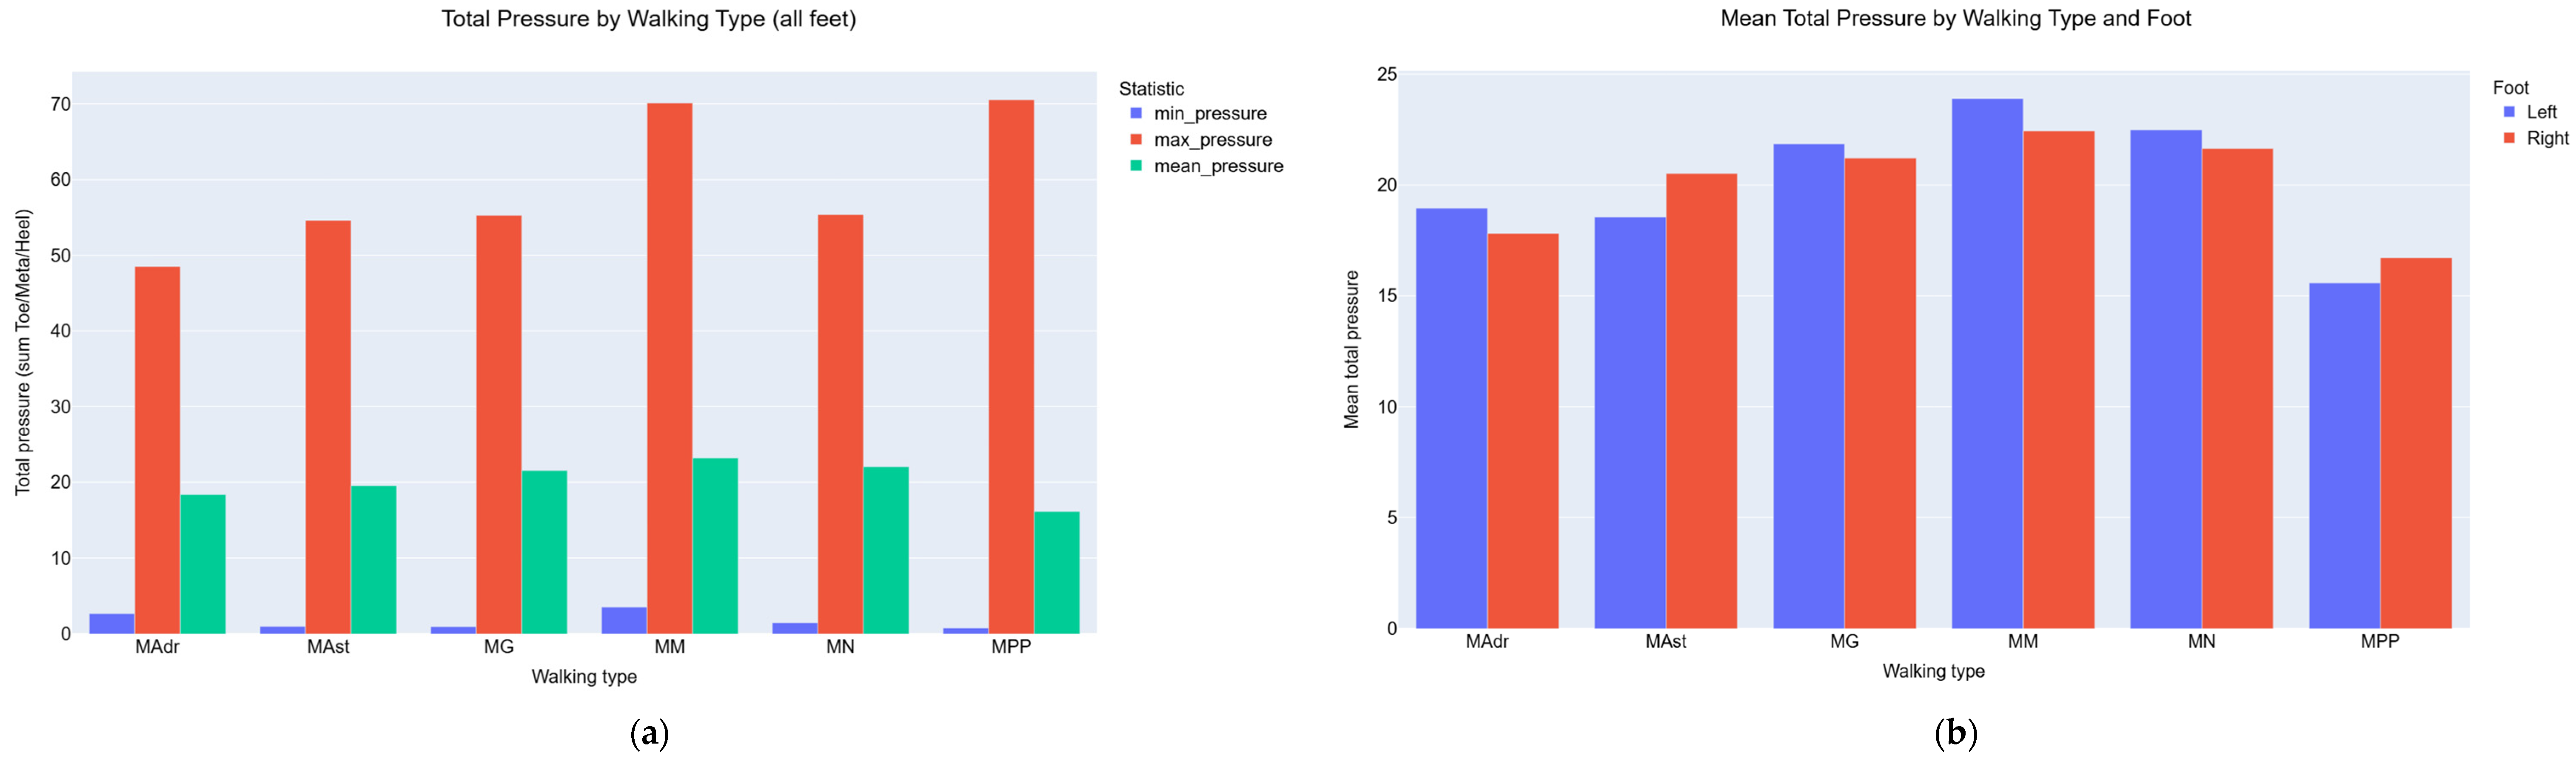
For the plantar pressure, the same analysis was performed with standard deviation, minimum, maximum, mean pressure. Figure 4a is represented the total pressure by walking type for all feet and in Figure 4b is the same but represented for both left and right feet. For the plantar pressure, the results are slightly different, meaning that the left foot has more pressure than the right, but MW (MM on the graphs) is consistently walking type with most force and pressure on the feet.
Figure 4.
Representation of plantar pressure values within the all walking types (a) Total pressure for all feet (left and right) and all walking types; (b) Mean pressure by walking type and foot.
The values for standard deviation of the plantar pressure are represented in Table 2 along with the corresponding values for force. These values represent the consistency of loading under the foot. Low values mean the loading is stable, whereas higher values reflect movement variability.
Table 2.
Standard deviation of pressure of the walking types from normal walking.
4. Discussions
In this study, we analyzed how simulated walking types influenced global force and pressure compared to normal walking. Across all conditions, we observed systematic changes in the distribution of dynamic loads, supporting previous work showing that ground-reaction-force-derived and plantar-pressure-derived parameters are sensitive to gait alterations and instability.
The study also showed an interesting result, which indicates a consistent side dominance in dynamic loading. Furthermore, as presented in the article, most right-handed individuals are also right-leg dominant, which is compatible with the higher loading of the right limb observed in our predominantly right-handed sample.
In addition to mean values, we examined the standard deviation of total force and total plantar pressure as an indicator of gait variability. In our data, conditions designed to challenge gait control tended to exhibit larger standard deviations, consistent with the idea that simulated impairments lead to more irregular loading patterns across successive steps. Conversely, lower variability during normal walking supports the interpretation of this condition as the most stable and repeatable gait pattern for our cohort.
5. Conclusions
The simulated walking conditions revealed clear differences in plantar pressure and total force, showing that even simulated impairments cause the feet to change and behave differently. This study demonstrates that plantar pressure mapping is a useful tool for clinical assessment, revealing problems of load force in walking types.
Author Contributions
Conceptualization, A.I.T., M.I.B. and S.C.Z.; methodology, A.I.T.; software, A.I.T.; validation, A.I.T., M.I.B. and S.C.Z.; formal analysis, A.I.T. and S.C.Z.; investigation, A.I.T.; resources, A.I.T. and M.I.B.; data curation, S.C.Z.; writing—original draft preparation, A.I.T.; writing—review and editing, A.I.T. and M.I.B.; visualization, A.I.T.; supervision, M.I.B. and S.C.Z. All authors have read and agreed to the published version of the manuscript.
Funding
This research received no external funding.
Institutional Review Board Statement
The study was conducted in accordance with the Declaration of Helsinki.
Informed Consent Statement
Informed consent was obtained from all subjects involved in the study.
Data Availability Statement
The data presented in this study are available upon request from the corresponding author.
Acknowledgments
This experiment was carried out using equipment from the Advanced Mechatronic Systems Research Center–C04 from Research Institute, Applied optometry Laboratory at University Transylvania of Brasov and is part of the research developed within the PhD thesis of doctoral student Anca Ioana Tătaru (Ostafe).
Conflicts of Interest
The authors declare no conflicts of interest.
References
- Lin, S.; Zheng, R.; Zhao, W.; Cao, J.; Wang, D. Statistical analysis on multi-factors of dynamic plantar pressure to normal subjects. Biomed. Signal Process. Control 2023, 84, 104995. [Google Scholar] [CrossRef] [Scilit]
- Foot Pressure Distribution of Patients with Hallux Valgus During Walking up and Down Stairs. Available online: https://www.springerprofessional.de/en/foot-pressure-distribution-of-patients-with-hallux-valgus-during/15133424 (accessed on 30 March 2026).
- Park, J.S.; Kim, C.H. Ground-Reaction-Force-Based Gait Analysis and Its Application to Gait Disorder Assessment: New Indices for Quantifying Walking Behavior. Sensors 2022, 22, 7558. [Google Scholar] [CrossRef] [Scilit] [PubMed]
- Kamal, K.C.; Kamal, A.M.; Kamal, D.; Fugaru, O.; Matei, D.; Trăistaru, M.R. Gait Analysis as a Measure of Physical Performance in Older Adults with Bilateral Knee Osteoarthritis. Medicina 2025, 61, 2118. [Google Scholar] [CrossRef] [Scilit] [PubMed]
- Lemaire, E.D.; Biswas, A.; Kofman, J. Plantar pressure parameters for dynamic gait stability analysis. In Annual International Conference of the IEEE Engineering in Medicine and Biology—Proceedings; IEEE: New York, NY, USA, 2006; pp. 4465–4468. [Google Scholar]
- Ostafe, A.I.; Baritz, M.I.; Repanovici, A.; Apostoaie, M.G.; Lazăr, A.M. Sustainable Engineering of Gait Analysis Technologies for Equitable Global Healthcare. In Advances in Digital Health and Medical Bioengineering II: Proceedings of EHB 2025; Springer Nature: Berlin/Heidelberg, Germany, 2026; in press. [Google Scholar]
- Muraleedharan, A.; Ragavan, S.; Devi, R. Are Footedness and Lateral Postures Better Predictors of Hemispheric Dominance Than Handedness: A Cross-sectional Questionnaire-Based Clinical and Pedigree Study. J. Neurosci. Rural Pract. 2020, 11, 130–134. [Google Scholar] [CrossRef] [Scilit] [PubMed]
- van Melick, N.; Meddeler, B.M.; Hoogeboom, T.J.; Nijhuis-van der Sanden, M.W.G.; van Cingel, R.E.H. How to determine leg dominance: The agreement between self-reported and observed performance in healthy adults. PLoS ONE 2017, 12, e0189876. [Google Scholar] [CrossRef] [Scilit] [PubMed]
- Allard, P. Symmetry and Limb Dominance in Able-Bodied Gait: A Review. 2000. Available online: https://www.academia.edu/11753632/Symmetry_and_limb_dominance_in_able_bodied_gait_a_review (accessed on 20 March 2026).
- Jafaar, S.; Ghazwan, A. Gait asymmetry according to limb dominance. In AIP Conference Proceedings; American Institute of Physics Inc.: College Park, MD, USA, 2023. [Google Scholar] [CrossRef] [Scilit]

Disclaimer/Publisher’s Note: The statements, opinions and data contained in all publications are solely those of the individual author(s) and contributor(s) and not of MDPI and/or the editor(s). MDPI and/or the editor(s) disclaim responsibility for any injury to people or property resulting from any ideas, methods, instructions or products referred to in the content. |
© 2026 by the authors. Licensee MDPI, Basel, Switzerland. This article is an open access article distributed under the terms and conditions of the Creative Commons Attribution (CC BY) license.