


Abstract
High-voltage cable joints are critical components where electric stress concentration often leads to insulation failure. This study evaluated three materials to find optimal configurations for controlling stress in 33 kV applications: PVC tape, stress-grading mastic, and semiconductive rubber tape, with initial relative permittivities of 2.96, 2.66, and 5.07, respectively. Dielectric measurements using a Schering Bridge at voltages of up to 3700 V determined material properties and breakdown characteristics. Semiconductive rubber withstood the highest voltage of 3700 V, while mastic failed at 1350 V. Finite element simulations showed that baseline configurations without proper insulation had a peak stress of 4.3 kV/mm. Simulations of individual materials identified non-linear resistive compounds, such as ZnO-based materials and carbon-black-filled polymers, as the most effective for stress control at conductor interfaces. A three-layer graded design, arranging materials by decreasing permittivity from the conductor outward, reduced the peak stress by 33% to 2.9 kV/mm. These results demonstrate that strategic permittivity grading combined with appropriate material selection ensures uniform field distribution and improved reliability in HV cable joints.
1. Introduction
High-voltage (HV) power cables are essential components of modern power networks. For these systems to remain reliable, every component must operate as intended, particularly cable joints, which connect two cable sections and maintain both electrical and mechanical integrity [1]. However, cable joints are often the most vulnerable part of the system [2]. Due to the complex construction and the presence of multiple materials in the joint, they are prone to high electrical stress concentration at the interfaces, which can lead to insulation degradation, partial discharges (PDs), and, ultimately, dielectric breakdown [3].
Ensuring the long-term performance of these joints requires the careful selection and evaluation of the materials used within them. While individual insulation materials have been characterised in previous studies, the systematic comparison of material configurations to optimise the electric field distribution in 33 kV cable joints remains incompletely addressed. This work investigates three commonly used insulation materials: PVC electrical tape, stress-grading mastic, and semiconductive rubber tape to determine the optimal configuration for controlling stress concentration. Dielectric properties, including tan delta values, capacitances, and relative permittivities, are characterised experimentally using a Schering bridge at voltages of up to the breakdown point. Finite element simulations evaluate the electric field distribution across different joint configurations, including single-material designs and multi-layer graded arrangements. The combined experimental and simulation approach provides insights into material selection and configuration strategies for improving the reliability of HV cable joints.
2. Cable Joint Insulation and Dielectric Properties
2.1. Cable Joint Structure
Reliable HV power transmission depends not only on the quality of the cables themselves but also on the performance of the joints that connect them [4]. A cable joint restores the electrical and mechanical continuity between two cable sections, replicating the insulation, shielding, and protection layers of the original cable [5]. It must restore all the layers of the original cable, including the conductor, insulation, semiconductive screens, metallic sheath, and outer protection, to ensure the same dielectric and mechanical performances as those of the cable itself [6]. The materials used within these joints must, therefore, be carefully selected to manage electrical stress, maintain insulation integrity, and prevent dielectric breakdown.
2.2. Electric Field Distribution and Stress Control
Early investigations into cable reliability identified joints and terminations as the primary sources of failure within HV systems [7]. This recognition led to substantial work on the design of stress-control components, which are essential for distributing the electric field uniformly within the joint and preventing localised overstressing [8]. The vulnerability of joints largely arises from material interfaces, where discontinuities in dielectric properties cause electric field concentration [9]. Non-uniform geometry and material interfaces create stress concentration zones that can initiate breakdown. Proper material selection and graded permittivity design can ensure uniform field distribution, preventing localised overstressing that leads to breakdown [8].
Among modern insulation materials, cross-linked polyethylene (XLPE) has become the industry standard due to its high electrical strength, thermal stability, and low dielectric losses [10]. However, XLPE is prone to water treeing in humid environments, a degradation mechanism that must be mitigated through proper joint design and material compatibility [11]. To overcome these limitations, alternative or complementary materials, such as ethylene propylene rubber (EPR) and silicone rubber, have been examined. Both materials exhibit high flexibility and resistance to environmental stress [12]. EPR provides improved elasticity and moisture resistance, making it suitable for cold-shrink and pre-moulded joints. In contrast, silicone rubber offers superior dielectric performance and high-temperature endurance, though at a higher cost [12,13].
2.3. Dielectric Properties of Insulation Materials
The electrical behaviours of insulation materials play a crucial role in determining the performance and reliability of high-voltage cable joints [14]. Understanding these properties helps in selecting materials that can operate safely under strong electric fields while minimising losses and preventing breakdown.
- (1)
- Dielectric Constant (εᵣ): The ratio of the material permittivity to the vacuum permittivity. Materials with higher εᵣ values show lower electric field stress under the same voltage, making them suitable for high-stress regions, like conductor interfaces [15,16];
- (2)
- Tan Delta (Tan δ) value: Also known as the dissipation factor, represents the phase angle between the capacitive and resistive components of the current through an insulating material [17]. It quantifies dielectric losses, the energy dissipated as heat due to imperfect insulation. A low tan δ value indicates low dielectric losses and good insulation quality, whereas a higher value signifies increased conduction or polarisation losses, often caused by moisture, contamination, or partial discharges [18];
- (3)
- Capacitance: Measured directly using the Schering Bridge, it enables the calculation of the relative permittivity and provides insight into the charge storage capability of the material;
- (4)
- Dielectric strength: The maximum electric field a material can withstand before breakdown, typically 10–30 kV/mm for solid insulators [19]. This property determines the safe operating voltage range.
The tan delta test remains one of the most reliable methods for assessing insulation performance in service [13]. A rising trend in the tan delta curve with increasing voltage is often associated with defects, moisture ingress, or partial discharges within the insulation [20]. Recent studies have combined partial discharge detection and loss-angle analysis to more accurately locate and characterise defects in complex joint structures [14]. Research highlights that reliable HV cable joint performance depends strongly on selecting materials with low tan delta values, suitable dielectric constants, and high resistances to electrical stress. While individual materials have been extensively characterised, the systematic comparison of material configurations and graded permittivity arrangements for optimising stress distribution in 33 kV cable joints remains incompletely addressed.
3. Methodology
3.1. Experimental Setup
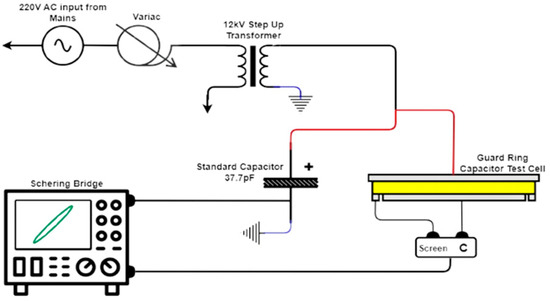
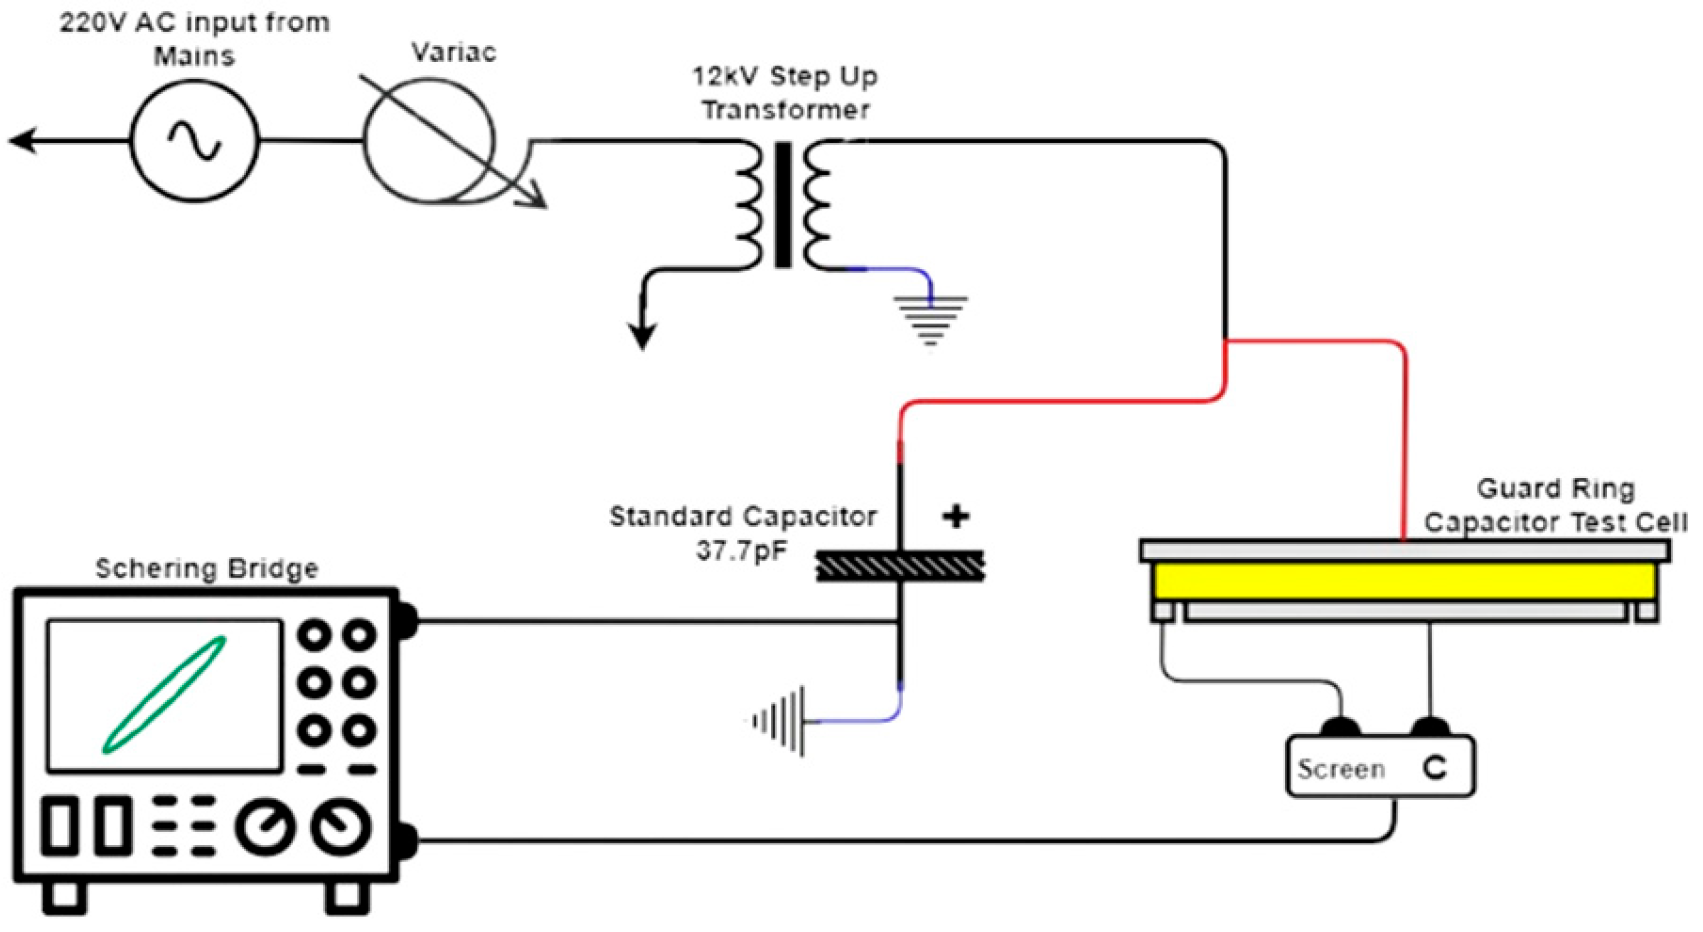
Dielectric properties of three insulation materials: PVC electrical tape, stress-grading mastic tape, and semiconductive rubber tape were measured using a Tettex Type 2811 Schering Bridge, which enables the accurate determination of Tan δ values and capacitances by comparing the impedance of a test sample against a 37.7 pF standard capacitor through AC bridge balancing. The experimental setup, shown in Figure 1, consisted of the Schering Bridge, a 12 kV step-up transformer, a variac, a detector unit, and a three-terminal test cell. All the components shared a common earth to eliminate leakage currents. The variac controlled the input voltage to the transformer, allowing gradual voltage increases during testing.
Figure 1.
Experimental setup circuit for dielectric property measurement using the Schering bridge.
3.2. Test Sample Preparation
Materials were stacked to an approximately 3.5 mm thickness to match the test cell geometry and ensure uniform field distribution. Single thin layers create air gaps that cause series capacitance effects and edge field distortion, invalidating permittivity measurements [16]. The required number of layers was calculated using datasheet permittivity values (PVC: εᵣ ≈ 3.0; Mastic: εᵣ ≈ 2.5; Rubber: εᵣ ≈ 5.0) and Equation (1). Table 1 presents the layer configuration and total thickness of the prepared insulation material samples.
Table 1.
Dominant arc types across materials and surface conditions.
Samples were cleaned to remove surface contaminants and moisture, which increase the dielectric losses and reduce the breakdown strength. Layers were compressed firmly to eliminate air voids.
3.3. Testing Procedure
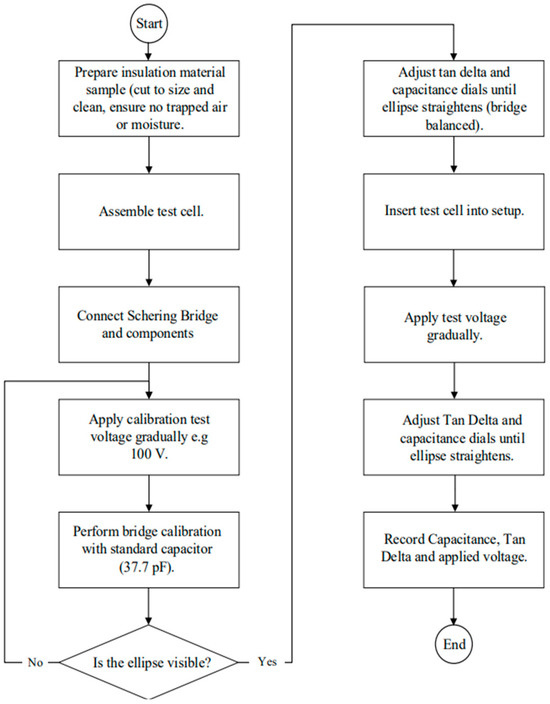
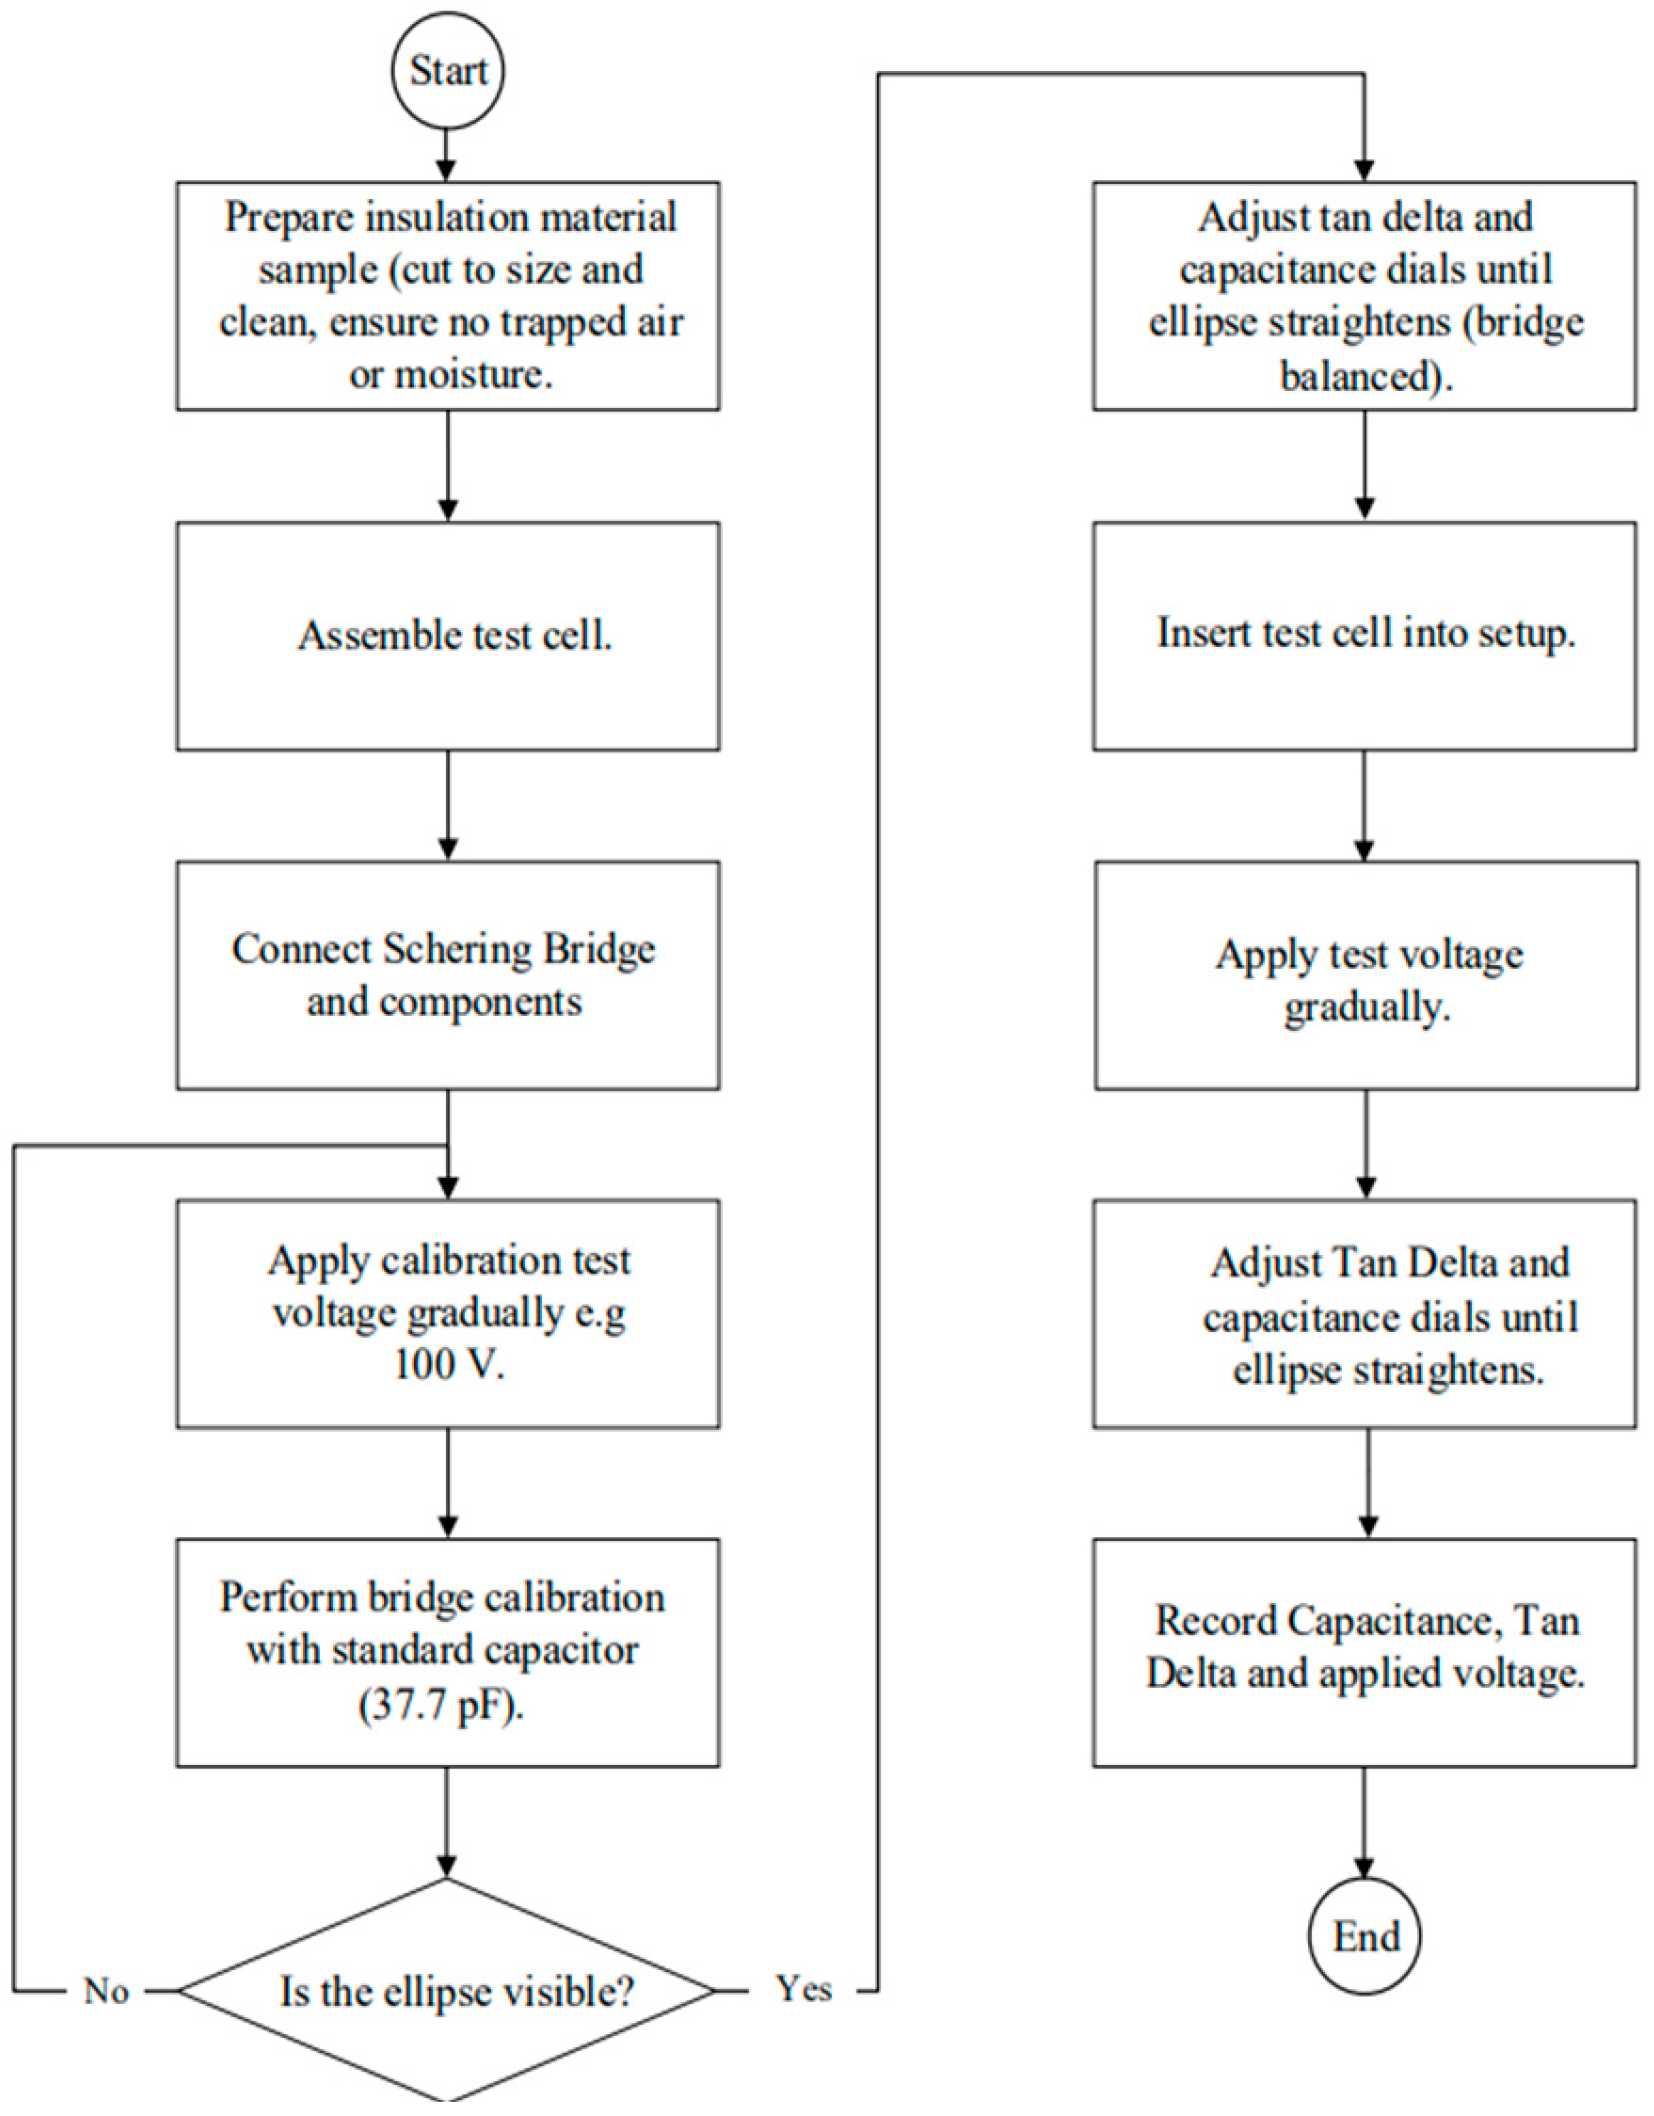
The testing sequence followed the steps summarised in Figure 2. Each sample was mounted in the test cell, and the voltage was increased gradually. The Schering bridge was balanced at each voltage step by adjusting the capacitance and loss factor dials, after which the tan δ and capacitance readings were recorded. The process was repeated until the sample reached the breakdown point or the maximum test voltage.
Figure 2.
Flowchart illustrating the experimental testing procedure.
3.4. Simulation Procedure
This simulation study aimed to identify the most suitable insulating materials and design a stress-control system for an HV cable joint. The primary goal was to redistribute electric field lines smoothly, reducing their concentration below the operational stress level of the cable’s insulation. The results indicate that semiconductive materials are crucial for effective stress grading, and materials with high relative permittivity are preferred for the base insulation. The simulations confirmed that the optimised joint designs maintain the maximum electric field stress below that of the normal cable.
3.4.1. Methodology and Simulation Details
The simulations and analysis were conducted using the following software:
- Altair Flux 2025.1: Used for the electrostatic simulation and solving of the electric field distribution;
- MATLAB R2025a: Used for plotting the resulting graphs and analysing data.
3.4.2. Defined Parameters and Materials
The simulation defined several key material parameters, including the relative permittivity, resistivity, tangent delta (tan δ) value, thermal conductivity, mass density, and volumetric heat capacity. The key insulating and grading materials selected for evaluation included:
- XLPE;
- Rubber splicing tape;
- ZnO nano-composite EPDM;
- Stress-grading mastic;
- Semiconductive tape;
- Semiconductive EPDM;
- PVC compound;
- PVC;
- Non-linear resistive silicon rubber ZnO;
- EPR self-amalgamating tape;
- Carbon-black-filled polymer tape or mastic.
4. Results and Analysis
4.1. Experimental
The dielectric properties of three insulation materials were measured using a Schering Bridge at voltages ranging from 500 V to the breakdown point. Table 2 presents the measured capacitances, tan delta values, and calculated relative permittivities at each voltage step. The relative permittivity was calculated as shown in Equation (2):
where
- Cₓ is the measured capacitance;
- C0 is the air capacitance of the test cell, given by (3):
- ε0 = 8.854 × 10⁻¹² F/m;
- A = 0.020106 m2;
- d = sample thickness.
All three materials demonstrated good insulation quality, with tan delta values remaining below 0.002 throughout testing, well within the acceptable threshold of 0.01. This indicates low dielectric losses and minimal energy dissipation. Increasing trends in the capacitance and relative permittivity were observed with rising voltage for all the materials, indicating field-dependent polarisation behaviour. The semiconductive rubber showed the largest variation (33%) increase, followed by mastic (15%) and PVC (11%). Breakdown testing revealed distinct performance characteristics. The semiconductive rubber withstood the highest voltage of 3700 V, demonstrating superior dielectric strength with the highest permittivities (5.07–6.68). The mastic exhibited the lowest breakdown voltage at 1350 V with the lowest permittivities, from 2.66 to 3.06, while PVC showed intermediate performance at 2240 V, with permittivities ranging from 2.96 to 3.28. These results indicate that each material offers different advantages for stress-control applications.
The rubber tape and PVC consistently showed the lowest tan δ values, indicating the least energy losses and best dielectric efficiencies. The mastic started close to PVC, but its tan δ value increased more sharply with increasing voltage, showing higher sensitivity to electrical stress. Therefore, the rubber and PVC are the most electrically efficient materials under the tested conditions.
4.2. Simulations
The simulations are performed in three critical scenarios, which are on a bare cable joint with no insulation, a cable joint with only one base insulation, and a cable joint with a stacked (layered) insulation profile to grade the stress across the joint. The arrangement of materials in cable joint is given in Table 3 and Table 4. The HV cable dimensions were adopted from the M-tec datasheet.
Table 2.
Measured dielectric properties at varying voltages.
Table 3.
Layer configuration and total thickness of prepared insulation material samples in cable joint [21].
4.2.1. Bare Straight HV Cable Joint Simulation
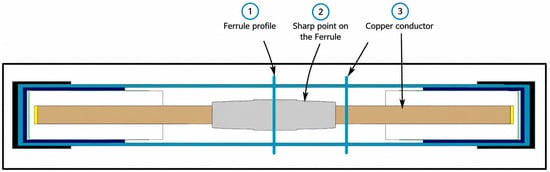
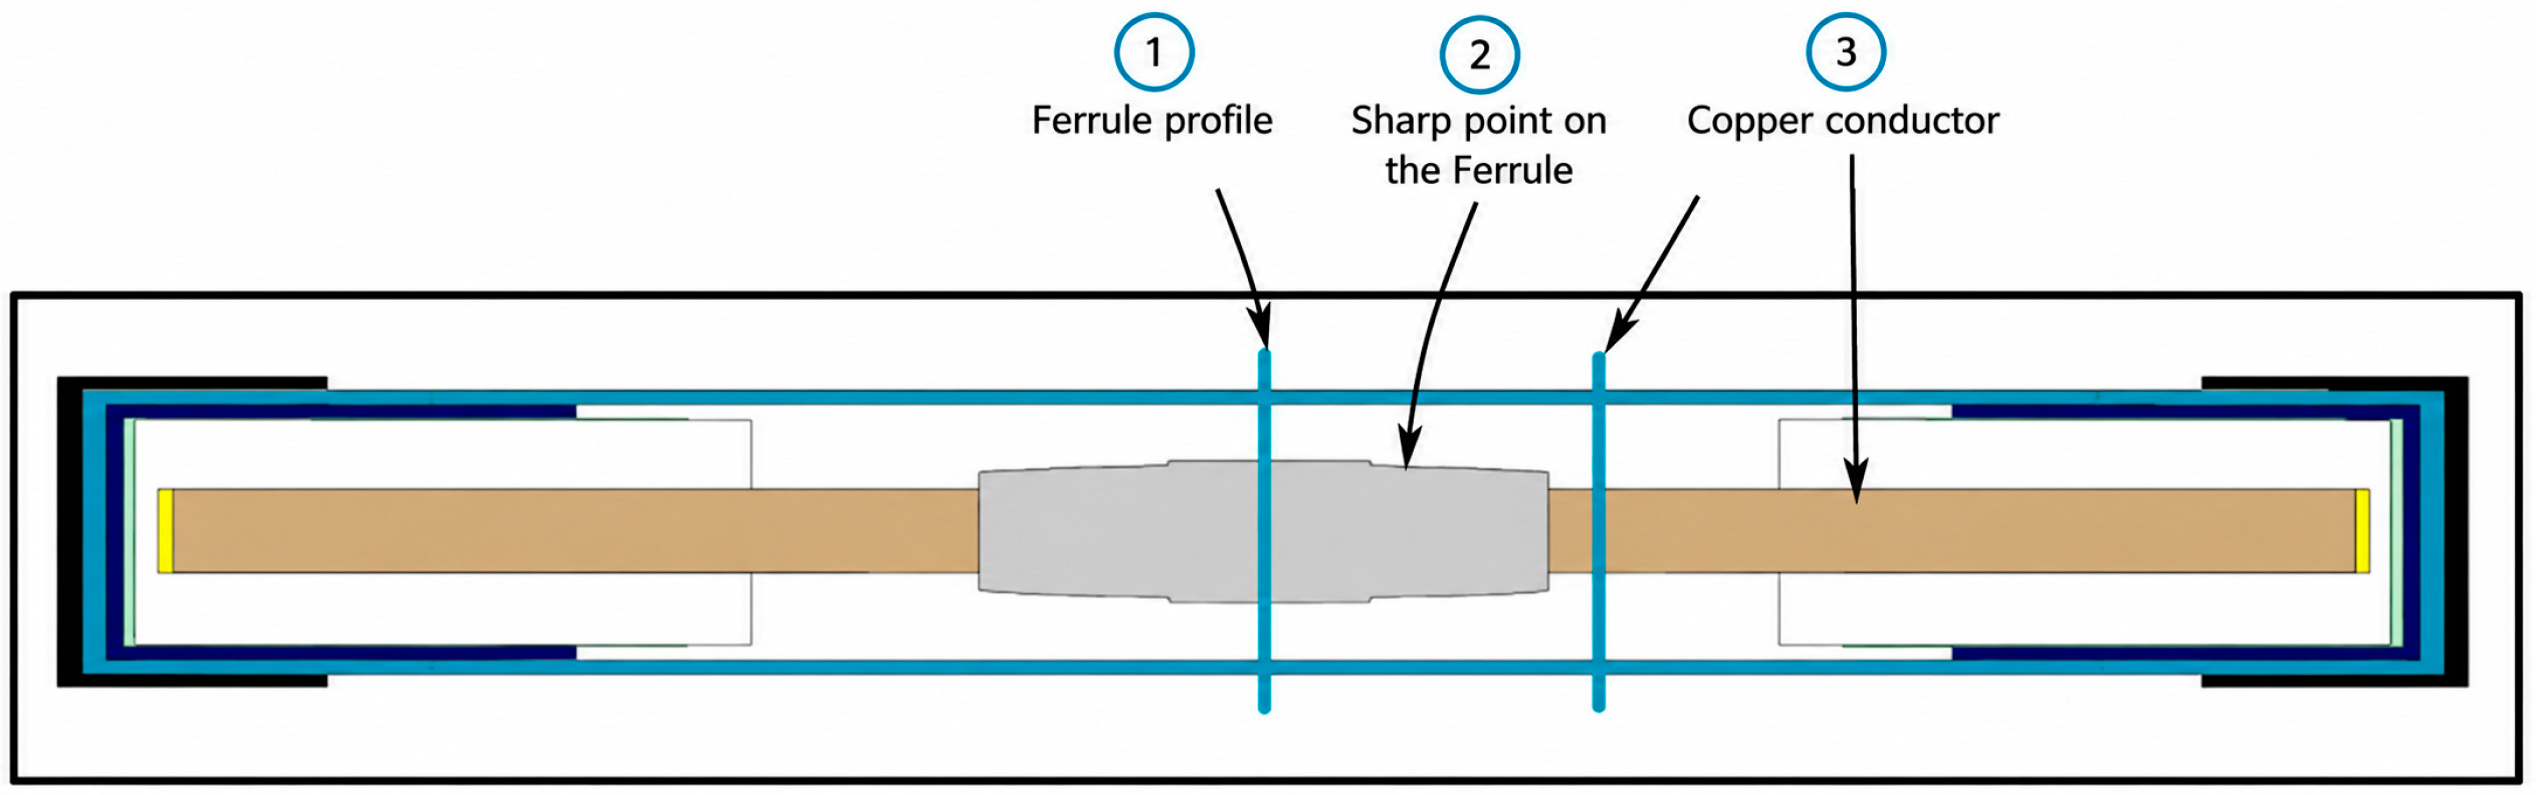
To understand the impact of the electric field in a cable joint, the electric field profile across a cable joint with no insulation is studied, as shown in Figure 3. The vertical probes in which the electric field profile across a joint is measured are clearly depicted in the figure with the appropriate labelling.
Figure 3.
Straight cable joint simulation with no insulation to study the electric field profile across the joint.
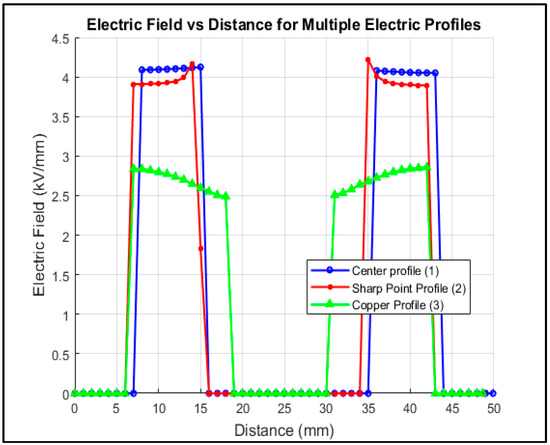
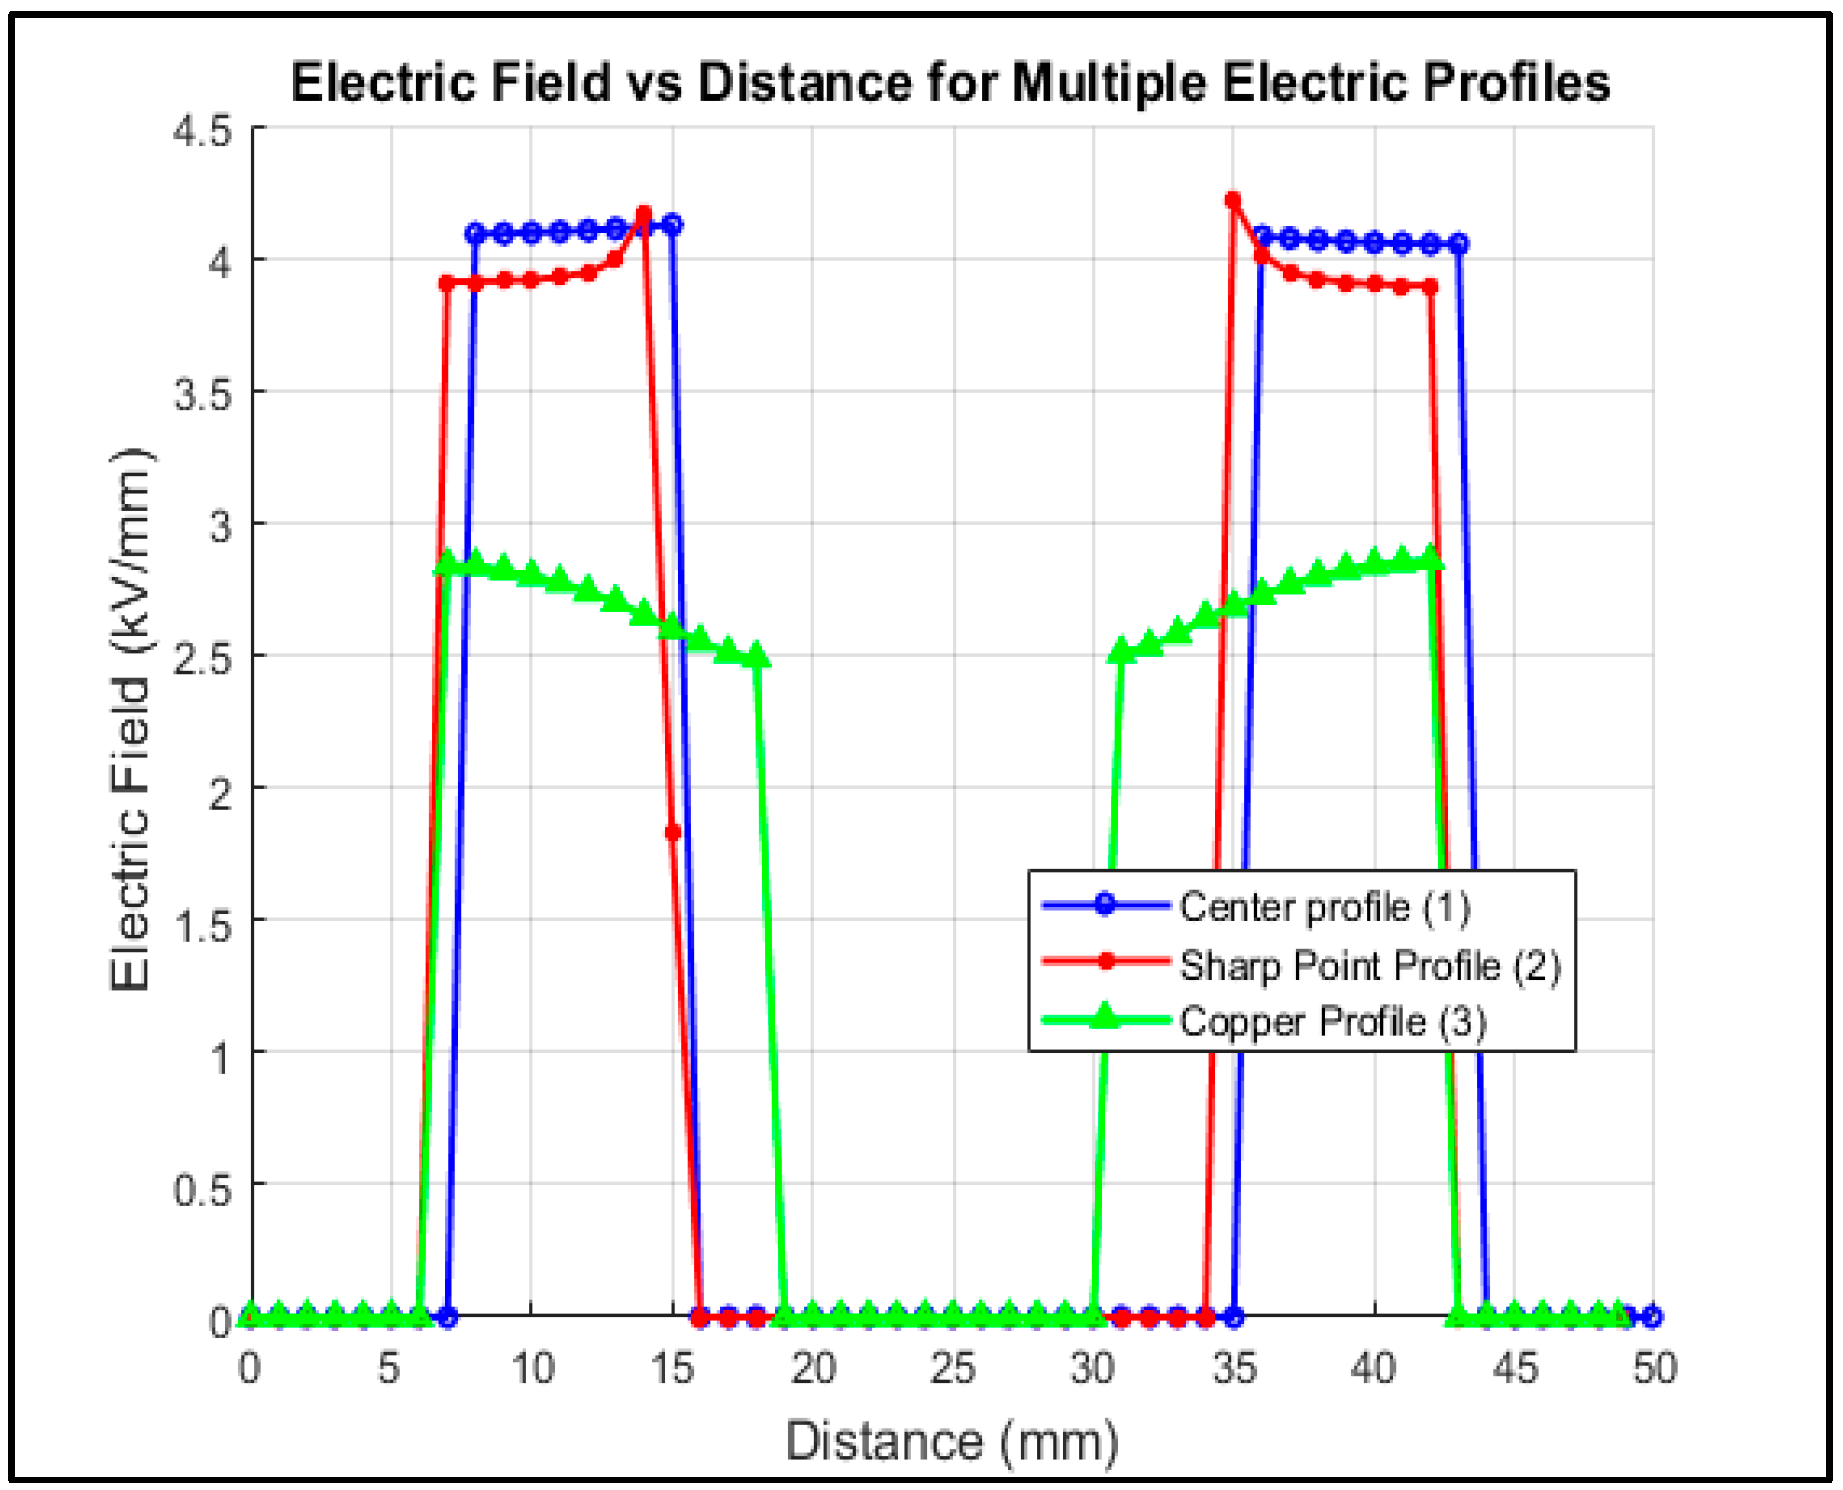
The sections where the electric field is studied are mainly at the centre of the cable joint, at the sharp point where scrimping is performed on a connector/ferrule, and at the exposed copper conductor (core). Figure 4 depicts the electric field profiles of a bare copper conductor at the above-mentioned three critical points. The electric field profiles are relatively higher at the sharp points of the ferrule connector. The maximum electric fields are 4.2 kV/mm, 4.3 kV/mm, and 3.8 kV/mm at profiles 1, 2, and 3, respectively.
Figure 4.
Electric field profiles at three crucial points in a bare HV cable joint.
4.2.2. Bare HV Cable Joint Simulation with a Typical Joint Geometry
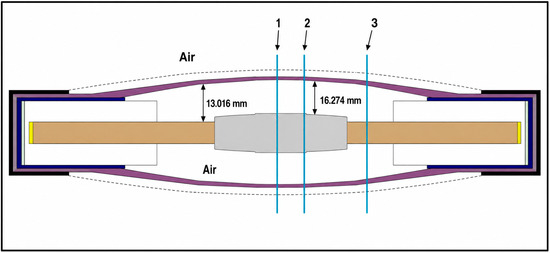
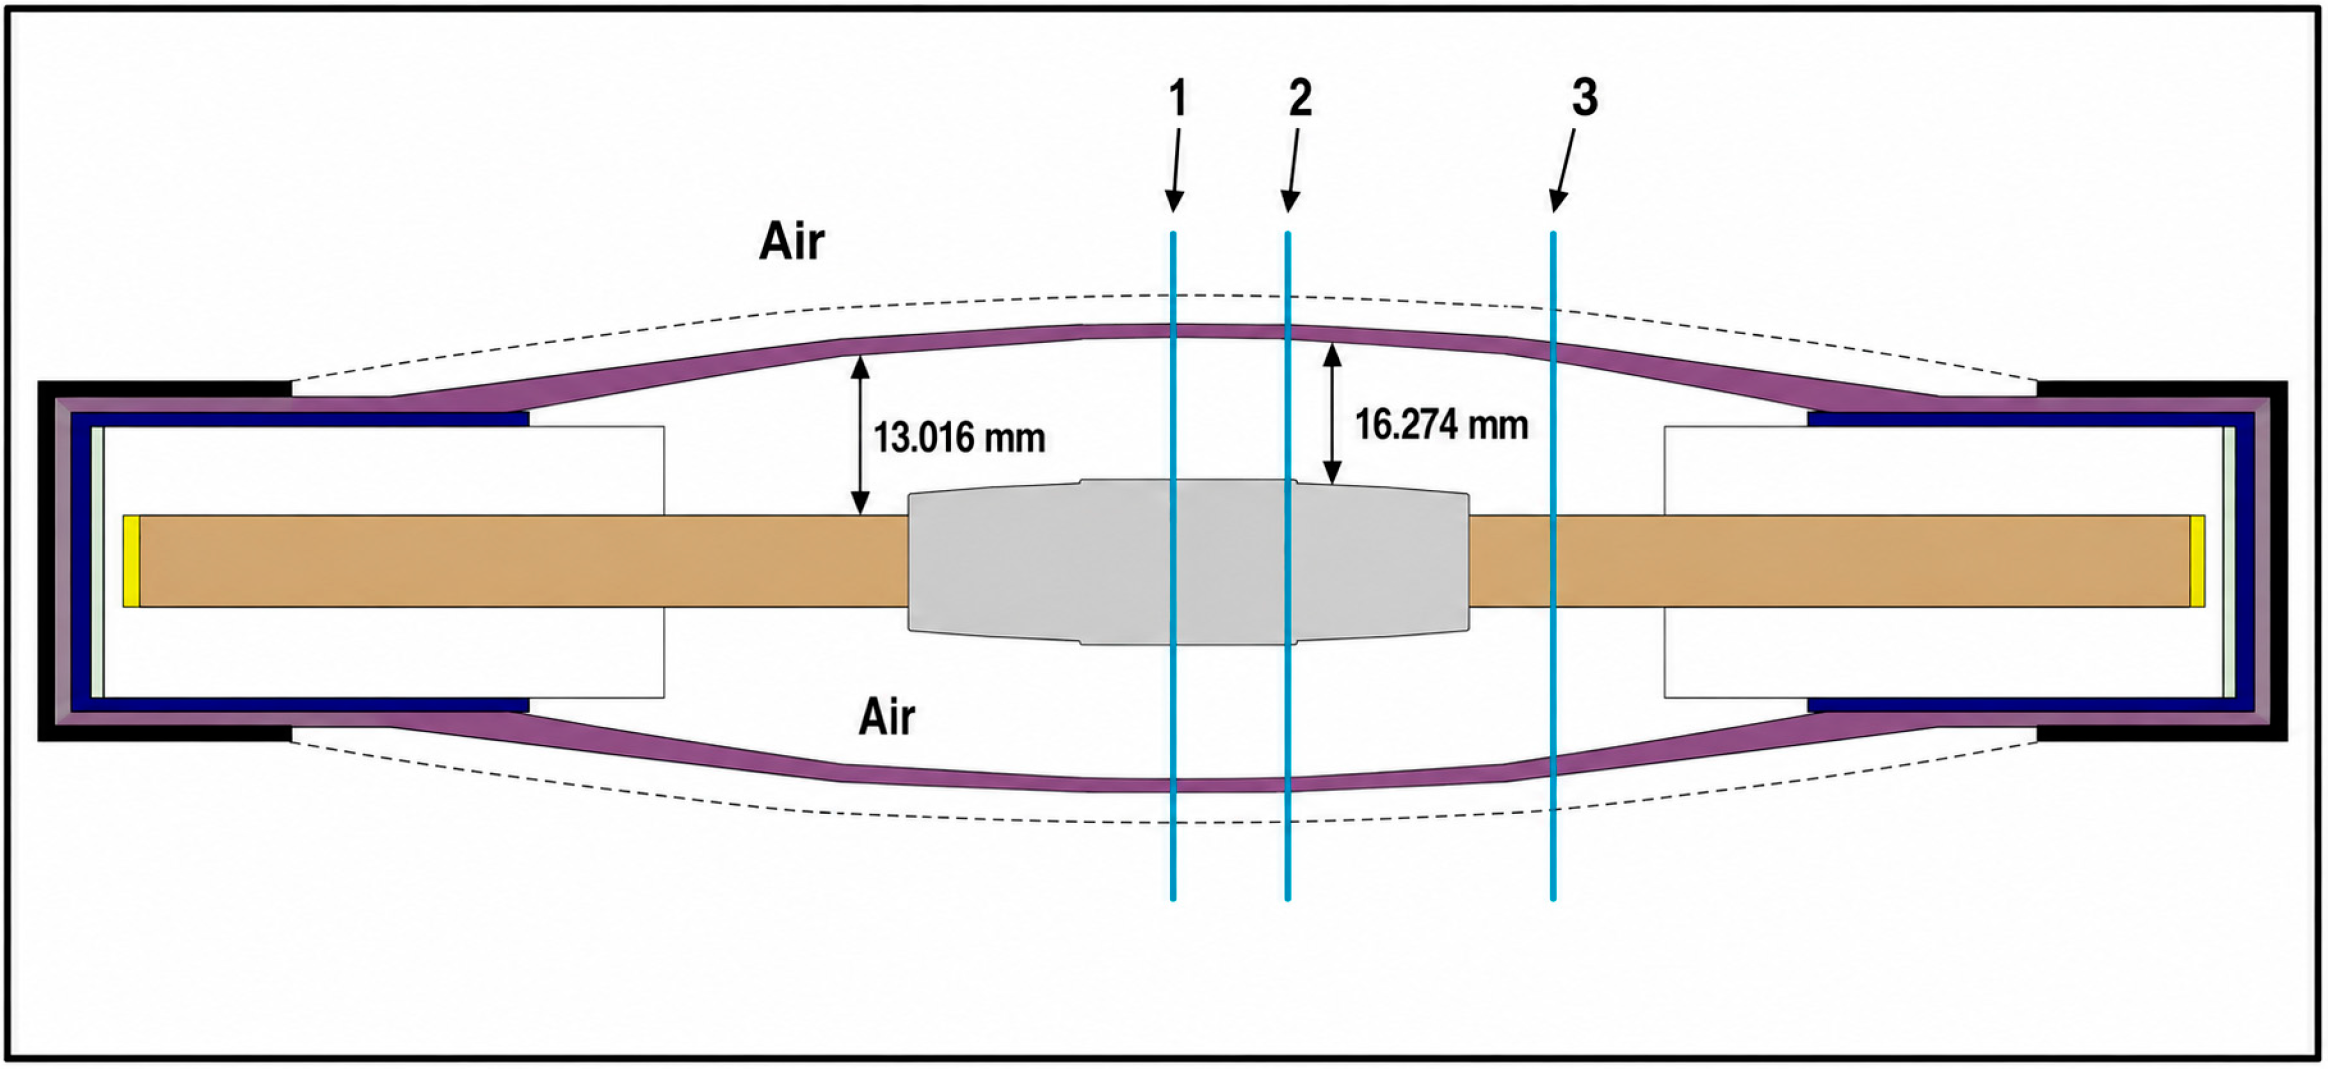
To better understand the electric field on a bare cable joint with a typical cable joint geometry, a simulation was performed, and the results are shown in Figure 5. The dimensions of the cable joint are also shown in Figure 5, with the closest distance from the conductor to the Earth being 16.274 mm.
Figure 5.
Simulation of a bare HV cable joint with a typical cable joint geometry to study the electric field distribution. The cross-sections 1,2 & 3 are same as Figure 3.
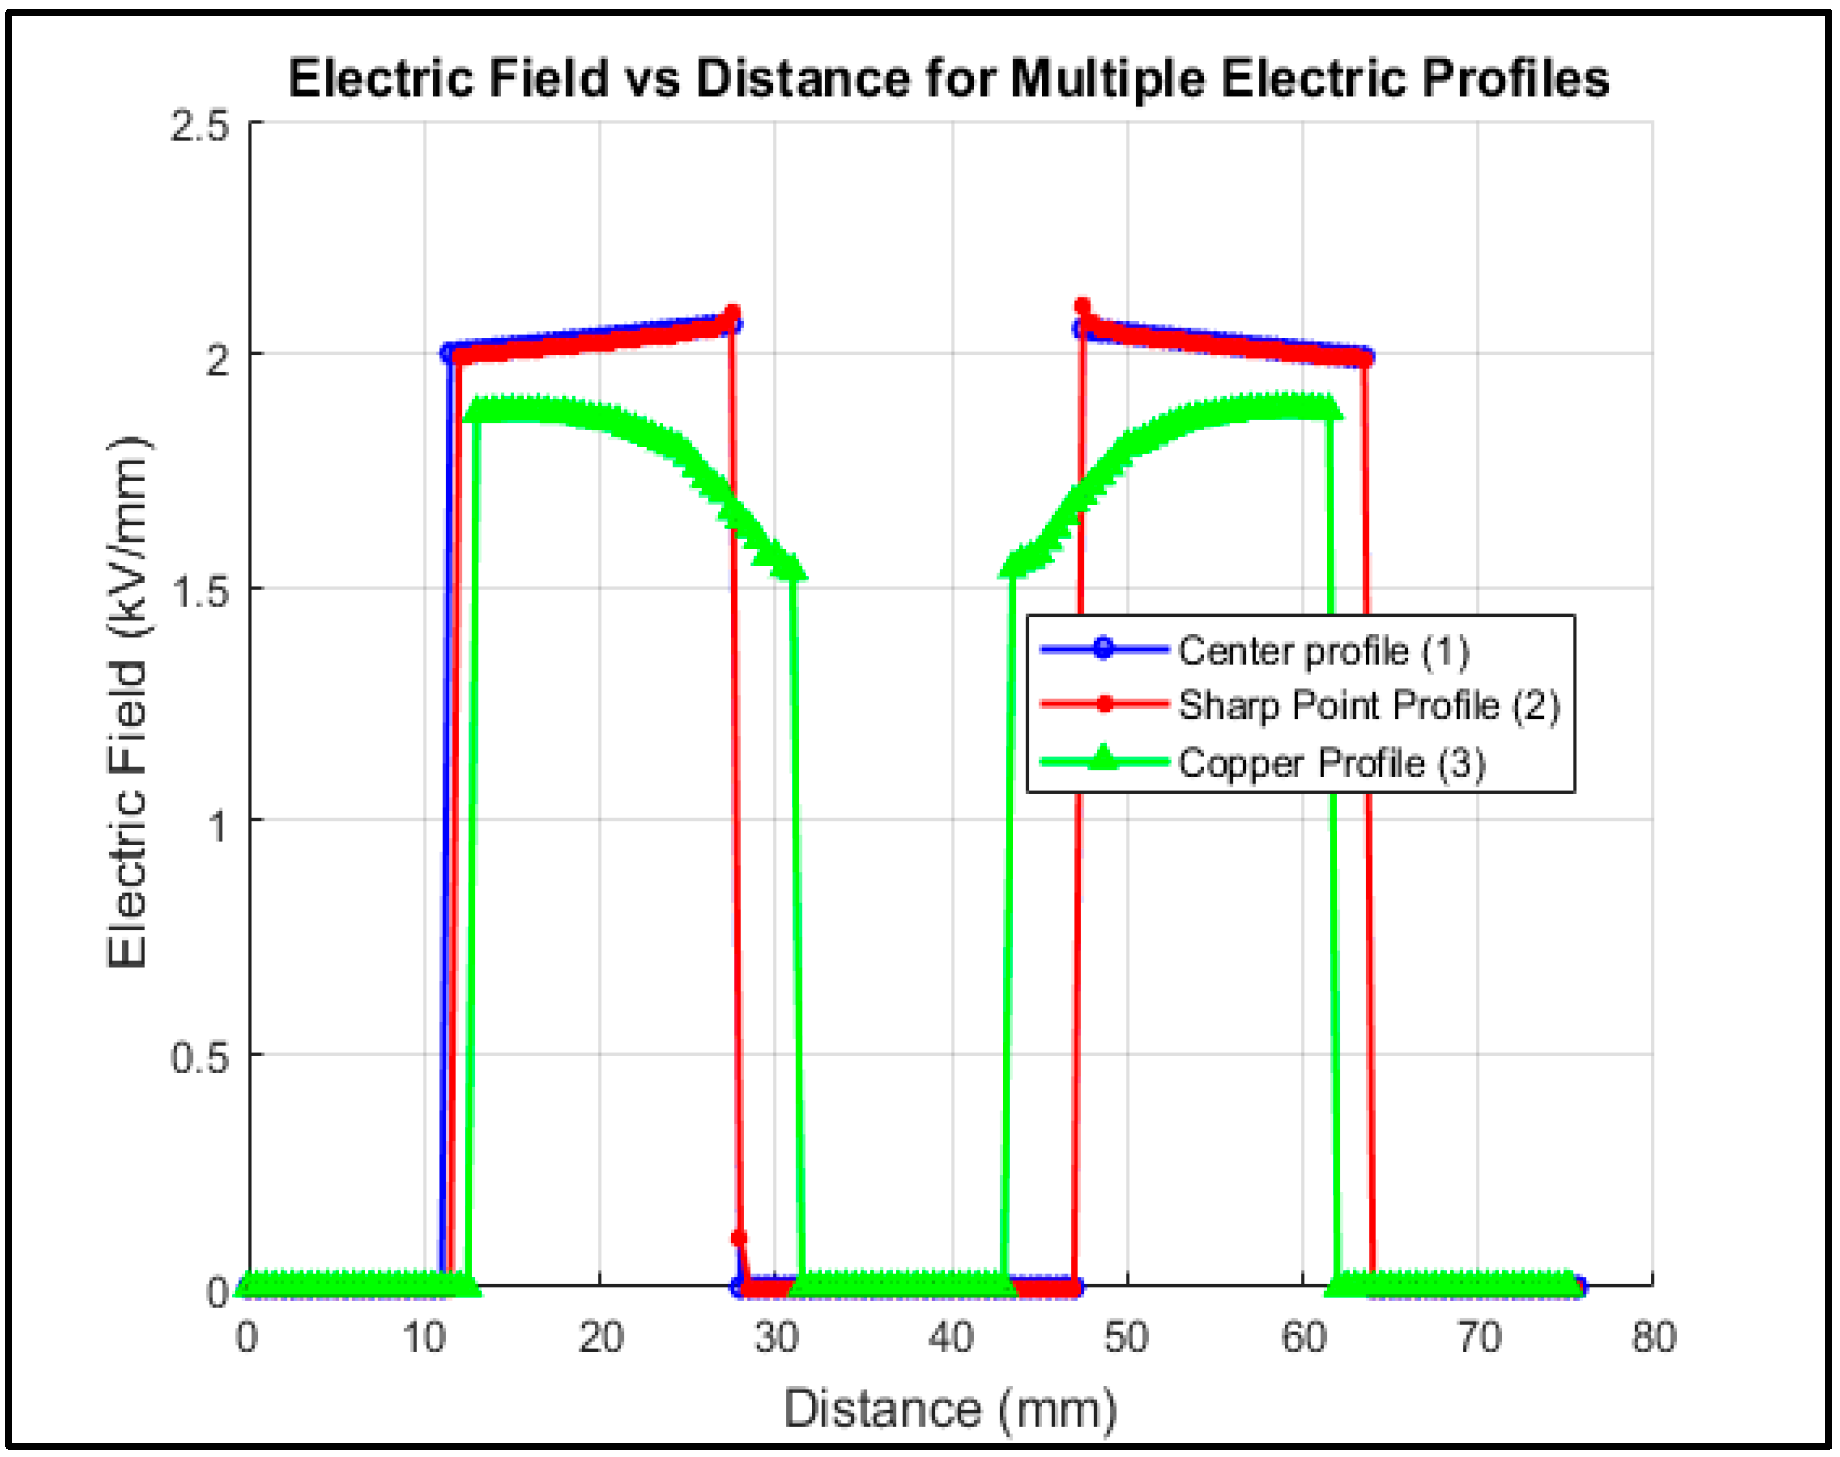
The electric field distribution across an HV joint with a typical cable joint geometry shows a reduced electric field across the three critical vertical measured sections 1, 2 & 3. In Figure 6, the electric field is below 2.2 kV/mm across all the measured vertical sections of the joint. This finding shows that the electric field is inversely proportional to the distance; thus, it is crucial to consider the distance between the high-potential conductor and the Earth. Equation 4, below, aligns with the above-mentioned explanation.
where and are the inner and outer radii, respectively. This equation explains why a larger joint diameter or radius reduces the electric field stress, which is why cable joints appear thicker than the overall cable.
Figure 6.
Simulation results for a bare HV cable joint with a typical cable joint geometry to study the electric field distribution.
4.2.3. Simulation of a Cable Joint with an Individual Insulating Material
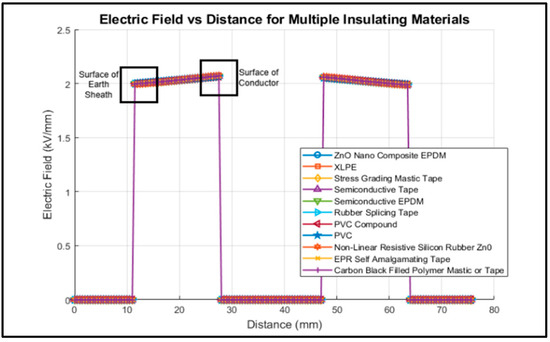
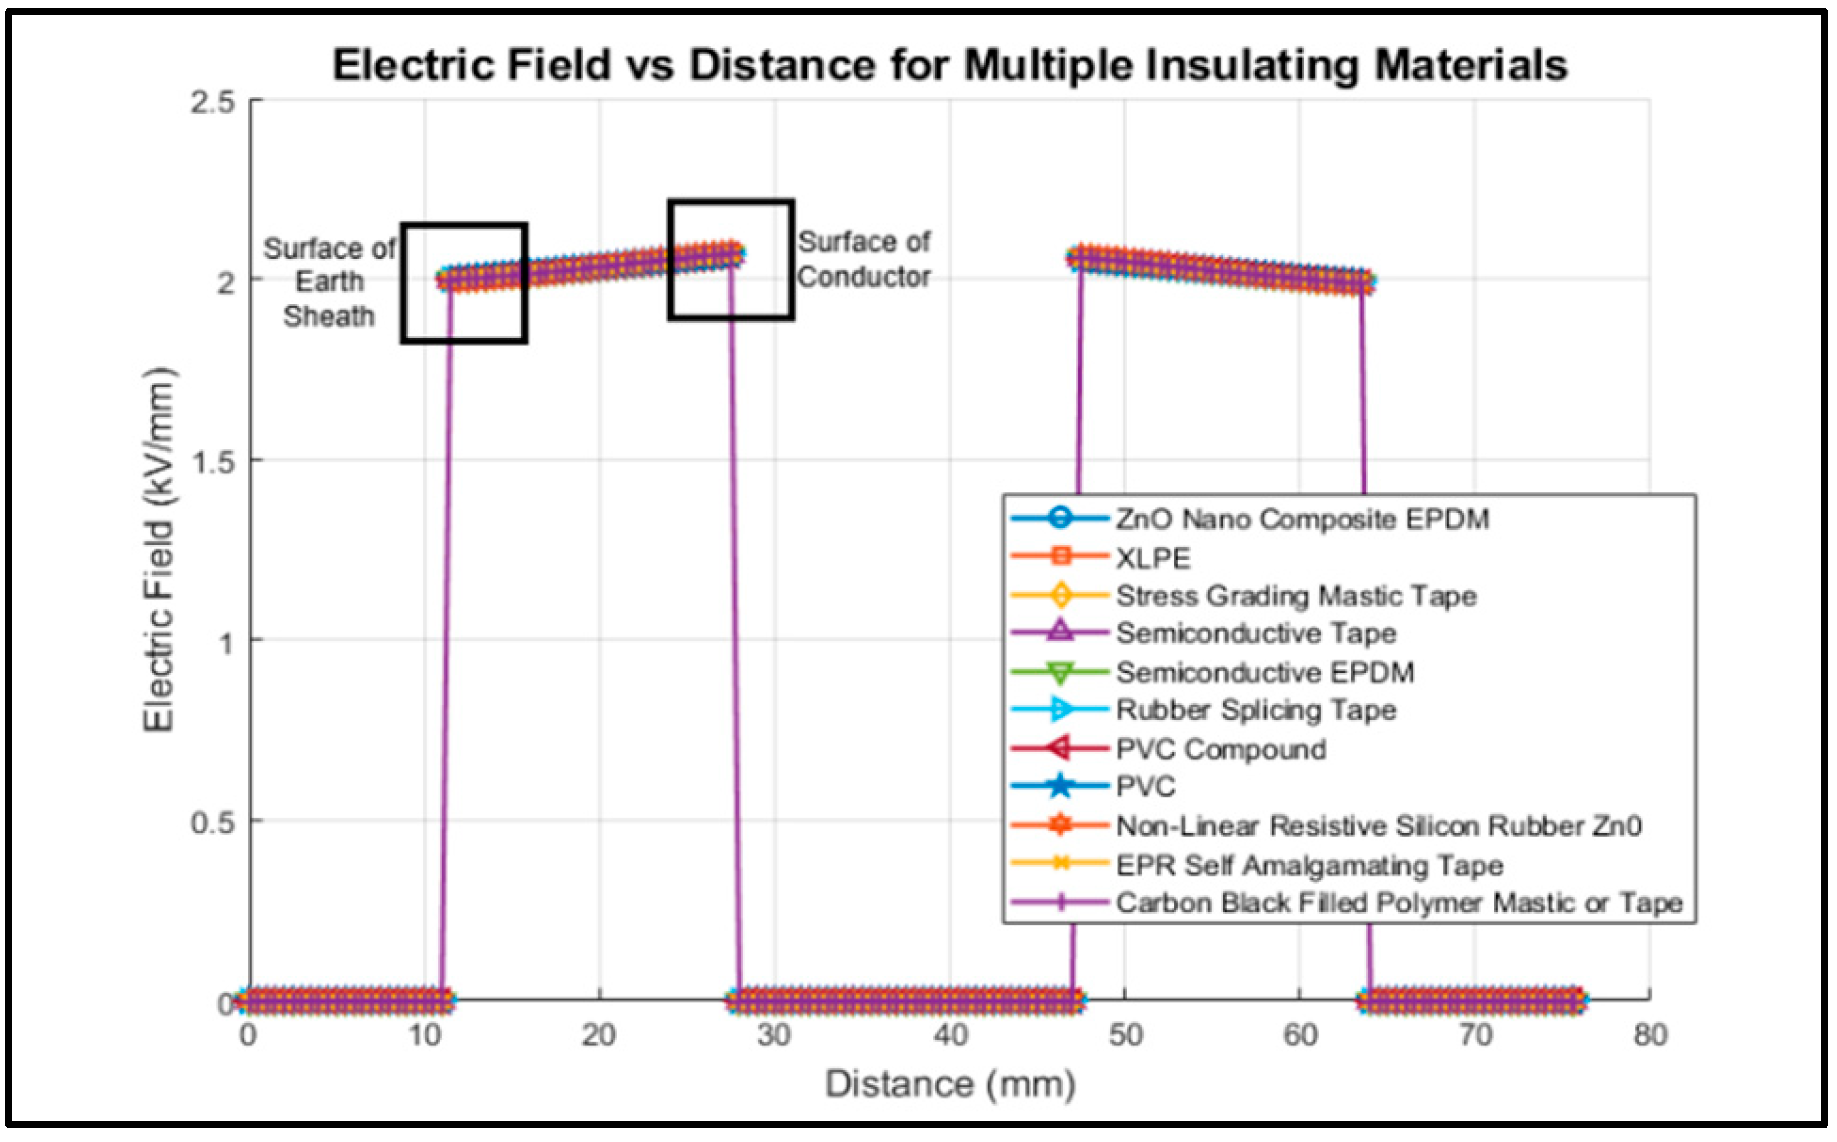
A simulation like the one described in Figure 5 was performed for individual insulation materials described in Section 3, subsection C, instead of a simulation with a bare joint (air). The electric field plot for multiple insulating materials is shown in Figure 7. At first, it is difficult to see and understand the difference in performance among these insulating materials. Important sections of the plots, namely, “surface of earth sheath” and “surface of conductor”, are enhanced to understand the correlation and the difference in the ability to control the stresses of the materials, as shown in Figure 7.
Figure 7.
Plots of electric fields for multiple insulations across the centre of the aluminium connector/ferrule of the HV cable joint model.
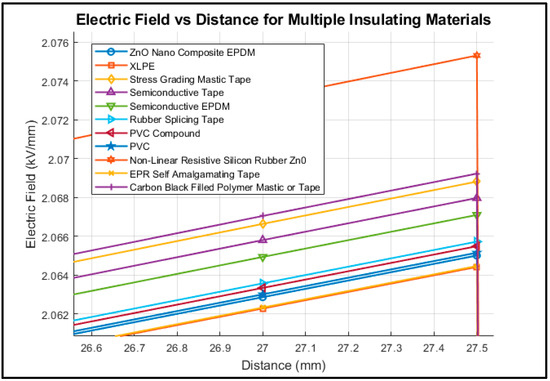
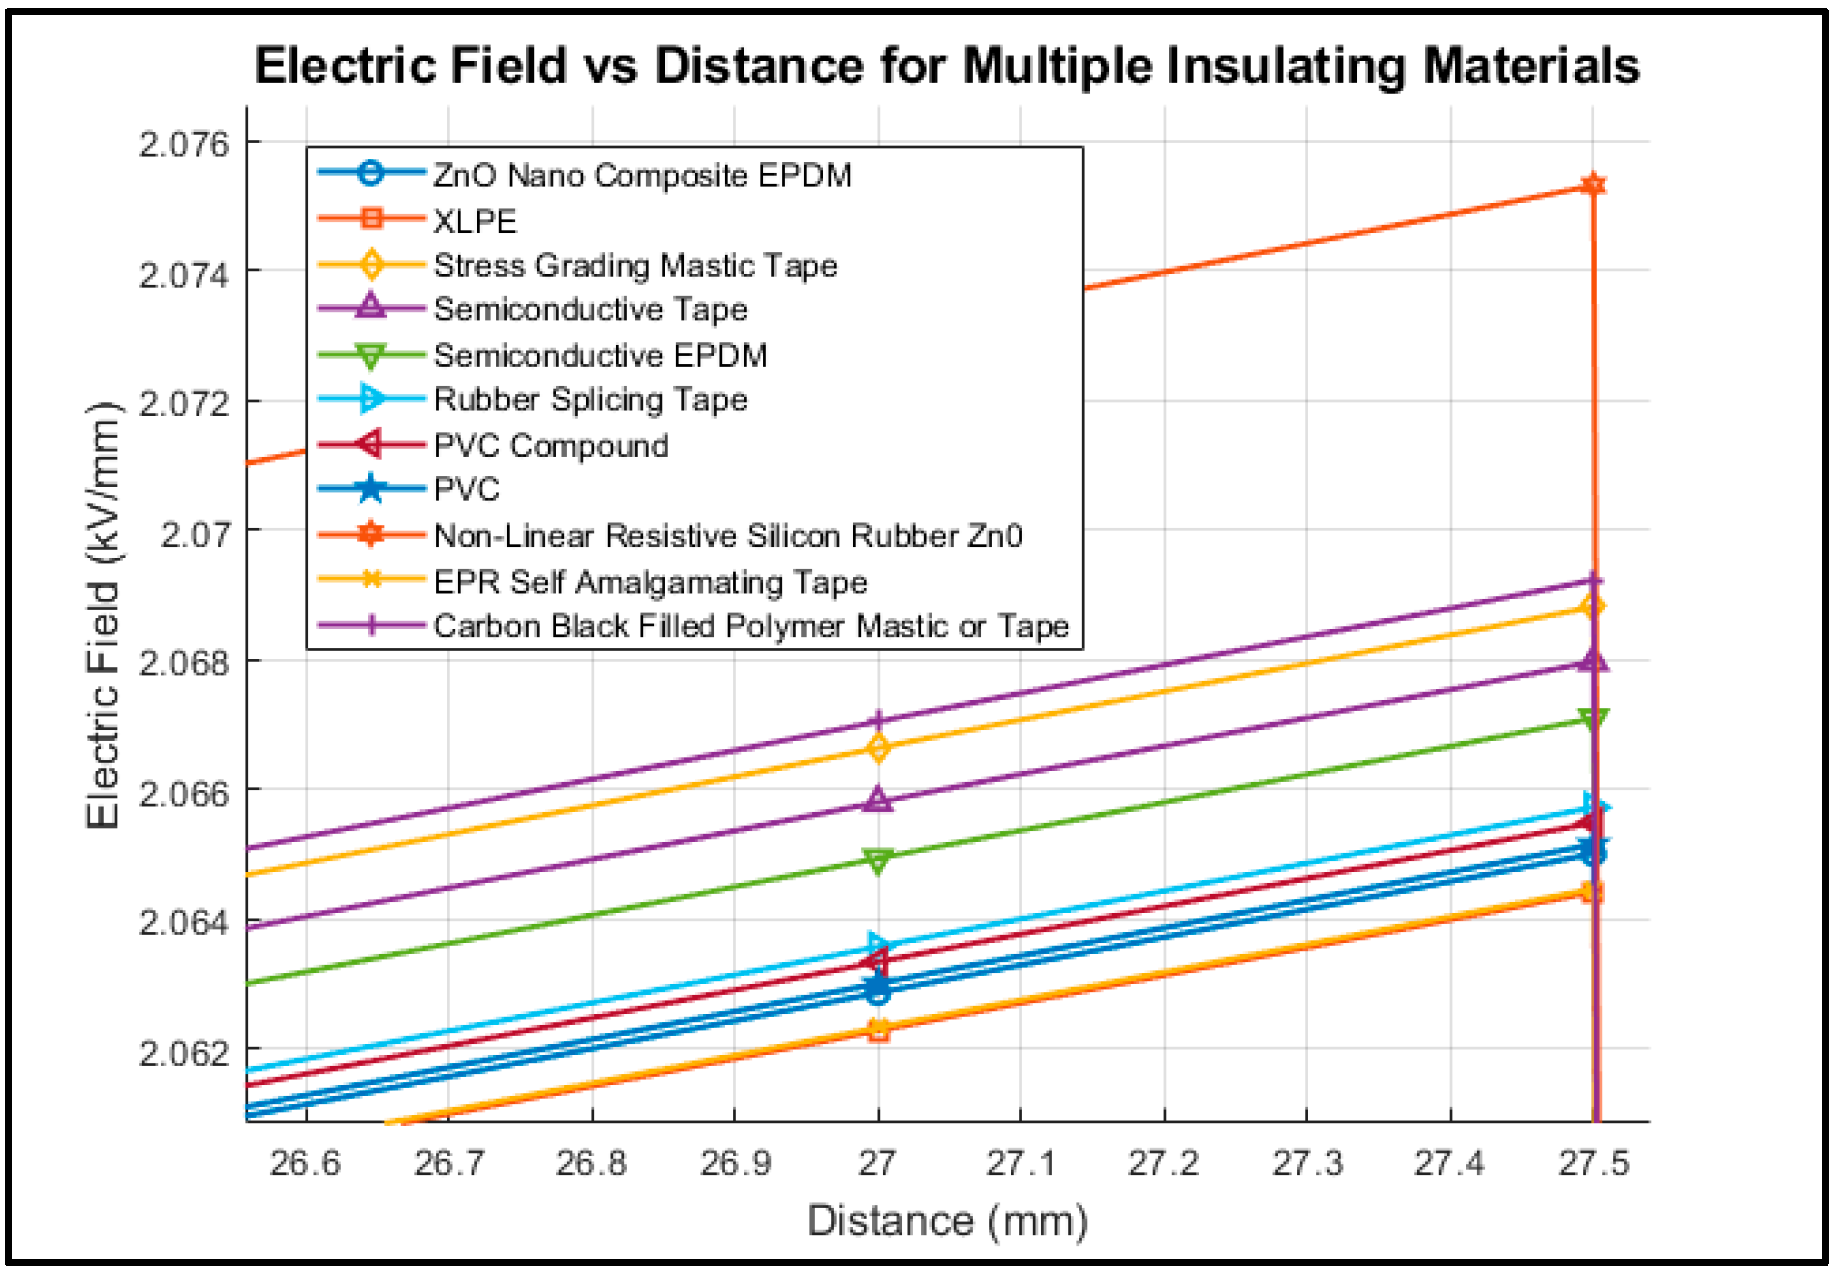
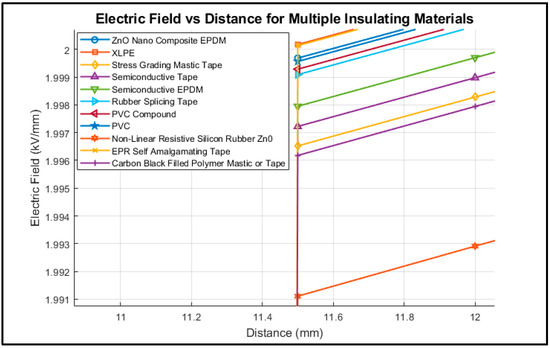
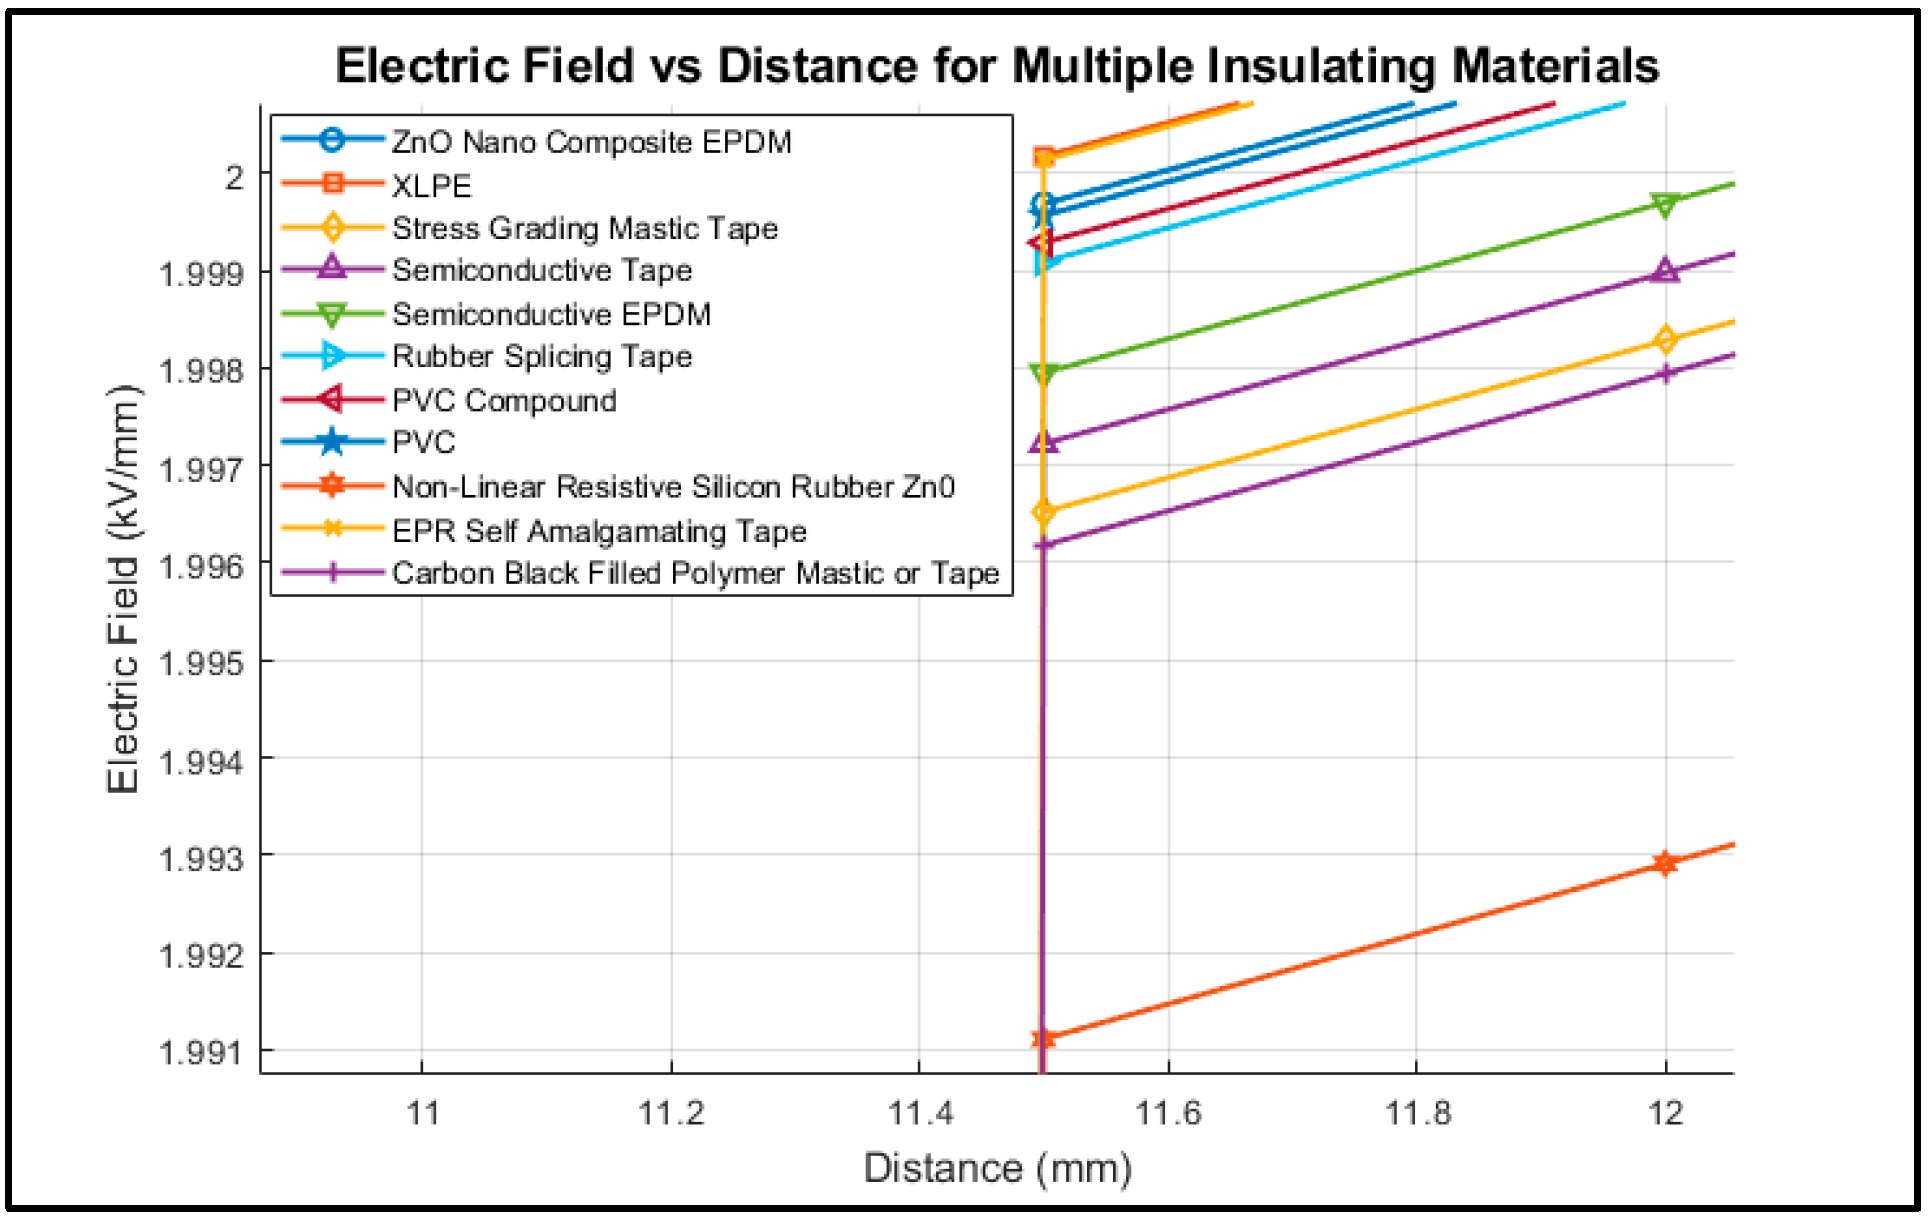
Figure 8 shows the enhanced section of the electric field profiles across the centre of the cable joint on the “surface of conductor” and described in Figure 7 above. The non-linear resistive silicon rubber–ZnO behaves as a better material for a cable joint because it does not immediately reducie the electric field to its minimal values. This shows that it is a semiconductive material property. Similar behaviour is followed by carbon-black-filled polymer mastic or tape, stress-grading mastic tape, also a semiconductive tape, and a semiconductive EPDM, as shown in Figure 8.
Figure 8.
Electric field profiles of individual materials on the surface of a high-potential conductor in a cable joint.
Table 4, below, shows the rankings of the materials with good electric field performances when applied on the surface of the conductor.
Table 4.
Materials with high electric field performances for HV cable joint insulation.
To understand the importance of stress grading in a cable joint, Figure 9 depicts the electric field profiles for the same materials as those in Figure 8 but when used on the surface of the Earth electrode. The electric field profiles on the surface of the Earth electrode/sheath seem to be the opposite of the surface of the high-potential conductor.
Figure 9.
Electric field profiles of individual materials on the surface of the Earth electrode in a cable joint.
The non-linear resistive silicon rubber (ZnO based) exhibited the lowest electric field stress, followed in performance by the carbon-black-filled polymer mastic or tape, the stress-grading mastic tape, the semiconductive tape, and, finally, the semiconductive EPDM. This trend confirms that the electric field is progressively reduced from the high-potential conductor surface toward the Earth electrode. Gradual electric field grading is essential for reliable insulation performance in HV cable joints.
Based on the simulation results, the materials arrangement in Table 3 and subsequently in Table 4 are the most suitable for application in HV cable joints. Their selection is supported by their superior ability to control and redistribute the electric field stresses within the joint. Among these, the non-linear resistive silicon rubber (ZnO) exhibited the most effective electric field control, demonstrating exceptional performance in suppressing high electric stress concentrations and ensuring a more uniform field distribution in the joint.
4.2.4. Simulation of a Cable Joint with Multiple Layers of Insulating Materials
To better understand the impact and efficiency of stacking insulating materials to grade the electric field stresses, a simulation based on Figure 10, was performed.
Figure 10.
Simulation arrangement of a cable with multiple insulating materials layers to understand the electric field distribution in a multi-layered insulation cable joint.
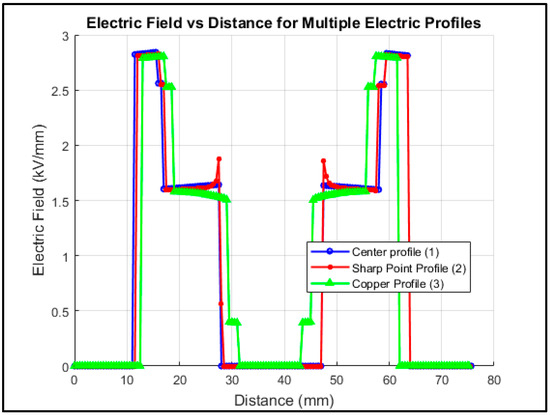
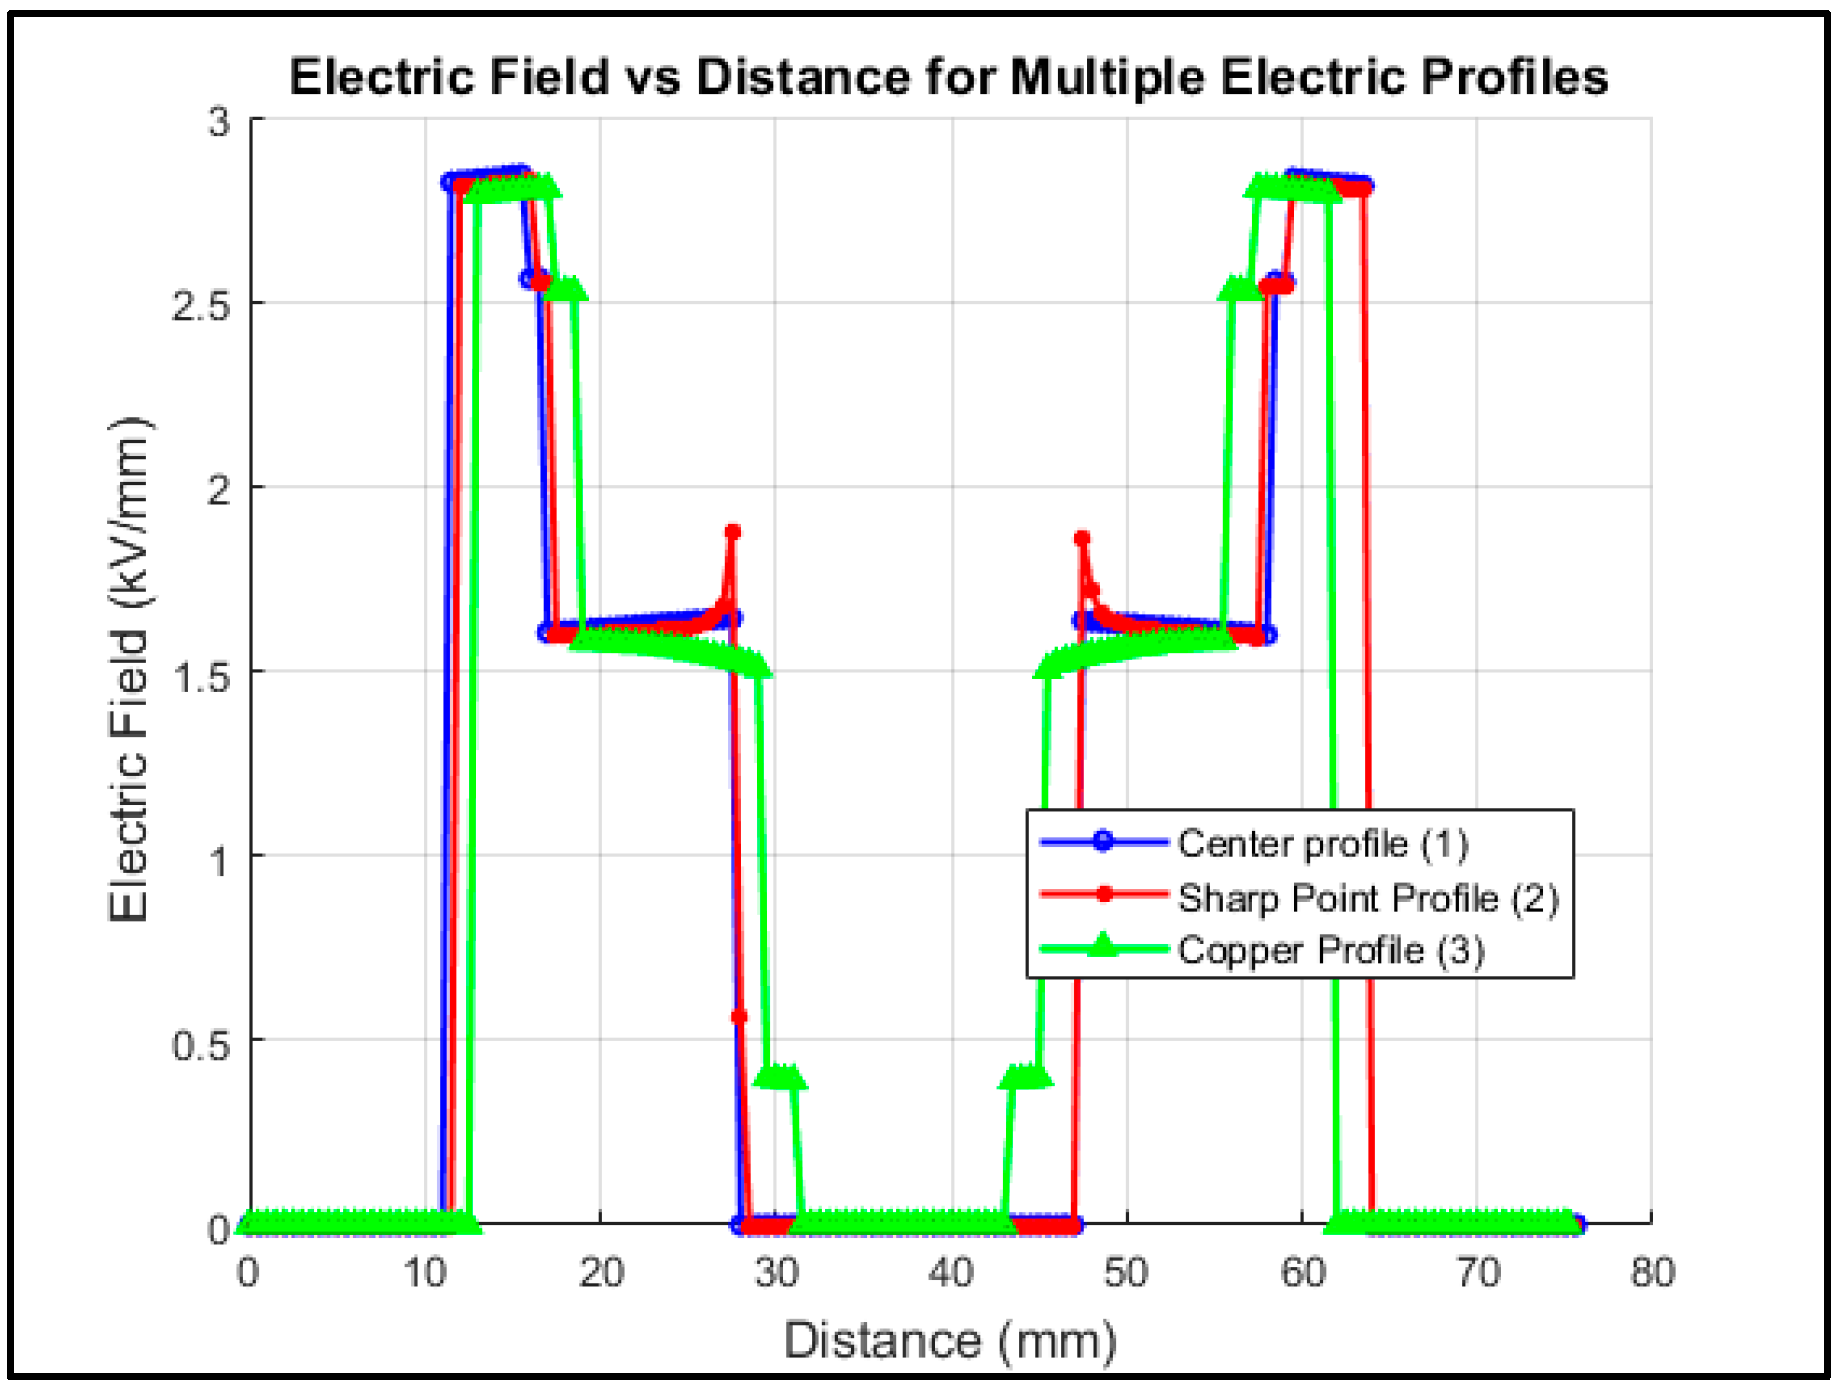
Figure 11 depicts the electric field distribution across the cable joint with multiple insulating material layers. The maximum electric field at three points in the joint is 2.83 kV.
Figure 11.
Electric field profile of a typical HV cable joint with multiple layers of insulating materials.
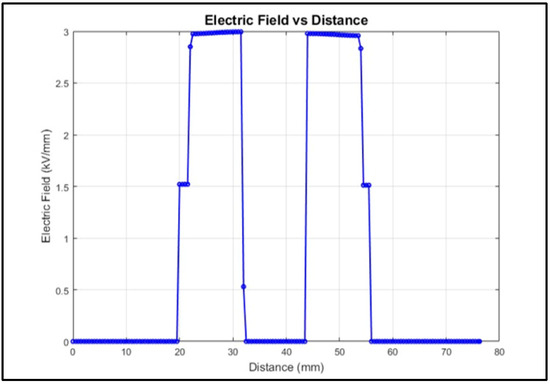
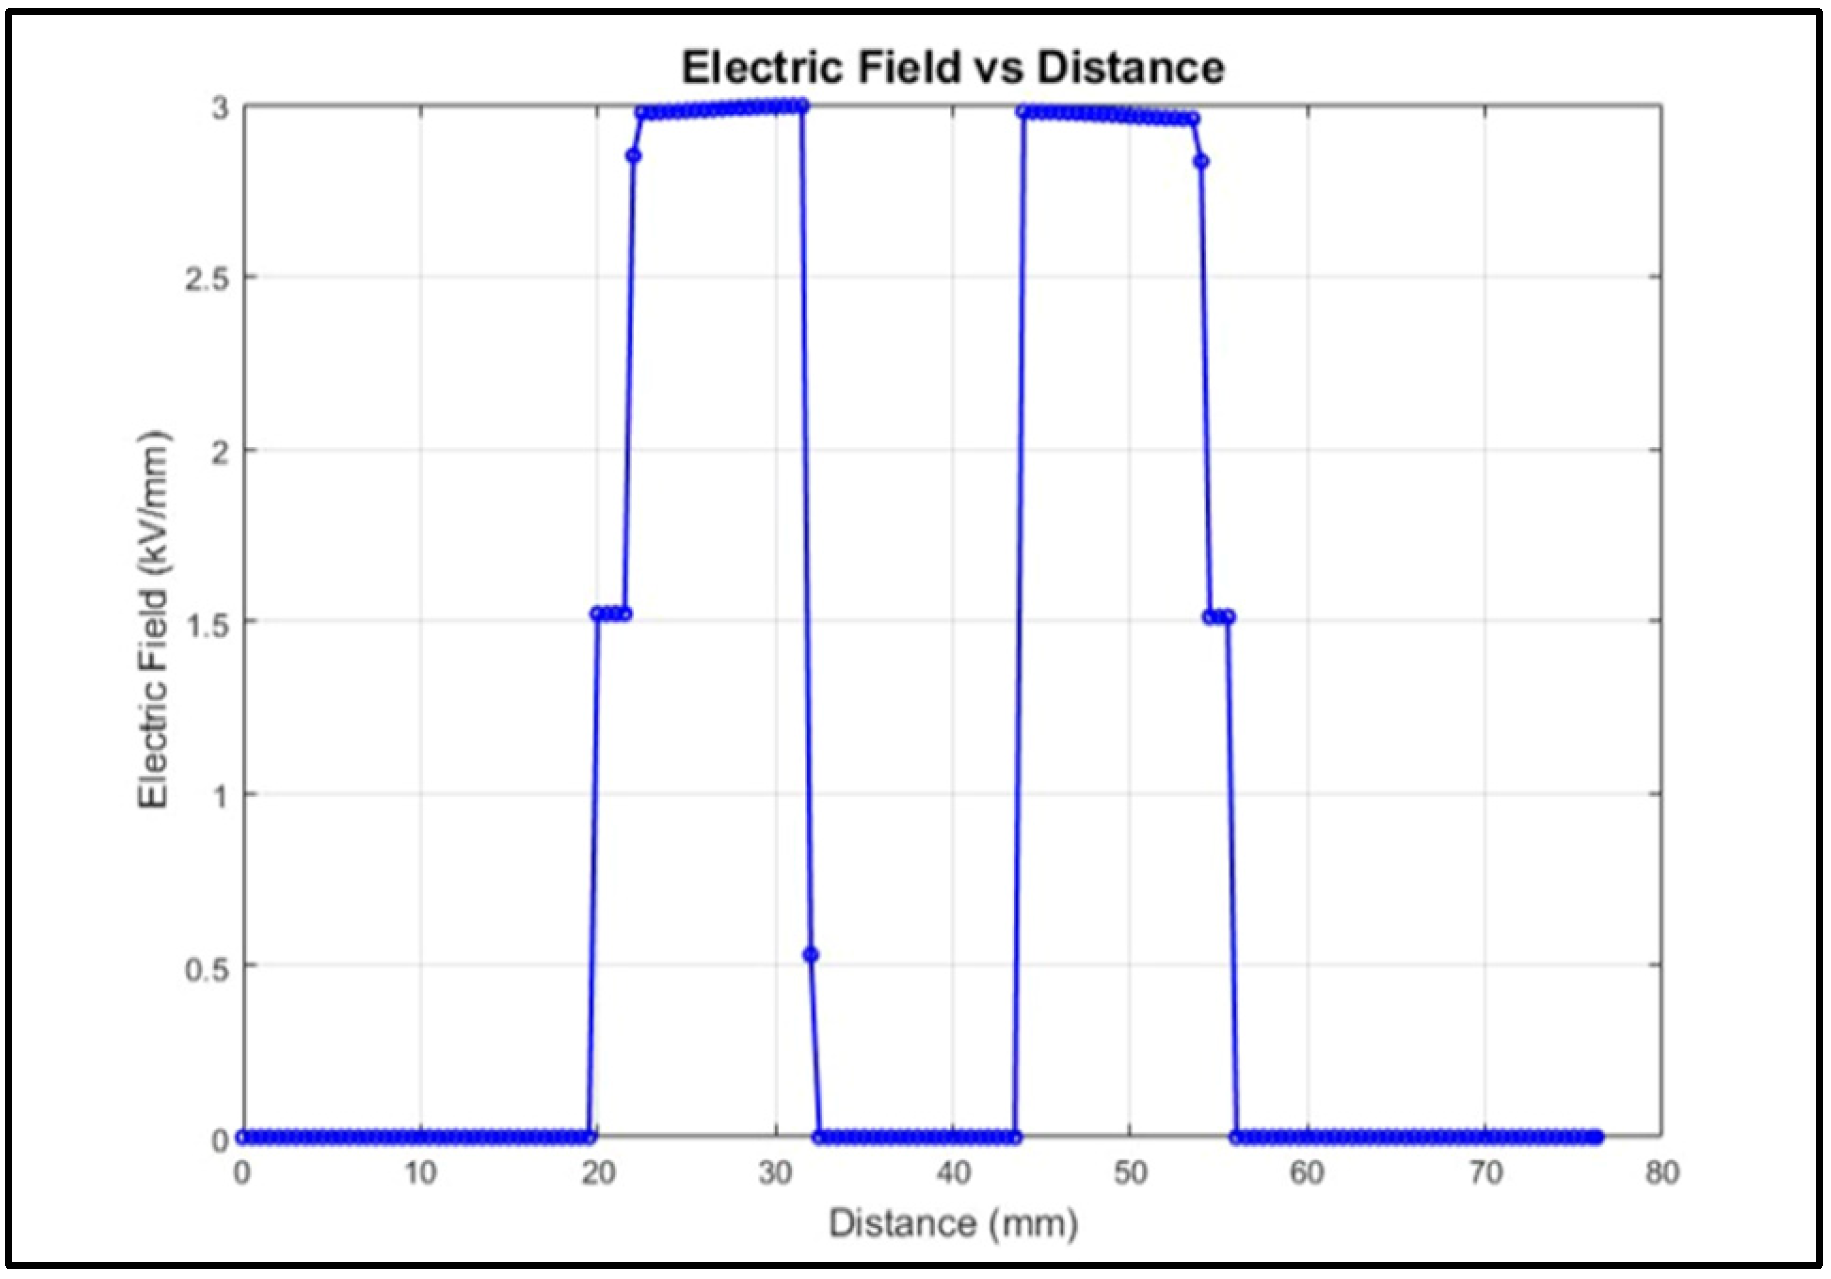
The maximum electric field in a standard HV cable with XLPE insulation was found to be 3.05 kV/mm, as shown in Figure 12. Under the identical operating voltage, the proposed multi-layered HV cable joint exhibits a maximum electric field that is 0.22 kV/mm lower than that of the normal HV cable insulated with XLPE. This reduction confirms that the layered joint design provides improved electric field distribution and that the joint operates within a safer stress margin compared to that of the conventional XLPE-insulated cable.
Figure 12.
Electric field profile of a typical HV cable with XLPE primary insulation.
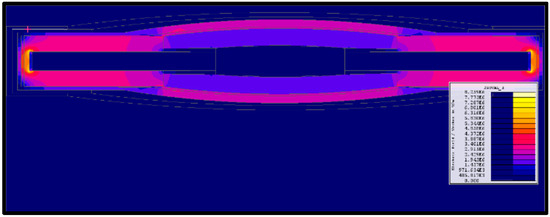
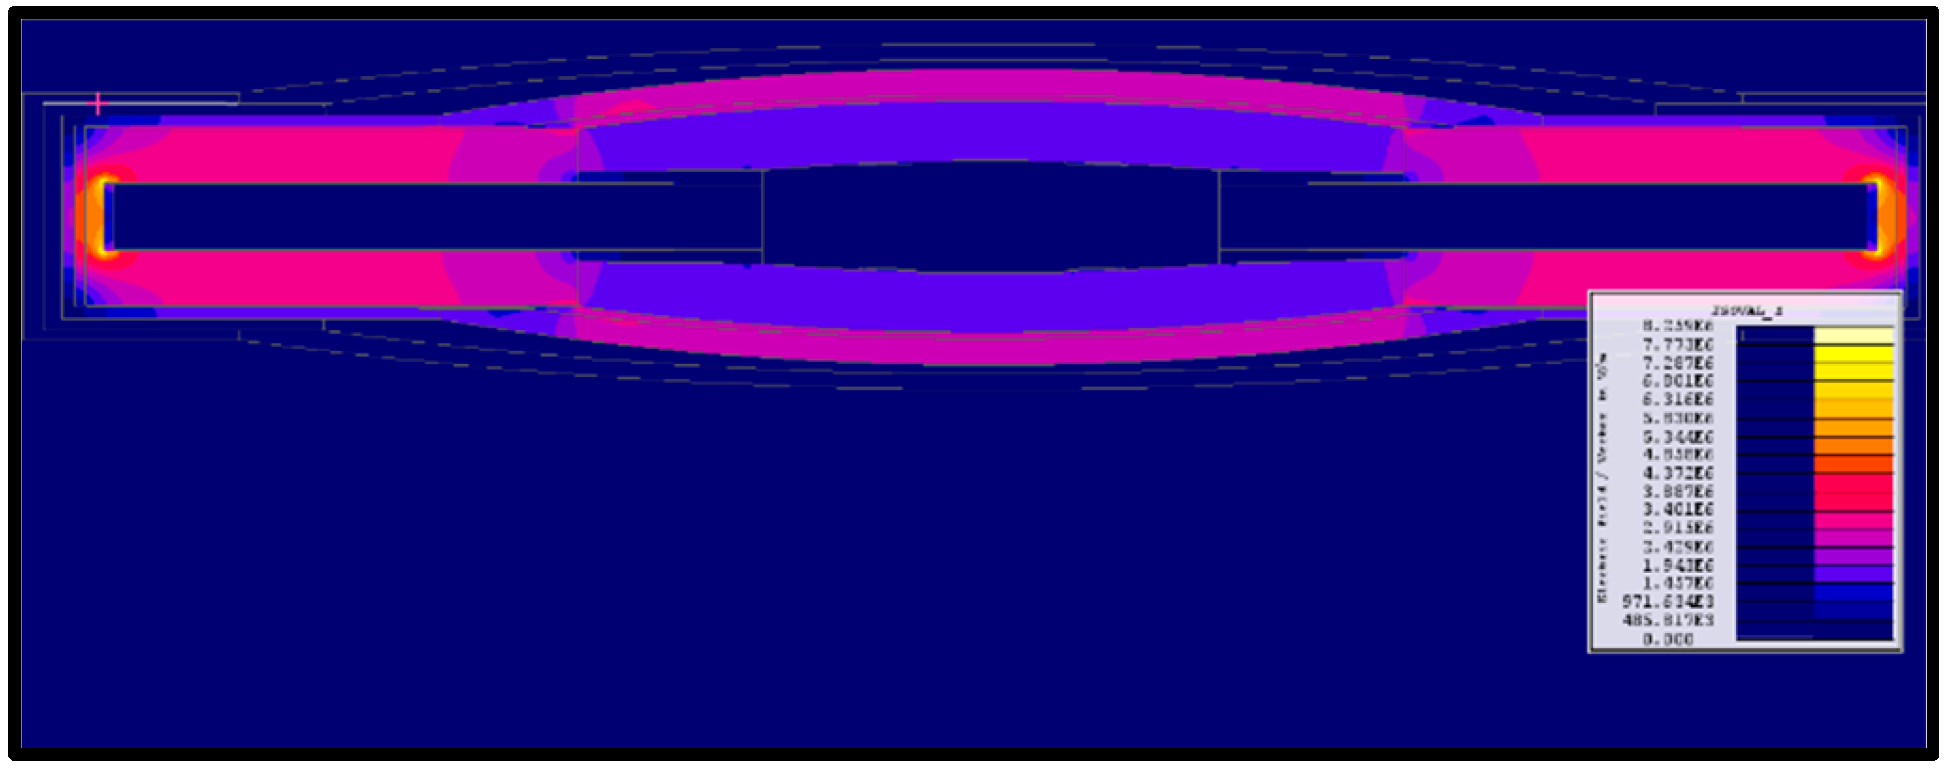
Figure 13 depicts the electric field distribution across the full HV cable joint, using isovalues coloured by different values. It is evident that the maximum electric field across the HV cable joint is less than 3 kV/mm throughout the joint, except the conductor ends within the cable insulation.
Figure 13.
Electric field profile on the full cable joint.
These results support that the selection of suitable insulating materials for cable joints is as crucial as the systematic layering and placement of these materials at appropriate locations in the joints to grade the electric field stress. This systematic approach reduces the chances of localised electric field enhancement and heat accumulation in the insulating materials.
5. Conclusions
This study combined dielectric evaluation of insulating materials with FEM simulations to determine effective insulation strategies for HV cable joints. The tan delta value was used as the main criterion for determining the most suitable insulator for a cable joint. Experimental results showed that both rubber tape and PVC tape achieved low dielectric losses, with tan delta values of 0.0008 at 2 kV. The composite-filled rubber tape also exhibited a higher relative permittivity than those of the other materials, while the PVC tape consistently showed the lowest capacitance across all the tested voltages compared to the other materials. Simulation results indicated that the ZnO-filled non-linear resistive silicon rubber (rubber tape) demonstrated superior performance compared to those of the other materials evaluated. It exhibited exceptional electric-field line grading capabilities across the joint. Therefore, non-linear resistive silicon rubber–ZnO tape is the most suitable insulating material for an HV cable joint.
The most significant improvement came from incorporating a graded insulation design. Arranging layers from the highest to lowest permittivity outward from the conductor, it reduced the maximum electric stress to 2.9 kV/mm, lower than that of a standard XLPE cable.
Overall, these findings show that reliable HV cable joint performance depends on strategic permittivity grading and the incorporation of non-linear resistive materials to achieve uniform field distribution and reduce critical stress points.
Author Contributions
Conceptualisation, S.M. and C.N.; methodology, S.M. and C.N.; formal analysis, N.N. and B.M.; investigation, N.N. and B.M.; data curation, N.N. and B.M.; writing—original draft preparation, N.N., B.M., and S.M.; writing—review and editing, S.M. and C.N.; visualisation, N.N.; supervision, S.M. and C.N.; project administration, S.M.; funding acquisition, S.M. and C.N. All authors have read and agreed to the published version of the manuscript.
Funding
This research received no external funding.
Institutional Review Board Statement
Not applicable.
Informed Consent Statement
Not applicable.
Data Availability Statement
The data presented in this study are not publicly available because they form part of an ongoing research project and contain proprietary information related to materials supplied by a manufacturer. Data may be made available upon reasonable request to the corresponding author, subject to the approval of the manufacturer and any applicable confidentiality agreements.
Acknowledgments
The authors gratefully acknowledge M-Tec for facilitating a site visit and providing practical insights into cable manufacturing and cable jointing applications. The authors also thank the staff of the Genmin Laboratory and High-Voltage Laboratory at the University of the Witwatersrand for their technical support and assistance during the experimental phase of this work. During the preparation of this manuscript/study, the authors used ChatGPT, 5.2, for the purposes of proofreading. The authors have reviewed and edited the output and take full responsibility for the content of this publication.
Conflicts of Interest
The authors declare no conflicts of interest.
Abbreviations
The following abbreviations are used in this manuscript:
| VBD | Voltage at Breakdown |
| TBD | Time to Breakdown |
| kV | Kilovolts |
| PMMA | Polymethyl Methacrylate |
| PVC | Polyvinyl Chloride |
References
- Ye, H. Review on HVDC cable terminations. High Volt. 2018, 3, 79–89. [Google Scholar] [CrossRef] [Scilit]
- Mingotti, A.; Babaei, F.; Tinarelli, R.; Peretto, L. Medium-Voltage AC Cable Joints: A Review of Testing Methods, Standards, and Emerging Trends. Sensors 2025, 25, 3843. [Google Scholar] [CrossRef] [Scilit] [PubMed]
- Su, J.; Wei, L.; Zheng, J.; Liu, J.; Zhang, P.; Pang, X.; Xing, Y. Effects of Mechanical Stress on Insulation Structure and Performance of HV Cable. Polymers 2022, 14, 2927. [Google Scholar] [CrossRef] [Scilit] [PubMed]
- Raymond, J.; Komljenovic, D. Situational Awareness: A Road Map to Generation Plant Modernization and Reliability. IEEE Power Energy Mag. 2024, 22, 29–41. [Google Scholar] [CrossRef] [Scilit]
- Su, D. Study on Crafts of High Voltage Cable Intermediate Joint. Adv. Comput. Sci. Res. 2015, 14, 59–63. [Google Scholar] [CrossRef] [Scilit]
- Nadolny, Z. Electric Field Distribution and Dielectric Losses in XLPE Insulation and Semiconductor Screens of High-Voltage Cables. Energies 2022, 15, 4692. [Google Scholar] [CrossRef] [Scilit]
- Li, M.; Zhou, C.; Zhou, W.; Zhang, J.; Zhang, L.; Yao, L. Feasibility study on lengthening the high voltage cable section and reducing the number of cable joints via alternative bonding methods. High Volt. 2019, 4, 292–299. [Google Scholar] [CrossRef] [Scilit]
- Tefera, T.N.; Punekar, G.S.; Ibrahim, K.; Tuka, M.B.; Bajaj, M. Cable dimension determination using Finite Element Method Magnetic (FEMM) for three-core belted and gas insulated cables. e-Prime Adv. Electr. Eng. Electron. Energy 2024, 10, 100826. [Google Scholar] [CrossRef] [Scilit]
- Oluwafemi, I.; Salau, A.O.; Laseinde, T. Causes of Deterioration of XLPE MV Cables: A Review. Recent Pat. Eng. 2020, 14, 218–224. [Google Scholar] [CrossRef] [Scilit]
- Sonerud, B.; Eggertsen, F.; Nilsson, S.; Furuheim, K.M.; Evenset, G. Material considerations for submarine high voltage XLPE cables for dynamic applications. In Proceedings of the 2012 Annual Report Conference on Electrical Insulation and Dielectric Phenomena, Montreal, QC, Canada, 14–17 October 2012; pp. 890–893. [Google Scholar] [CrossRef] [Scilit]
- IEEE Std 404; IEEE Standard for Extruded and Laminated Dielectric Shielded Cable Joints Rated 2.5 kV to 500 kV AC or 2.5 kV to ±400 kV DC. IEEE: Piscataway, NJ, USA, 2022.
- Ramsey, N. Some Thoughts on MV HV Heat Shrink Cable Joints & Cable Terminations. Power and Cables. 2018. Available online: https://www.powerandcables.com/heat-shrink-cable-joints-terminations/ (accessed on 18 October 2025).
- Pal, A.K.; Baral, A.; Lahiri, A. Studies on prospect of HTV silicone rubber as dielectric material when reinforced with TiO2 nano particles. IET Sci. Meas. Technol. 2021, 15, 292–301. [Google Scholar] [CrossRef] [Scilit]
- Dessouky, S.; Zein, A.; Abd El-Aal, R.A.; Abd El-Rahman, N.A. Analysis of the Electric Field Distribution within MV Cable Joint in the Presence of Defects in Cable Insulation. Int. J. Appl. Energy Syst. 2019, 1, 35–44. [Google Scholar] [CrossRef] [Scilit]
- Liao, L.; Xue, T.; Xiong, J.; Lu, B. Research on the Influence of the Relative Permittivity of the Reinforced Insulation of the Cable Intermediate Joint on the Electric Field Intensity. J. Phys. Conf. Ser. 2021, 1815, 012037. [Google Scholar] [CrossRef] [Scilit]
- Wang, Y.; Hooper, I.; Edwards, E.; Grant, P.S. Gap-Corrected Thin-Film Permittivity and Permeability Measurement with a Broadband Coaxial Line Technique. IEEE Trans. Microw. Theory Tech. 2016, 64, 924–930. [Google Scholar] [CrossRef] [Scilit]
- Hernandez-Mejia, J.C.; Harley, R.G.; Hampton, N.; Hartlein, R. Characterization of Ageing for MV Power Cables Using Low Frequency Tan δ Diagnostic Measurements. IEEE Trans. Dielectr. Electr. Insul. 2009, 16, 862–870. [Google Scholar] [CrossRef] [Scilit]
- IEEE Std 286-2000; IEEE Recommended Practice for Measurement of Power Factor Tip-Up of Electric Machinery Stator Coil Insulation. IEEE: Piscataway, NJ, USA, 2019.
- Egan, M. Dielectric Strength: A Comprehensive Guide to Material Insulation Properties. Atlas Fibre. 2023. Available online: https://www.atlasfibre.com/dielectric-strength-a-comprehensive-guide-to-material-insulation-properties/ (accessed on 16 November 2025).
- Morsalin, S.; Phung, T.; Danikas, M.G.; Mawad, D. Diagnostic challenges in dielectric loss assessment and interpretation: A review. IET Sci. Meas. Technol. 2019, 13, 767–782. [Google Scholar] [CrossRef] [Scilit]
- M-TEC. 33 kV Cu 1 core Type A CTS SANS 1339. M-TEC. Available online: https://surl.li/zqsgnj (accessed on 30 November 2025).

Disclaimer/Publisher’s Note: The statements, opinions and data contained in all publications are solely those of the individual author(s) and contributor(s) and not of MDPI and/or the editor(s). MDPI and/or the editor(s) disclaim responsibility for any injury to people or property resulting from any ideas, methods, instructions or products referred to in the content. |
© 2026 by the authors. Licensee MDPI, Basel, Switzerland. This article is an open access article distributed under the terms and conditions of the Creative Commons Attribution (CC BY) license.