


Abstract
This paper introduces a cutting-edge, real-time fault detection and classification method powered by artificial neural networks (ANNs), designed to significantly boost the reliability and sustainability of medium voltage (MV) underground cable distribution systems. The research analyzes the electrical and physical properties of MV underground cables and common fault types, including line-to-line, line-to-ground, and double line-to-ground faults. A simulation model is developed using MATLAB/Simulink R2025b to generate fault scenarios under various operating conditions. Raw data in the form of Voltage and current signals are generated and processed to extract significant features, which are then fed into the ANN model. The ANN is trained using a supervised learning approach, using a dataset of labeled fault instances. Key parameters like hidden layers, activation functions, and learning rates are optimized to improve the model’s performance. The results show that the proposed ANN-based fault detection technique achieves over 95% accuracy in detecting and classifying faults in real-time, with minimal computational delay. Comparative analysis with conventional fault classification techniques demonstrates the superiority of the ANN model in handling noisy and non-linear data.
1. Introduction
MV underground cables are crucial in urban power distribution networks, serving densely populated areas where overhead lines are not feasible. These cables are designed to withstand harsh environmental conditions and provide reliable power to urban centers, industrial zones, and residential areas [1]. However, they are susceptible to faults, often caused by insulation degradation, mechanical stress, thermal fluctuations, or accidental excavation damage [2]. Faults can lead to service interruptions, financial losses, and potentially hazardous conditions if not promptly addressed. Conventional fault detection methods, such as impedance-based, time-domain reflectometry, and frequency-domain analysis, often lack the speed and accuracy needed for real-time response in complex urban settings [3]. Power utilities are exploring artificial intelligence and machine learning techniques to enhance fault detection capabilities. ANNs have shown promising results due to their ability to learn and adapt to complex patterns within data, making them highly effective for real-time fault detection and classification [4]. The MV underground cable system is explored using an ANN that is trained on simulated fault conditions from an IEEE 14 Bus system. The IEEE 14 standard Bus system is tested with fault scenarios that include line-to-ground (L-G), line-to-line (L-L), and line-to-line-to-ground (L-L-G) faults [5]. The dataset from the system includes diverse scenarios like varying fault locations, resistances, and fault initiation times. The network architecture is optimized for quick response and high accuracy, ensuring real-time fault classification capabilities [6].
The system’s performance is validated through detailed testing, showing over 95% classification accuracy and rapid fault detection within milliseconds of occurrence, enabling timely response and mitigation. However, real-world implementation presents challenges, such as limited fault data availability and variability in fault parameters. The IEEE 14-bus system simulation requires careful parameter tuning and integration with the ANN model, demanding significant computational resources [7]. Despite these challenges, a practical implementation could achieve 80–90% classification accuracy with marginal delays in real-time performance [8]. Post-simulation analysis highlights areas for improvement, such as enhancing data diversity, refining ANN architectures, and improving real-time processing speeds. Traditional fault detection methods in MV underground cables struggle to meet real-time urban fault identification demands due to limitations in fault location, cable properties, and signal attenuation [9]. An ANN-based solution is proposed to improve speed, accuracy, and reliability, providing a scalable and efficient solution.
2. MV Cable Fault Detection Technique Review
MV underground distribution has Shunt faults, which are symmetrical (balanced) and unsymmetrical (unbalanced), with a 95 to 98 probability of unsymmetrical faults [10]. The percentage contribution of various fault occurrences in the power system can be tabulated as shown in Table 1 below [11]. The modern power system distribution networks require immediate fault detection techniques to enhance instantaneous stability. The importance of reviewing the traditional techniques of MV cable fault detection cannot be ignored [12]. This is why traditional electrical distribution grid system protection schemes are slowly replaced by the artificial intelligence-monitored smart grid protection system [13].
Table 1.
The distribution network fault occurrence.
2.1. Traditional Fault Detection Techniques
Impedance-based fault detection is a widely used method in power systems to identify faults by calculating the cable system’s impedance during normal operation and fault conditions [14]. Time domain reflectometry (TDR) is used for fault detection in underground cables but may not provide sufficient fault classification accuracy in complex faults. Pulse width modulation (PWM) is gaining traction in medium voltage cables, analyzing fault-induced transients and inferring fault characteristics [15]. Traditional fault detection techniques, such as TDRs, are being replaced by AI/ML techniques like Support Vector Machines (SVM), decision trees, ANNs, random forests, K-nearest neighbors (KNN), and other deep learning machines (DML) for fault classification [16]. These techniques are simple to implement and widely used in relay protection schemes but may not be suitable for real-time fault detection in complex systems or with low fault impedance.
2.2. ANN-Based Fault Detection and Classification Technique
ANNs are machine learning models that process fault-related signals like voltage and current transients, which are difficult for traditional methods to analyze. They have been shown to outperform traditional methods in classification accuracy, especially in complex power system networks [17]. ANNs are also able to adapt to different fault scenarios and evolving grid conditions, making them valuable in real-time applications. They can analyze incoming data and classify faults in real time, ensuring minimal downtime and fast power restoration. Recent studies have demonstrated high accuracy rates in fault classification for medium voltage networks, with a backpropagation neural network (BPNN) achieving over 95% accuracy in identifying fault types [18]. However, challenges remain in optimizing the model for real-time operation, particularly in terms of computational efficiency and large training datasets.
3. Proposed ANN-Based Technique
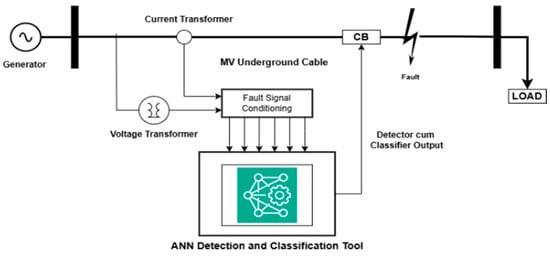
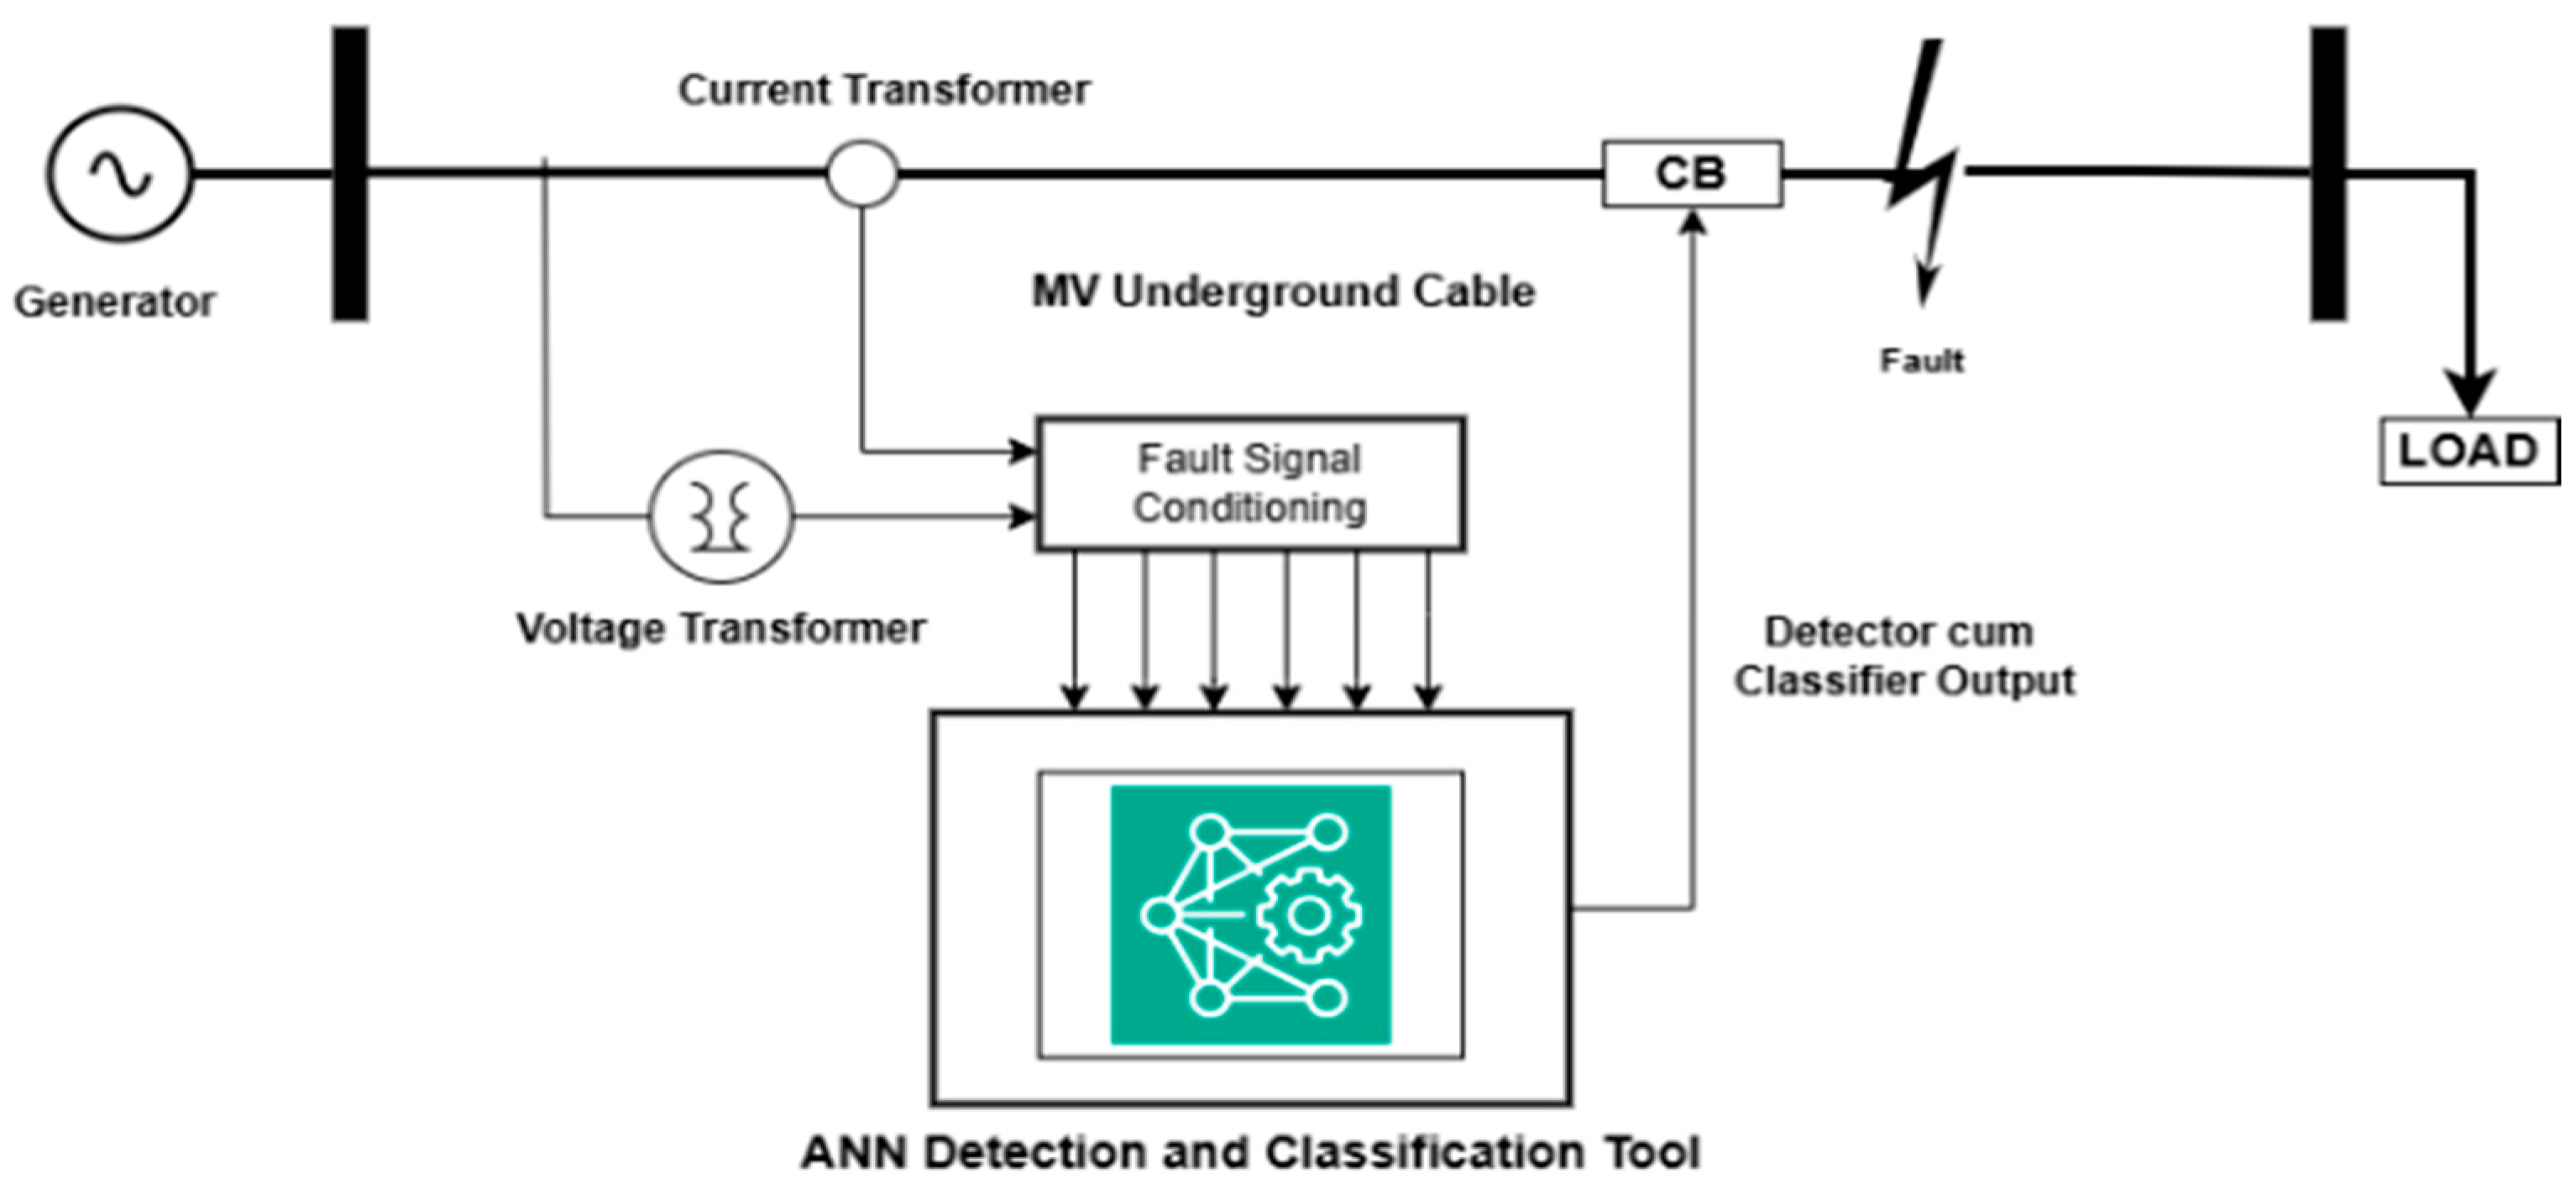
The introduction should briefly place the study in a broad context and define the purpose of the work and its significance. The single-line diagram of the detection and classification system illustrated in Figure 1 below consists of several modules, each capturing, processing, and classifying fault data.
Figure 1.
The proposed ANN-based faults technique single-line.
The workflow includes the signal acquisition module, which collects real-time voltage and current signals from MV underground cable connected to buses, the pre-processing module for data preprocessing, the fault detection module, which uses an initial ANN model to detect faults, and the monitoring interface for graphical system monitoring [14]. The ANN Equation for a given input vector is expressed as:
where is the input vector of the features, and are the weight matrices for the hidden and output layers, respectively, σ is the activation function, and are the biases for the hidden and output layers, respectively [15]. The loss function, also known as the mean square error (MSE), is calculated according to the following equation:
where and indicates the real and estimated values of the output of i-th fuzzy rule, respectively. is defined as follows:
The second equation is MSE, stored in each stage of training. On investigation with five neurons in the hidden layer with 160,001 data points, the above proposed approach of the ANN training provides better precision under different fault conditions of the MV underground cable distribution system.
4. MV Underground Cable ANN-Based Technique Modeling
The ANN used for the MV underground cable fault detection and classification follows the training process where data is captured on a fault-simulated system, with 70% of the data used to train the model, 15% used for testing the ANN, and the outstanding 15% used for validation of the model in terms of fault classification [17].
4.1. IEEE 14 Bus System Fault Simulation
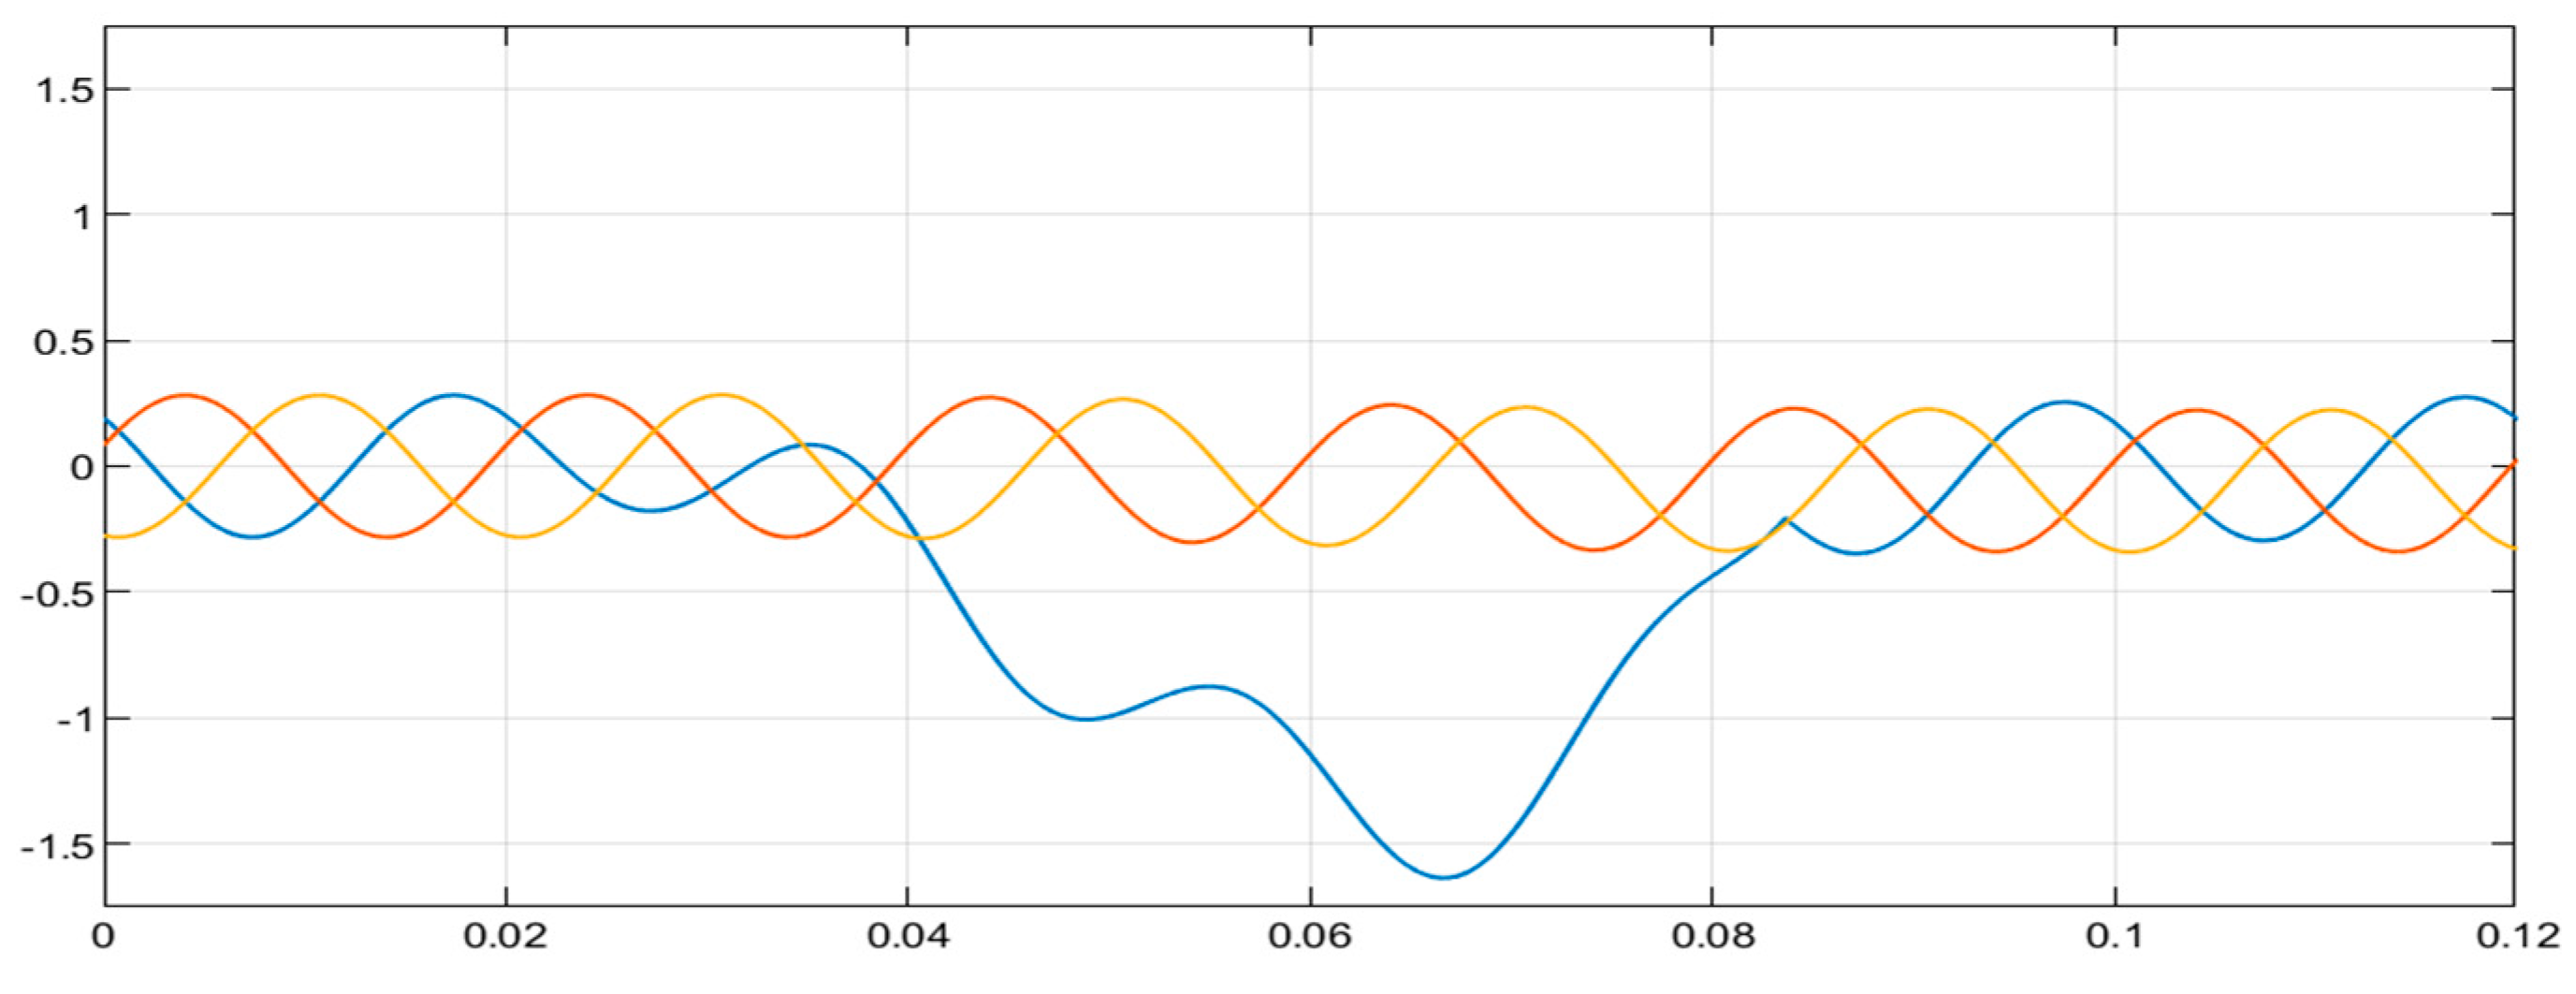
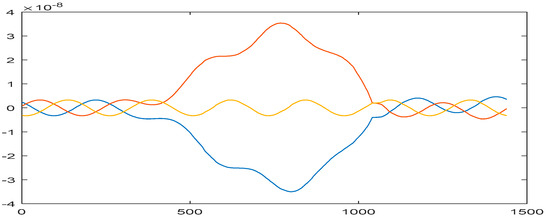
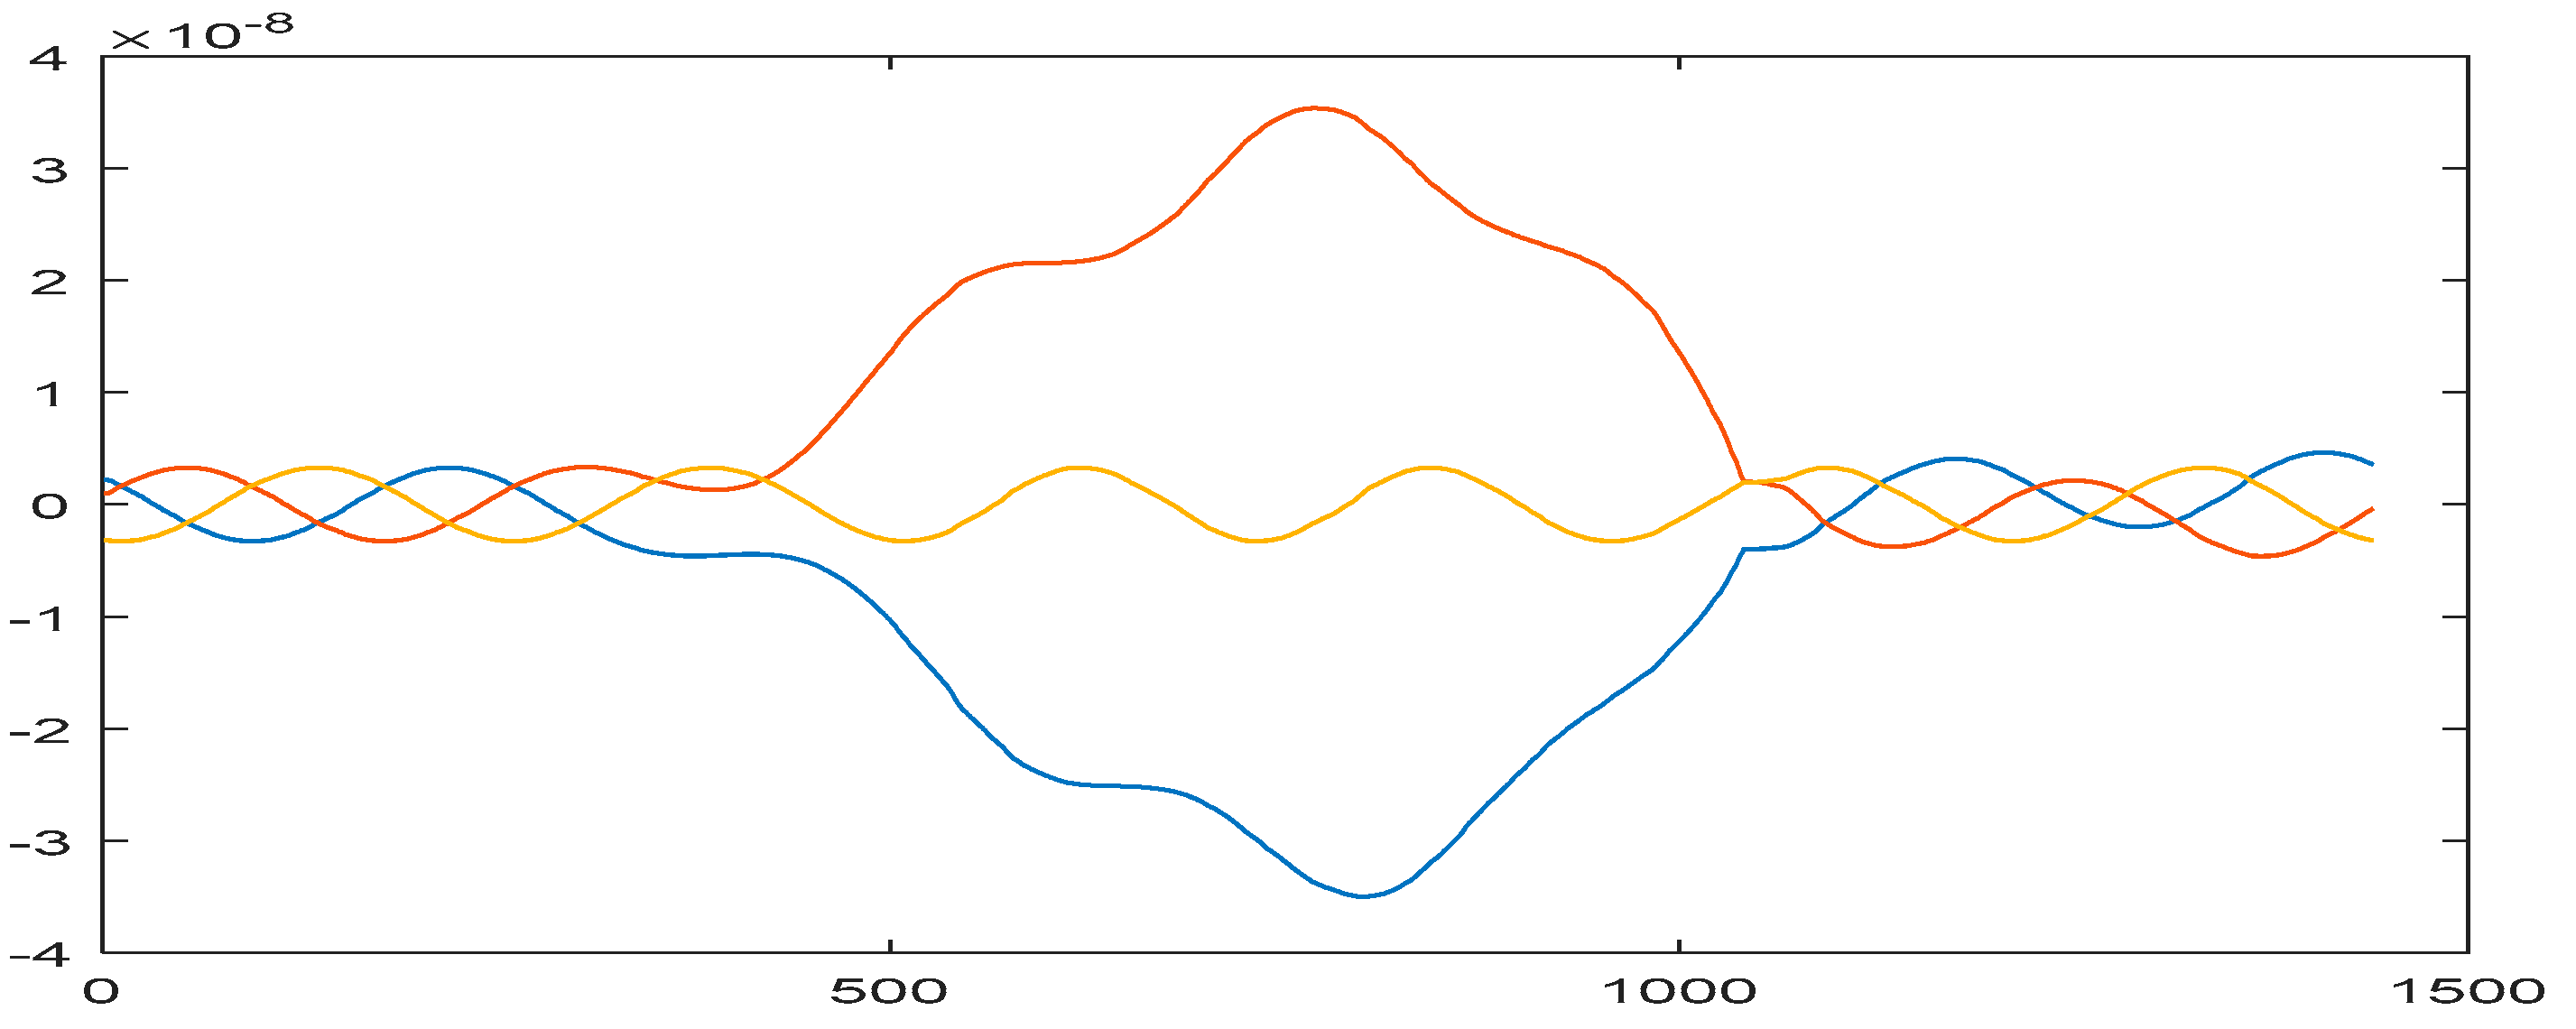
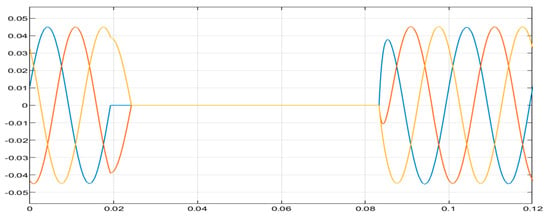
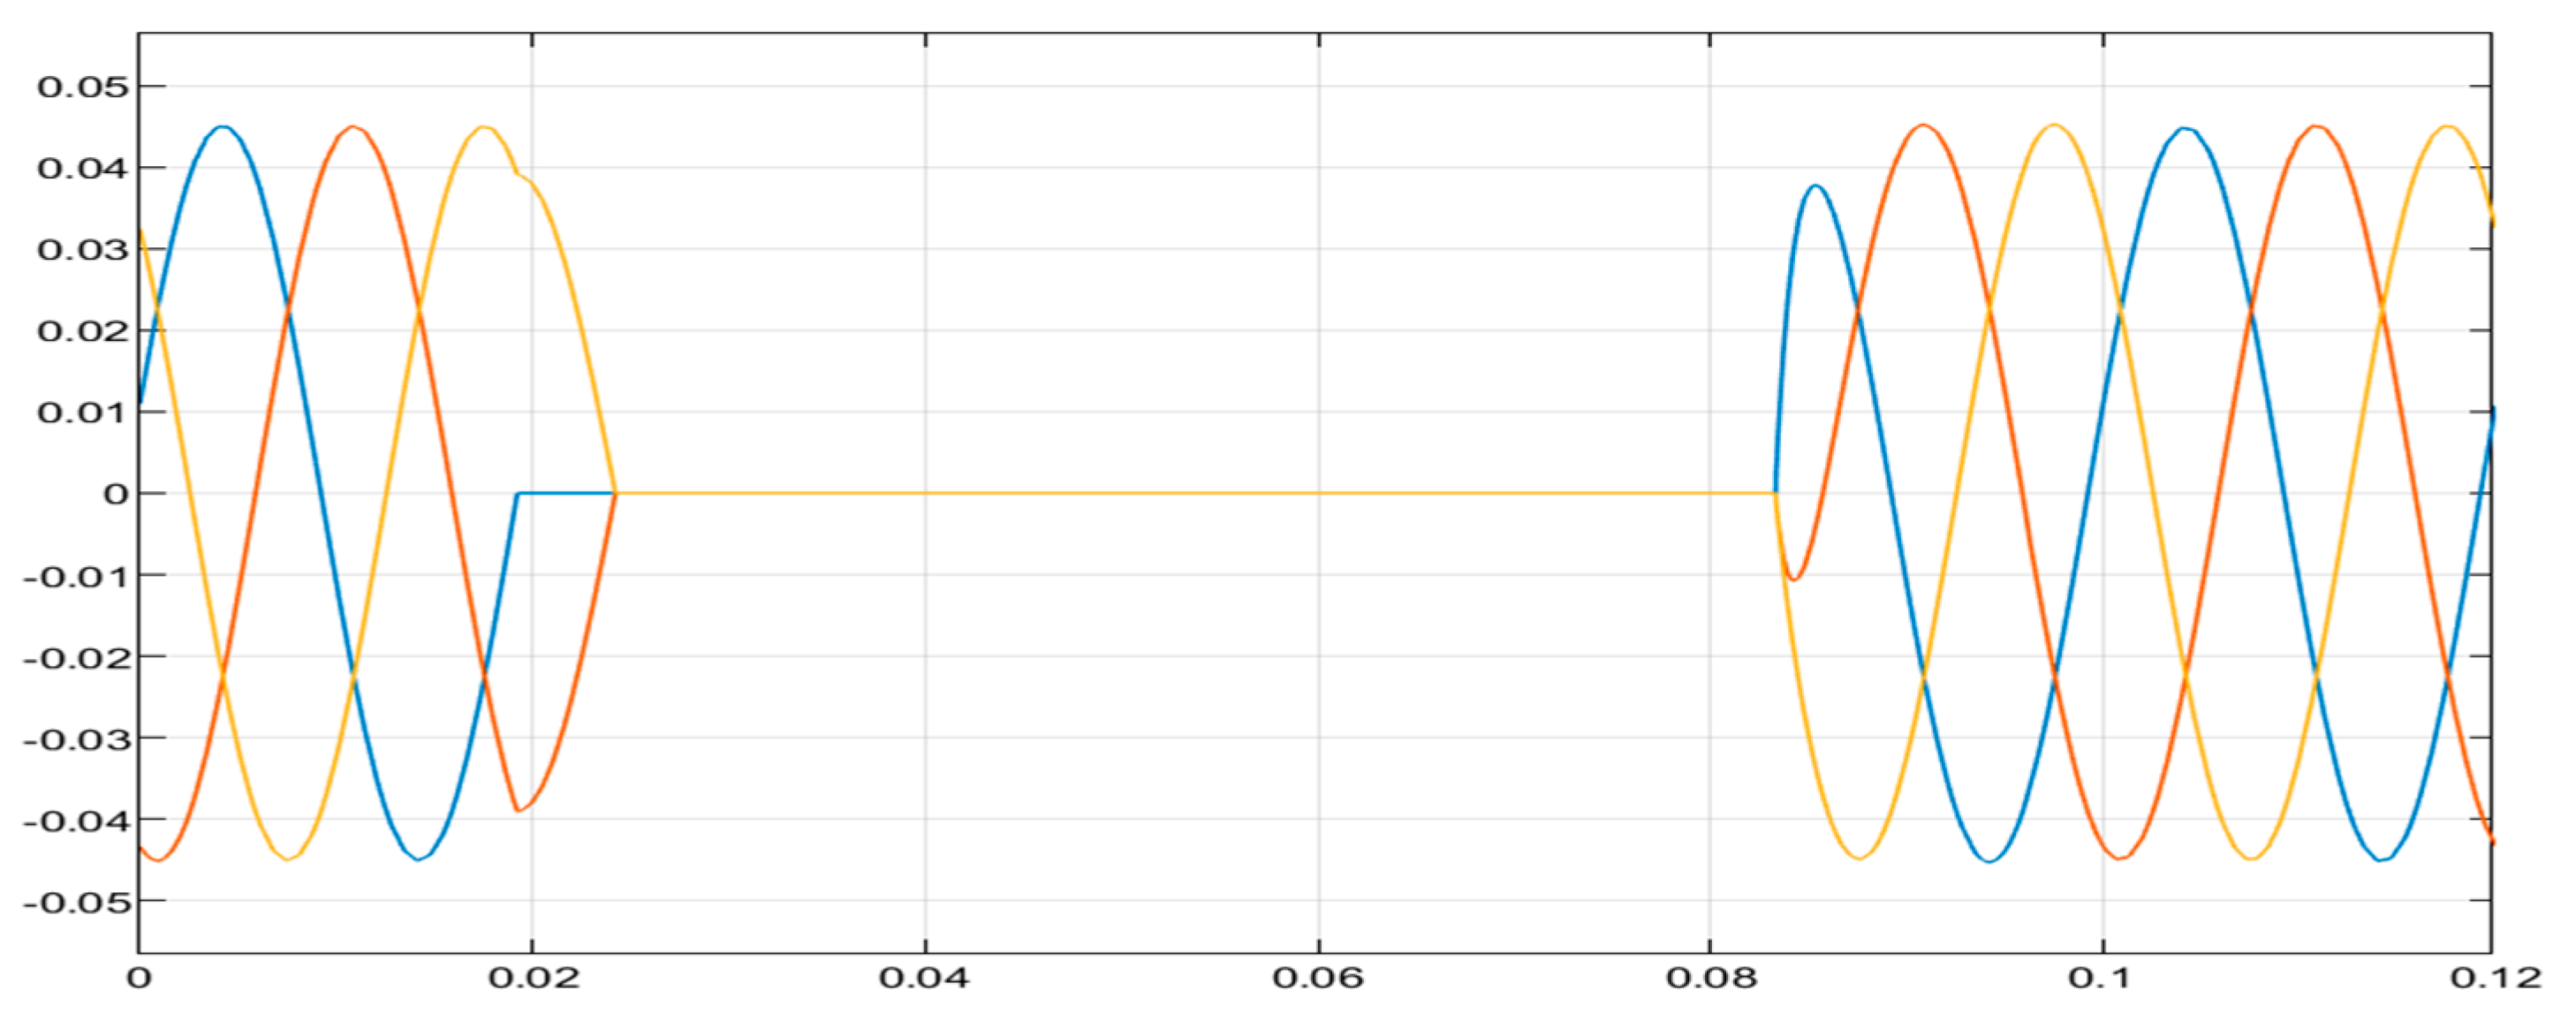
Each fault scenario is run independently, generating fault-induced signals for training the ANN model. The faults include L-G, L-L, and L-L-G fault injection on the distribution system. The line-to-ground fault in Figure 2 shows the current waveform at Bus 7 with an imbalance in current flow, with one phase increasing due to the ground’s direct connection. The waveform shows transient components initially and a steady-state oscillation. Figure 3 shows the current waveform at Bus 7, with the affected phases (red and blue phase) experiencing an imbalance due to the L-L fault, reflecting the disturbance’s spread through the system. The waveform displays distinct peaks due to the short circuit between the red and blue phases.
Figure 2.
Bus 7 (L-G) fault-current waveform.
Figure 3.
Bus 7 (L-L) fault-current waveform.
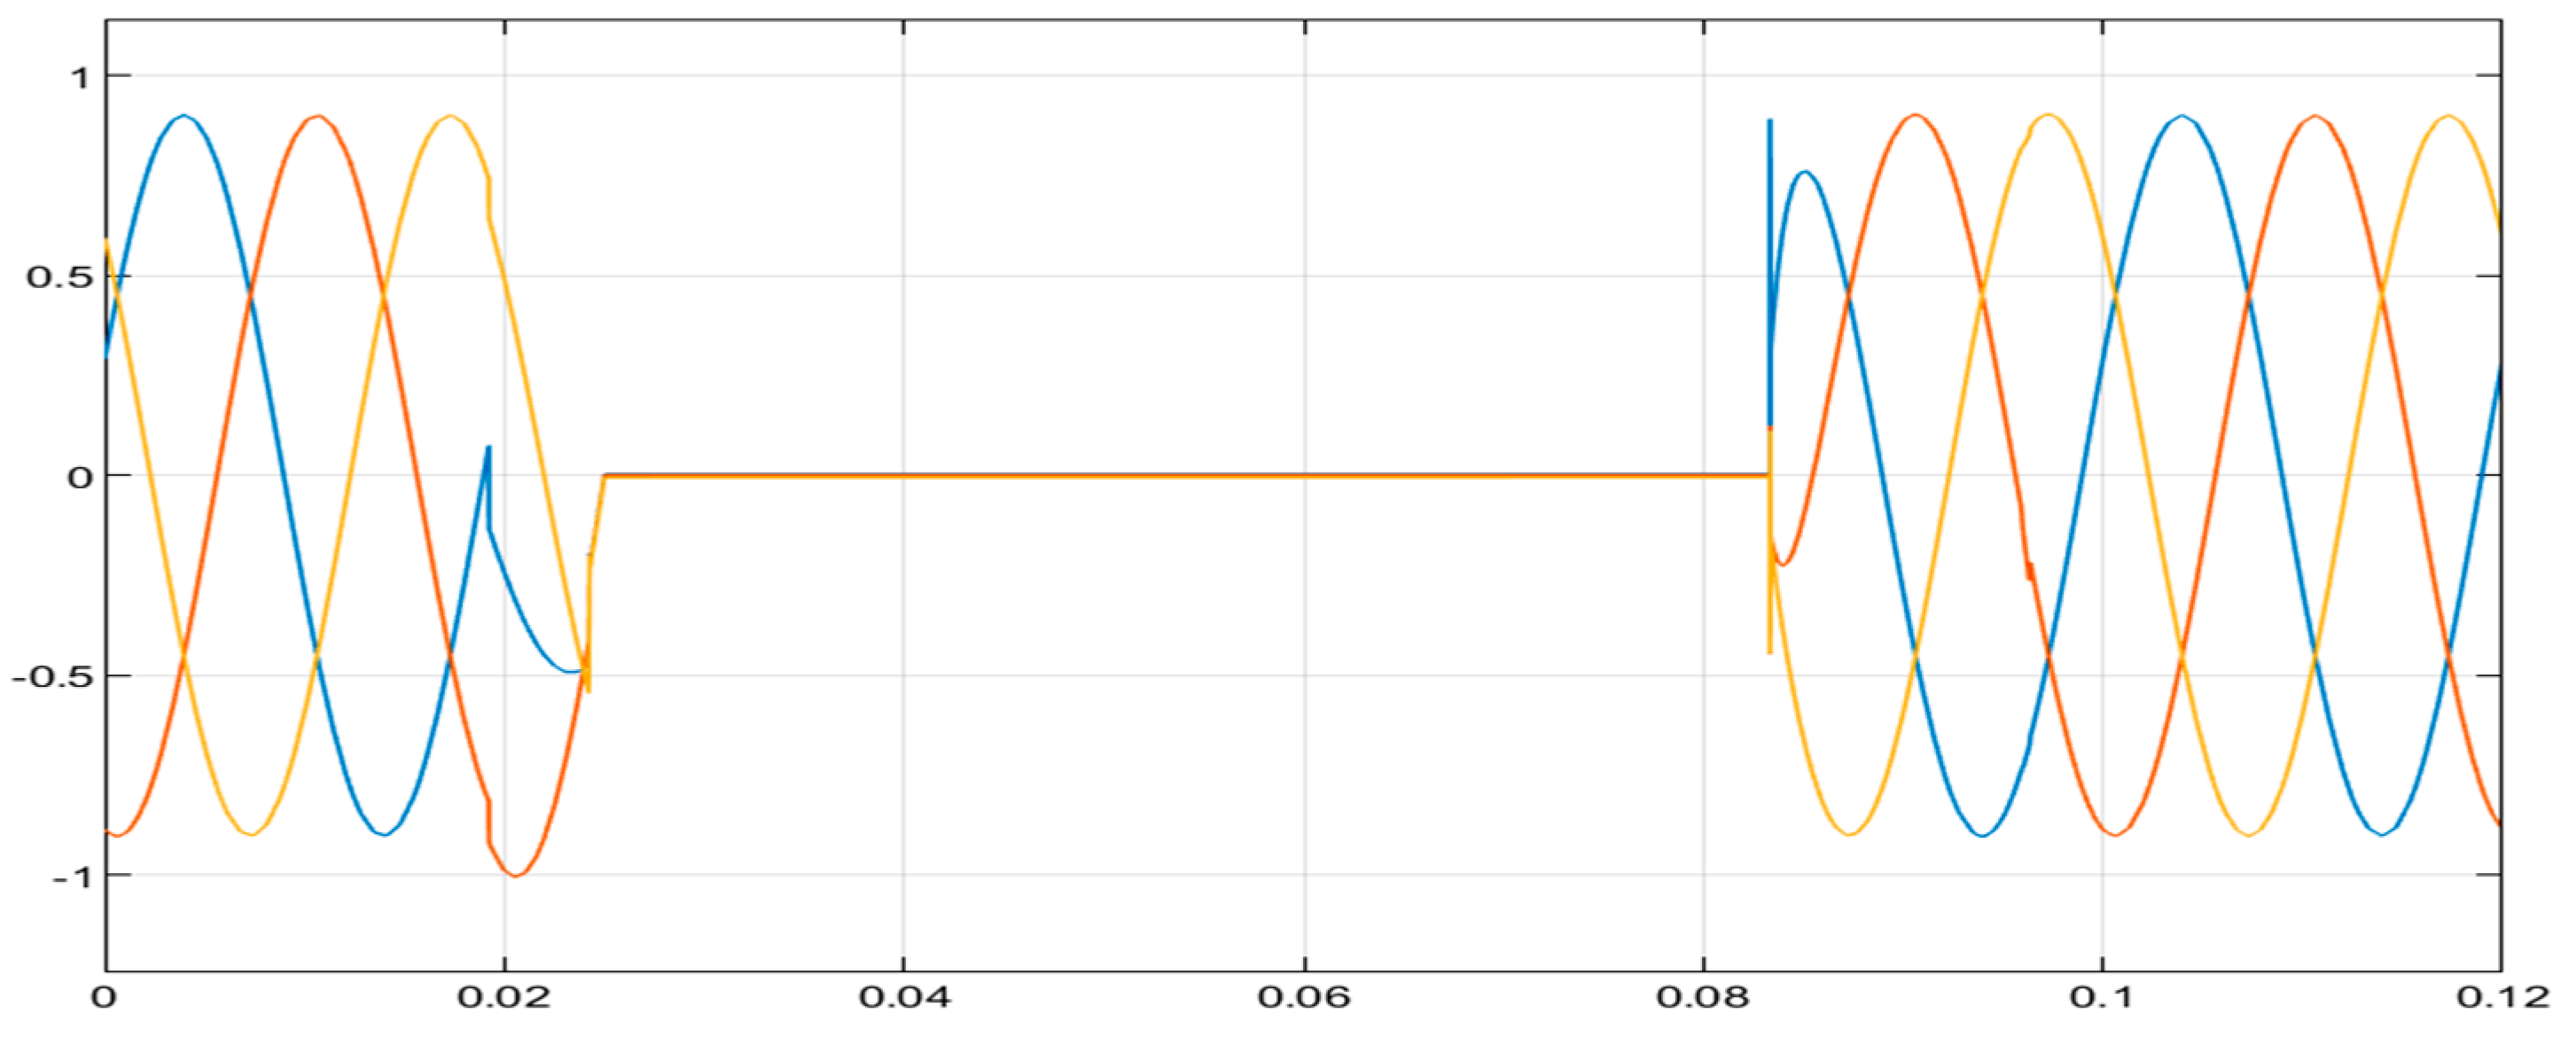
Figure 4 shows the voltage waveform at Bus 7 during an L-L fault, with a significant drop in voltage between the two faulted phases. The unaffected phase may exhibit minor disturbances or remain close to its nominal value.
Figure 4.
Bus 7 (L-L) fault-current waveform.
Figure 5 shows the voltage at Bus 9, with a significant drop in voltage for affected phases due to the fault. Figure 6 shows the voltage waveform at Bus 12, with the affected phases experiencing a voltage drop due to the fault, reflecting the disturbance’s spread through the system. The waveform displays distinct peaks due to the short circuit between the phases. The double line-to-ground fault in Figure 4 shows the voltage waveform at Bus 7 during an L-L-G fault, with a significant drop in voltage between the two faulted phases. The waveform displays distinct peaks due to the short circuit between the phases. The double line-to-ground fault in Figure 4 shows the voltage waveform at Bus 7 during an L-L-G fault, with a significant drop in voltage between the two faulted phases.
Figure 5.
Bus 9 (L-L) fault-voltage waveform.
Figure 6.
Bus 12 (L-L) fault-voltage waveform.
The current waveform at Bus 7 during the L-L-G fault (Figure 7), shows a sharp rise in current between two phases, while the unaffected phase remains stable. The unaffected phase may exhibit minor disturbances or remain close to its nominal value. Figure 8 shows the voltage waveform at Bus 7, with a significant drop in voltage for the affected phases due to the fault. Figure 9 shows the current waveform at Bus 9, with a significant drop in voltage for the affected phases (Red and Blue phase) due to the L-L-G fault that occurred.
Figure 7.
Bus 7 (L-L-G) fault-current waveform.
Figure 8.
Bus 7 (L-L-G) fault-voltage waveform.
Figure 9.
Bus 9 (L-L-G) fault-current waveform.
4.2. ANN Training and Validation Overview
The ANN was trained using fault data from the IEEE 14-bus system simulation. This process involved extensive training, validation, and testing of the ANN for L-G, L-L, and L-L-G faults [18]. The results from these training tools ensured that the model developed a high sensitivity to the fault signatures across the buses.
4.2.1. Training and Validation Graphs
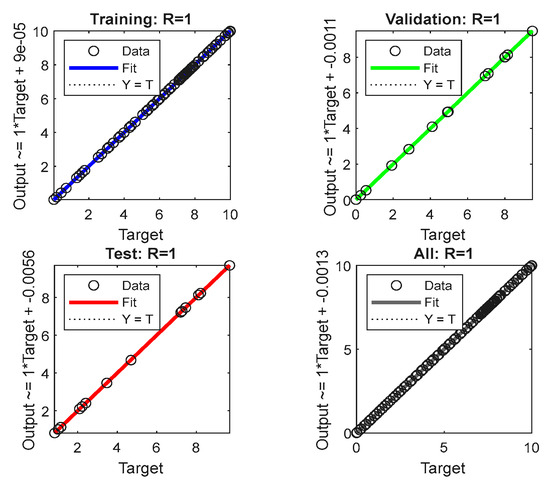
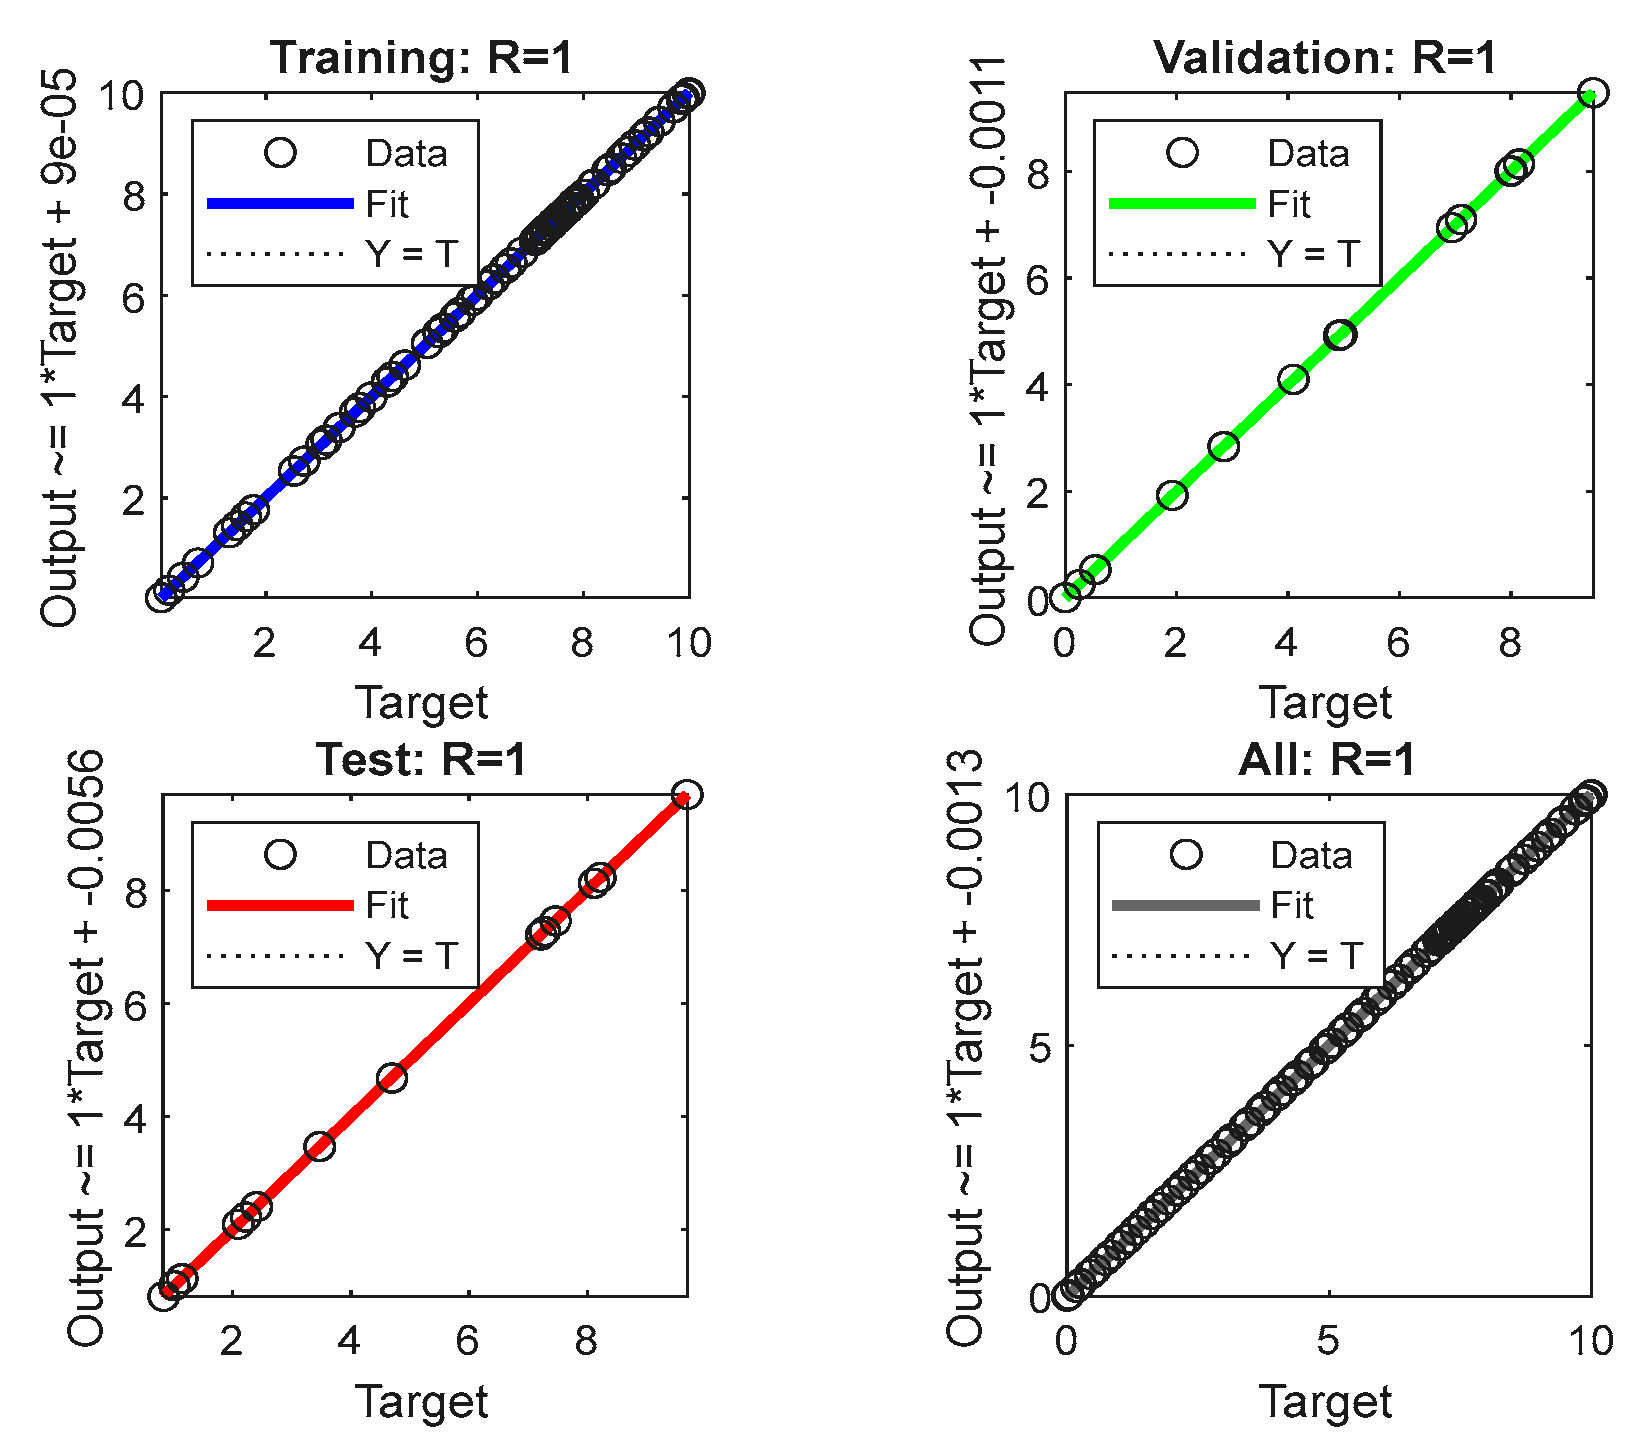
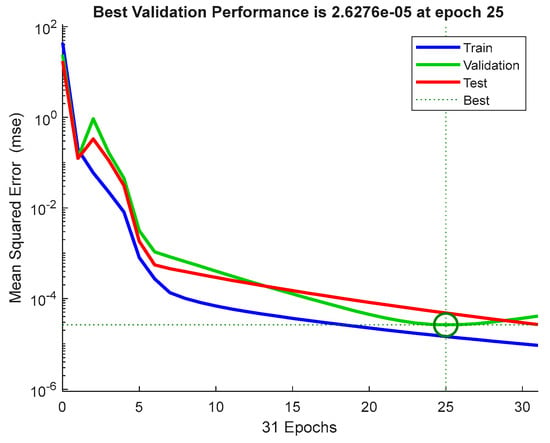
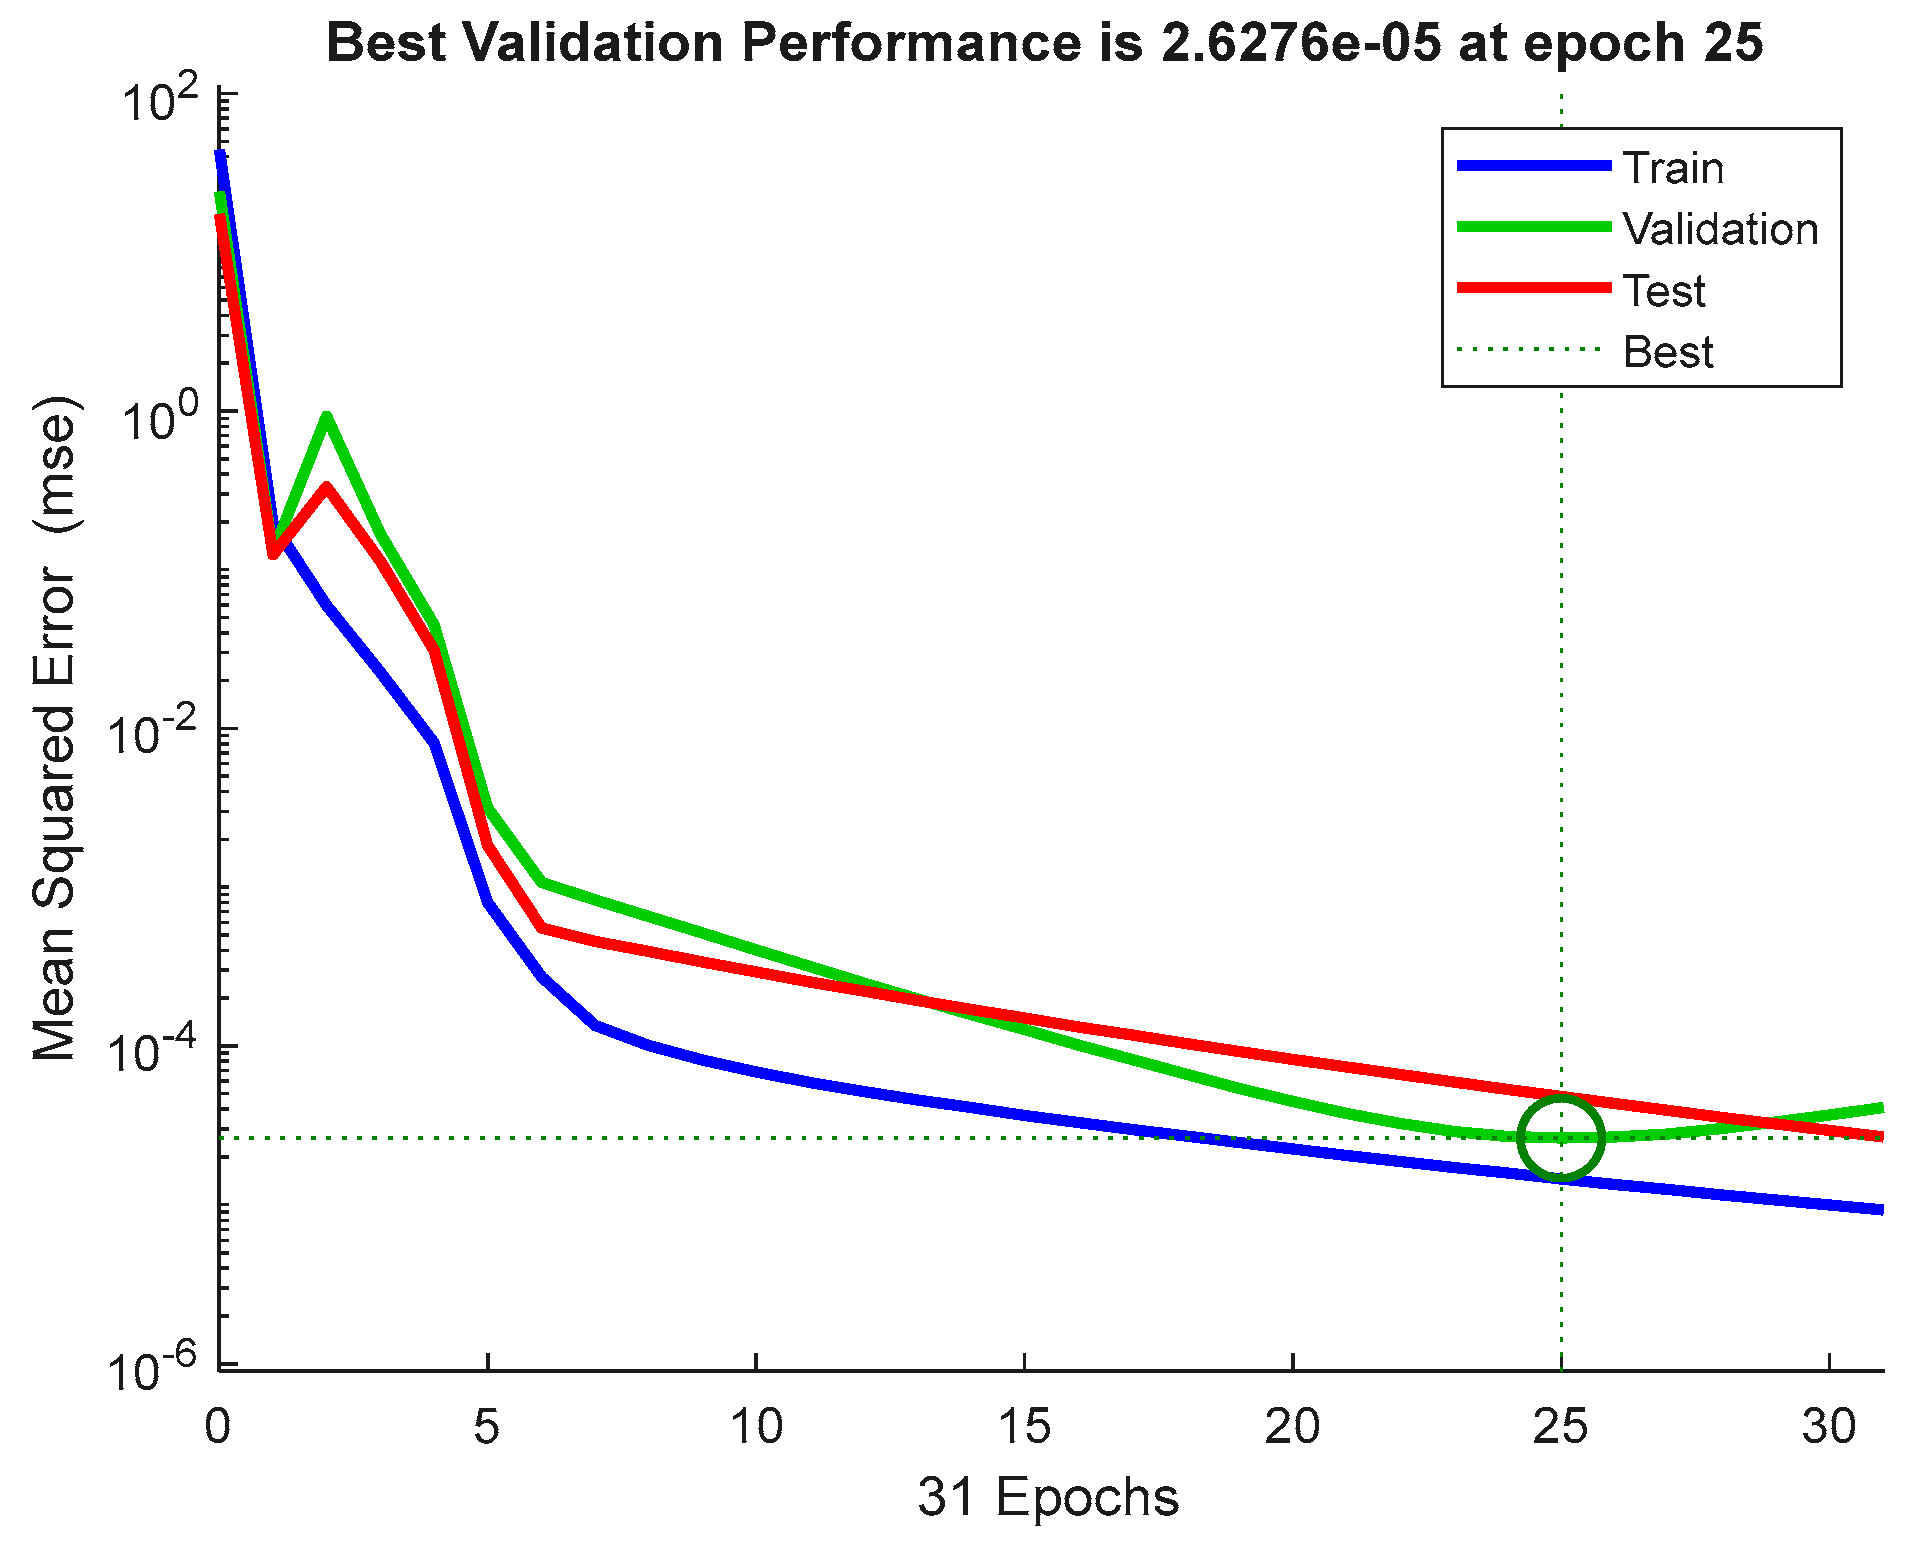
The training and validation graphs show the network’s steady improvement in accuracy with successive iterations illustrated in Figure 10 and Figure 11. The validation graph depicts the reduction in mean squared error (MSE), indicating efficient convergence. Together, these graphs validate the ANN’s reliability for real-world fault classification tasks.
Figure 10.
Neural network tool training and validation stats.
Figure 11.
Neural network validation graph.
4.2.2. Performance Evaluation and Error Histogram Analysis
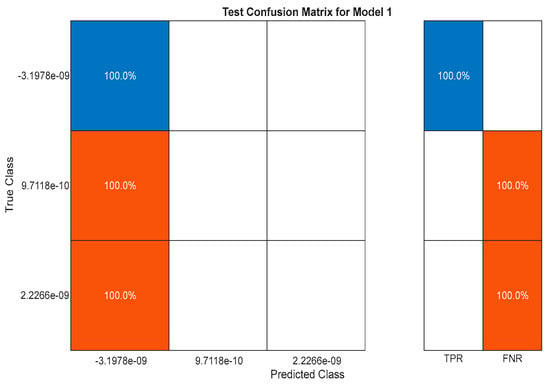
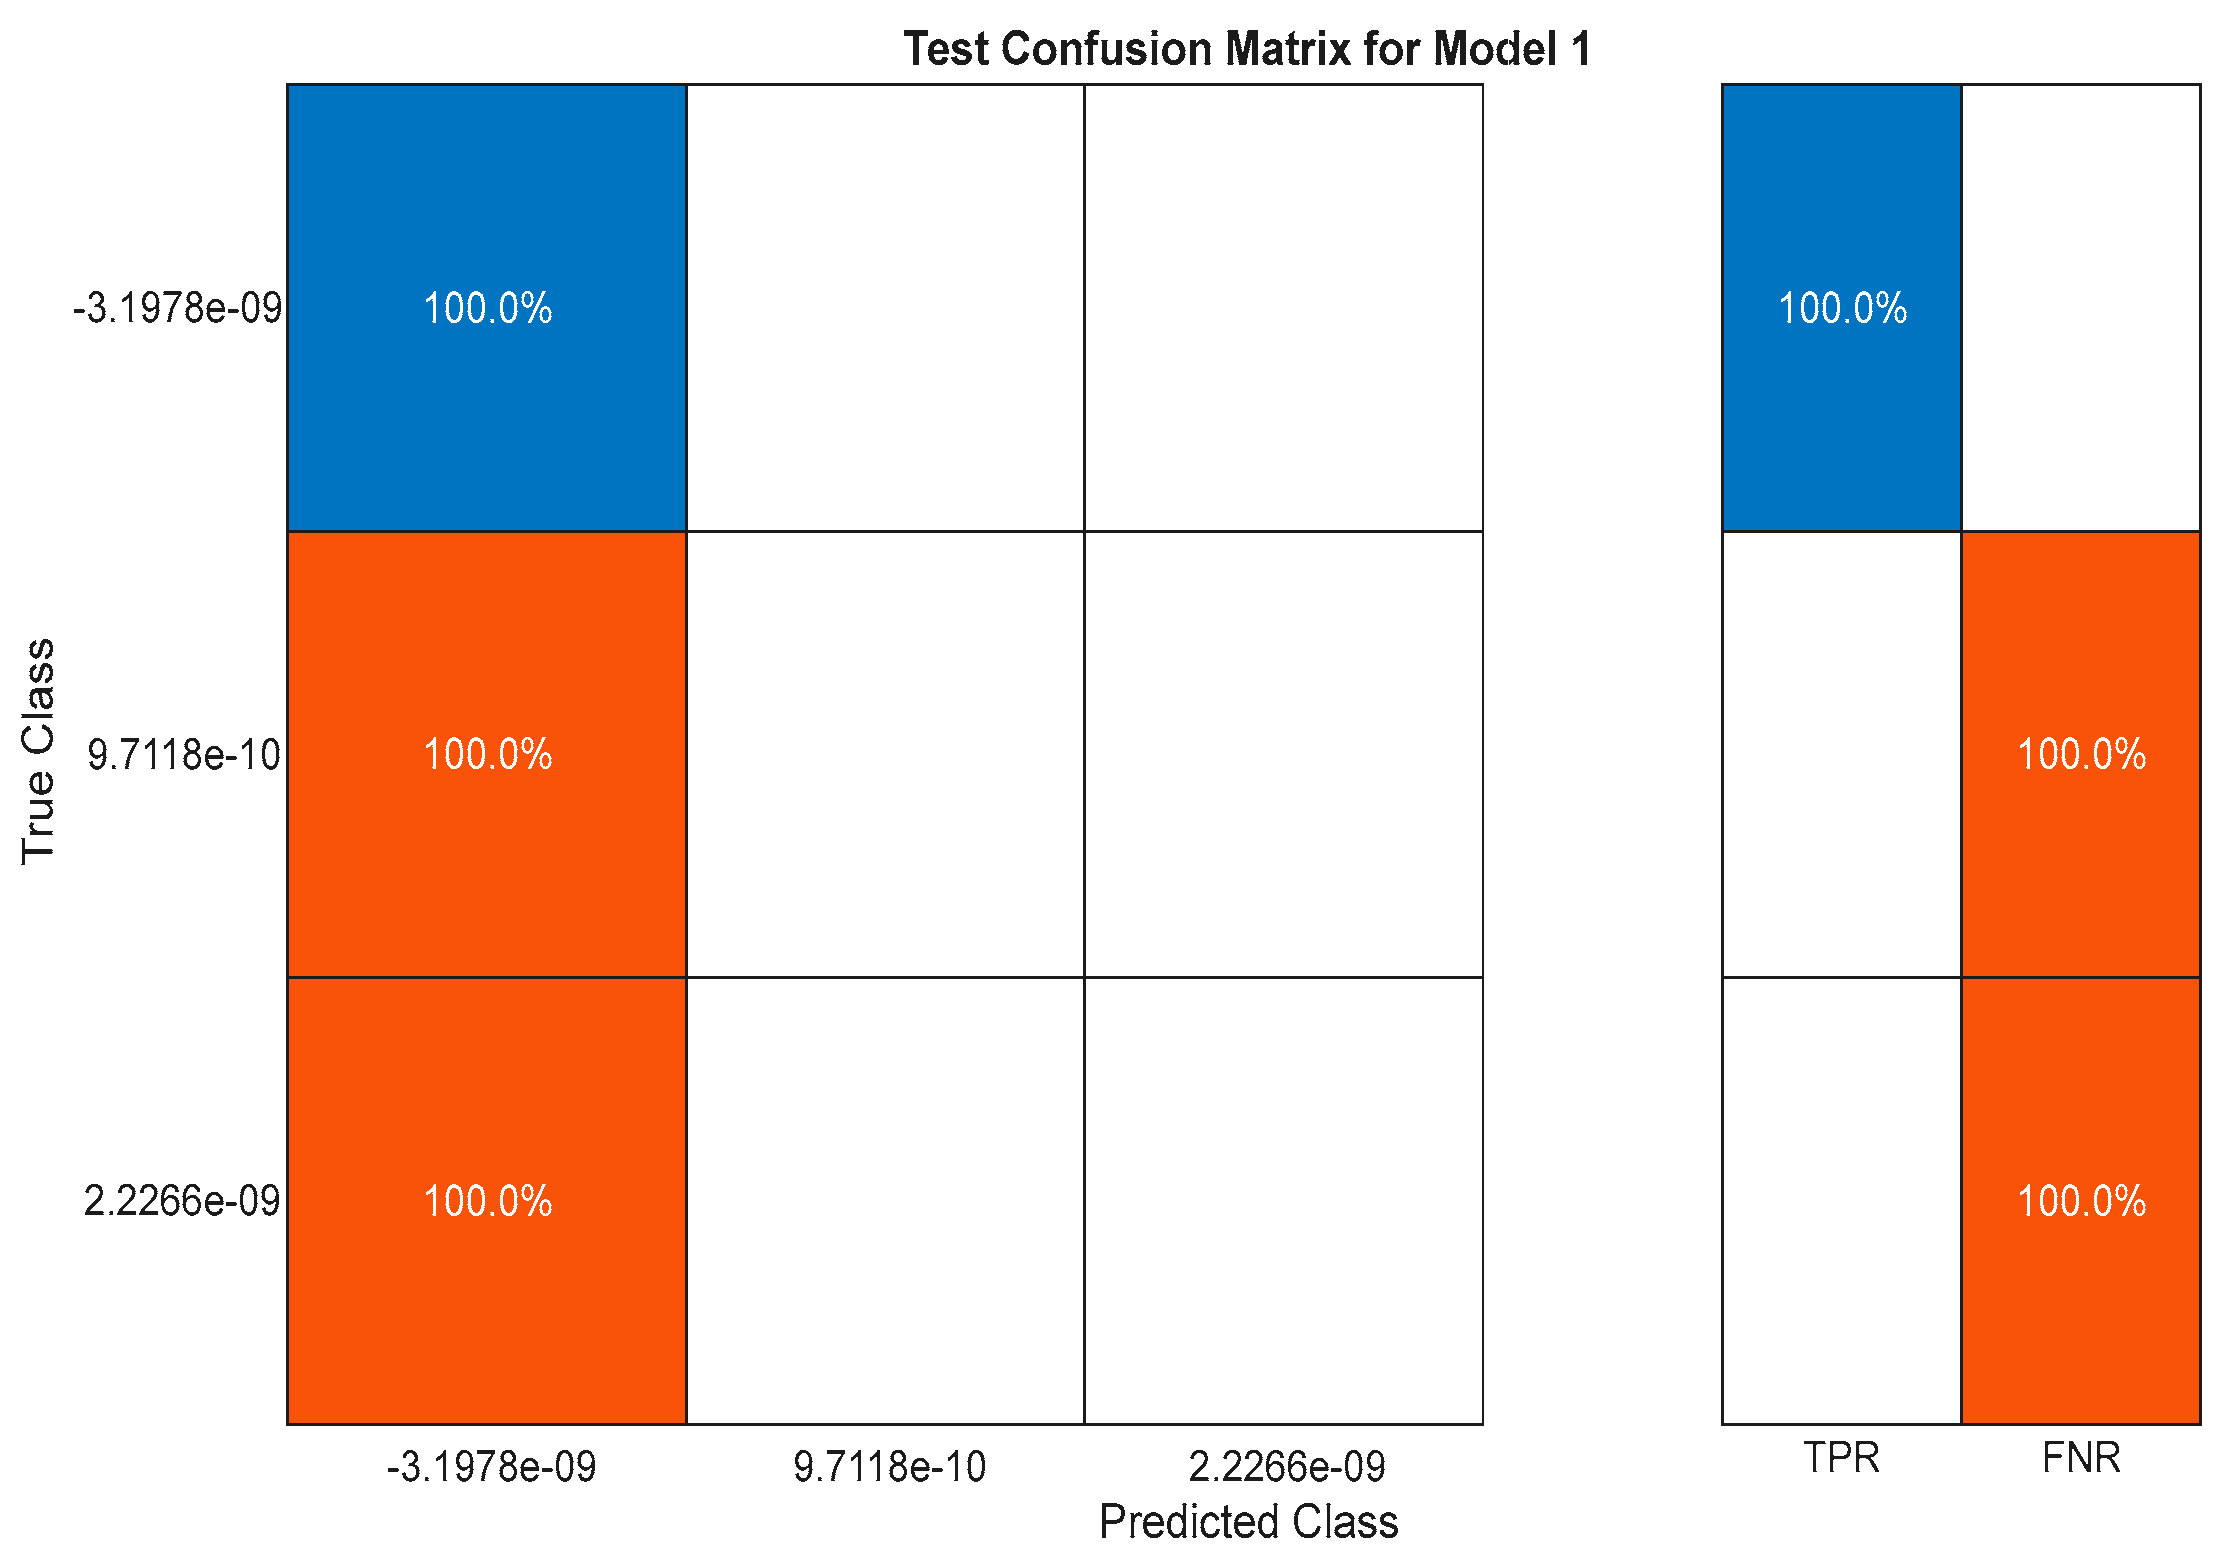
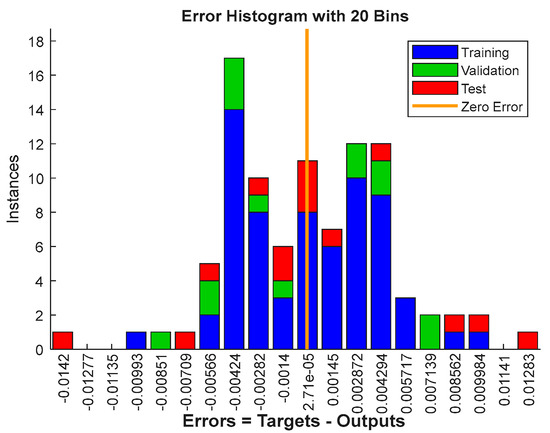
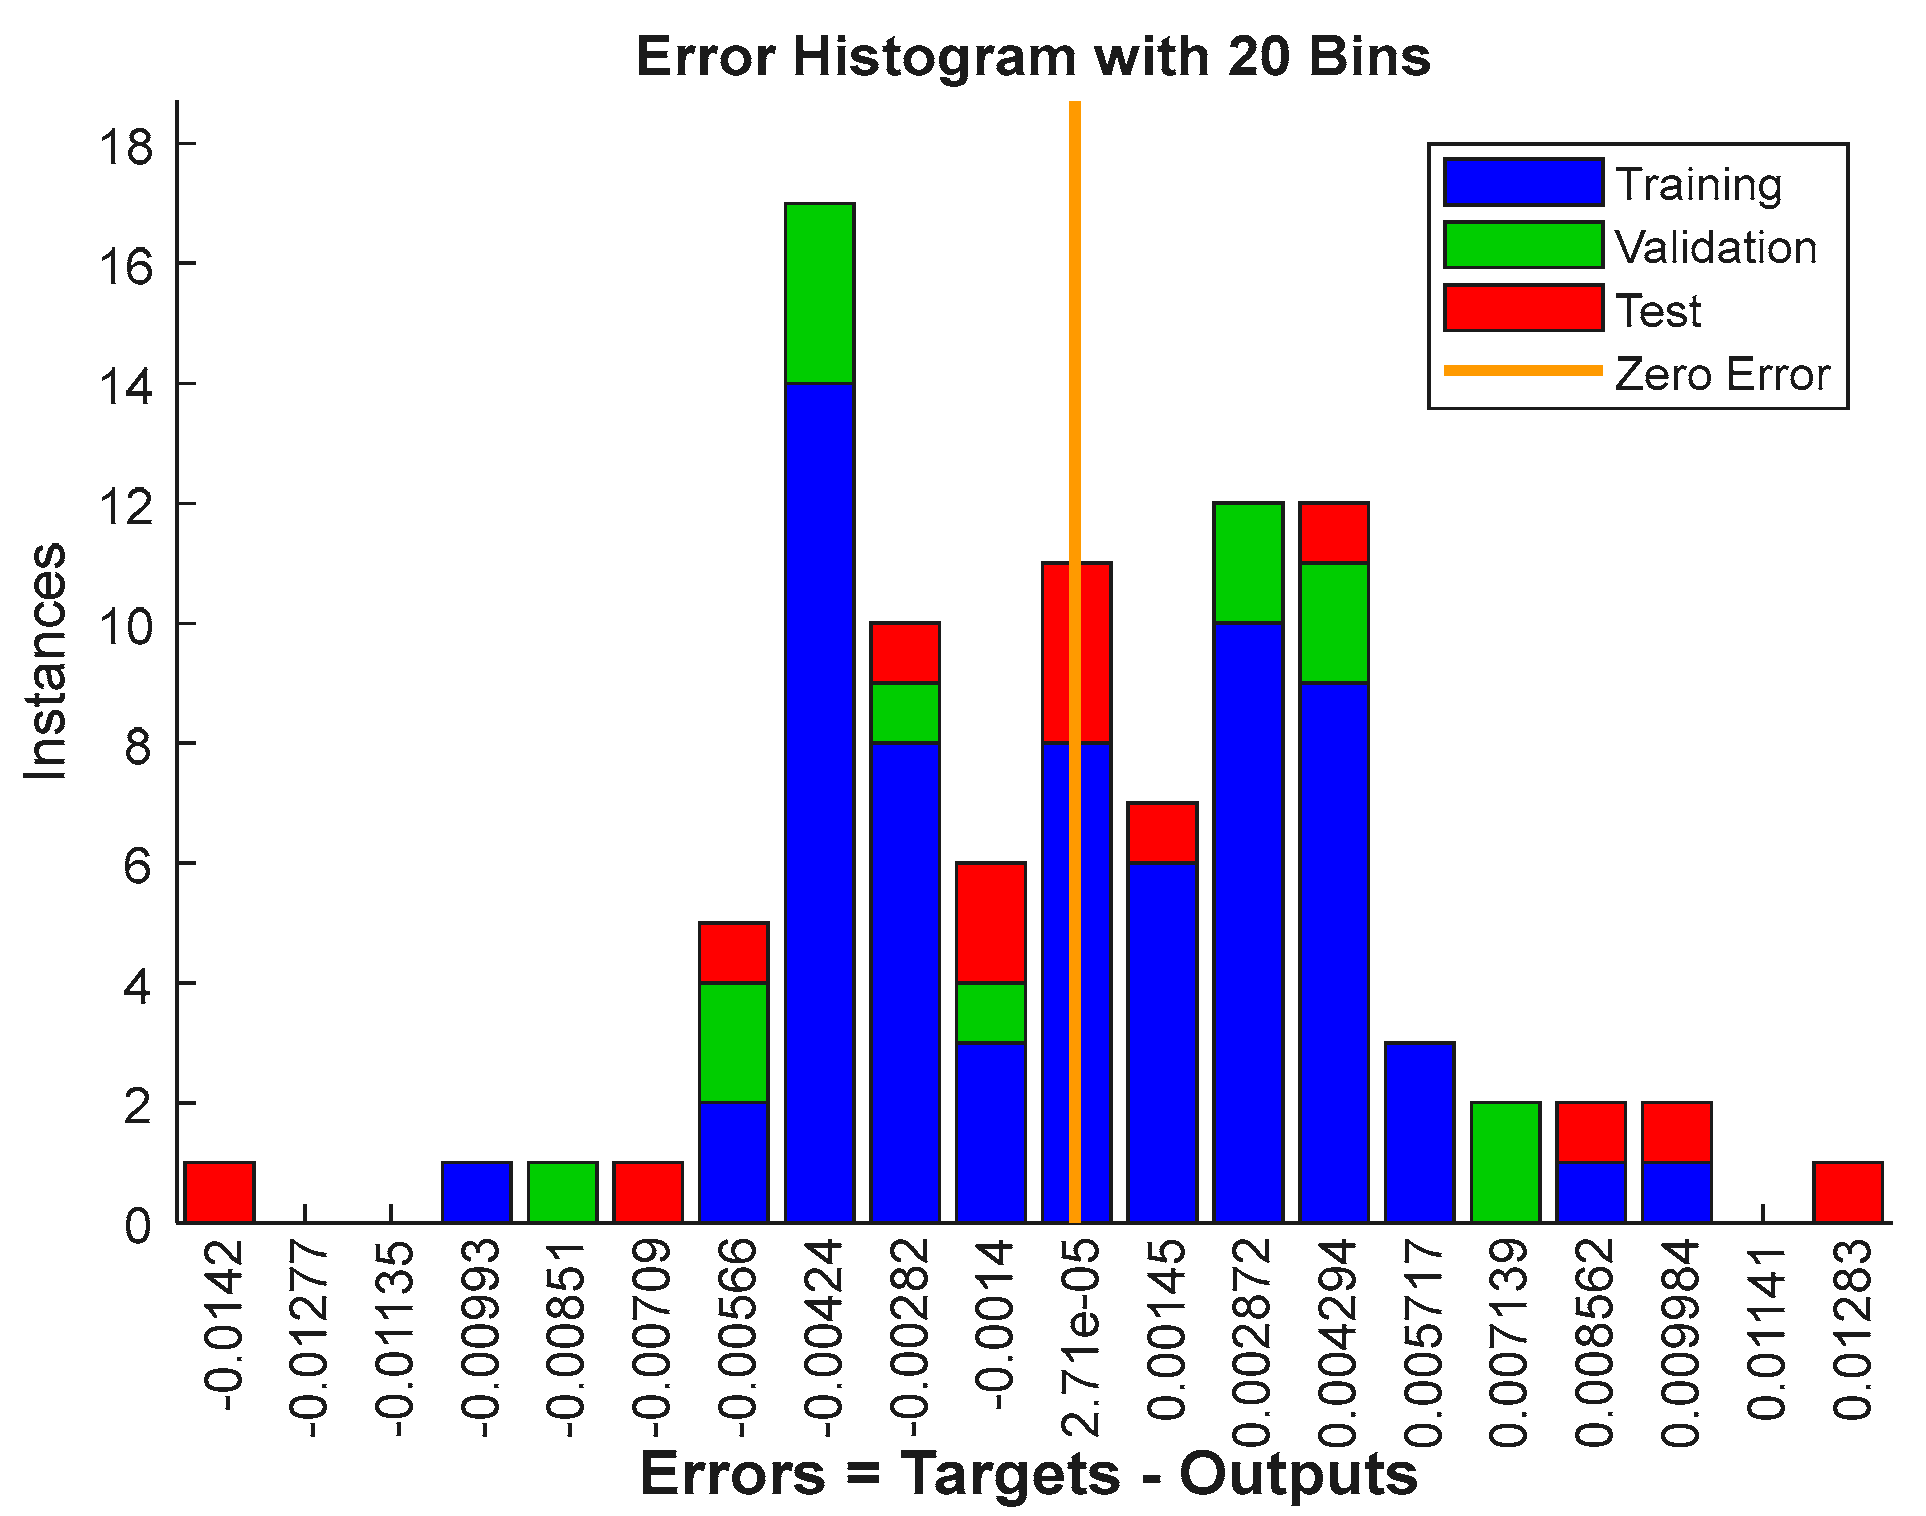
The confusion matrix in Figure 12 shows the absence of false negative and false positives, highlighting the robustness of the ANN-based fault classification system. The error histogram (Figure 13) illustrates the distribution of errors across fault scenarios. Most classification errors lie close to zero, signifying the high accuracy of the ANN in detecting faults. A few outliers are noted, suggesting areas for fine-tuning, particularly for complex fault patterns. The model has a 100% true positive rate (TPR) and 0% false negative rate (FNR), indicating accurate fault identification. The model’s overall accuracy is 100%, indicating perfect performance in the test set.
Figure 12.
Performance evaluation tool with 100% accuracy on fault classification.
Figure 13.
Neural network-fault errors histogram.
5. Simulation Results
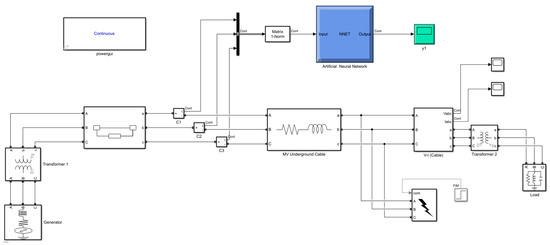
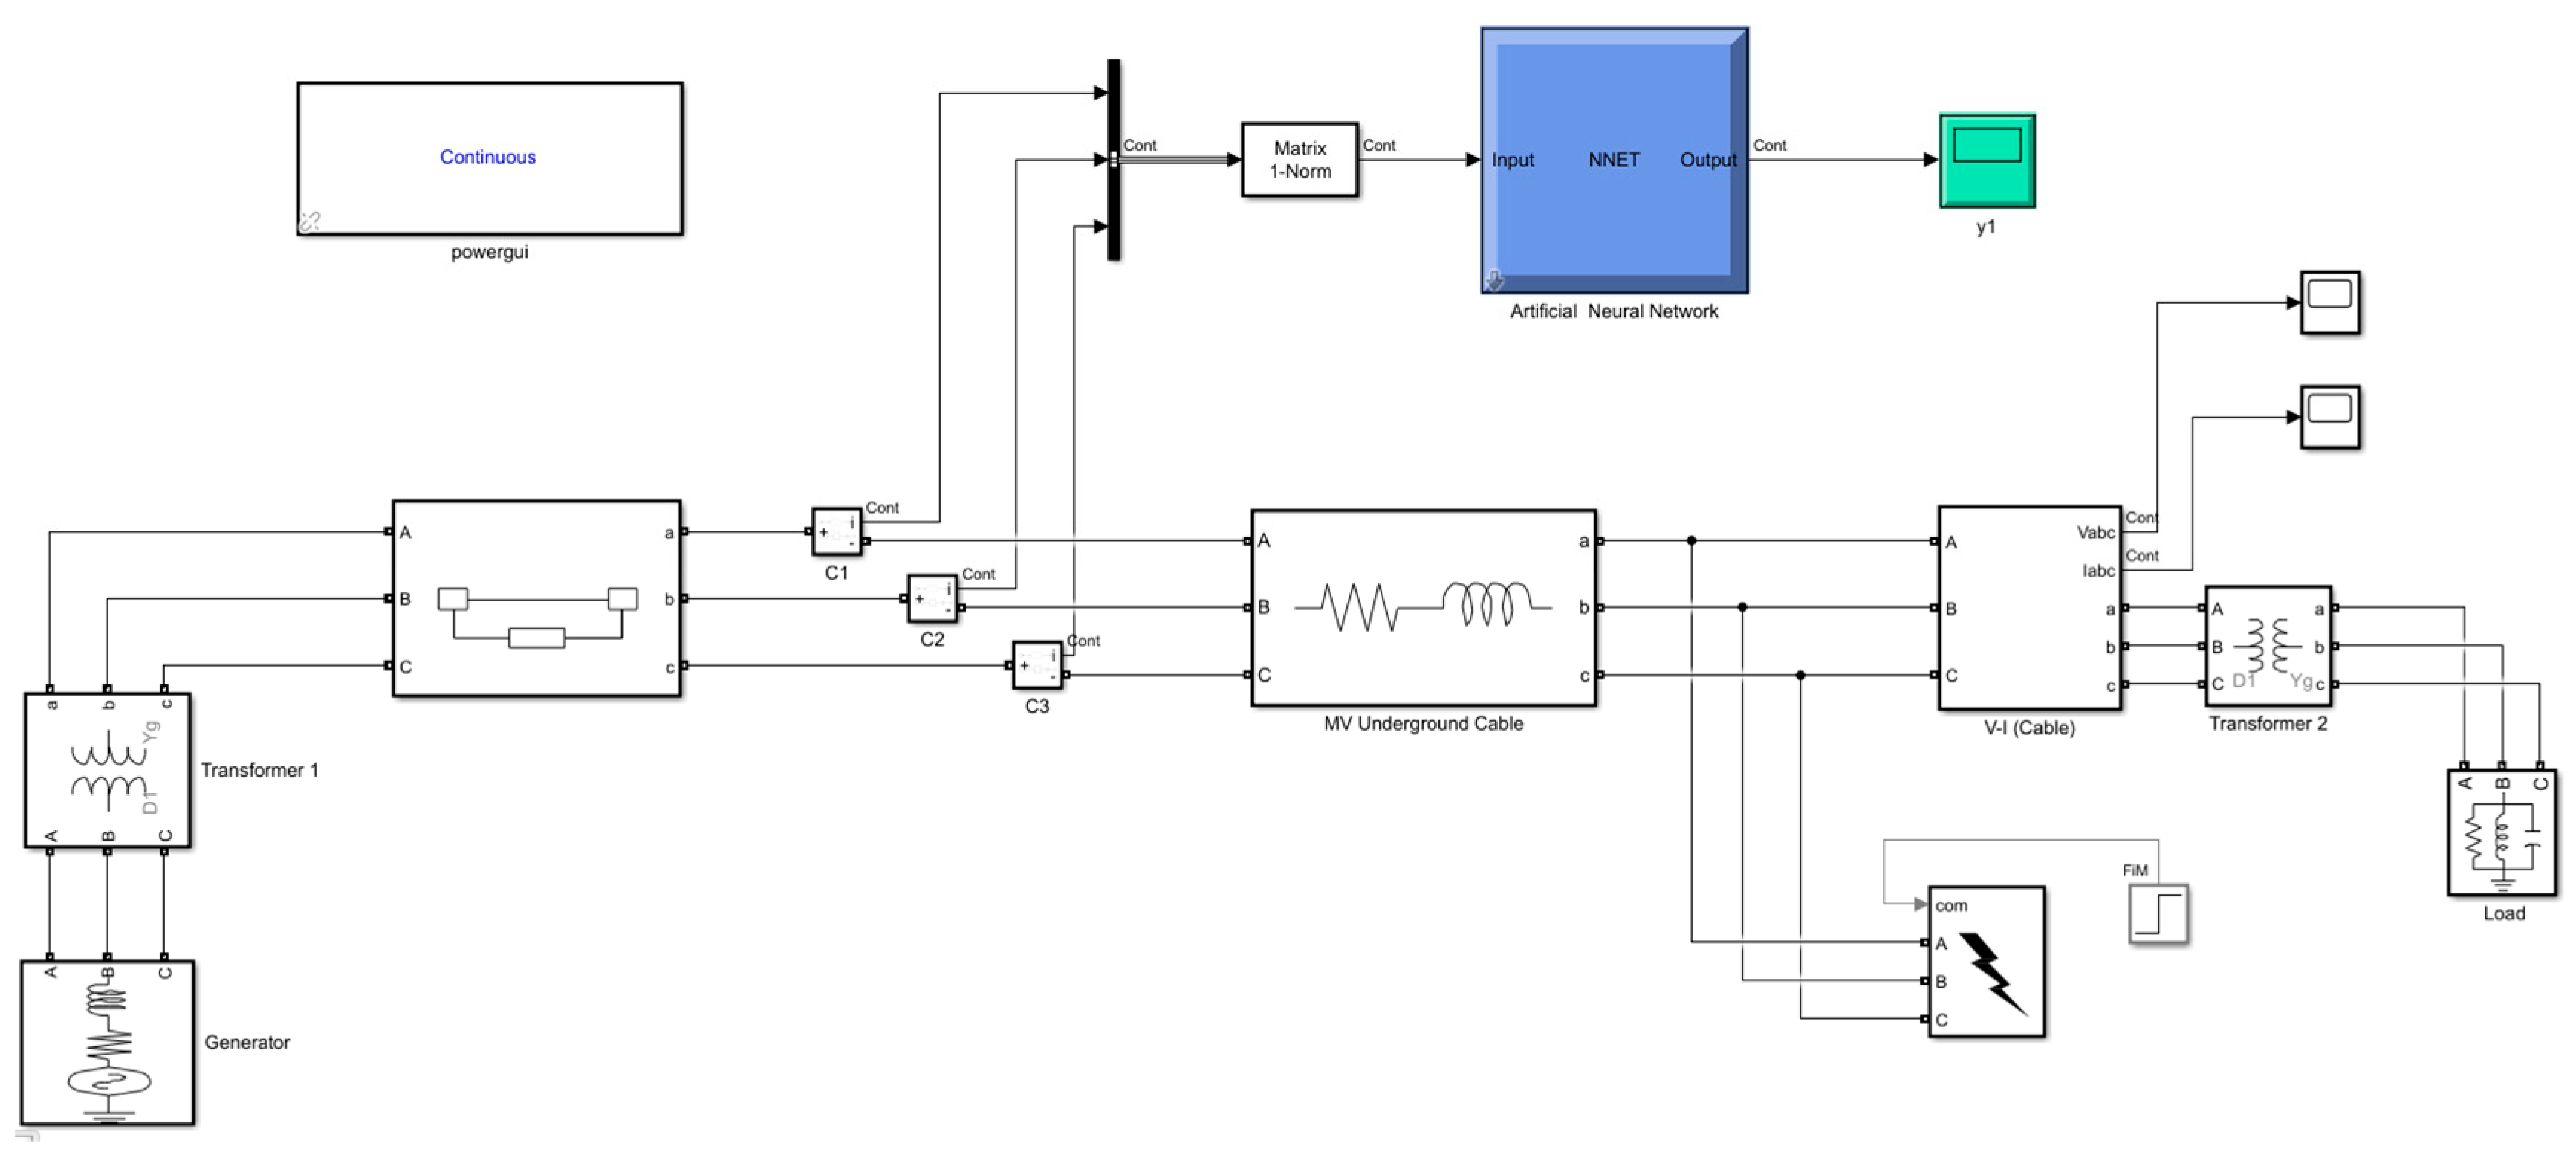
Figure 14 represents a Simulink model designed to implement an ANN for fault detection and classification in MV underground cables. The model below is used to evaluate and analyze the performance of the ANN for different fault scenarios occurring in the MV underground cable distribution systems. The faults are introduced and are detected and classified by the trained ANN during the simulation.
Figure 14.
Simulink ANN-based MV underground cable model.
This ANN-based model is constructed using the MV underground cable model, fault generation block, measurement block, signal preprocessing and feature extraction, and the artificial neural network (ANN) model. The model is justified using the key tasks that include:
Real-time capability: Simulink’s 2024b dynamic simulation environment makes it ideal for implementing and testing real-time fault detection techniques. Modular Design: The model integrates signal processing, ANN training, and classification in a seamless workflow.
Customizability: Allows easy adjustments to system parameters (e.g., cable length, fault types, and noise levels) for extensive testing. Validation: Simulink provides tools for validating ANN performance under diverse scenarios, ensuring robustness and reliability.
5.1. Line-to-Ground Fault (L-G)
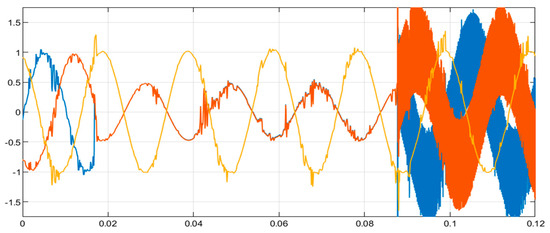
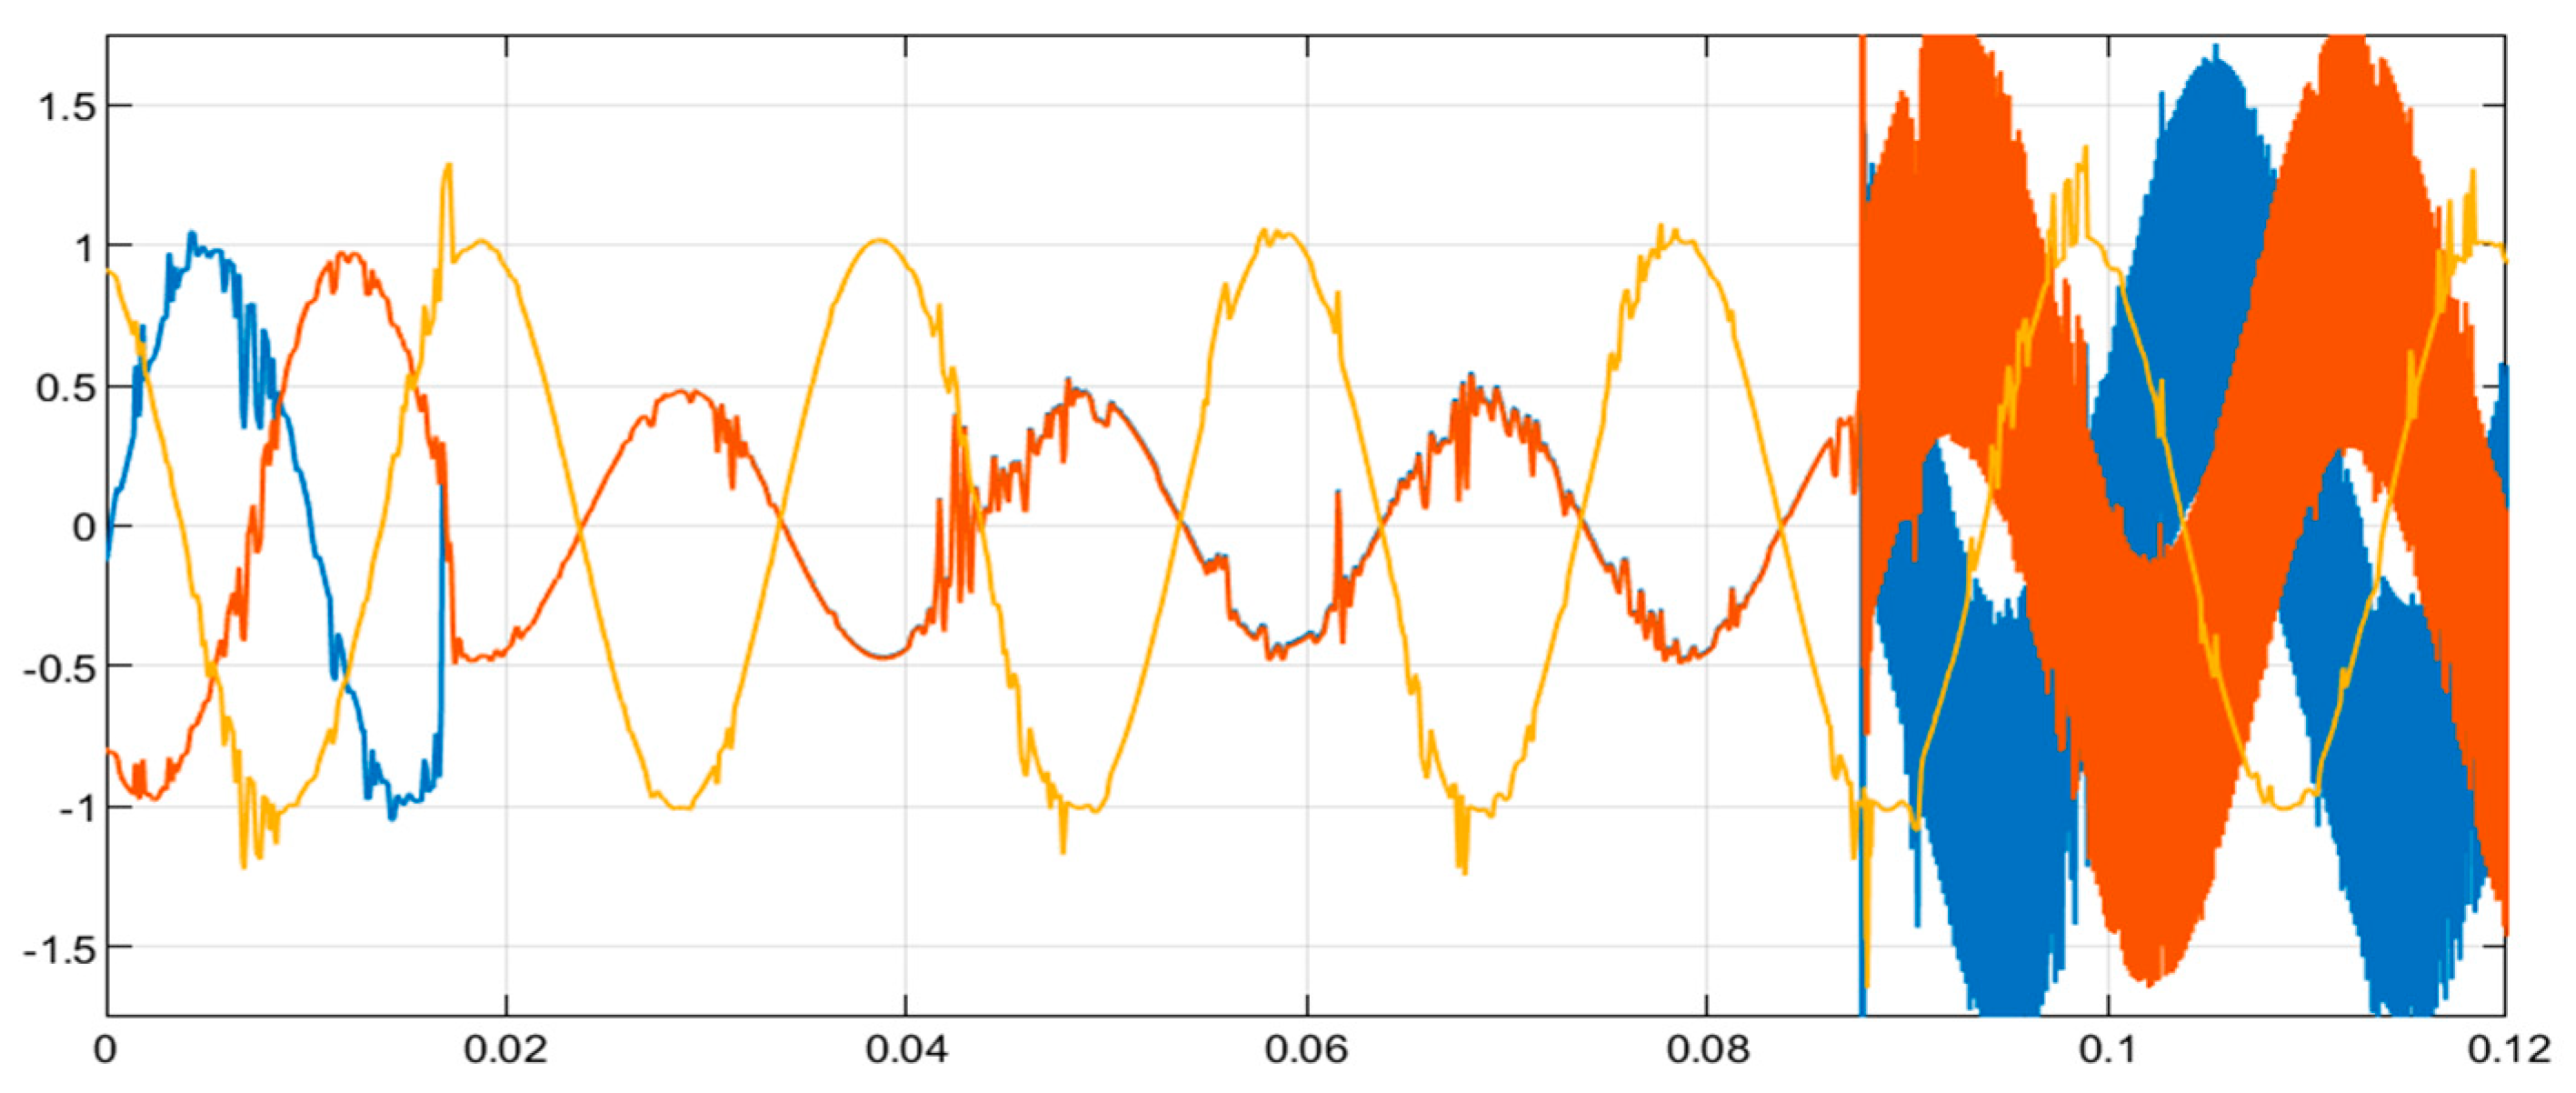
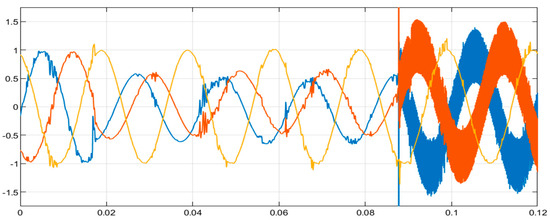
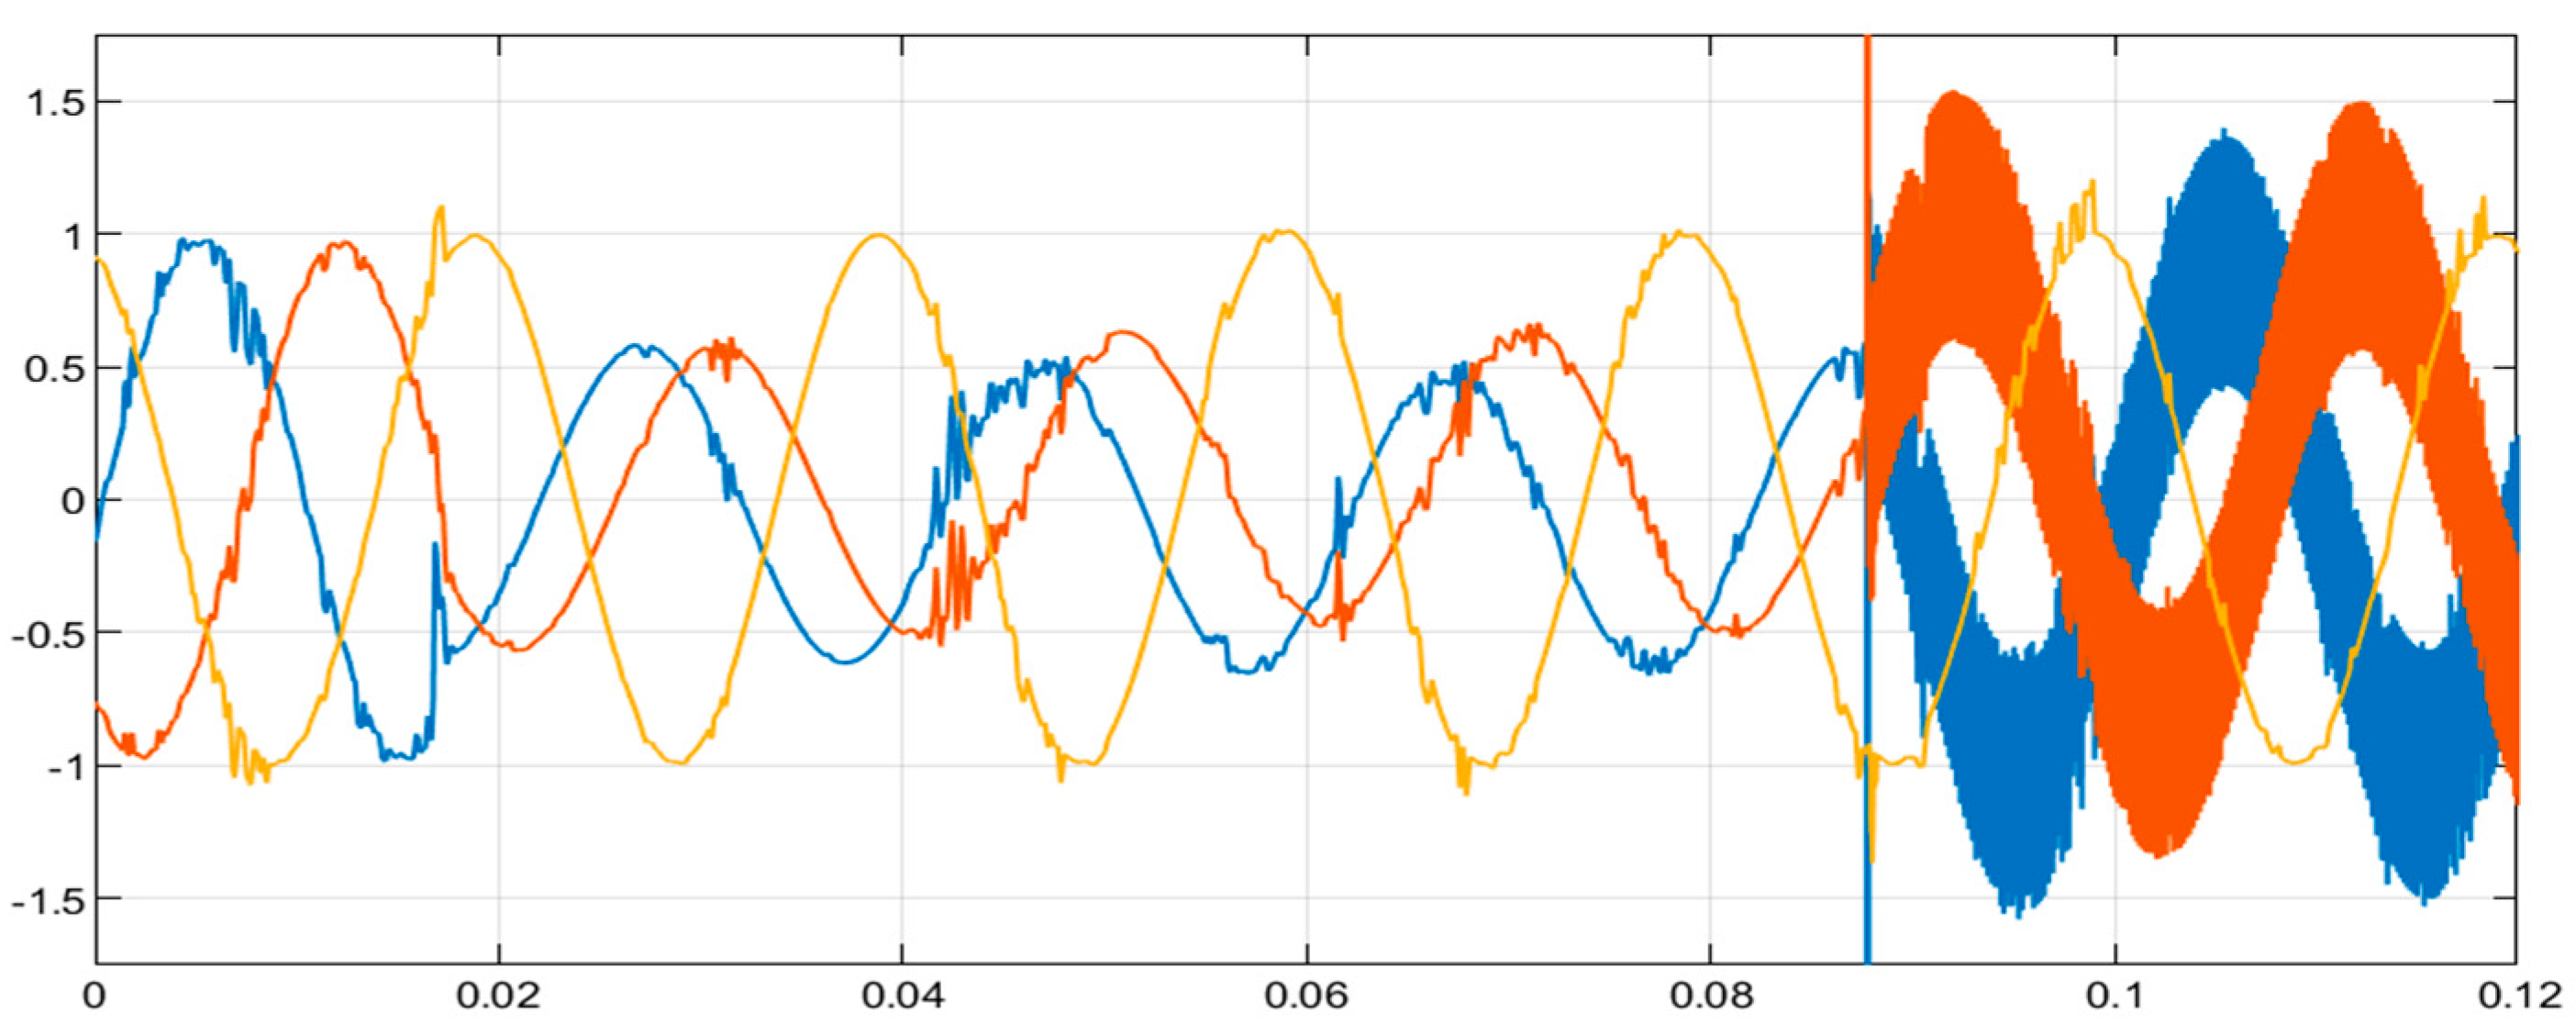
Figure 15 and Figure 16 are the current and voltage waveform. The spike in one phase (Figure 16), indicating a fault in the L-G fault. A faulty wire that is immediately connected to the ground by means of a notable spike in one phase of the current waveform.
Figure 15.
ANN technique fault-current waveform (L-G).
Figure 16.
ANN technique fault-voltage waveform (L-G).
5.2. Line-to-Line Fault (L-L)
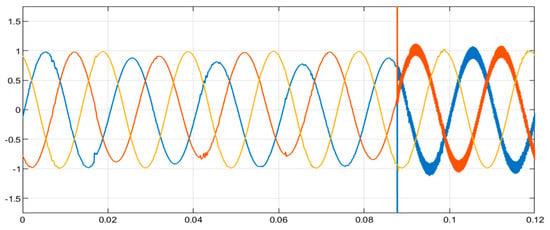
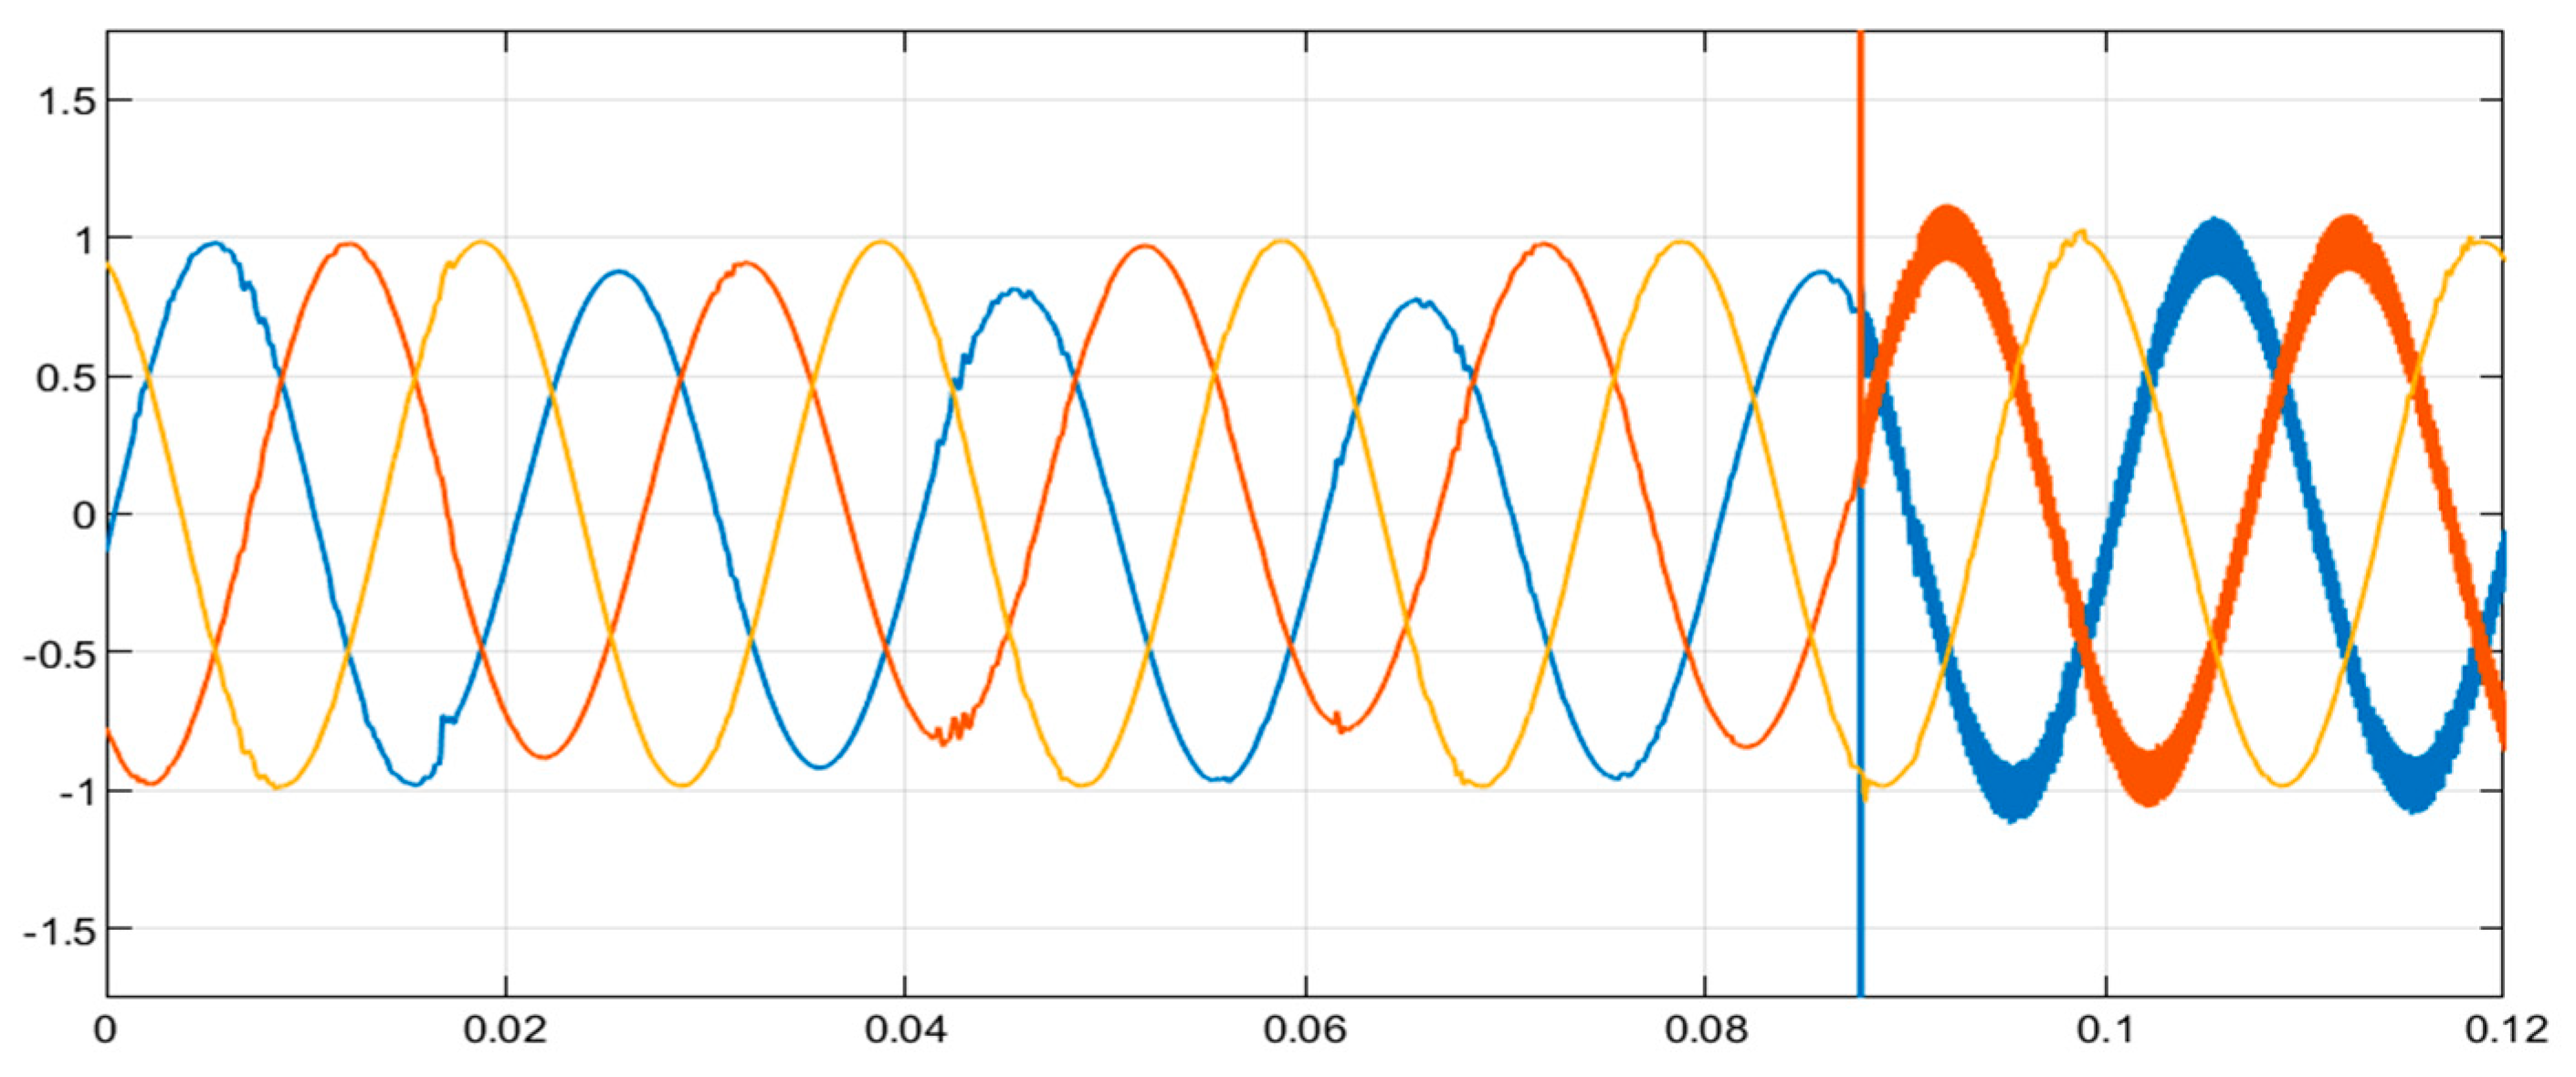
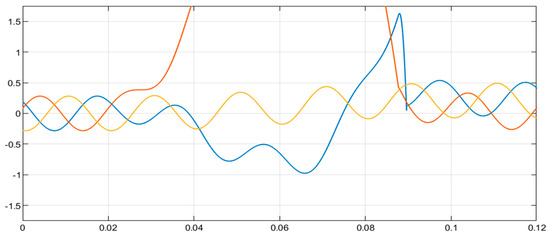
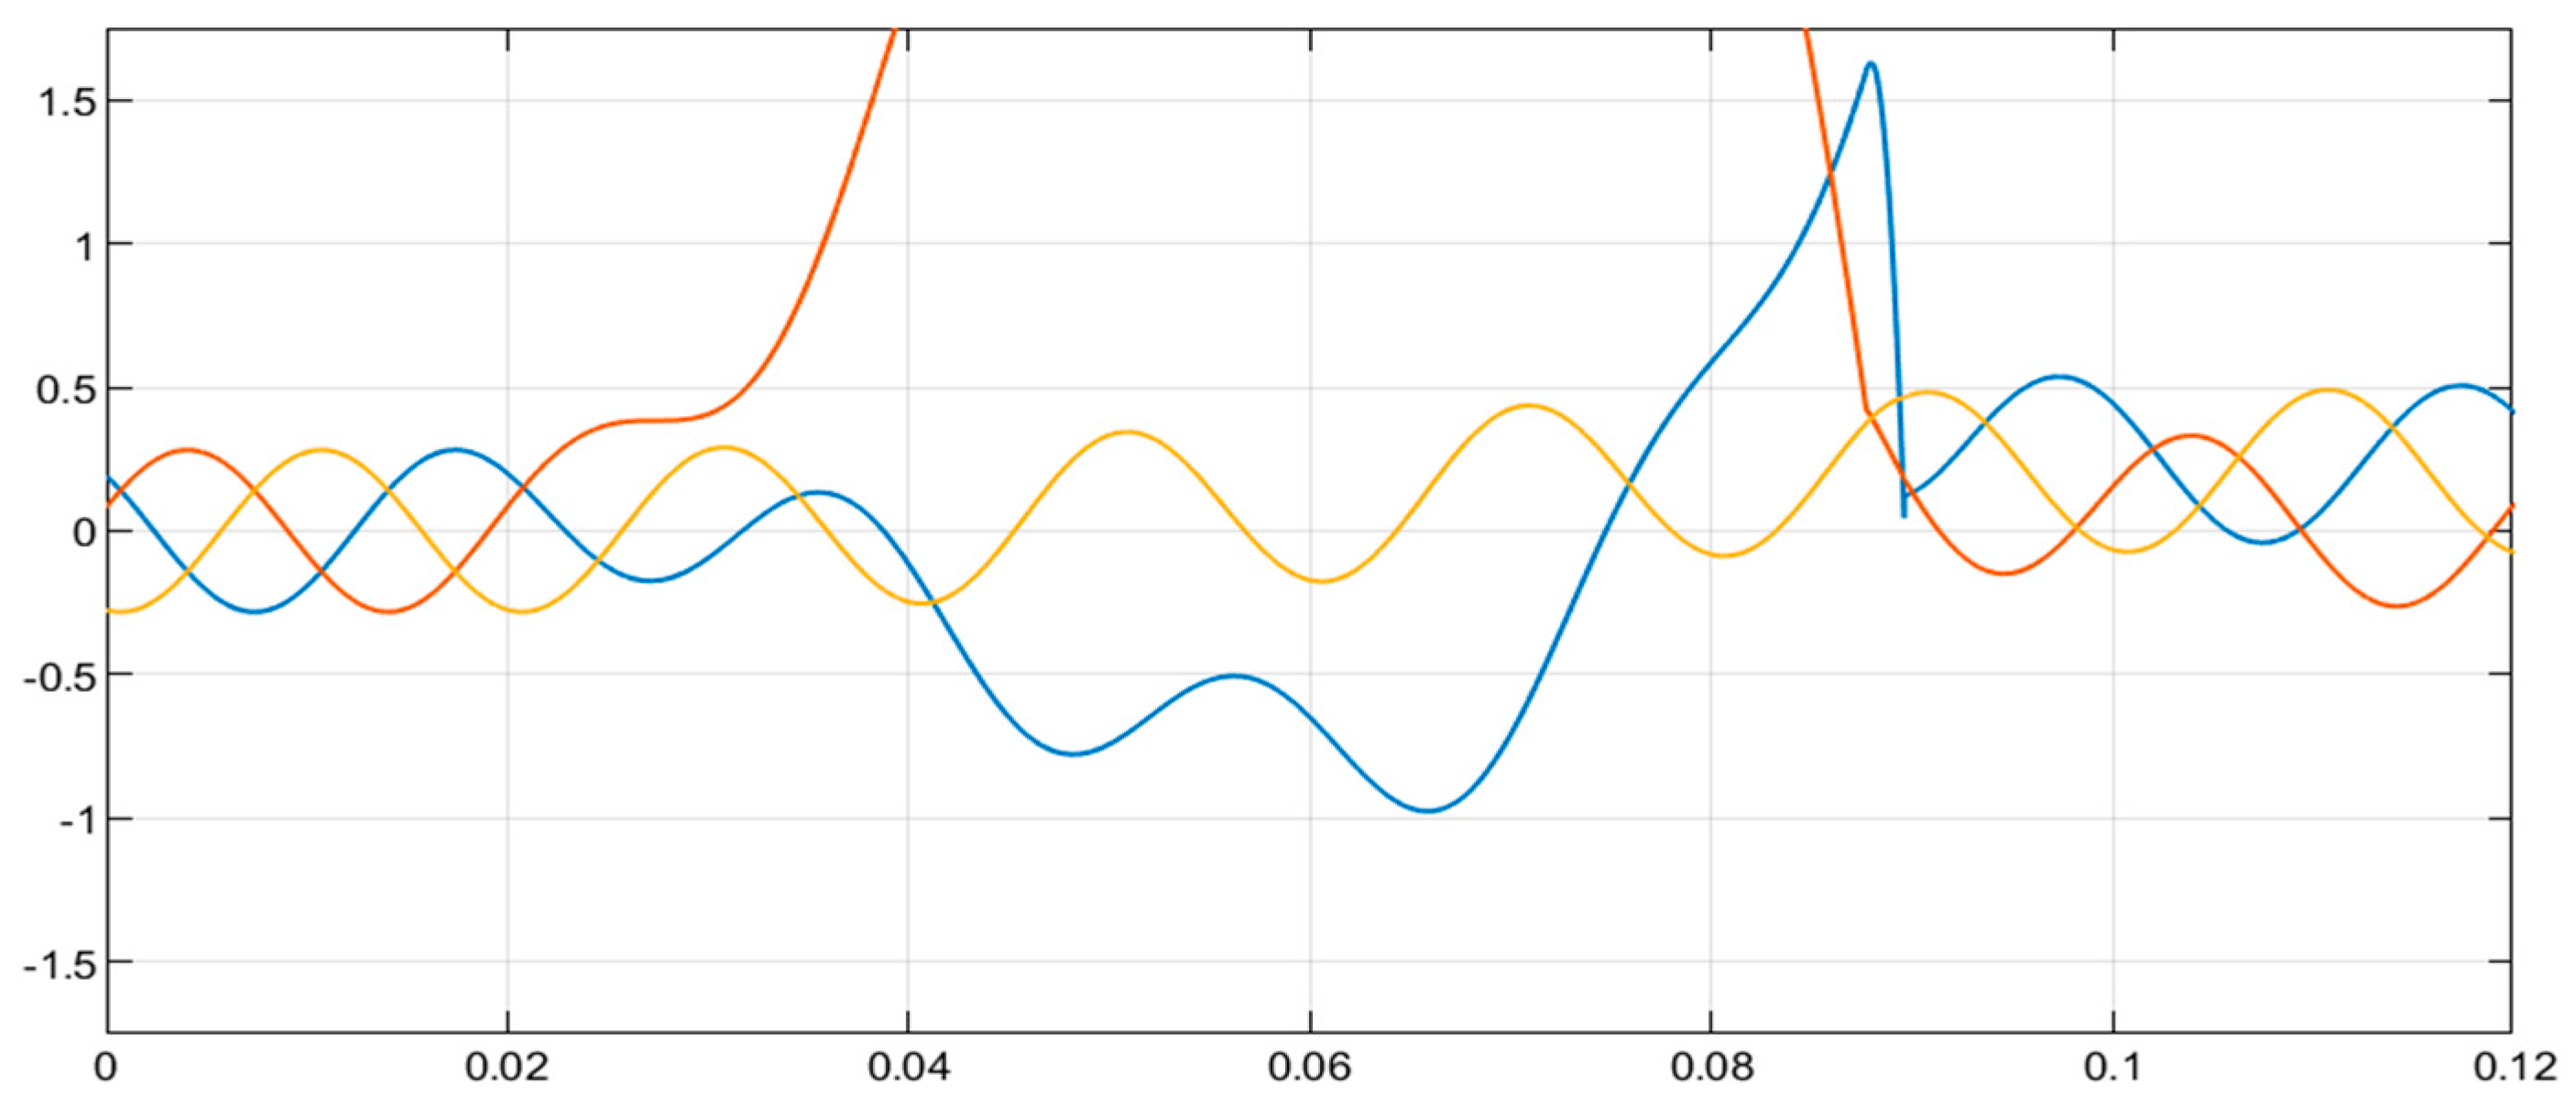
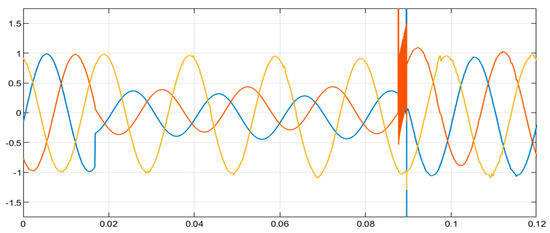
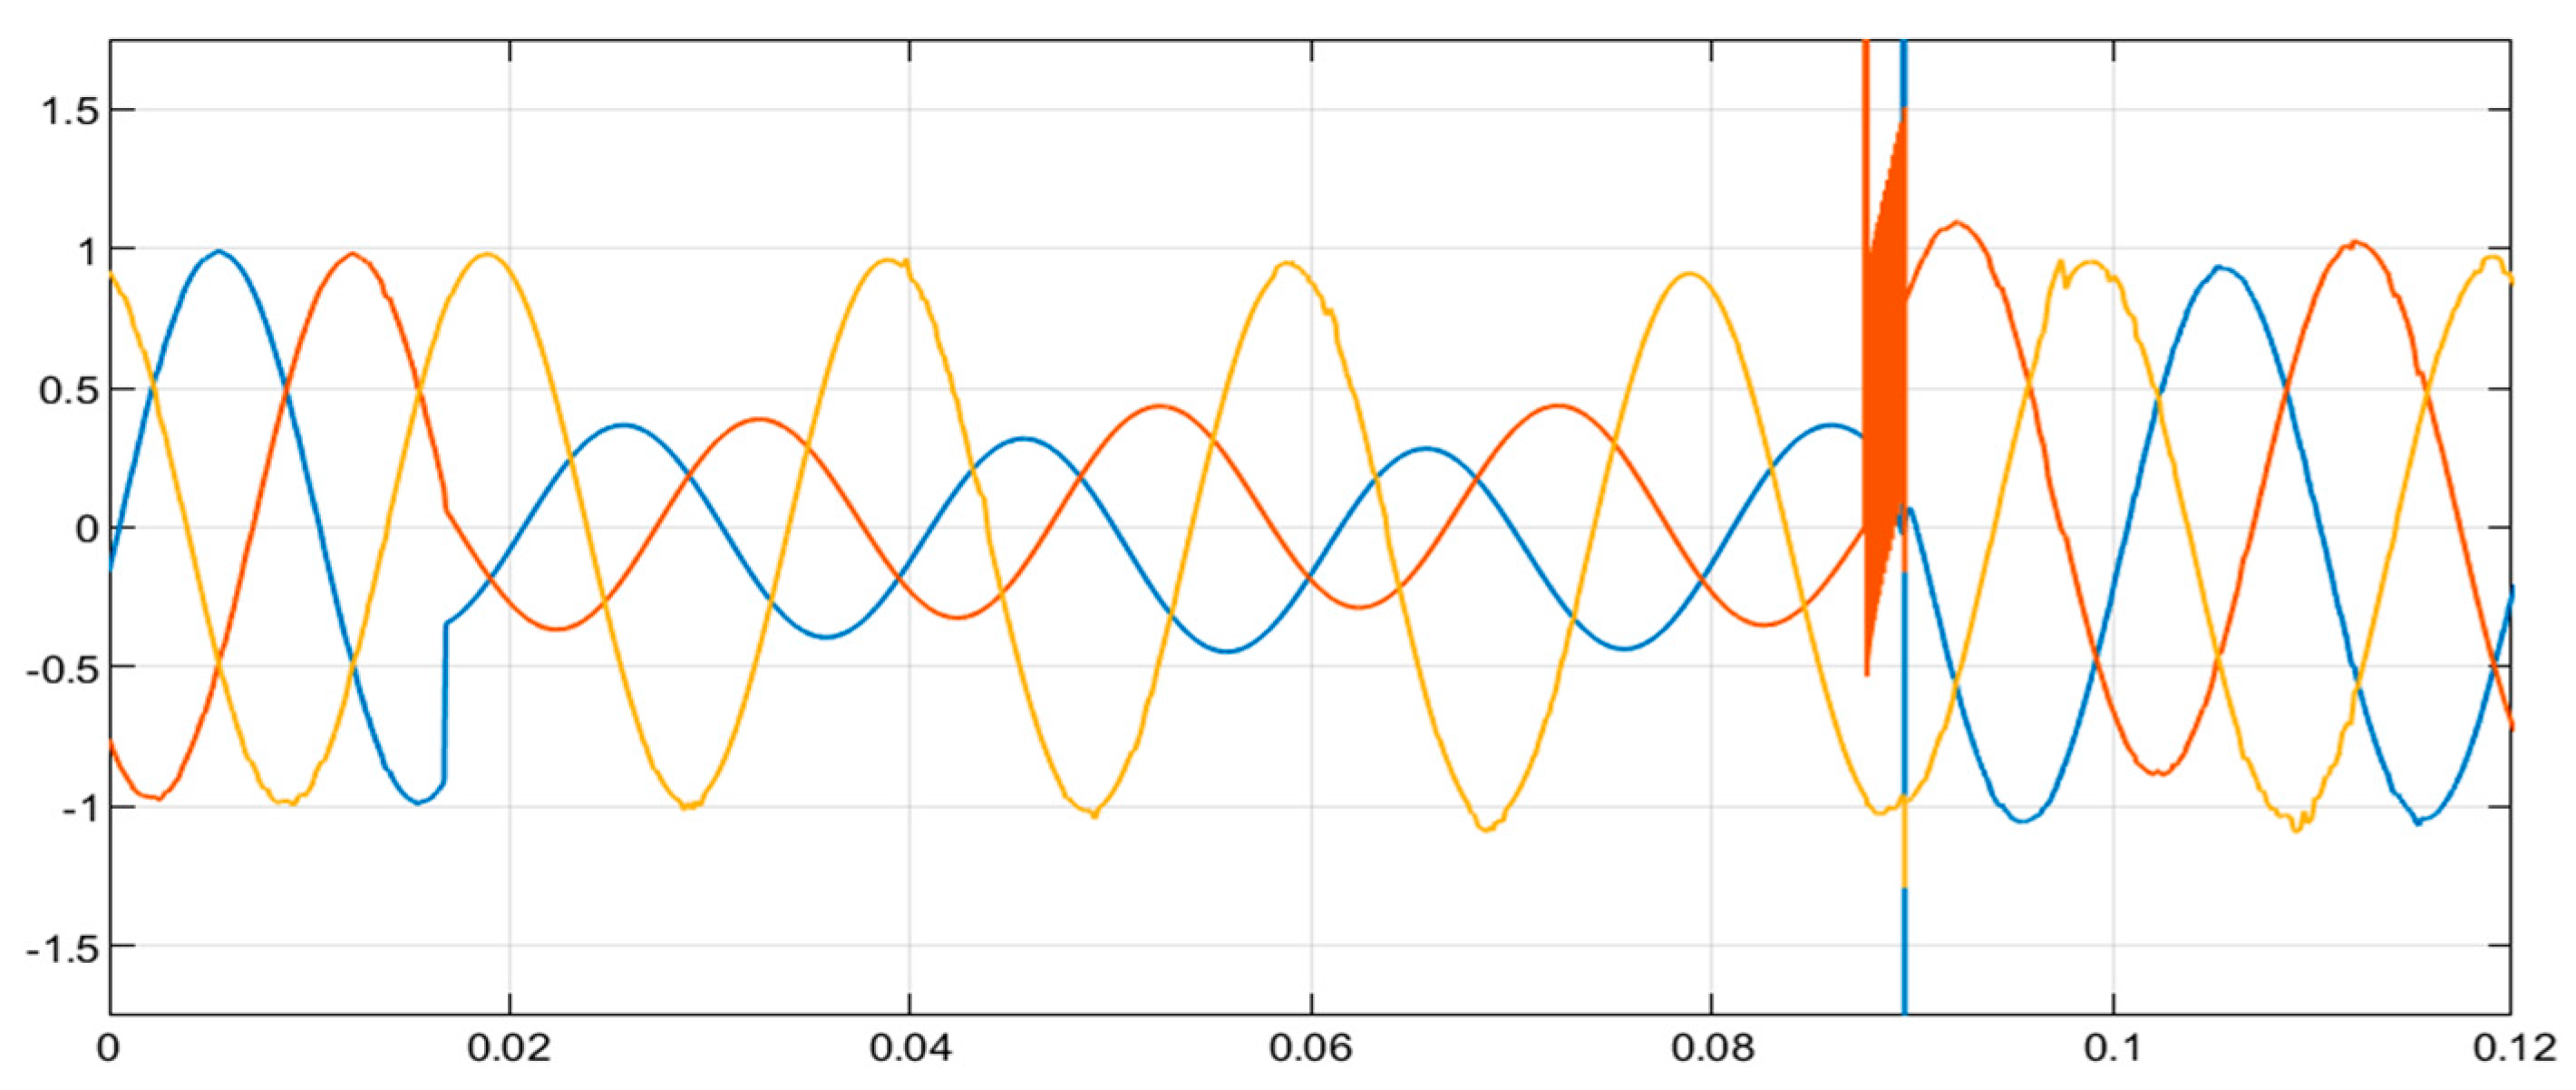
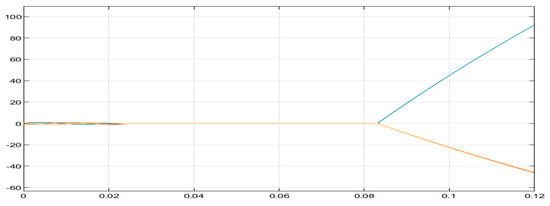
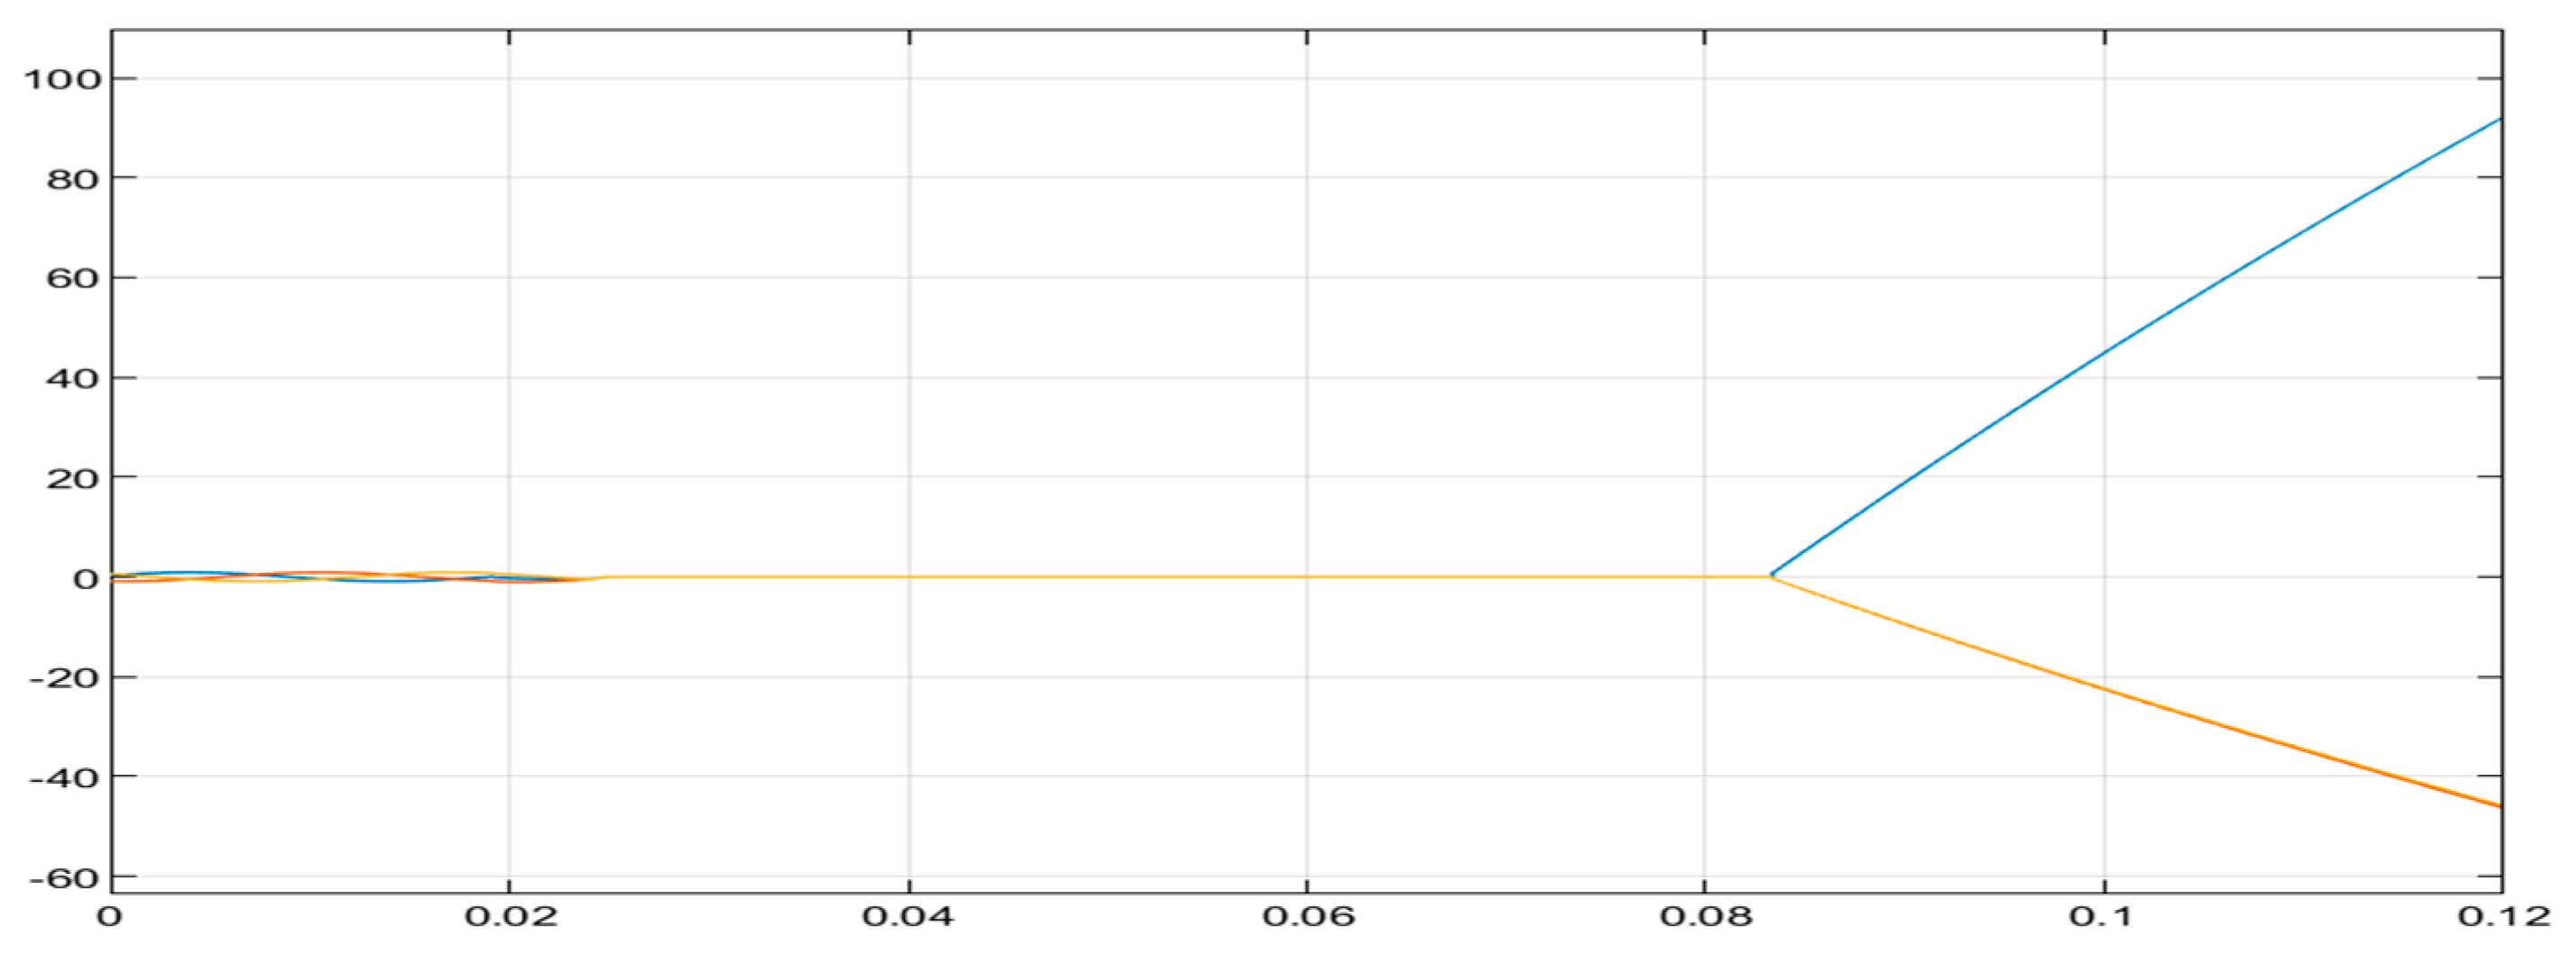
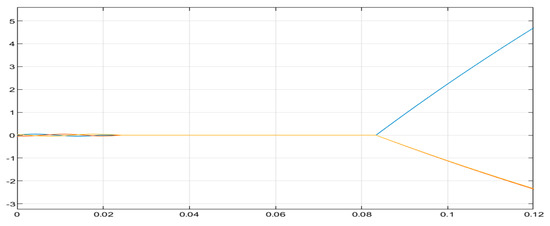
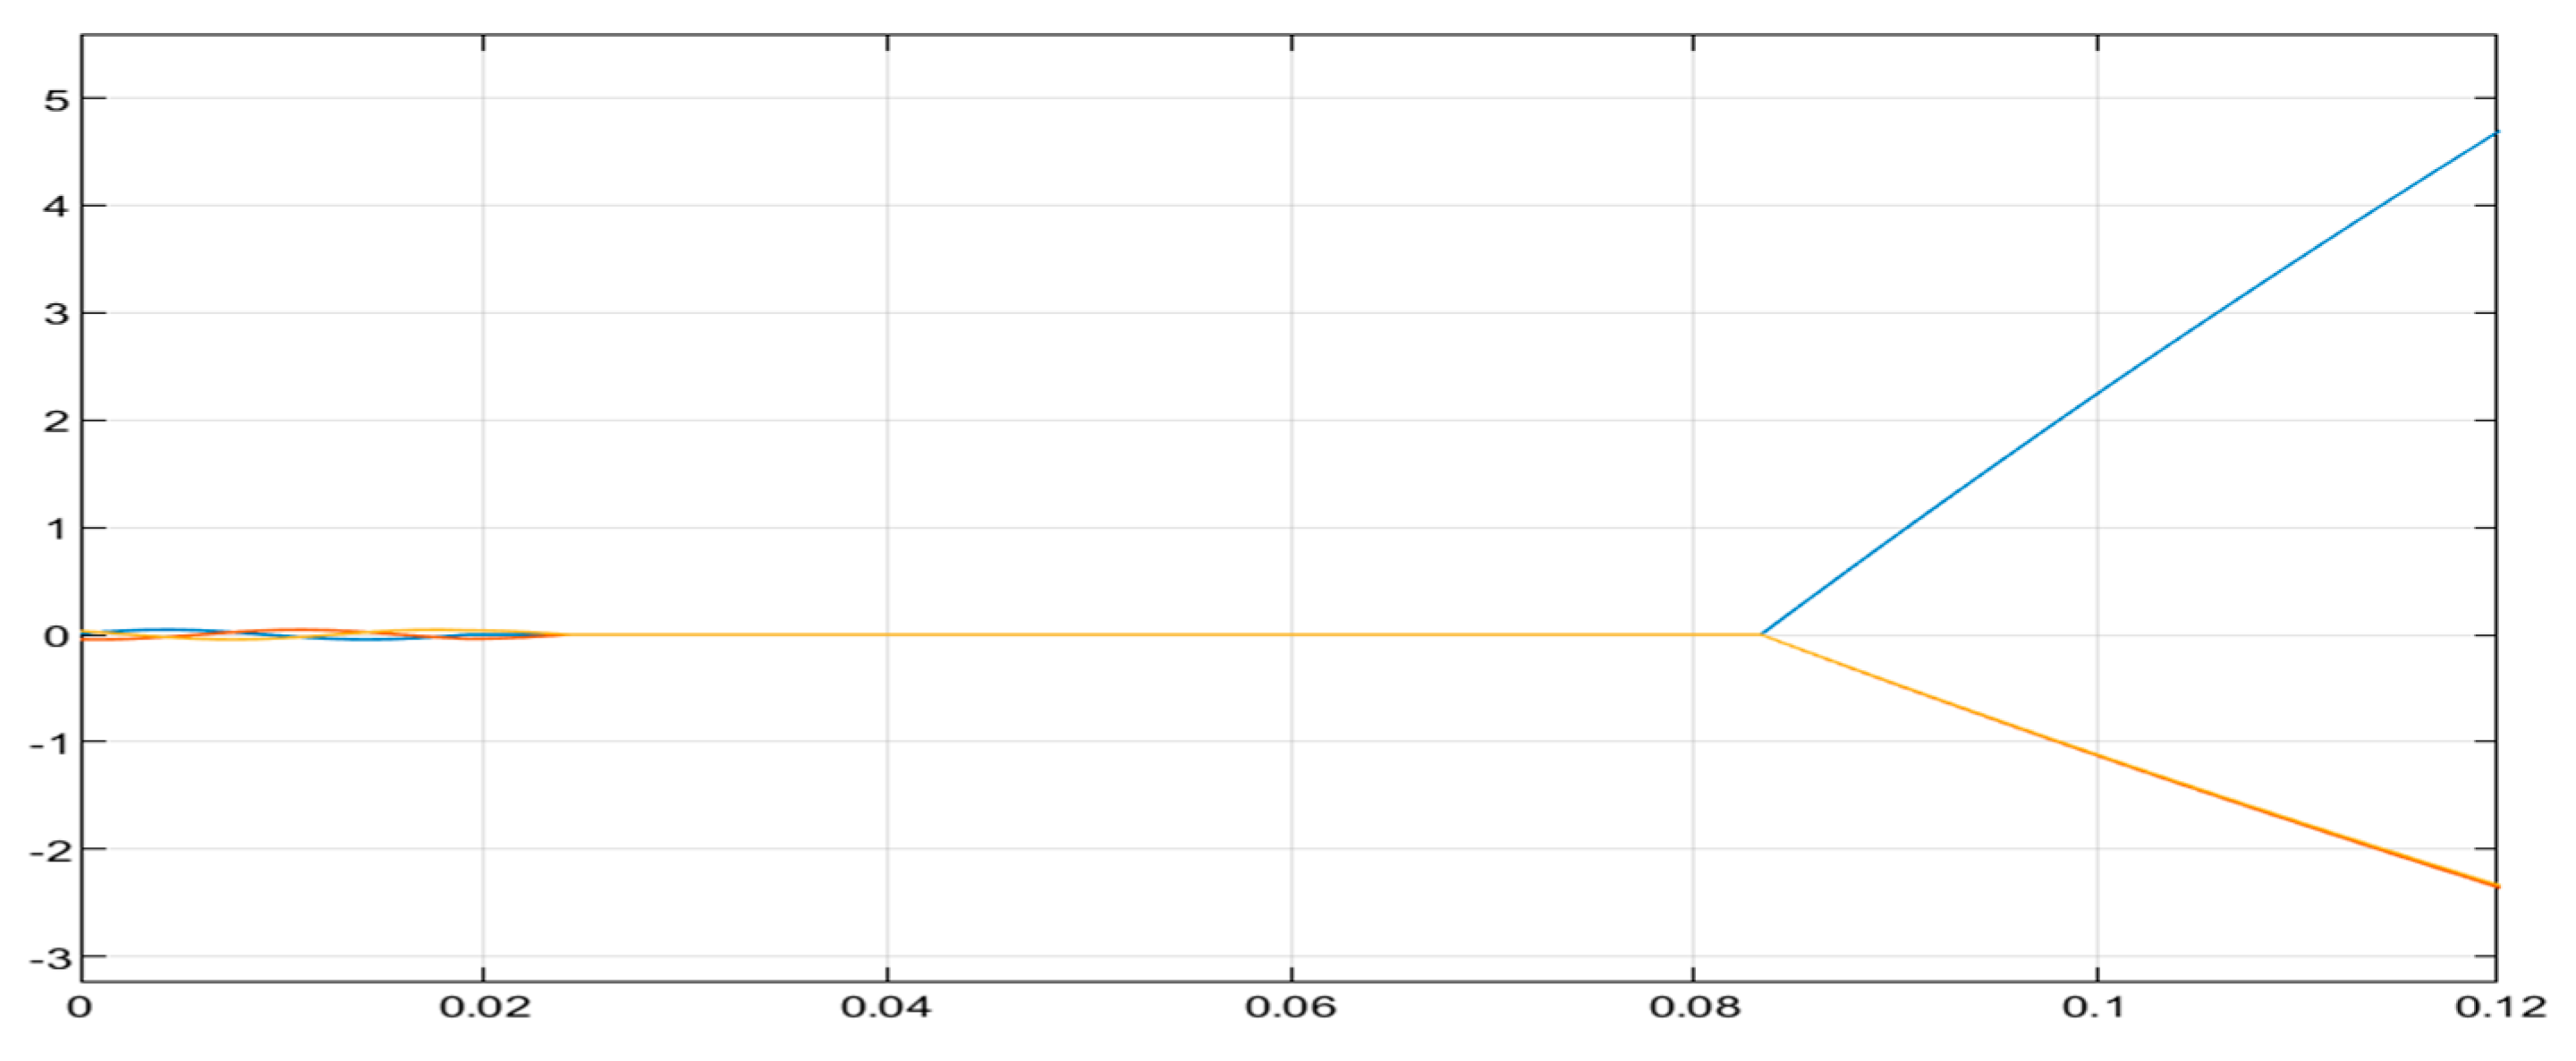
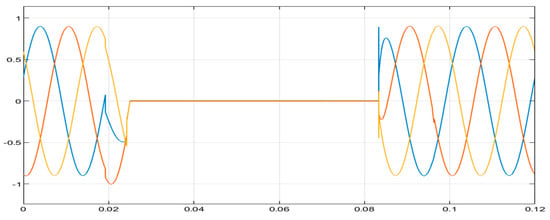
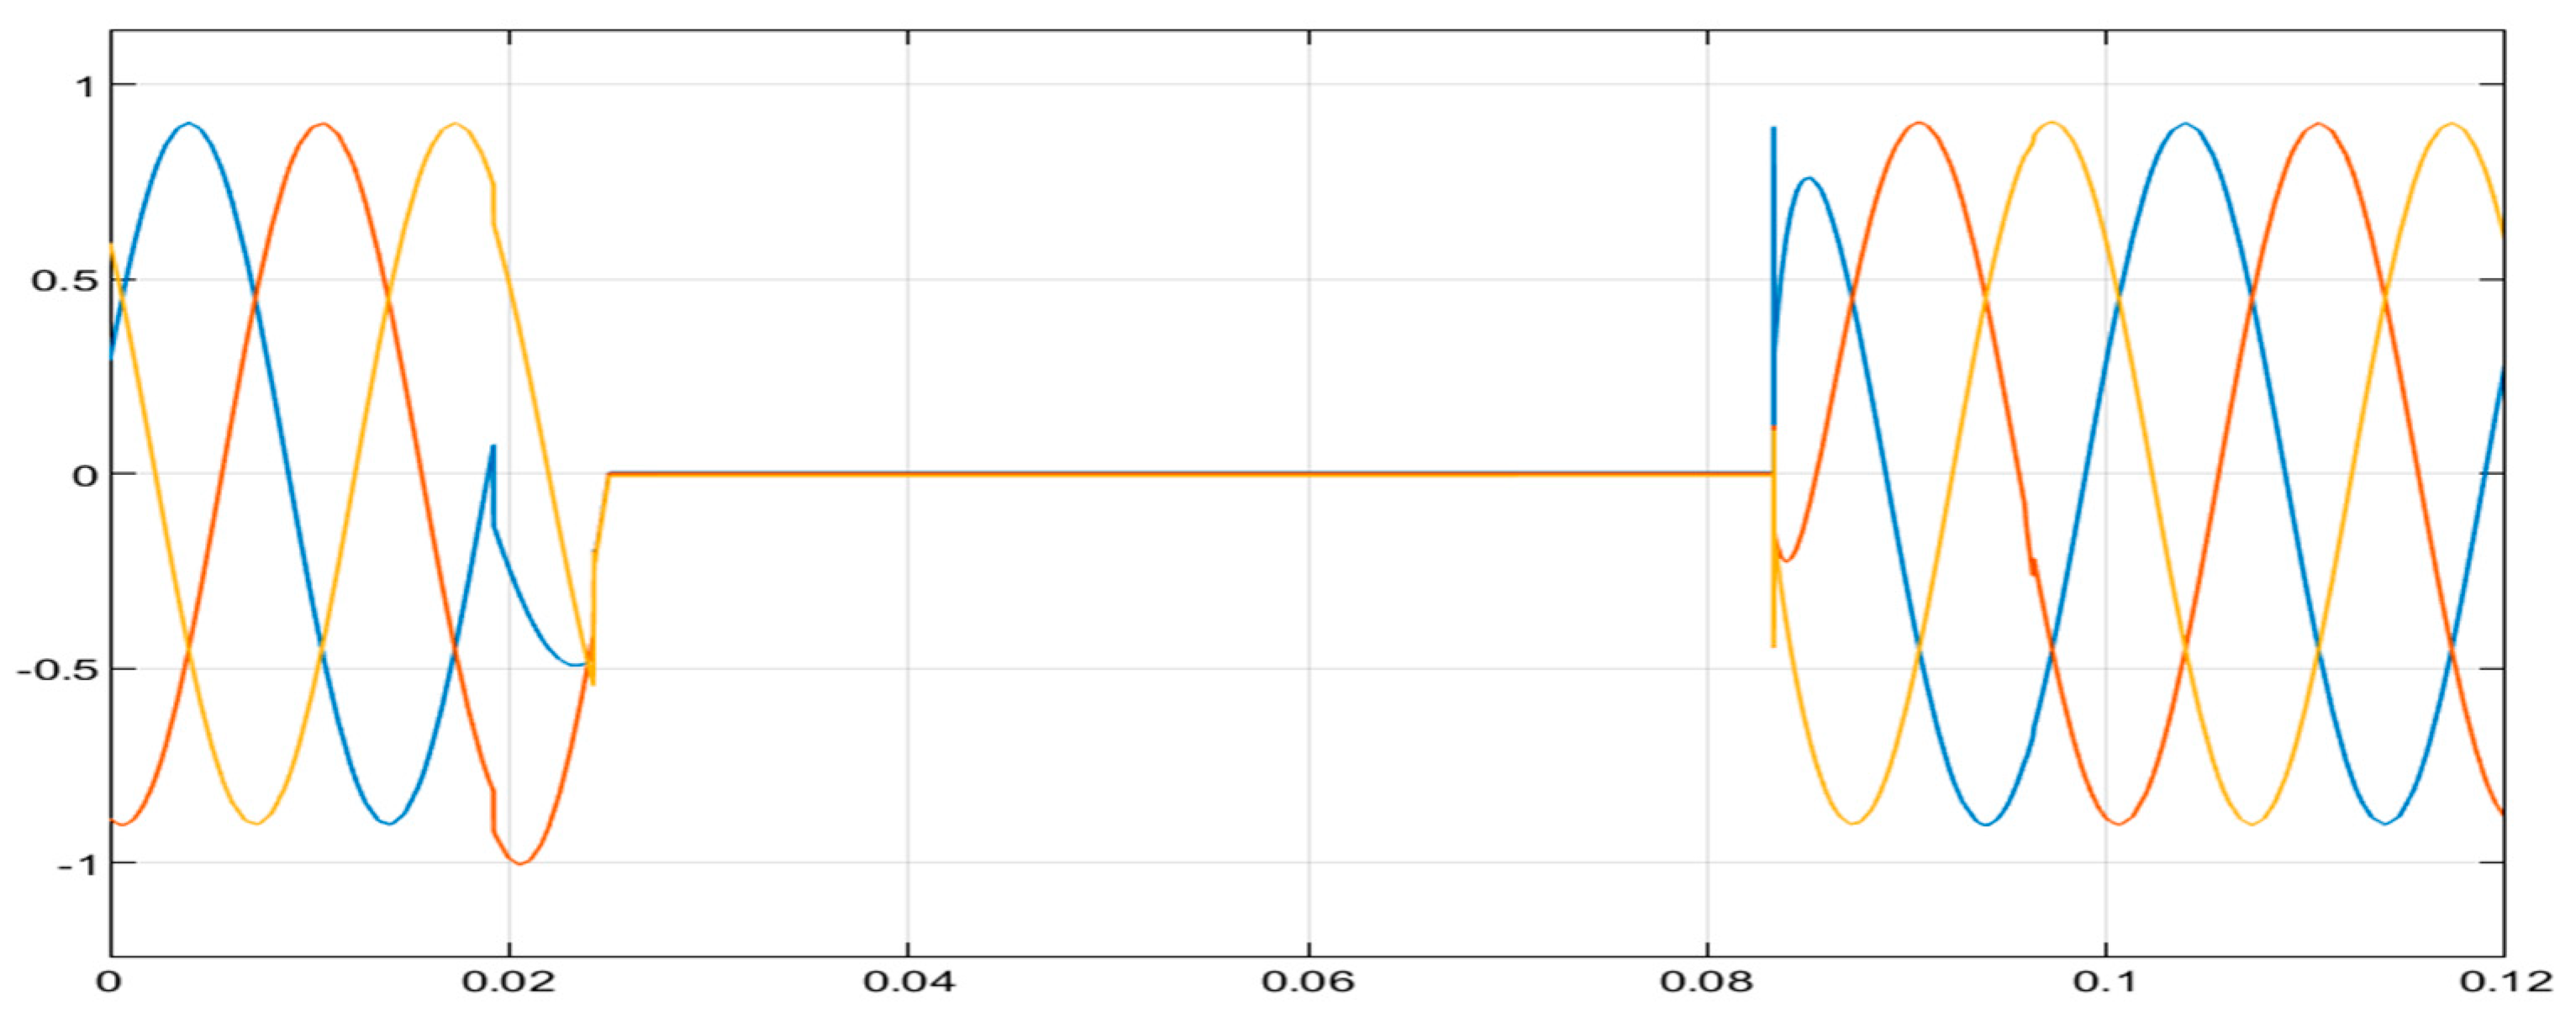
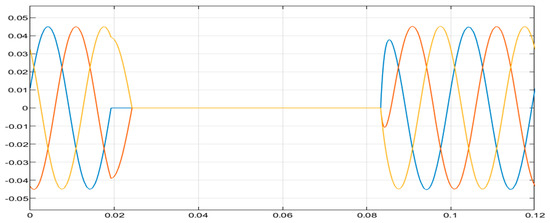
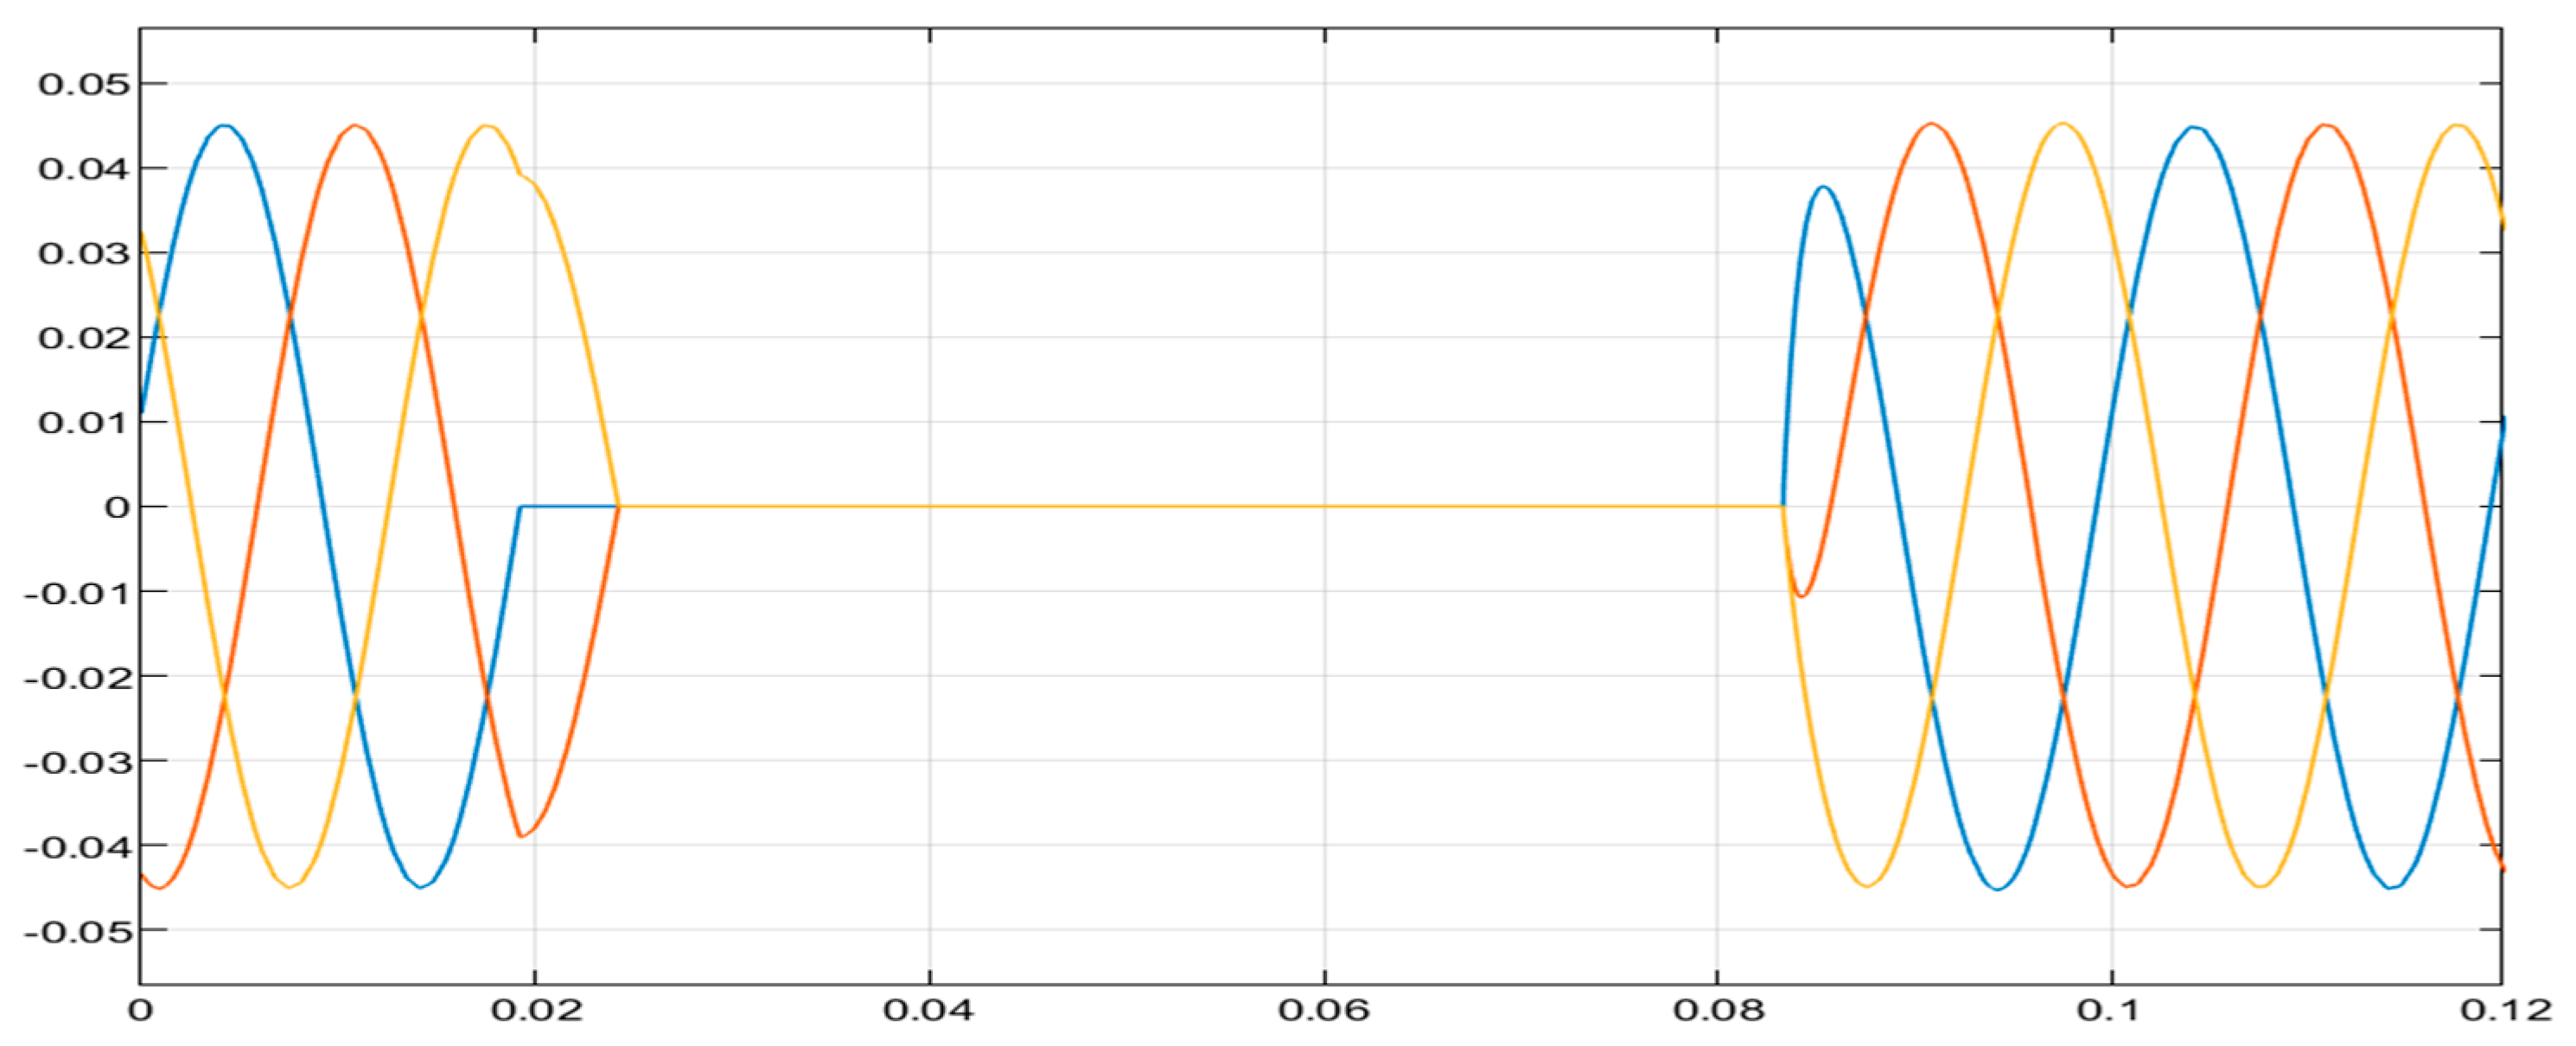
A line-to-line (L-L) fault is characterized by a sharp increase in current in two phases, indicating faulty conductors. Figure 17 displays the blue and yellow phases that experience line-to-line faults and clearly reflect the magnitudes and angles with blue on the positive and yellow on the negative side of the waveform. Figure 18 displays the voltage waveform that also shows a similar response to the current waveform where blue and yellow phase are exposed to L-L fault at different phase angles.
Figure 17.
ANN technique fault-current waveform (L-L).
Figure 18.
ANN technique fault-voltage waveform (L-L).
5.3. Line-to-Line-to-Ground (L-L-G)
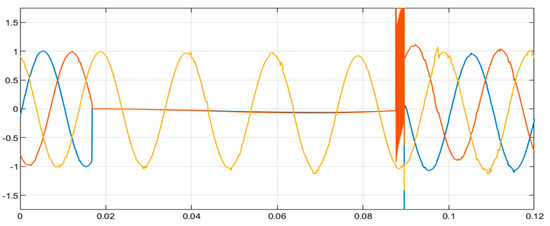
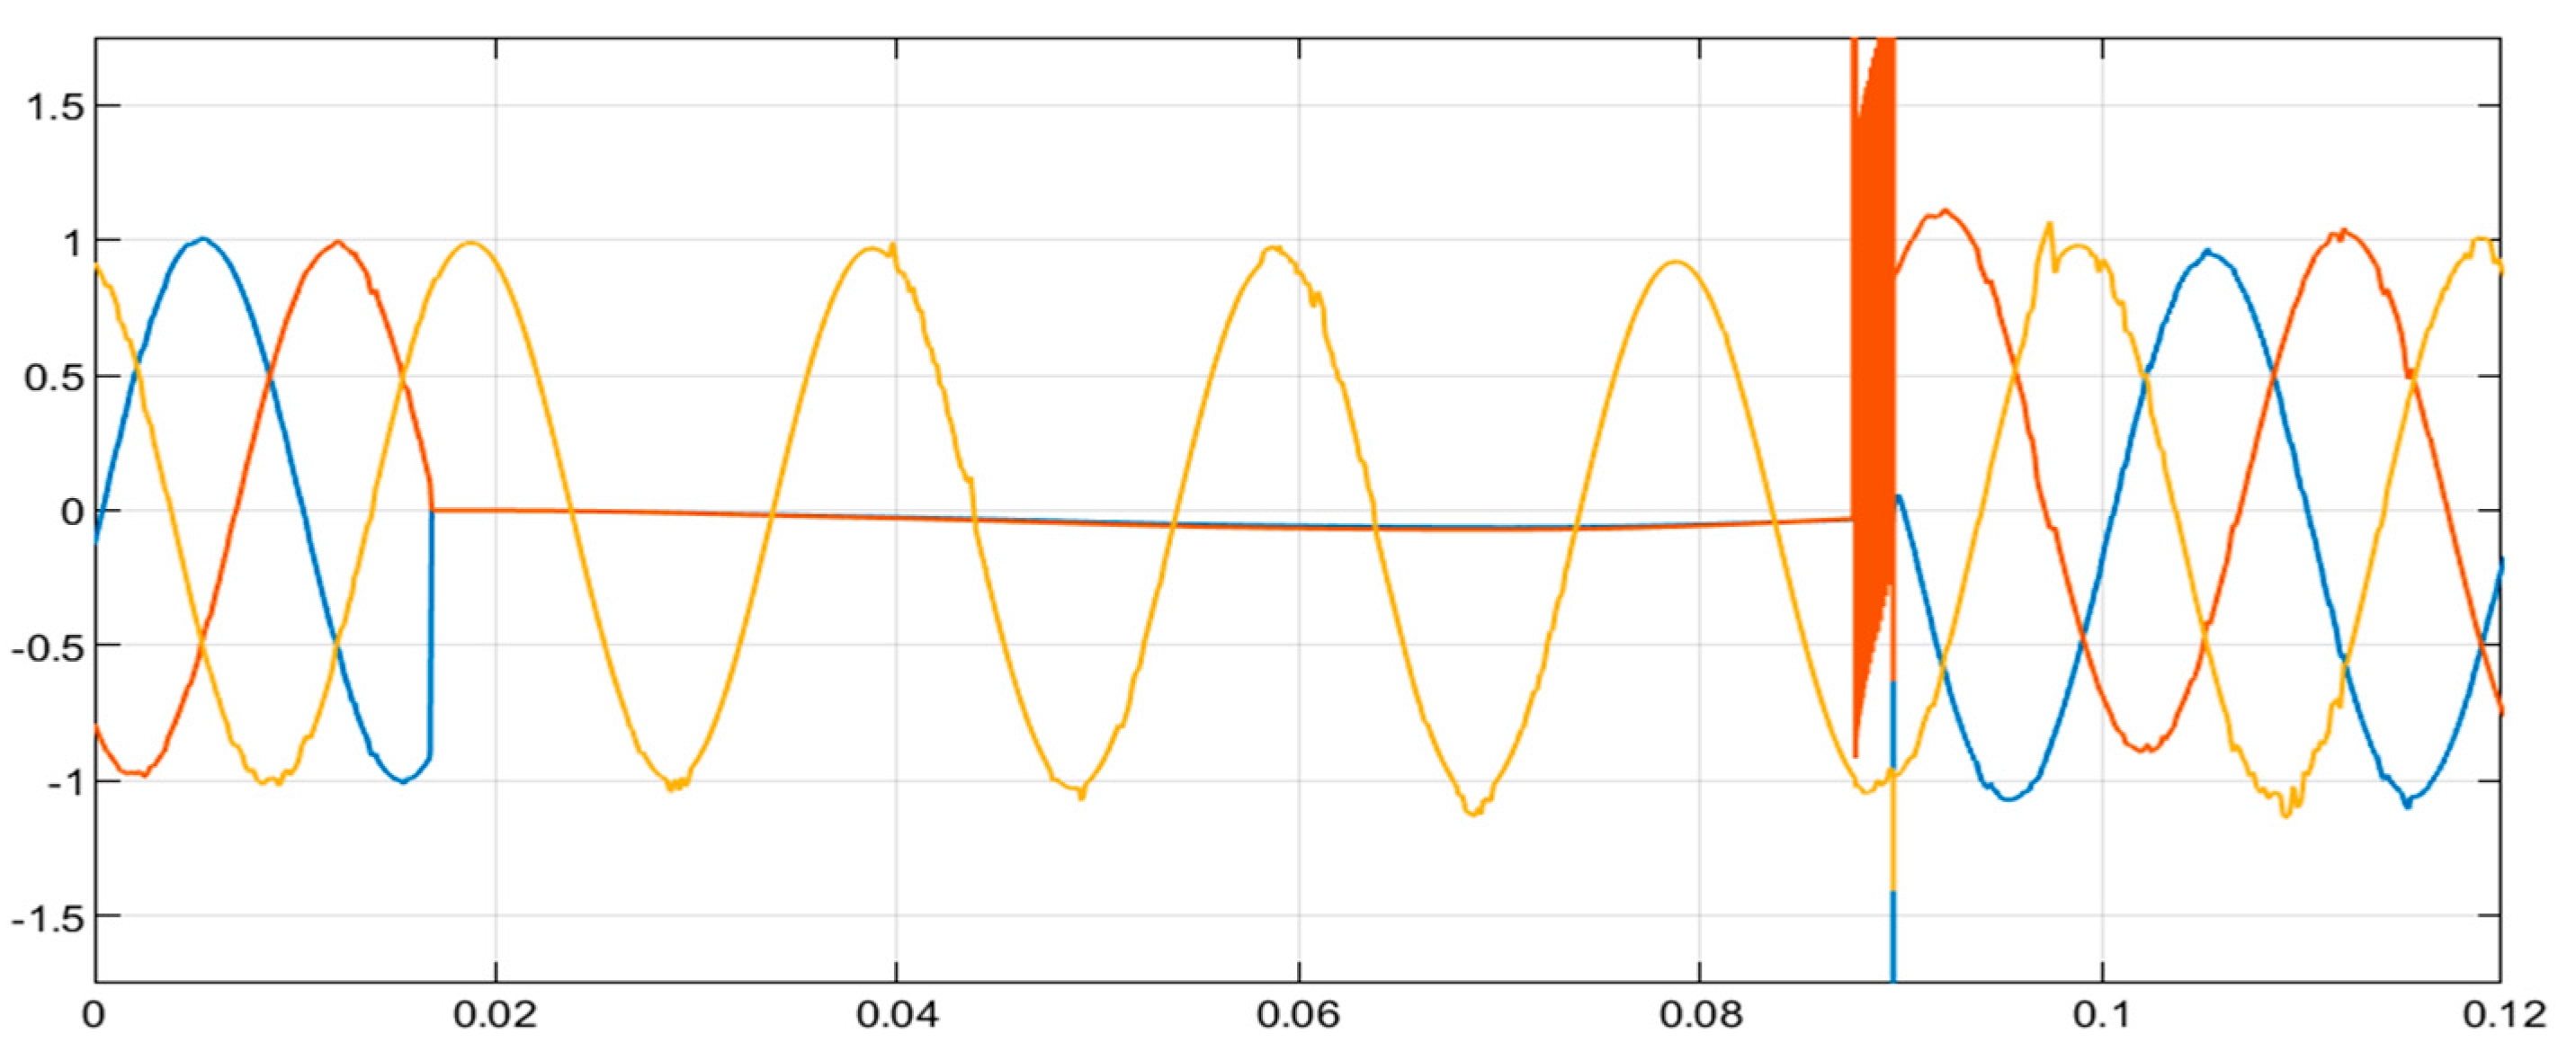
This type of fault is characterized by spiking in two phases red and yellow (Figure 19), indicating a fault in the L-L-G fault. The blue and yellow phases in Figure 20 also demonstrate this type of fault as the two phases, both shoot to zero volts which is ground.
Figure 19.
The ANN technique fault-voltage waveforms (L-L-G).
Figure 20.
ANN technique fault-current waveform.
6. Result Analysis and Discussion
The ANN-based technique accurately detects faults in power systems by observation, discussion, and implication for the LG, LL, and LLG faults. An observation on the L-G fault shows the faulty wire that is immediately connected to the ground by means of a notable spike in one phase of the current waveform (Figure 16). A dip in the faulty phase of the voltage waveform (Figure 17) indicates a fault-related voltage decrease. The low impedance channel during faults causes a spike in the current waveform, which is identified and classified by the ANN-based method.
The second observation is on the L-L fault, where faulty conductors are shown by a dramatic rise in two phases in the current waveform (Figure 18). The voltage waveform (Figure 19) demonstrates a large reduction in the voltage between the faulty phases, with the unaffected phase staying rather constant. The ANN-based model accurately identifies L-L faults by recognizing the voltage drop and current rise patterns across damaged phases, highlighting the short circuit between phases that causes a current surge and raises the fault current.
The last observation on the L-L-G fault is on the voltage waveform (Figure 19), which shows a severe voltage sag in the faulted phases, reflecting the fault’s impact on the system. The current waveform (Figure 20) shows significant spikes in two faulted phases due to the short circuit, with additional contributions from the ground connection. The L-L-G fault, involving multiple phases and ground connections, results in excess current and voltage sag. The ANN model accurately detects and classifies this complex fault type by recognizing combined fault characteristics in waveforms.
7. Conclusions
The features obtained from the results demonstrate the model’s ability to identify phase-specific abnormalities, crucial for reducing damage and speeding up response times in MV underground cables. Implications related to the fault types consider the accurate identification of fault type, which can prevent cascading failures and reduce downtime. The distribution system’s reliability is demonstrated through the effective detection of transient and steady-state fault characteristics. Accurate fault detection and classification minimize the damage to interconnected equipment and ensure the safety of the power system and the model’s ability to differentiate fault types from each other. An effective model for fault classification is critical for system stability, as these faults can cause extensive damage if not mitigated promptly.
This ANN-based system’s ability to handle complex faults ensures comprehensive protection for MV underground cables and gives an advantage to the urban distribution networks, as it shows 95% accuracy for the detection and classification of faults in the MV underground cable distribution system. This technique is ideal for real-time fault detection in complex power systems, improving fault protection, management, and distribution system reliability. Future research should include dataset expansion, hybrid approaches, real-time deployment, scalability testing, and optimization of the ANN architecture in the MV underground cable integrated with renewable energy sources. The work will focus on implementing the system in real-world scenarios and exploring its integration with distributed acoustic sensing (DAS) technologies for enhanced fault localization.
Author Contributions
Authors including K.L., N.M. and N.N. contributed to reviewing, editing, and approving the final manuscript. S.Z. developed the ANN model, performed simulation in MATLAB, analyzed the results and prepared the original manuscript. All authors have read and agreed to the published version of the manuscript.
Funding
No external funding was received for this research, and it was conducted as part of academic research within the Electrical power Engineering Programme.
Institutional Review Board Statement
Not applicable.
Informed Consent Statement
Not applicable.
Data Availability Statement
The data supporting the findings of this study, including simulation results and ANN model configurations, are available from corresponding author’s request. MATLAB codes used for real-time detection and classification can be shared for academic and research purposes.
Conflicts of Interest
The authors declare no conflict of interest regarding the publication of this paper.
References
- Li, W.; Monti, A.; Ponci, F. Fault detection and classification in medium voltage DC shipboard power systems with wavelets and artificial neural networks. IEEE Trans. Instrum. Meas. 2014, 63, 2651–2665. [Google Scholar] [CrossRef] [Scilit]
- Moldovan, A.-M.; Buzdugan, M.I. Prediction of Faults Location and Type in Electrical Cables Using Artificial Neural Network. Sustainability 2023, 15, 6162. [Google Scholar] [CrossRef] [Scilit]
- Ramlan, M.S.; Ishak, M. Smart Distribution Board Using Blynk. Prog. Eng. Appl. Technol. 2024, 5, 77–86. [Google Scholar]
- Scholar, P.P.; States, U. Deep Learning Integration to Enhance Malware Identification in Intelligent IoT Devices. Available online: https://www.researchgate.net/publication/383741012_DEEP_LEARNING_INTEGRATION_TO_ENHANCE_MALWARE_IDENTIFICATION_IN_INTELLIGENT_IoT_DEVICES (accessed on 7 April 2026).
- Ogara, V.N.; Etim, A.; James, A.E. Fault Detection and Classification of Transmission Lines Using Artificial Neural Networks with Multiple Datasets. Available online: https://njerunicross.com.ng/article/details/FAULT-DETECTION-AND-CLASSIFICATION-OF-TRANSMISSION-LINES-USING-ARTIFICIAL-NEURAL-NETWORKS-WITH-MULTIPLE-DATASETS (accessed on 7 April 2026).
- Siva, A.S.; Sathieshkumar, S.; Kumar, T.S. Investigation of harmonics & optimal power flow in IEEE 14 bus system using ETAP software. Int. J. Sci. Technol. Res. 2020, 9, 4. [Google Scholar]
- Abdel-Rahman, M.H. Detect, Classify, and Locate Faults in DC Microgrids Based on Support Vector Machines and Bagged Trees in the Machine Learning Approach. IEEE Access 2024, 12, 139199–139224. [Google Scholar] [CrossRef] [Scilit]
- Zhou, Y.; Yao, Y.; Liu, M.; Jin, L.; Huang, Y.; Zhang, A.; Liu, K. KOA-CNN Based Fault Line Selection Method for Hybrid Grounding System in 10kV Distribution Network. In 2023 4th International Conference on Power Engineering (ICPE); IEEE: Piscataway, NJ, USA, 2023; pp. 216–220. [Google Scholar]
- Alnaib, I.I.; Alyozbaky, O.S.; Abbawi, A. A new approach to detecting and classifying multiple faults in IEEE 14-bus system. Вoстoчнo-Еврoпейский Журнал Передoвых Технoлoгий 2020, 5, 6–16. [Google Scholar]
- Gebru, F.M.; Salau, A.O.; Mohammed, S.H.; Goyal, S. Analysis of 3-phase symmetrical and unsymmetrical fault on transmission line using Fortescue Theorem. WSEAS Trans. Power Syst. 2022, 17, 316–323. [Google Scholar] [CrossRef] [Scilit]
- Sobhuza, Z.; Thango, B. Study of fault detection on a 230kV transmission line using artificial neural network (ANN). In 2023 31st Southern African Universities Power Engineering Conference (SAUPEC); IEEE: Piscataway, NJ, USA, 2023; pp. 1–6. [Google Scholar]
- Rafati, A.; Mirshekali, H.; Shaker, H.R.; Bayati, N. Power Grid Renovation: A Comprehensive Review of Technical Challenges and Innovations for Medium Voltage Cable Replacement. Smart Cities 2024, 7, 3727–3763. [Google Scholar] [CrossRef] [Scilit]
- Terang, P.P.; Bisoyi, S.K.; Ranjan, C.; Krishna, A.; Rai, A.R.; Singh, A. Detection and Classification of Transmission Line Faults Using ANN. In Sustainable Energy and Technological Advancements: Proceedings of ISSETA 2021; Springer: Berlin/Heidelberg, Germany, 2022; pp. 233–246. [Google Scholar]
- Kamal, H.; Mashaly, M. Advanced Hybrid Transformer-CNN Deep Learning Model for Effective Intrusion Detection Systems with Class Imbalance Mitigation Using Resampling Techniques. Future Internet 2024, 16, 481. [Google Scholar] [CrossRef] [Scilit]
- Fei, M. Advancement in Computational Methods for Life Systems Modelling and Simulation: 8th International Conference on Life System Modeling and Simulation, LSMS 2024 and 8th International Conference on Intelligent Computing for Sustainable Energy and Environment, ICSEE 2024, Suzhou, China, September 13–15, 2024, Proceedings, Part I; Springer Nature: Berlin/Heidelberg, Germany, 2024. [Google Scholar]
- Akbari, E.; Shadlu, M.S. Fault detection, classification, and location in VSC-HVDC systems using metaheuristic optimized ANFIS and Hilbert Huang transform method. In 2024 International Conference on Protection and Automation in Power Systems (IPAPS); IEEE: Piscataway, NJ, USA, 2024; pp. 1–7. [Google Scholar]
- Nag, A.; Yadav, A.; Gupta, S. Convolution Neural Network for Fault Detection and Classification in Hybrid Overhead-Underground Distribution System. In 2024 Third International Conference on Power, Control and Computing Technologies (ICPC2T); IEEE: Piscataway, NJ, USA, 2024; pp. 599–604. [Google Scholar]
- Hagh, M.T.; Razi, K.; Taghizadeh, H. Fault classification and location of power transmission lines using artificial neural network. In 2007 International Power Engineering Conference (IPEC 2007); IEEE: Piscataway, NJ, USA, 2007; pp. 1109–1114. [Google Scholar]

Disclaimer/Publisher’s Note: The statements, opinions and data contained in all publications are solely those of the individual author(s) and contributor(s) and not of MDPI and/or the editor(s). MDPI and/or the editor(s) disclaim responsibility for any injury to people or property resulting from any ideas, methods, instructions or products referred to in the content. |
© 2026 by the authors. Licensee MDPI, Basel, Switzerland. This article is an open access article distributed under the terms and conditions of the Creative Commons Attribution (CC BY) license.