


Abstract
The exhaustion of fossil fuels, environmental concerns, and difficulties in deploying smart grids have expedited the development of renewable energy distributed generators (REDGs) and electric vehicles (EVs). In recent decades, there has been a notable rise in the production and marketing of EVs. Previous research has proposed reactive power control solutions, including the use of power electronic converters associated with distributed generators (DGs) to alleviate voltage fluctuations. This research presents a strategy for the best integration of electric vehicles through bidirectional charging and renewable energy distributed generators inside power systems, with the objective of efficiently managing voltage, active power, and reactive power flows at interconnection points. Furthermore, it entails determining appropriate locations and dimensions for electric car charging stations through a comparative examination of computing time and iterations between the Hybrid Genetic Algorithm Improved Particle Swarm Optimization (HGAIPSO) and several other optimization methods, including Genetic Algorithm (GA), Particle Swarm Optimization (PSO), and Improved Particle Swarm Optimization (IPSO). This analysis was performed on the IEEE-118 bus system, incorporating Vehicle-to-Grid (V2G), Grid-to-Vehicle (G2V), and REDG allocations. The simulation results indicated that the suggested HGAIPSO approach is more rapid and effective regarding calculation time for complex networks, attaining optimal solutions with greater efficiency.
1. Introduction
Variations in load demand have consistently necessitated power transmission networks to adapt to evolving situations. This adaptability has regrettably resulted in voltage oscillations surpassing permissible variation thresholds at multiple buses, along with increased power losses. Therefore, it is essential to determine the optimal placement and size of electric vehicles (EVs) to improve the voltage profile and reduce electrical power losses. Research forecasts that global consumption will rise at an average annual rate of 1.6 percent until 2030 [1]. This trend is expected to persist throughout the years. Consequently, electric vehicles are expected to have a more prominent position in future power networks. The growing incorporation of electric vehicles into the electrical transmission network is attributed to their beneficial impact on power networks. Electric vehicle systems are crucial for the advancement of smart grid technologies and provide the foundation of intelligent electrical networks [2,3].
The integration of distributed generation (DG) units into the distribution network as an energy supply source is driven by technological improvements and a global transition towards renewable energy sources [4]. The significance of dispersed generation resources inside the distribution network has escalated due to improved reliability, reduced peak clipping losses, demand response capabilities, and economic and environmental factors. Renewable energy sources, characterized by their purity and abundance, present a viable alternative to fossil fuels [5]. The emergence of the smart grid concept is closely linked to the growth of renewable distributed generation sources and the necessity to meet consumption demands at the point of use. Presently, energy grids, encompassing electricity, natural gas, and district heating and cooling, are interconnected with consumers across industrial, commercial, and residential sectors. Despite widespread study on energy infrastructure, there is a lack of comprehensive studies focusing on the integration of these systems, despite the significant advantages they provide, including the efficient utilization of their composite and adaptable characteristics [6].
The simultaneous growth of electric vehicle charging stations and intermittent renewable energy generation systems (REDGs) can increase the capacity of EV charging stations while concurrently lowering the operational expenses of both traditional and renewable energy facilities [7]. HGAIPSO has been suggested as a remedy for the worldwide issue of financing subsidies for the advancement of renewable energy and electric vehicle charging stations (REDGs). The research presents a comparative examination of the computational time and iterations of the proposed HGAIPSO against existing optimization methods, including GA, PSO, and IPSO.
2. GA Algorithm
Auglt, Hooshmand, and Ataei [8] employed Genetic Algorithms (GAs) in their study to determine the dimensions and locations of the charging station (CS) units. Cost function-based approaches produce the most optimal solutions, yet they demand substantial computational resources and demonstrate slow convergence. The analysis of expenses has been conducted; nevertheless, the estimates of cost functions may lead to misunderstanding concerning the exact specifications of charging station (CS) units at suitable sites. In [9], Rahmat-Allah Hooshmand employed a Real-Coded Genetic Algorithm (RCGA) to address the issue of optimal capacitor bank placement in unbalanced distributed systems with mesh or radial configurations. Fixed and switched capacitors were utilized strategically to reduce losses and control voltages in transmission lines.
In reference [10], Jalilzadeh, Galvani, Hosseinian, and Razavi presented a methodology utilizing a Real-Coded Genetic Algorithm (RCGA) to determine the ideal values for fixed and switching capacitors in transmission networks. A range of commonly accessible capacitors was employed to replicate loads at various levels. This study employed the RCGA method to determine the appropriate capacitor values. Furthermore, Boyerahmadi and Poor executed a study employing evolutionary algorithms to analyze voltage trends in transmission networks [11,12]. The research employed reactive power injection to enhance voltage profiles at distant buses from the slack buses.
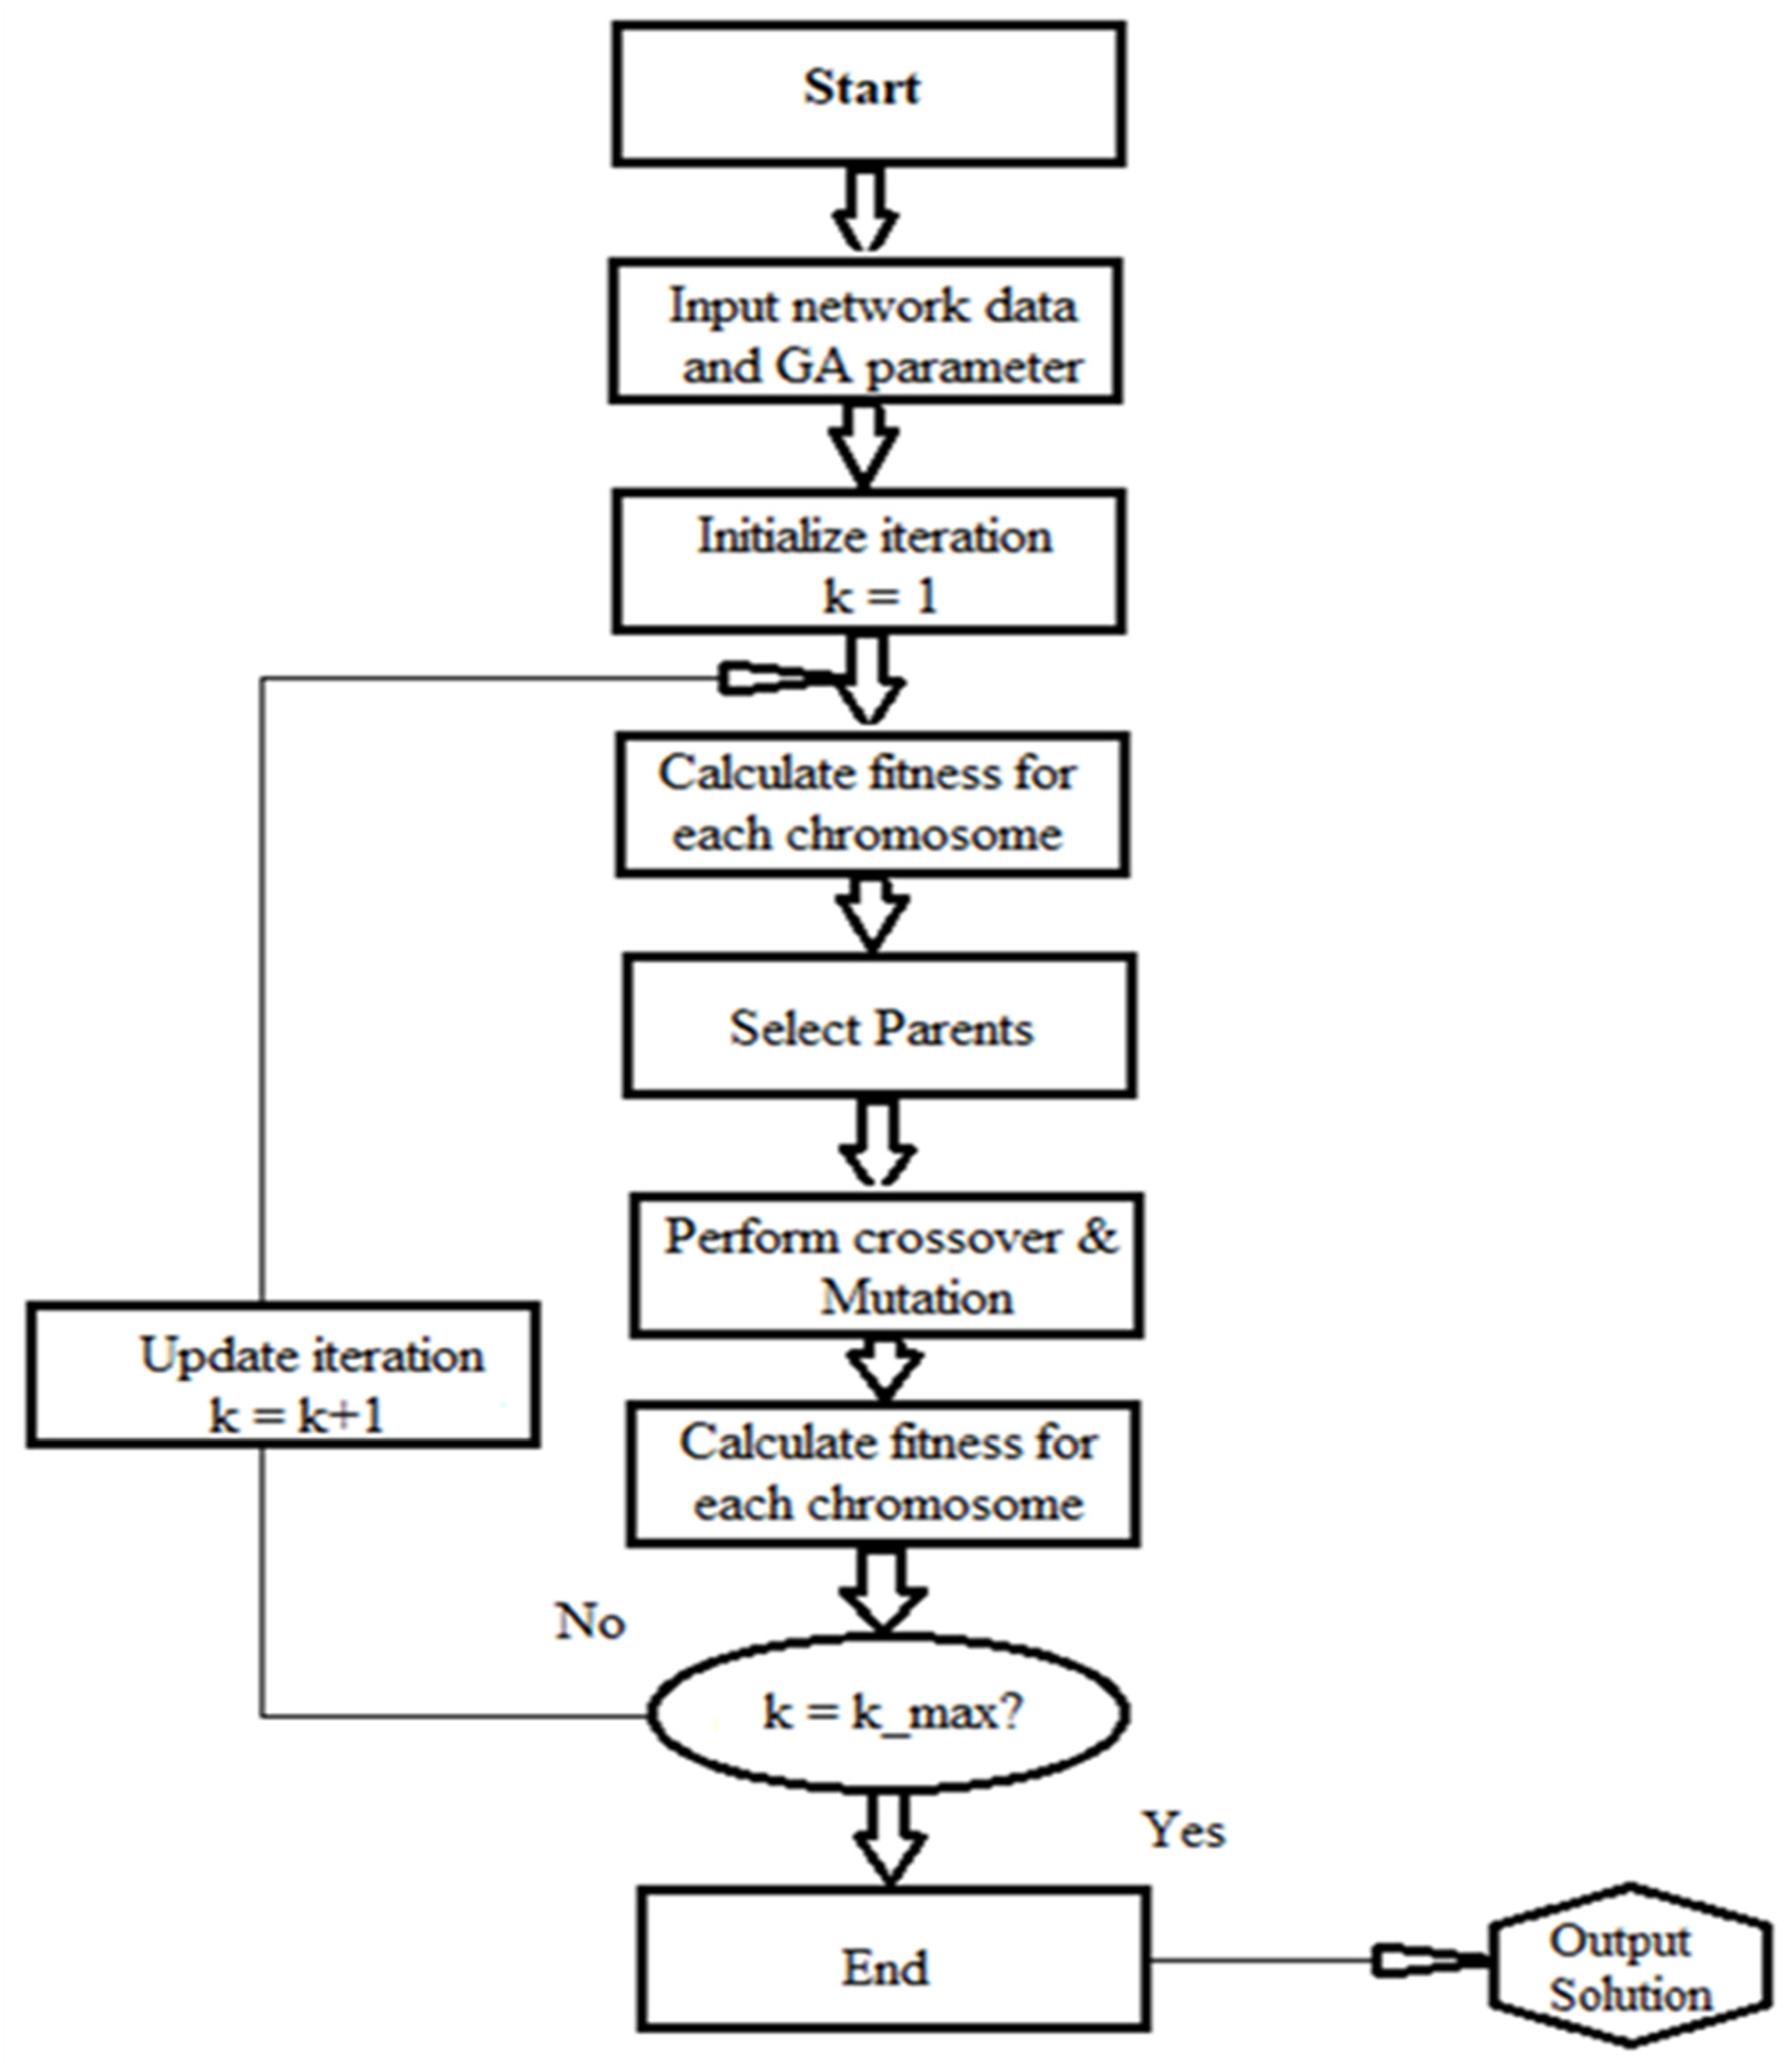
An evolutionary approach was employed to ascertain the ideal parameters for reactive power injection, leading to an enhanced voltage profile and a reduction in losses. Genetic Algorithms (GAs) utilize a population of candidate solutions represented by n chromosomes. Each chromosome signifies a real-valued vector of m dimensions, with m being the quantity of optimized variables [13]. Figure 1 illustrates the GA flowchart employed to address engineering problems. The phases for executing a Genetic Algorithm are utilized to create the flowchart.
Figure 1.
Procedures for the execution of a Genetic Algorithm.
3. PSO Algorithm
Ziari et al. proposed a system in [14] for the optimal allocation and size of capacitors. The objective is to reduce transmission line losses and improve voltage profiles. The findings indicated that the proposed method showed enhanced accuracy and robustness relative to Genetic Algorithms and non-linear programming. Khanjanzadeh et al. investigated in [15] the impact of the location and capacity of a CS on enhancing voltage stability in radial distributed systems through PSO. They evaluated the precision and convergence of the PSO algorithm in comparison to the GA method. The Particle Swarm Optimization (PSO) method showed enhanced accuracy and convergence velocity relative to the Genetic Algorithm (GA) method.
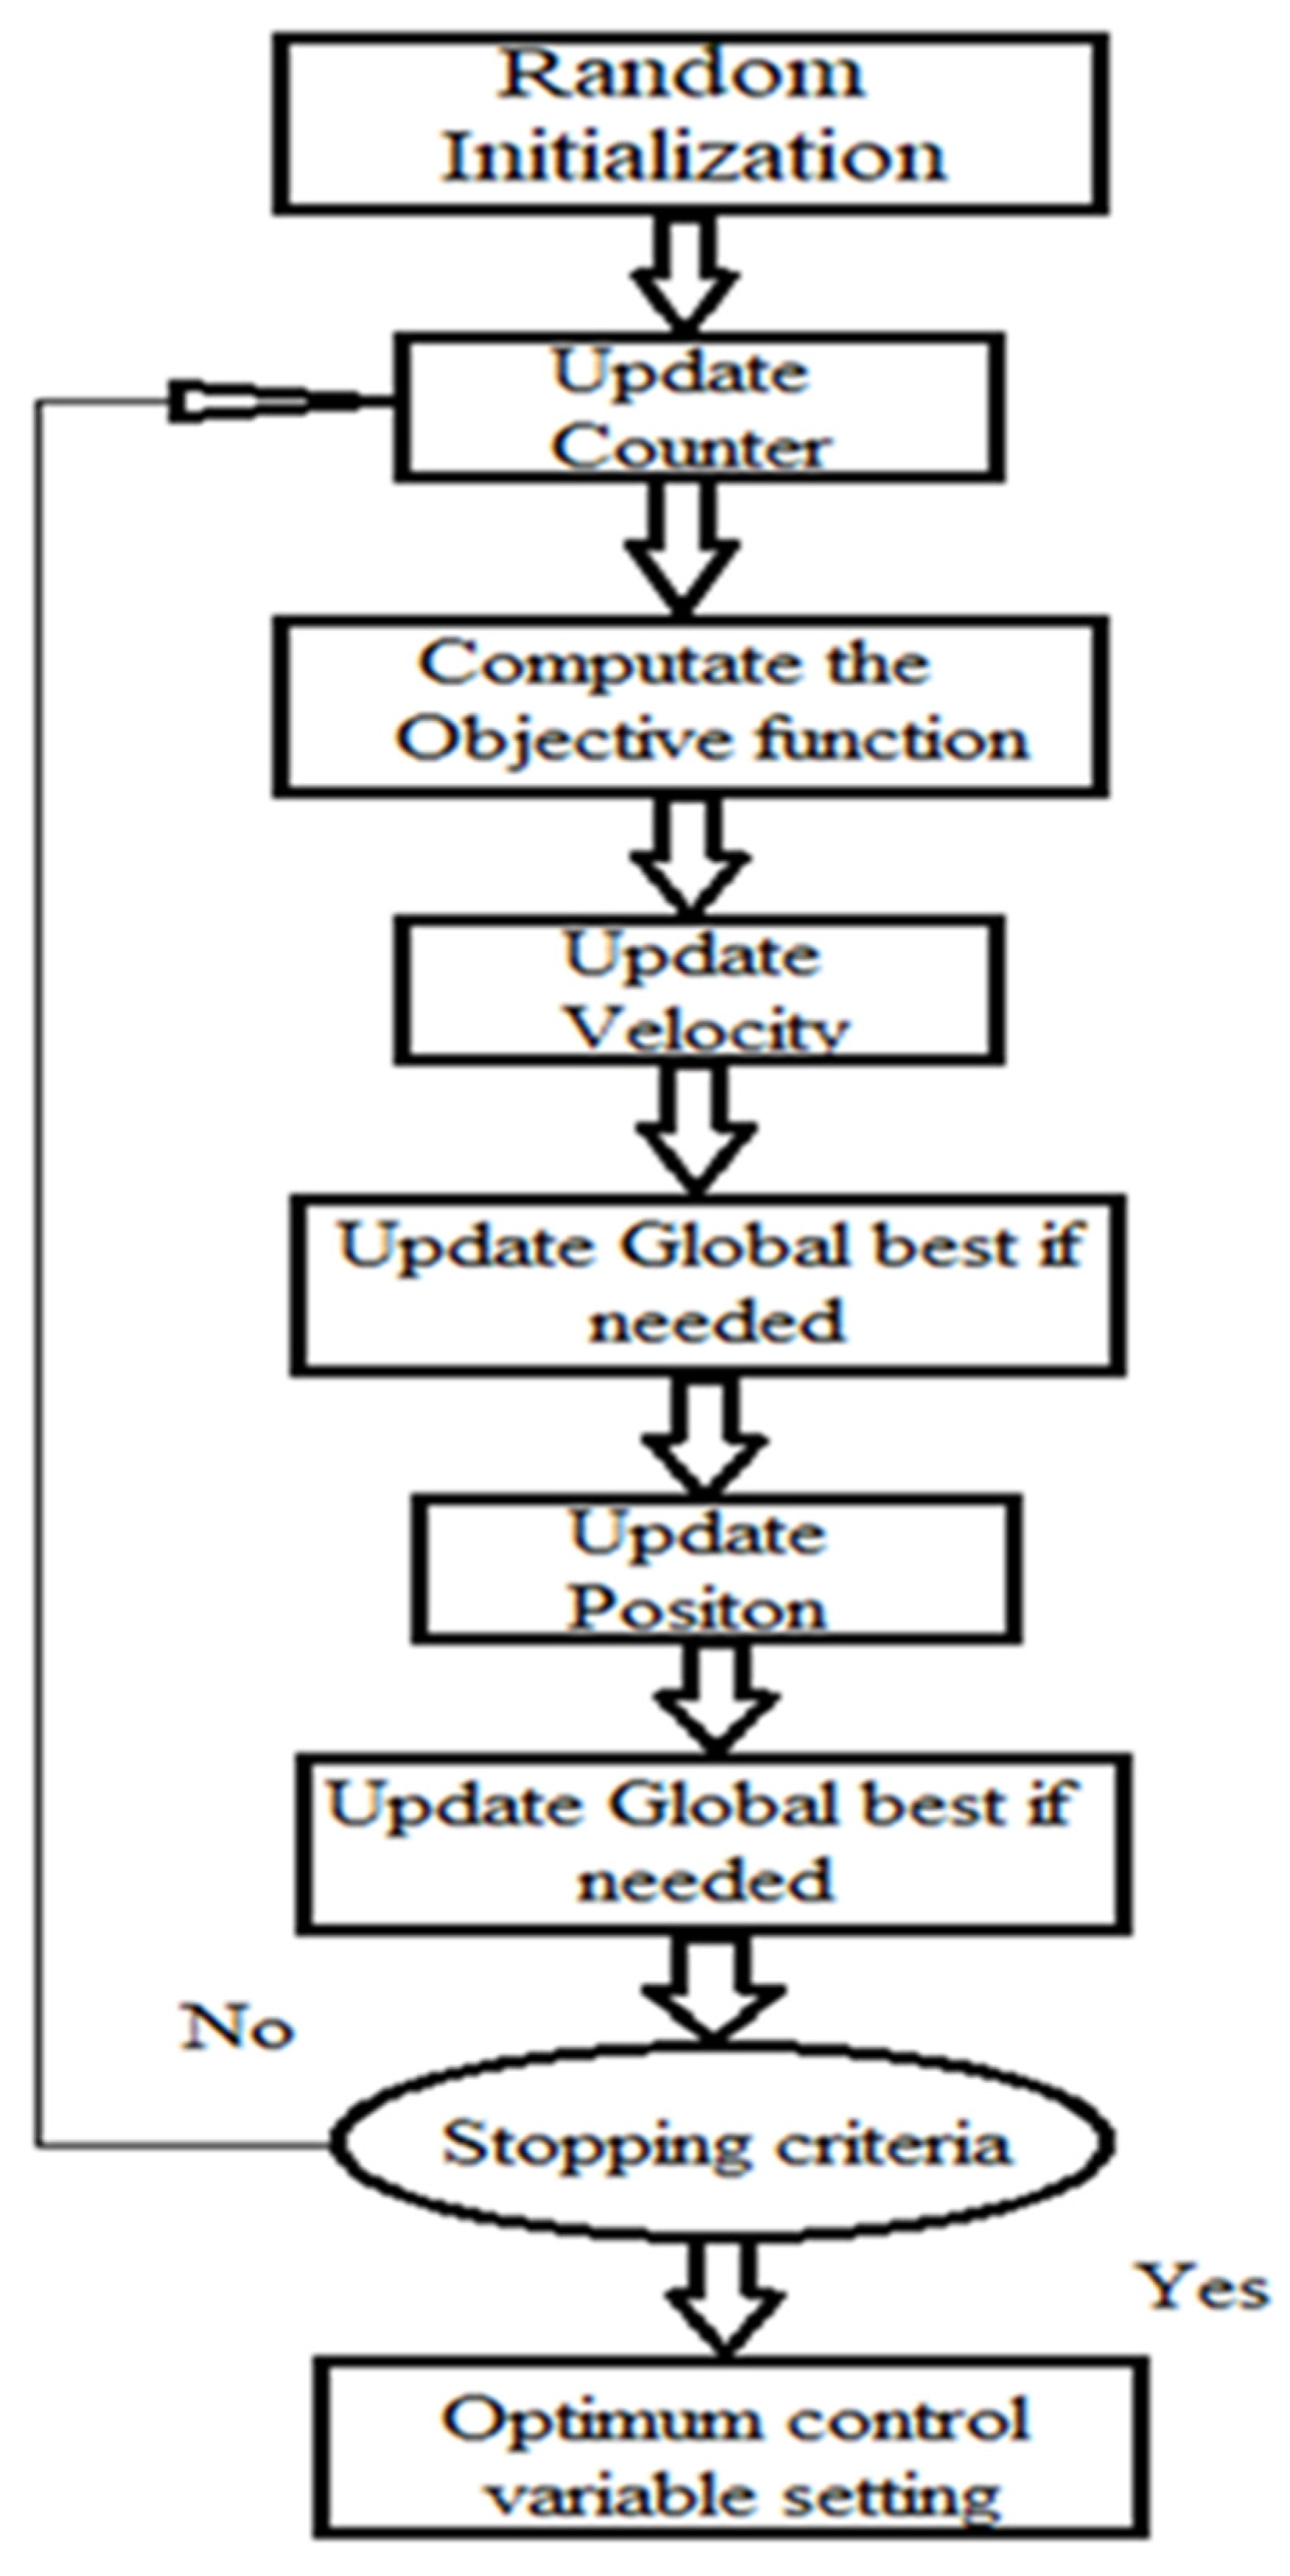
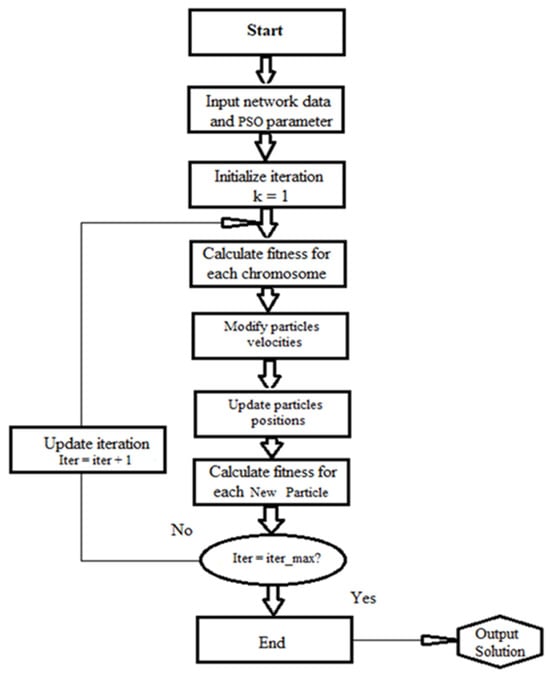
In reference [16], Hajforoosh and Seyed M. utilized Particle Swarm Optimization to minimize costs associated with active losses, capital investment in CS, operational expenditures, and emissions. They recognized constraints in the Genetic Algorithm (GA) and Particle Swarm Optimization (PSO) methods, observing that both approaches often become trapped in local optima. This suggests that the results derived from these methods may not consistently produce the most favorable outcomes [17]. To resolve this challenge, they employed sophisticated artificial intelligence techniques. Figure 2 delineates the procedural phases of the PSO approach. The PSO approach generates a population of particles that are randomly distributed across the search space. Each particle signifies a prospective solution to the problem and is allocated a fitness value [18]. This fitness level dictates the optimization procedure. Particles progressively cluster around the most advantageous area after identifying their ideal position and the superior solution. The revised velocity of each particle is determined by three factors: its previous velocity, its current optimal position, and the best position historically achieved by the entire swarm.
Figure 2.
Flow chart of a Particle Swarm Optimization algorithm.
4. IPSO Algorithm
In [19], the IPSO cited by Ziari and Platt utilized optimal scheduling of distributed generation (DG) and capacitor banks to reduce reliability and line loss expenses, as well as the capital costs associated with electrical networks. In [20], Jain, Singh, and Srivastava developed a method for optimizing the placement and sizing of multiple distributed generators (DGs) using Improved Particle Swarm Optimization (IPSO). The researchers concluded that the strategy surpassed conventional and analytical methods for the installation of a single distributed generator (DG) [21].
The IPSO-based technique proposed by Reddy et al. in [22] seeks to reduce losses in imbalanced radial transmission systems. Their research introduced an effective algorithm for ascertaining the location, type, and dimensions of capacitor banks to be implemented in imbalanced radial systems. A specific bus identification method was outlined for identifying ideal capacitor installation locations through power loss indices (PLI) analysis. In [23], Jamian et al. formulated a model to mitigate power loss, focusing on the optimization of distributed generator (DG) sizing and the minimization of power losses through the selection of suitable particles for subsequent iterations.
In the IPSO method, there exist n particles, each symbolizing a proposed solution, and m represents the quantity of optimized parameters for each particle, with each particle depicted as an m-dimensional vector of real numbers. These parameters delineate the dimensions of the problem space. The IPSO methodology comprises multiple phases [24]. Furthermore, the IPSO technique requires customization for each specific optimization problem it intends to address. Figure 3 illustrates the efficacy of a customized IPSO method in addressing engineering optimization challenges.
Figure 3.
Flowchart showing steps for the IPSO algorithm.
5. GAIPSO Algorithm
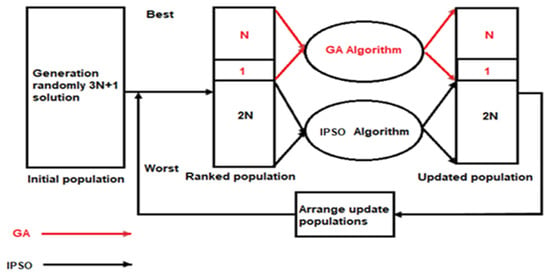
The proposed methodology integrates the Genetic Algorithm (GA) with Improved Particle Swarm Optimization (IPSO) to optimize the distribution of renewable energy distributed generators (REDGs), as seen in Figure 4, with procedural stages detailed in Equations (1)–(10). The objective is to include renewable energy distributed generators (REDGs) and electric vehicles (EVs) in the power system while adhering to the system’s constraints. REDGs are meticulously allocated to specific buses within the transmission network. The selection of these buses for REDG placement is influenced by factors affecting power flow and the sensitivity of power loss. The HGAIPSO algorithm effectively enhances this selection process by minimizing the total number of iterations. Through the assessment of sensitivity factors, HGAIPSO proficiently determines optimal locations for REDG installation. Figure 4 presents a flowchart that illustrates this strategy.
c1i = 2.7; c1f = 0.3; c2i = 0.4; c2f = 2.6.
c1 = (c1f − c1i) × (k/kmax)) + c1i; c2 = (c2f − c2i) × (k/kmax)) + c2i.
vmax (j) = (max(X (, j ))) × penalty factor
if particle velocity(ij) = 0 if rand < 0.5
V (i, j) = rand × vmax (j)
Else
V (i, j) = −rand × vmax (j)
End
end
end
X (i, j) = X (i, j) + V (i, j)
Figure 4.
GA and IPSO combination HGAIPSO.
6. Results and Discussion
6.1. Scenario One
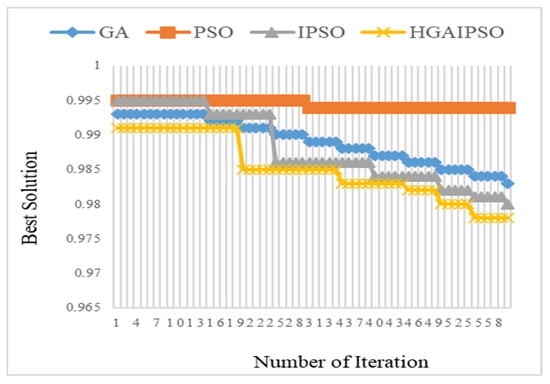
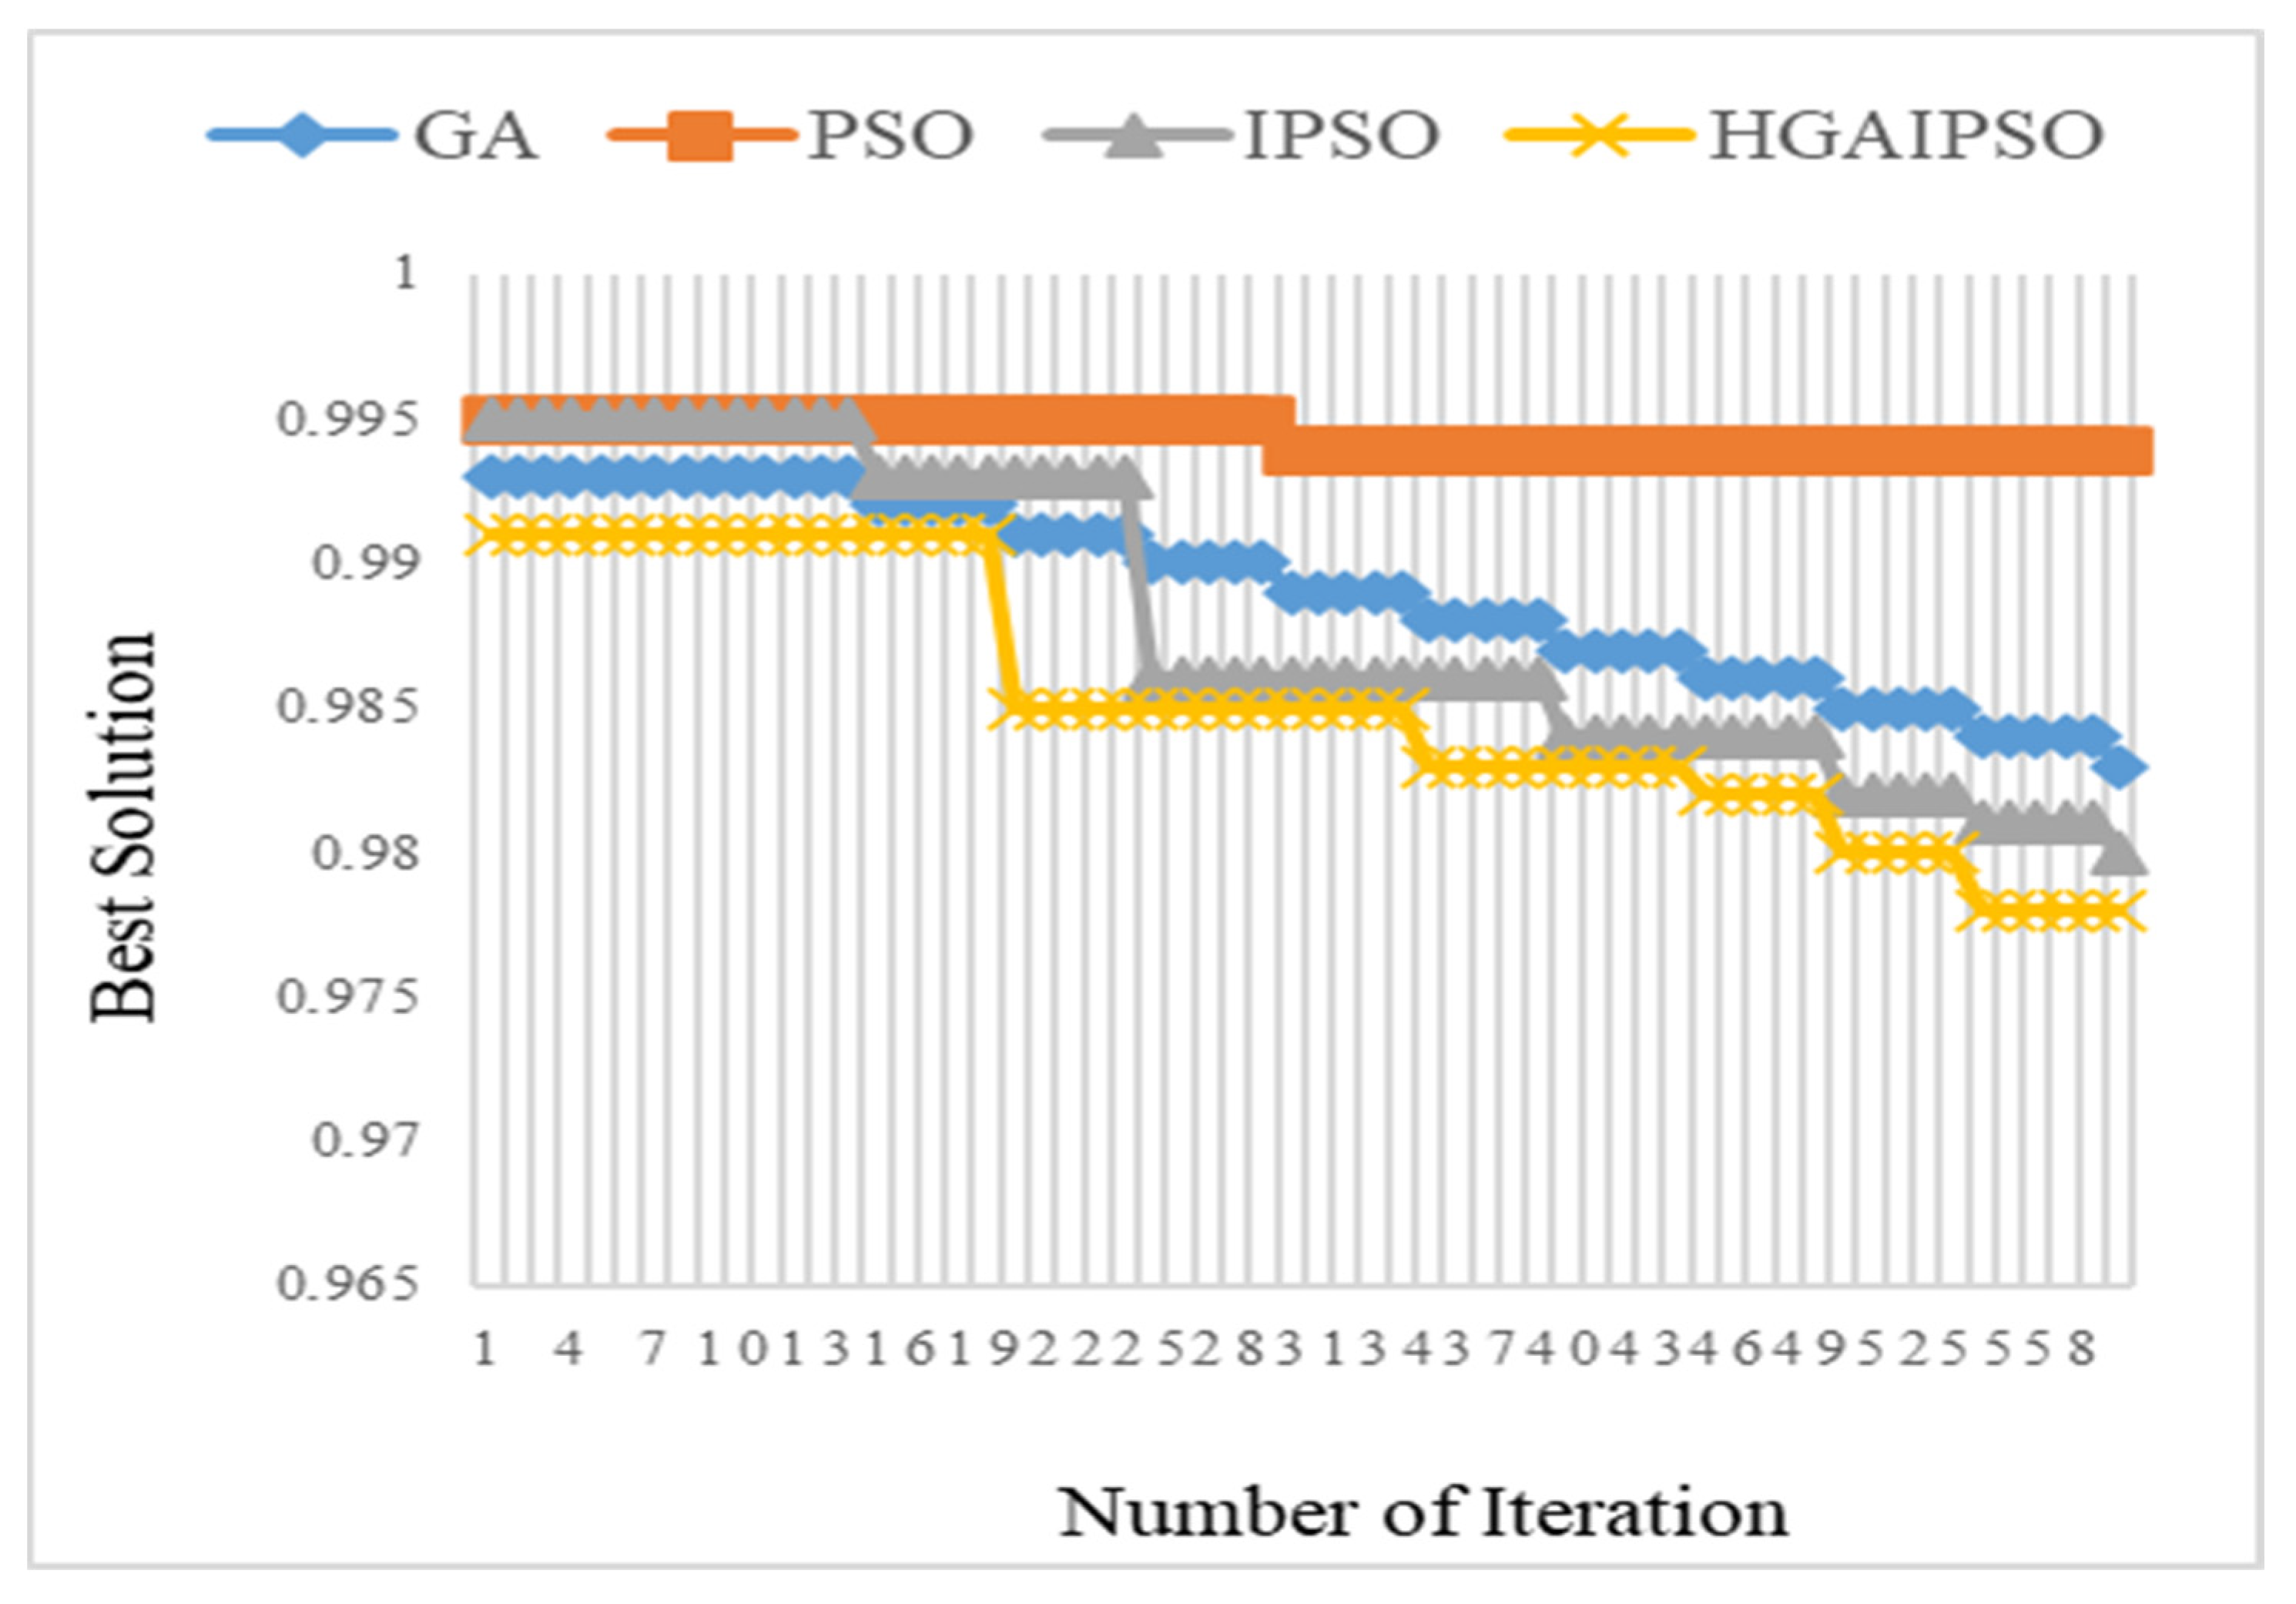
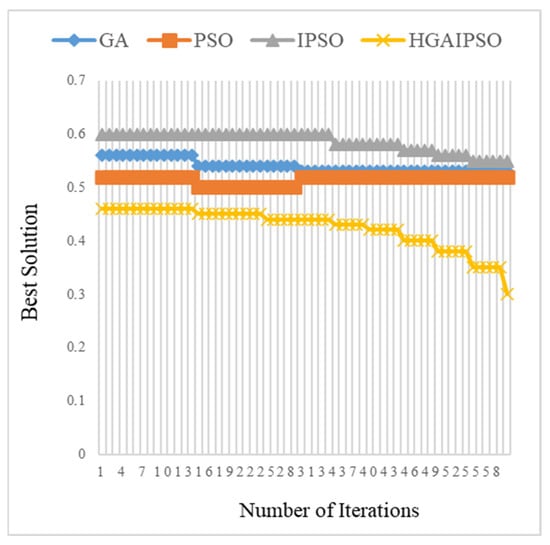
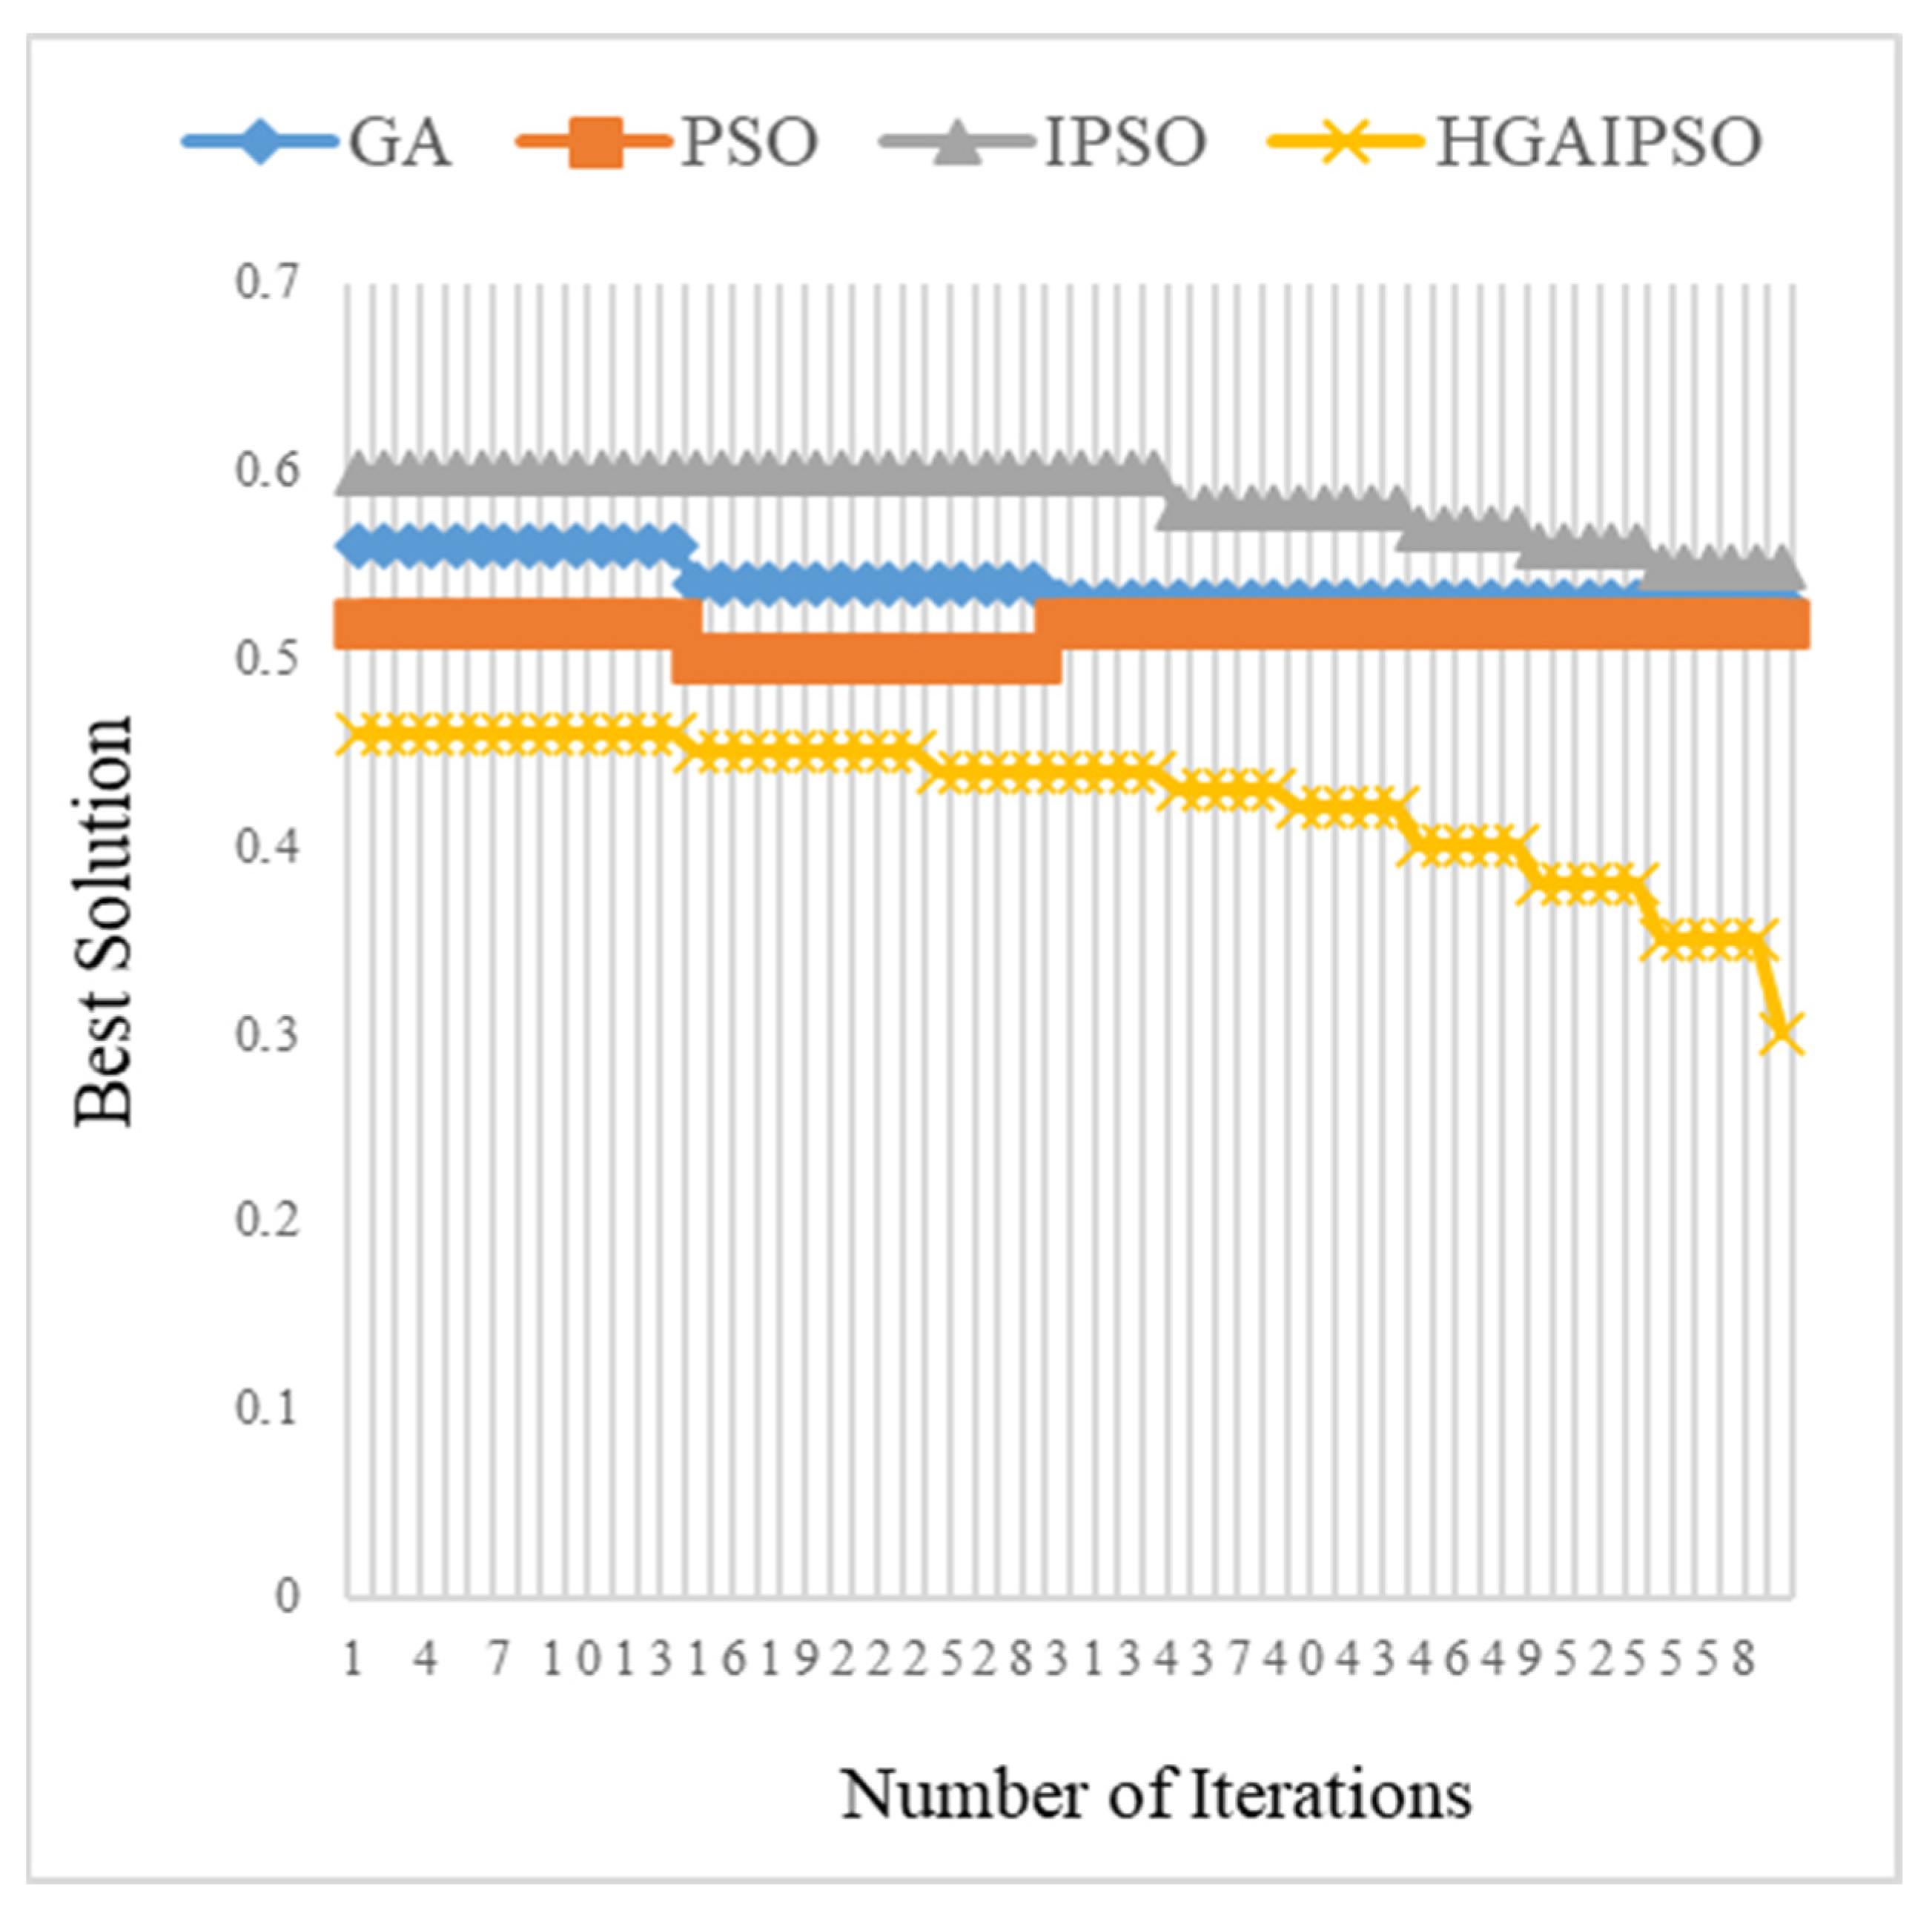
The data in Table 1 and Table 2 demonstrate that the HGAIPSO technique is effective in minimizing the objective functions. Furthermore, it is essential to note that it has attained the largest total of electric automobiles, serving as evidence that the suggested strategy is effective. Figure 5 depicts the convergence curves and the optimal solution generated using several computational methods in scenario 1. The algorithm’s performance after sixty iterations demonstrates its efficacy.
Table 1.
Comparison of the results acquired during Scenario 1 using a variety of optimization algorithms applied to the 118-bus.
Table 2.
A comparison of the results achieved from the multi-objective function during Scenario 1 using different optimization techniques applied to the 118-bus system.
Figure 5.
Convergence curves were generated using a variety of computation algorithms in scenario 1.
6.2. Scenario Two
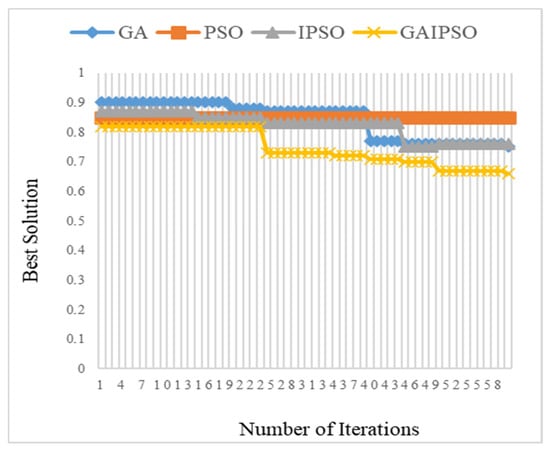
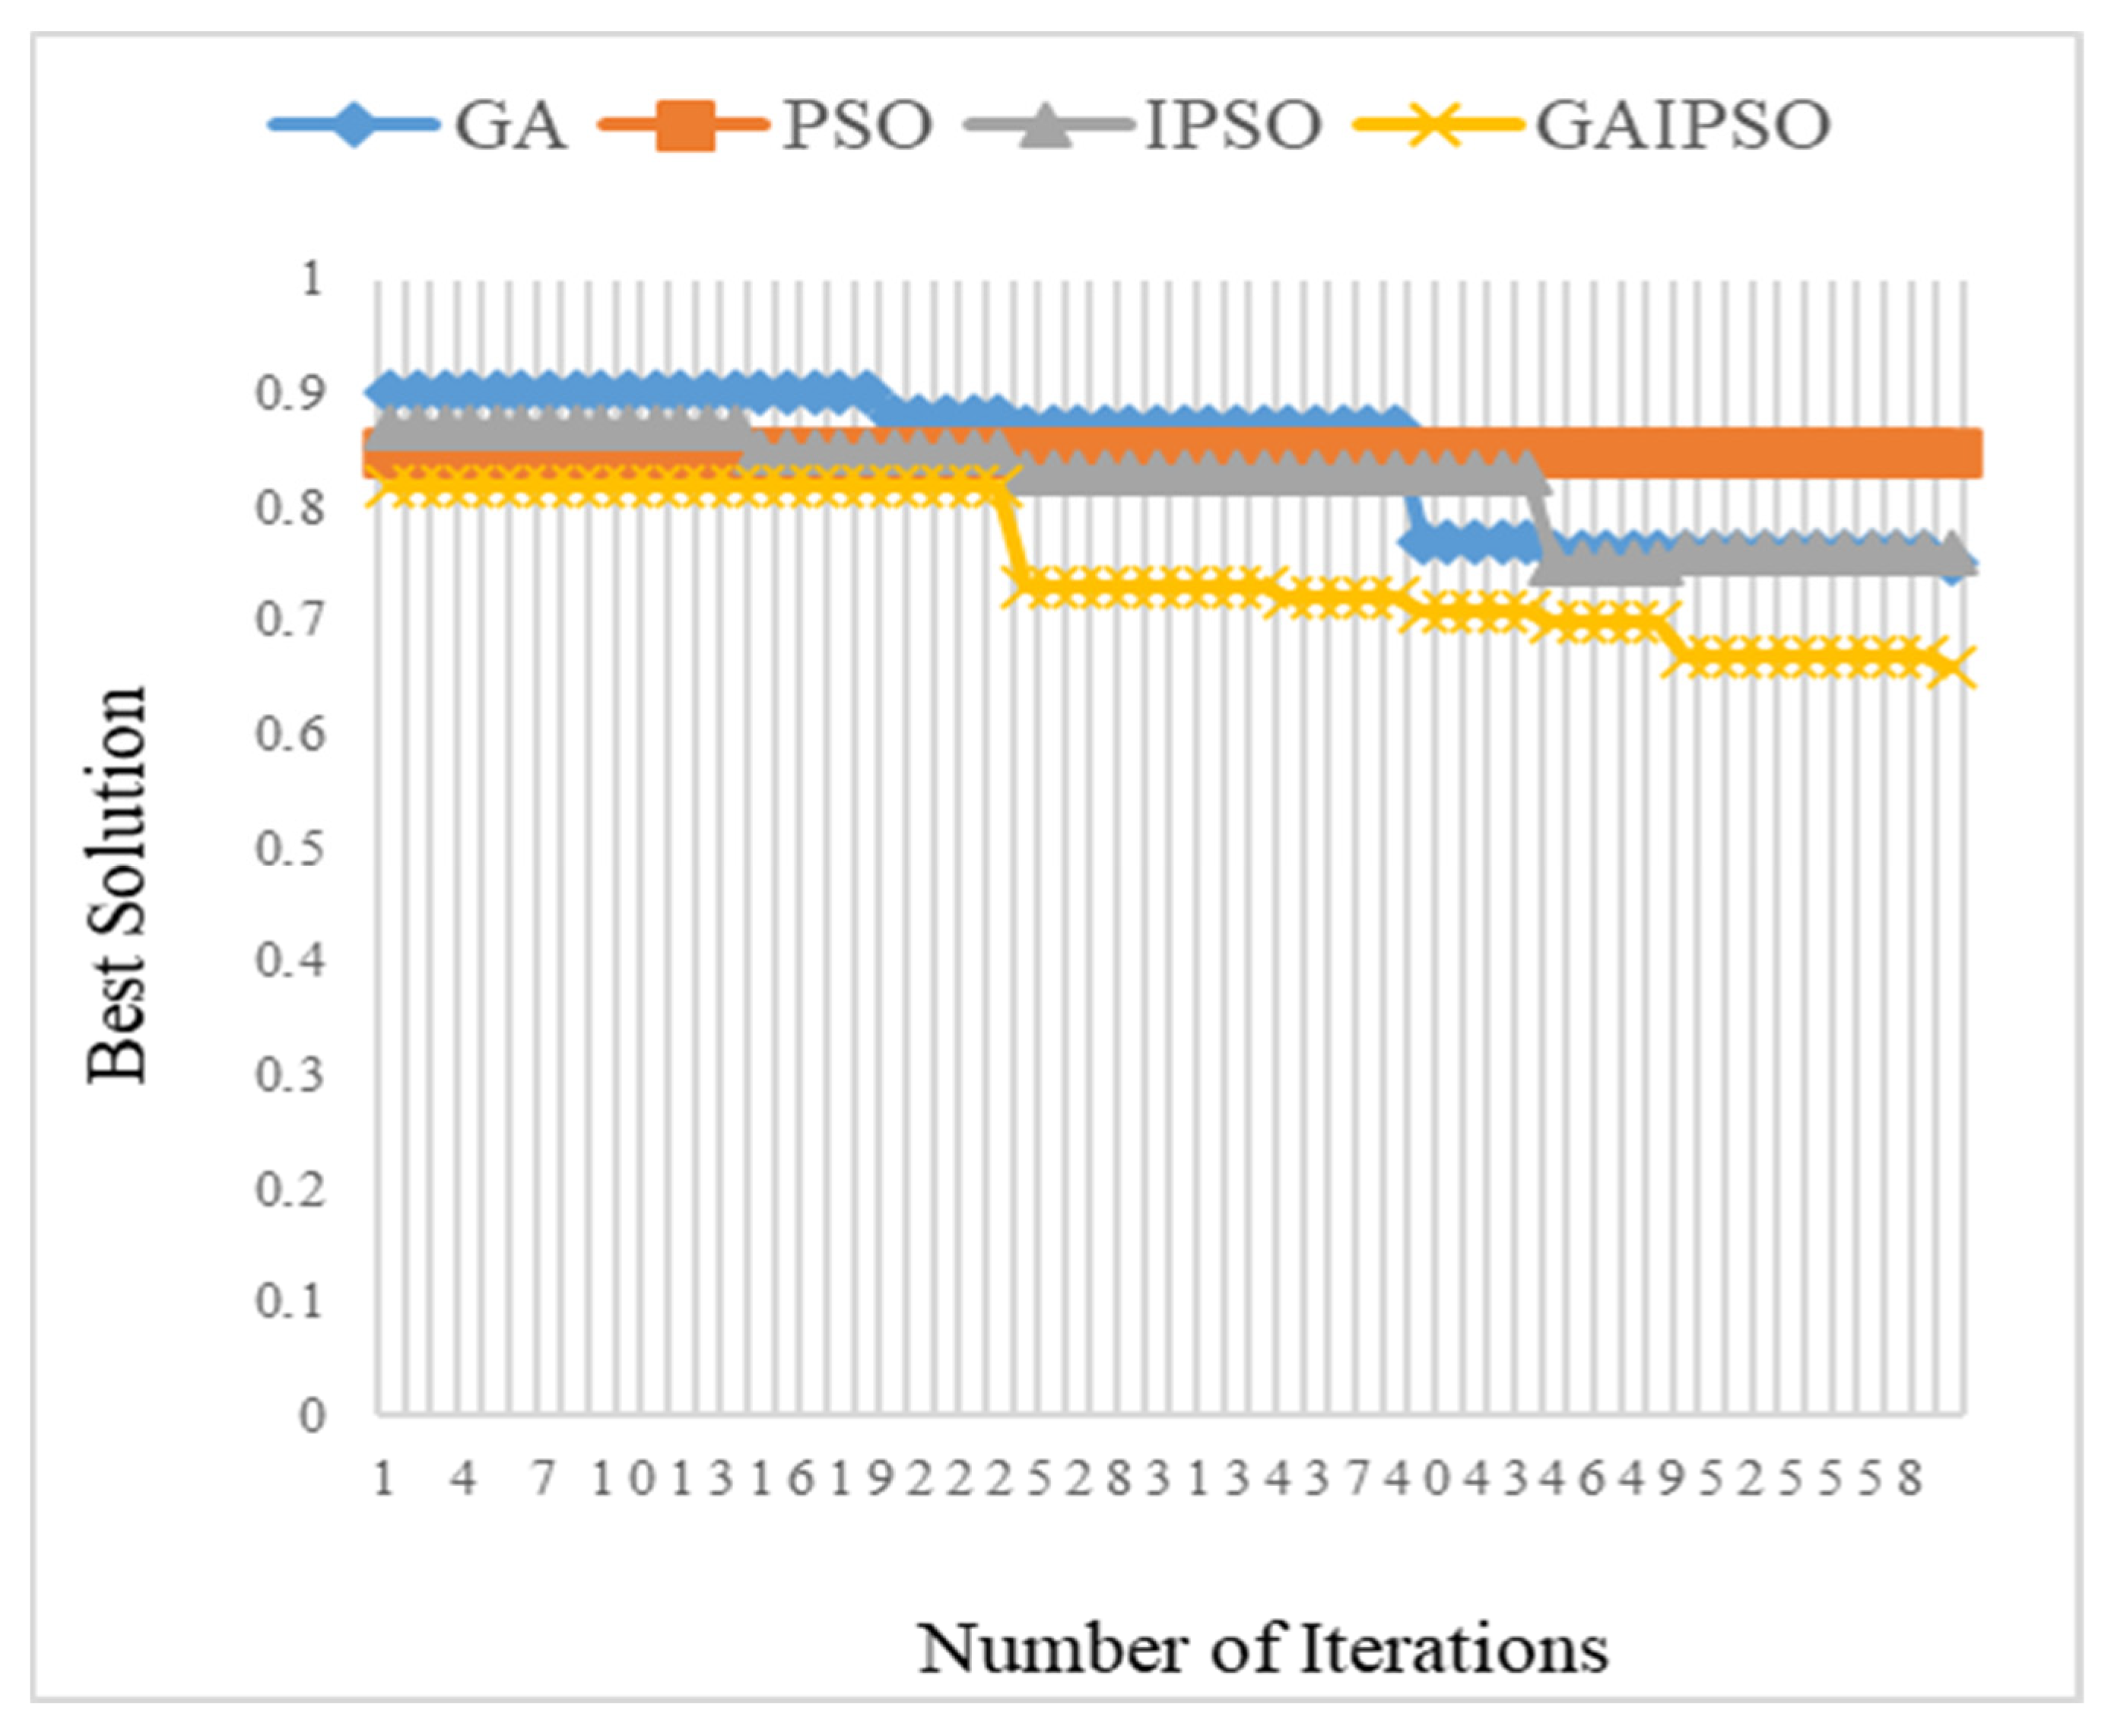
Table 3 indicates that the final cost has been reduced to 90.67%, even if the initial expenditure for REDGs acquired using HGAIPSO is the highest, as demonstrated in Table 4. The outcomes of the HGAIPSO algorithm are displayed in Table 4 and Figure 6. It has not only secured the maximum total number of EVs but has also attained the lowest value of the objective functions.
Table 3.
Comparison of the results acquired during Scenario 2 using a variety of optimization algorithms applied to the 118-bus system.
Table 4.
Comparative analysis of the outcomes of the multi-objective function during Scenario 2 using a variety of optimization techniques applied to the 118-bus system that was used.
Figure 6.
Convergence curves were generated using several different algorithms during Scenario 2.
6.3. Scenario Three
Table 5 demonstrates that the application of GA, PSO, and IPSO led to a reduction in voltage violations relative to Scenario 2. This was evidenced by the lesser amplitude of the voltage violation. The deployment of HGAIPSO resulted in a reduction in voltage violations and a decrease in capital expenses associated with REDGs. The findings further substantiate V2G’s potential to diminish the total system costs. The statistics in Table 6 and Figure 7 clearly demonstrate that HGAIPSO attained the minimal value for the objective functions.
Table 5.
A comparison of the outcomes produced during Scenario 3 using a variety of optimization algorithms applied to the 118-bus system.
Table 6.
A comparative analysis of the outcomes derived from the multi-objective function through Scenario 3 using a variety of optimization algorithms applied to the 118-bus system.
Figure 7.
Convergence curves were generated using several different algorithms during Scenario 3.
7. Conclusions
Surpassing the ideal quantity of electric vehicles will alter the voltage profile, leading to diminished bus voltages, while still within acceptable thresholds. The study’s objectives were achieved, and the HGAIPSO optimization method demonstrated superiority over GA, PSO, and IPSO in minimizing transmission losses in power grids by optimizing the placement and sizing of EVs. This study employed a hybrid methodology integrating GA and PSO to address the transmission network reconfiguration challenge, demonstrating both effectiveness and accuracy. This methodology employs a combination of techniques to maintain the distinct attributes of each individual.
Furthermore, the system utilizes a repair mechanism to satisfy the radial requirements for each GA chromosome or PSO particle, thereby significantly reducing the overall solution space. The hybrid technique may determine the globally optimal solution and converges rapidly without yielding to a local minimum. The hybrid methodology simultaneously identifies optimal solutions across several iterations, utilizing reduced computational time on average and exhibiting a lower standard deviation in losses compared to previous methods. The suggested method can determine the globally optimal solution and converges rapidly without falling into a local minimum.
Author Contributions
Conceptualization, M.N. and M.K.; methodology, M.N.; software, M.N.; writing—review and editing, M.K. All authors have read and agreed to the published version of the manuscript.
Funding
This research received no external funding.
Institutional Review Board Statement
Not applicable.
Informed Consent Statement
Not applicable.
Data Availability Statement
Data are available upon request.
Conflicts of Interest
The authors declare no conflicts of interest.
Abbreviations
The following abbreviations are used in this manuscript:
| REDG | Renewable Energy Distributed Generator |
| EV | Electric Vehicle |
| DG | Distributed Generator |
| CS | Charging Station |
| GA | Genetic Algorithms |
| RCGA | Real-Coded Genetic Algorithm |
| PLI | Power Loss Indices |
| IPSO | Improved Particle Swarm Optimization |
| HGAIPSO | Hybrid Genetic Algorithm Improved Particle Swarm Optimization |
| PSO | Particle Swarm Optimization |
References
- Huang, X.; Li, Y.; Men, J.; Sui, X.; Teodorescu, R.; Stroe, I. The Effect of Pulsed Current on the Performance of Lithium-ion Batteries. In Proceedings of the 2020 IEEE Energy Conversion Congress and Exposition (ECCE), Detroit, MI, USA, 11–15 October 2020; pp. 5633–5640. [Google Scholar]
- Biao, J.; Fangfang, L.; Zhiwen, A.; Zhiqiang, X.; Bin, J. Thermal Simulation of Power Lithium-ion Battery under Low Temperature and Preheating Condition. In Proceedings of the 2020 5th International Conference on Smart Grid and Electrical Automation (ICSGEA), Zhangjiajie, China, 13–14 June 2020; pp. 51–54. [Google Scholar]
- Deng, J.; Bae, C.; Denlinger, A.; Miller, T. Electric Vehicles Batteries: Requirements and Challenges. Joule 2020, 4, 511–515. [Google Scholar] [CrossRef] [Scilit]
- König, A.; Nicoletti, L.; Schröder, D.; Wolff, S.; Waclaw, A.; Lienkamp, M. An overview of parameter and cost for battery electric vehicles. World Electr. Veh. J. 2021, 12, 21. [Google Scholar] [CrossRef] [Scilit]
- Hardman, S.; Chandan, A.; Tal, G.; Turrentine, T. The effectiveness of financial purchase incentives for battery electric vehicles—A review of the evidence. Renew. Sustain. Energy Rev. 2019, 80, 1100–1111. [Google Scholar] [CrossRef] [Scilit]
- Lévay, P.Z.; Drossinos, Y.; Thiel, C. The effect of fiscal incentives on market penetration of electric vehicles: A pairwise comparison of total cost of ownership. Energy Policy 2019, 105, 524–533. [Google Scholar] [CrossRef] [Scilit]
- Curtin, J.; McInerney, C.; Gallachóir, B.Ó. Financial incentives to mobilise local citizens as investors in low-carbon technologies: A systematic literature review. Renew. Sustain. Energy Rev. 2019, 75, 534–547. [Google Scholar] [CrossRef] [Scilit]
- Automotive Dialogue. The Impact of Government Policy on Promoting New Energy Vehicles (NEVs): The Evidence in APEC Economies; APEC: Singapore, 2019. [Google Scholar]
- Brückmann, G.; Bernauer, T. What drives public support for policies to enhance electric vehicle adoption? Environ. Res. Lett. 2020, 15, 094002. [Google Scholar] [CrossRef] [Scilit]
- Abuelrub, A.; Al Khalayleh, A.R.; Allabadi, A. Optimal operation of electric vehicle charging station in an open electricity market. Int. J. Smart Grid Clean Energy 2019, 8, 495–499. [Google Scholar] [CrossRef] [Scilit]
- Yan, Q.; Zhang, B.; Kezunovic, M. Optimized operational cost reduction for an EV charging station integrated with battery energy storage and PV generation. IEEE Trans. Smart Grid 2019, 10, 2096–2106. [Google Scholar] [CrossRef] [Scilit]
- Huang, Z.; Li, Z.; Lai, C.S.; Zhao, Z.; Wu, X.; Li, X.; Tong, N.; Lai, L.L. A novel power market mechanism based on blockchain for electric vehicle charging stations. Electronics 2021, 10, 307. [Google Scholar] [CrossRef] [Scilit]
- Cheng, Y.H.; Lai, C.M.; Teh, J. Application of particle swarm optimization to design control strategy parameters of parallel hybrid electric vehicle with fuel economy and low emission. In Proceedings of the 2020 International Symposium on Computer, Consumer and Control (IS3C), Taichung, Taiwan, 6–8 December 2020; pp. 342–345. [Google Scholar]
- Zhou, S.; Chen, Z.; Huang, D.; Lin, T. Model Prediction and Rule Based Energy Management Strategy for a Plug-in Hybrid Electric Vehicle with Hybrid Energy Storage System. IEEE Trans. Power Electron. 2021, 36, 5926–5940. [Google Scholar] [CrossRef] [Scilit]
- Lee, H.; Nakasaku, S.; Hirota, T.; Kamiya, Y.; Ihara, Y.; Yamaura, T. Analysis of Energy Consumption and Possibility of Further Reduction of a Fuel Cell Garbage Truck. In Proceedings of the 21st International Conference on Intelligent Transportation Systems (ITSC), Maui, HI, USA, 4–7 November 2020. [Google Scholar]
- Lee, D.Y.; Elgowainy, A.; Dai, Q. Life cycle greenhouse gas emissions of hydrogen fuel production from chlor-alkali processes in the United States. Appl. Energy 2020, 217, 467–479. [Google Scholar] [CrossRef] [Scilit]
- Nagasawa, K.; Davidson, F.T.; Lloyd, A.C.; Webber, M.E. Impacts of renewable hydrogen production from wind energy in electricity markets on potential hydrogen demand for light-duty vehicles. Appl. Energy 2019, 235, 1001–1016. [Google Scholar] [CrossRef] [Scilit]
- Fan, X.; Liu, B.; Liu, J.; Ding, J.; Han, X.; Deng, Y.; Lv, X.; Xie, Y.; Chen, B.; Hu, W.; et al. Battery Technologies for Grid-Level Large-Scale Electrical Energy Storage. Trans. Tianjin Univ. 2020, 26, 92–103. [Google Scholar] [CrossRef] [Scilit]
- Kim, S.; Oguchi, H.; Toyama, N. A complex hydride lithium superionic conductor for high-energy-density all-solid-state lithium metal batteries. Nat. Commun. 2019, 10, 1081. [Google Scholar] [CrossRef] [Scilit] [PubMed]
- Cox, B.; Bauer, C.; Beltran, A.M.; van Vuuren, D.P.; Mutel, C.L. Life cycle environmental and cost comparison of current and future passenger cars under different energy scenarios. Appl. Energy 2020, 269, 115021. [Google Scholar] [CrossRef] [Scilit]
- Grunditz, E.A.; Thiringer, T. Performance analysis of current BEVs based on a comprehensive review of specifications. IEEE Trans. Transp. Electrif. 2018, 2, 270–289. [Google Scholar] [CrossRef] [Scilit]
- Islameka, M.; Kusuma, C.; Budiman, B. Influence of Braking Strategies for Electric Trike Energy Consumption. Int. J. Sustain. Transp. Technol. 2020, 3, 20–25. [Google Scholar] [CrossRef] [Scilit]
- Hong, J.; Park, S.; Chang, N. Accurate remaining range estimation for electric vehicles. In Proceedings of the 2018 21st Asia and South Pacific Design Automation Conference (ASP-DAC), Macao, China, 25–28 January 2018. [Google Scholar]
- Baek, D. Runtime Power Management of Battery Electric Vehicles for Extended Range with Consideration of Driving Time. IEEE Trans. Very Large Scale Integr. Syst. 2019, 27, 549–559. [Google Scholar] [CrossRef] [Scilit]

Disclaimer/Publisher’s Note: The statements, opinions and data contained in all publications are solely those of the individual author(s) and contributor(s) and not of MDPI and/or the editor(s). MDPI and/or the editor(s) disclaim responsibility for any injury to people or property resulting from any ideas, methods, instructions or products referred to in the content. |
© 2026 by the authors. Licensee MDPI, Basel, Switzerland. This article is an open access article distributed under the terms and conditions of the Creative Commons Attribution (CC BY) license.