


Abstract
Namibia’s strategy to lessen reliance on electricity imports and move toward sustainable energy includes integrating its abundant renewable energy resources—particularly solar and wind—into its grid. Although there are advantages of renewable energy, integrating it into the grid presents serious technical difficulties. This study examines how Namibia’s grid is affected by this integration, paying attention to fault level behaviour, load flow analysis, contingency response, and voltage stability using QV analysis. The impact of distributed generation on power flows, voltage profiles, and system reliability is illustrated through analytical formulations and simulation results. Findings reveal better bus voltages and lower power losses, but they also show changes in voltage stability margins and a decrease in the fault current contribution, showing that while integration increases sustainability, maintaining overall grid stability requires supplementary measures.
1. Introduction
There are both opportunities and challenges in Namibia’s electricity sector. Namibia is a net importer of electricity because its domestic demand frequently exceeds the installed capacity of its relatively small power system, which has an installed capacity of about 680 MW [1]. Over 60% of Namibia’s electricity has historically come from imports, mostly from the Southern African Power Pool (SAPP) and Eskom in South Africa [2]. Due to this reliance, Namibia’s economy is vulnerable to regional market price swings and supply shortages. Table 1 shows the electrical tariffs in Namibia and how they are to increase yearly [3].
Table 1.
Namibia’s electrical tariffs.
Namibia also has some of the best renewable energy resources in the world. The nation is ideal for large-scale photovoltaic (PV) projects because its average annual solar irradiation levels surpass 2200 kWh/m2. Significant generation potential is also presented by wind resources, especially along the southern and coastal regions like Lüderitz [4]. The Namibian government, through the Electricity Control Board (ECB) and Namibia Energy Institute (NEI), has recognized this opportunity and created grid codes and supportive policies to promote investments in renewable energy [5]. With capacities ranging from 5 MW to over 45 MW, a number of independent power producers (IPPs) have already put solar PV projects into service, directly supplying the national grid.
With a focus on four main areas, this paper explores the technical effects of renewable integration into the Namibian grid. Load flow analysis, which looks at changes in power flows and bus voltage profiles [5]; contingency analysis, which evaluates the system’s ability to withstand outages [6]; fault level assessment, which takes into account the decrease in short-circuit current contributions; and QV analysis, which assesses voltage stability margins will be the focus areas of this paper. The integration of a 10 MW photovoltaic plant in Lüderitz is used as a case study to illustrate the advantages and difficulties of renewable penetration. In the pursuit of a sustainable energy future, the findings are intended to assist system operators, engineers, and policy makers in strengthening Namibia’s grid resilience [7].
2. Methodology
2.1. Conceptual Analysis
2.1.1. Load Flow Analysis
By calculating voltage levels, power flows, and losses, load flow analysis evaluates the power grid’s steady-state performance [8]. The dynamics of load flow are impacted by the variability in power generation brought about by the integration of renewable energy sources, particularly solar and wind. A high percentage of renewable energy can cause voltage swings and higher losses, especially in areas with inadequate grid infrastructure.
Load flow studies calculate bus voltages, angles, and active and reactive power flows. With renewable integration, generation variability affects these parameters. The following equations show how these calculations are achieved:
where Pi and Qi are active and reactive power injections, Vi is bus voltage magnitude, and Gij and Bij are elements of the bus admittance matrix.
2.1.2. Contingency Analysis
Contingency analysis evaluates the grid’s ability to withstand unexpected disturbances, such as the loss of a generator or transmission line [9]. Renewable energy sources, due to their intermittent nature, can exacerbate the impact of such contingencies. Simulations have shown that the loss of renewable generation can lead to voltage instability and potential cascading failures if not properly managed. Contingency analysis assesses how well the system handles unforeseen disruptions [10]. Typical situations include:
- Loss of a generator (Gi);
- Transmission line tripping (L ij).
- The following equation shows how the calculation for the contingency analysis is done:where
- = change in power on line k;
- = sensitivity of line k to outage of line mn.
2.1.3. Fault Levels
Designing protection systems requires knowing the maximum fault current that can happen during short circuits, which is determined by fault level analysis [10]. Fault current contributions can be changed by integrating renewable energy sources, especially those with power electronic interfaces like inverters. High penetration of these sources could lower fault levels and possibly compromise protection schemes’ efficacy [11].
Fault level determines maximum currents during short circuits, essential for protection design.
The fault current under a three-phase short circuit condition is calculated as follows:
where Zth is the Thevenin equivalent impedance seen from the fault location.
2.1.4. Voltage Stability Analysis
Voltage stability analysis examines the grid’s ability to maintain acceptable voltage levels under varying load and generation conditions [12]. Renewable energy integration can impact voltage stability due to the variability of generation and reactive power support. Studies have identified that certain areas of the grid become more susceptible to voltage instability with increased renewable penetration, necessitating enhanced reactive power compensation and voltage control measures [13].
2.2. System Formulation
This study uses analytical modelling and simulation to assess the effects of integrating renewable energy into Namibia’s power grid. The methodology uses case study simulations in the OpenDSS Version 10,0 and MATLAB Simulink R2025a (MathWorks, Natick, MA, USA) environments in conjunction with power system equations, contingency modelling, and voltage stability analysis.
- Study Area and Test System
The transmission network of Namibia serves as the basis for the analysis, with a focus on the southern coastal region, which has a wealth of wind and solar resources. Because of its high solar potential and close proximity to the national transmission corridor, Lüderitz’s 10 MW photovoltaic (PV) system was chosen as the case study for renewable integration. Five primary buses serve as transmission nodes in the test system, and load data and line parameters are estimated using publicly accessible NamPower statistics.
2.2.1. Methodology for Load Flow Analysis
The Newton–Raphson method, which solves nonlinear power flow equations for bus voltages, angles, and power flows, was used to perform steady-state load flow [14]. The governing equations for load flow analysis are Equations (1) and (2). Simulations were run for the base case (no PV) and with 10 MW PV injection to observe changes in voltage profiles.
2.2.2. Methodology for Contingency Analysis
To evaluate the system’s resilience to disruptions like line or generator outages, contingency analysis was done. To test the robustness of the system, an N–1 contingency criterion was used, which involves removing one line or generator at a time. Changes in line flows were estimated using the Power Transfer Distribution Factor (PTDF) shown in Equation (3).
2.2.3. Methodology for Fault Current Analysis
This allows quick estimation of overload risk due to PV intermittency or unexpected outages.
Before and after PV integration, short-circuit currents were assessed through fault studies. Utilizing the Thevenin equivalent (Equation (4)) at the malfunctioned bus, the three-phase fault current was computed.
2.2.4. Methodology for Voltage Stability (QV) Analysis
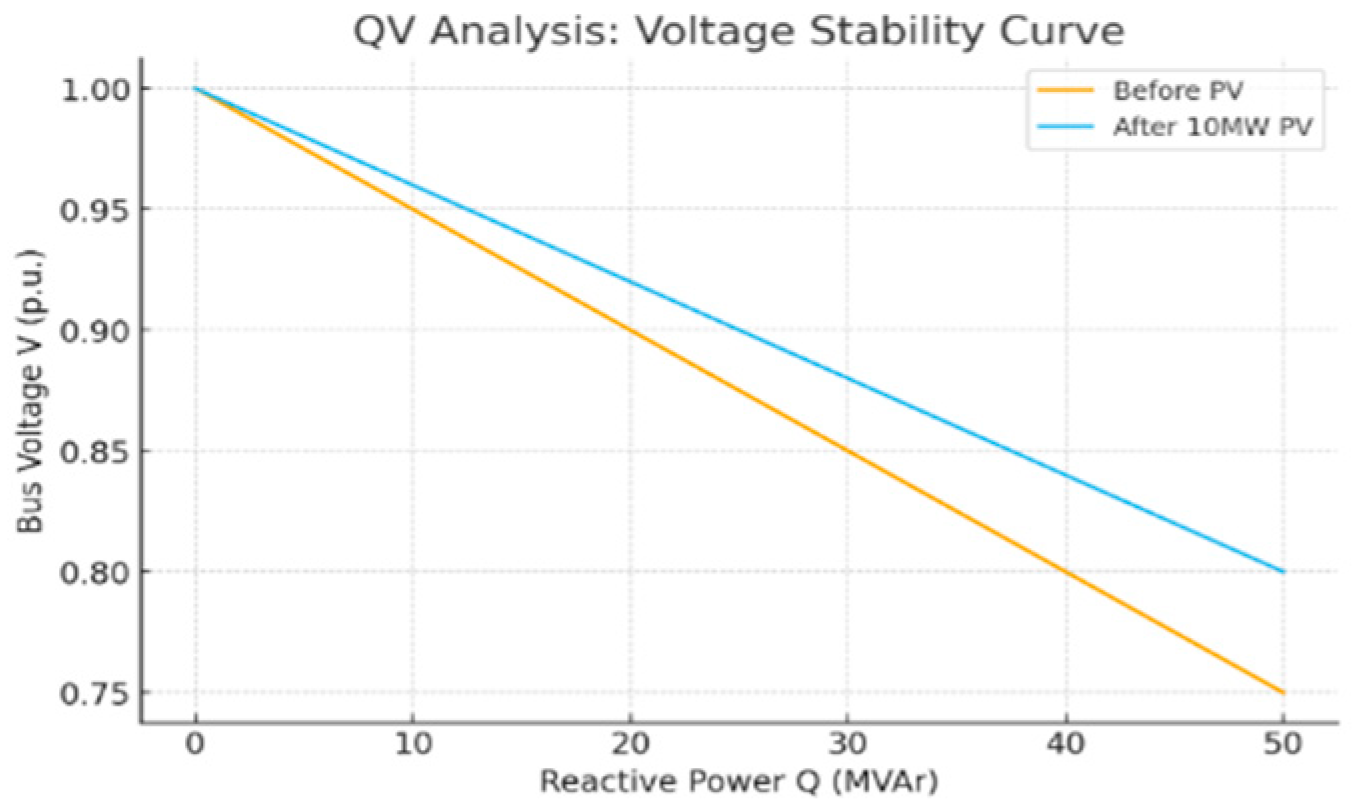
Voltage stability was assessed using QV curve analysis, which plots bus voltage V against injected reactive power Q. The slope of the QV curve indicates the stability margin, with the critical point defined as
To ascertain the impact of renewable penetration on voltage stability margins, simulations were conducted for the system’s weakest bus, comparing pre- and post-PV-integration scenarios.
2.2.5. Tools for Simulation
Because OpenDSS is flexible in modelling distributed generation, it was used for fault level analysis, contingency, and steady-state load flow.
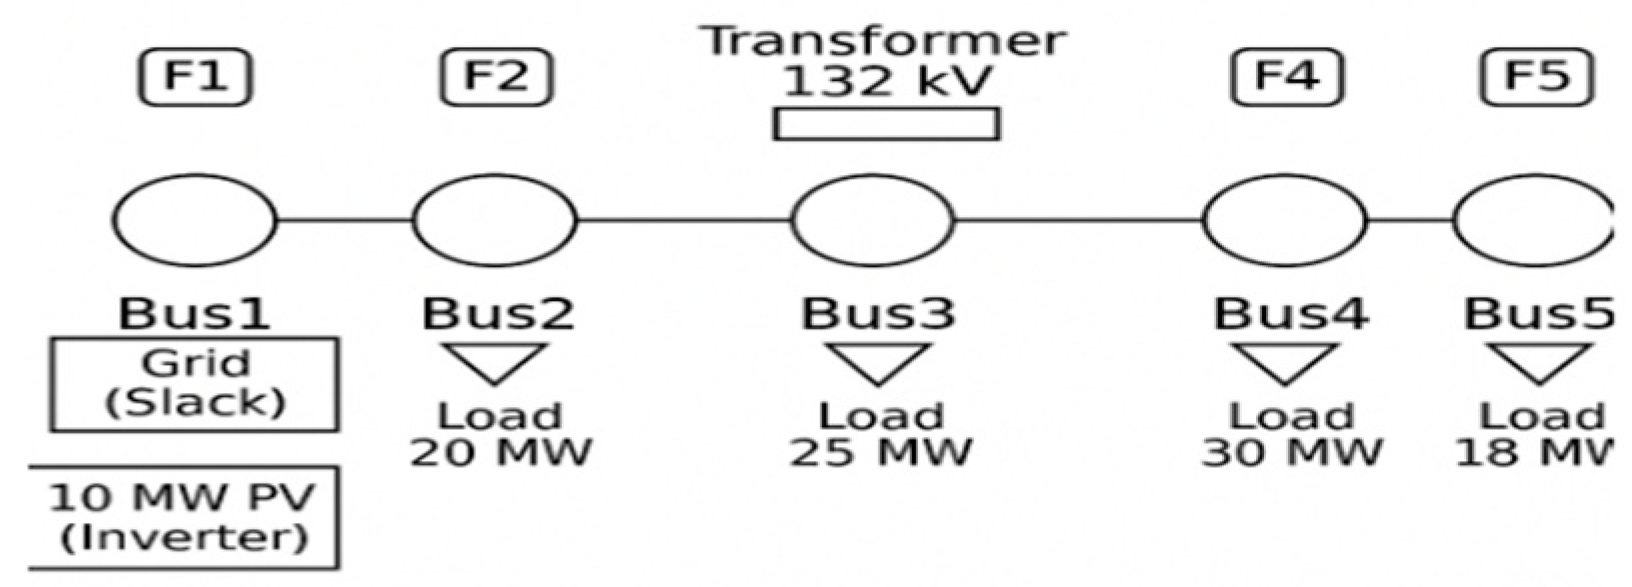
- Circuit Representation of the System in Luderitz
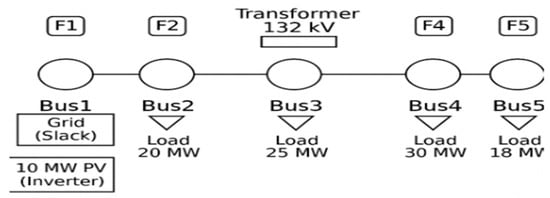
Figure 1 below is a circuit representation of the system in Luderitz. The system comprises of 5 bus bars with the 10 MW PV source at Bus 1 and loads at Buses 2 to 5.
Figure 1.
Single-line diagram for the 5-bus test system.
3. Results and Discussions
3.1. Load Flow Analysis Results
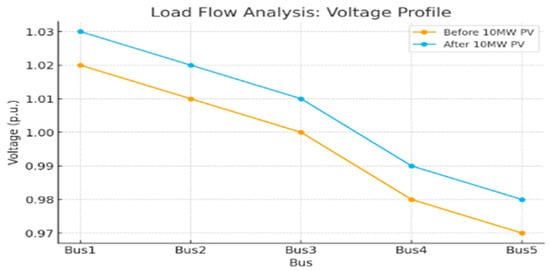
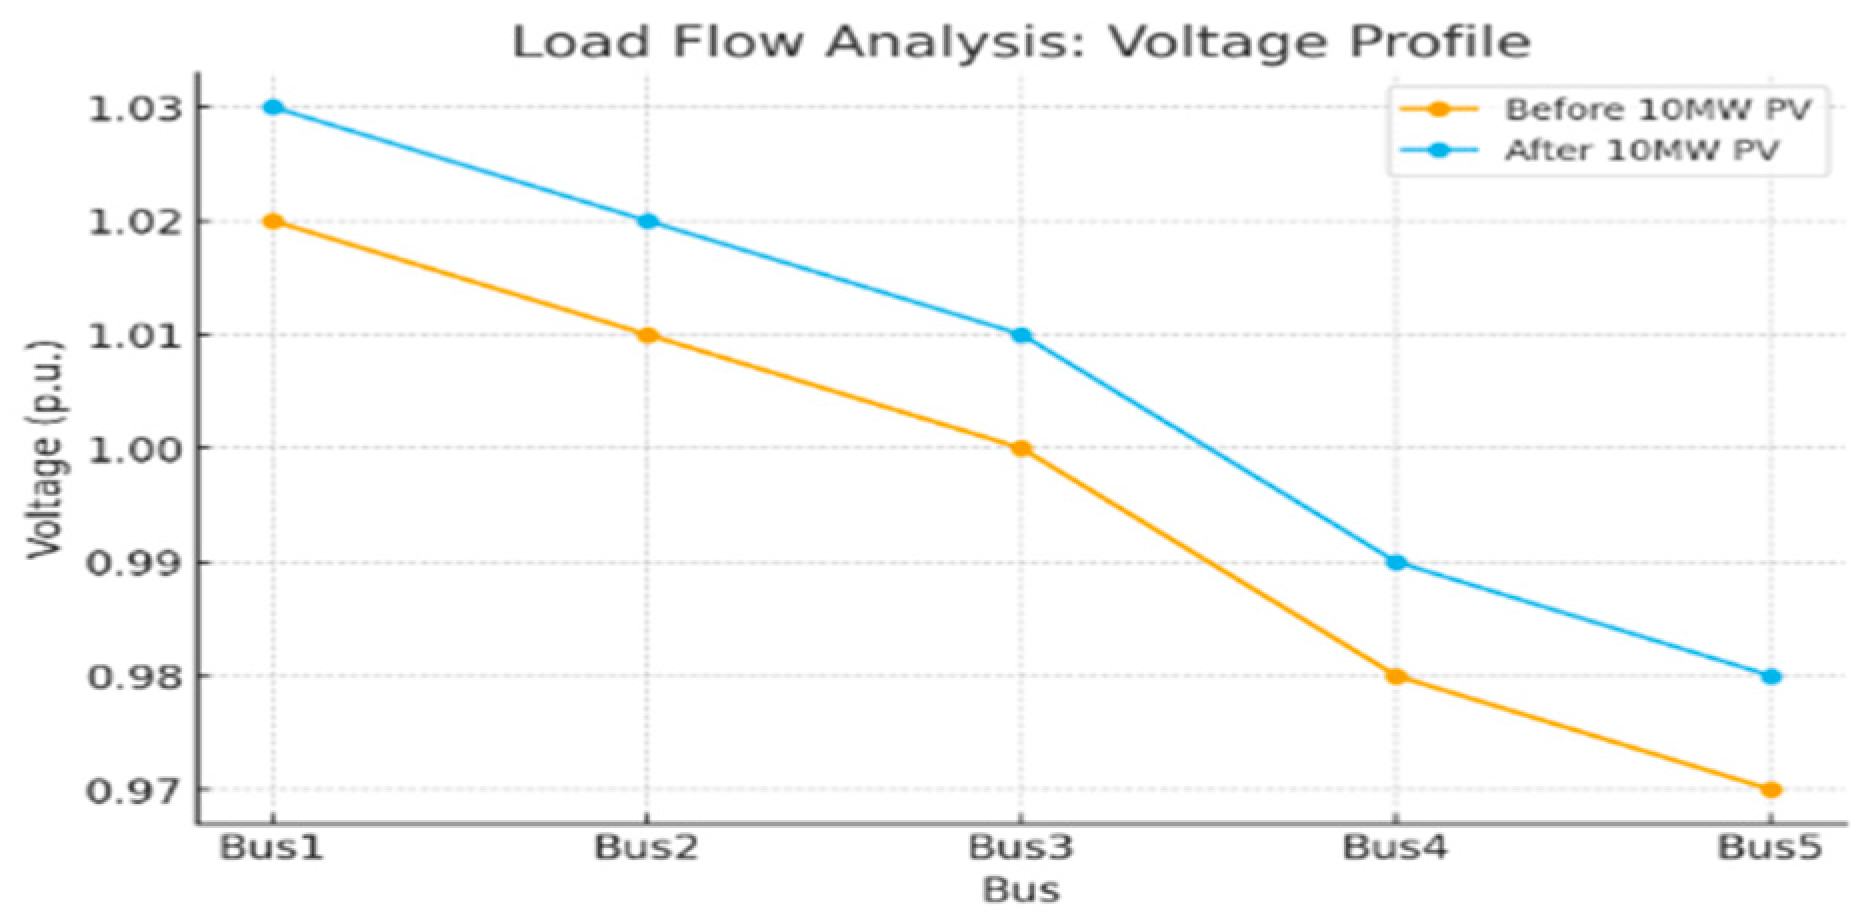
The bus voltage magnitudes before and after the integration of a 10 MW PV plant in Lüderitz are displayed in Table 2 below. The findings show that bus voltages have improved, especially at the weakest buses (Bus 4 and Bus 5) and this also aligns with the voltage profile plot.
Table 2.
Bus voltage magnitudes.
The voltage profile plot in Figure 2 below is a summary of the load flow analysis when a 10 MW PV system is added to the grid.
Figure 2.
Voltage profile plot.
3.2. Voltage Stability Analysis Results
The slope of the QV curve improves after PV integration, delaying voltage collapse.
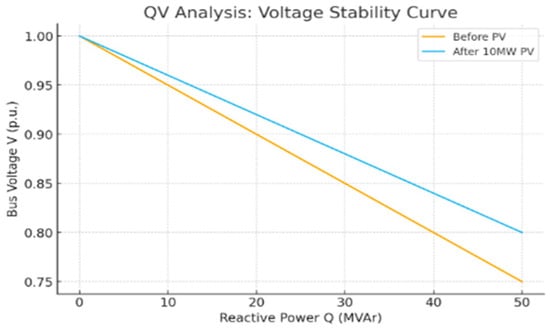
By lessening the strain on traditional generators, PV integration improves reactive power balance. As a result, the grid becomes more resilient and the voltage stability margin rises. The voltage stability curve in Figure 3 below is an indication of what happens to the reactive power balance as a result of PV integration into the grid.
Figure 3.
Voltage stability curve.
3.3. Fault Level Analysis Results
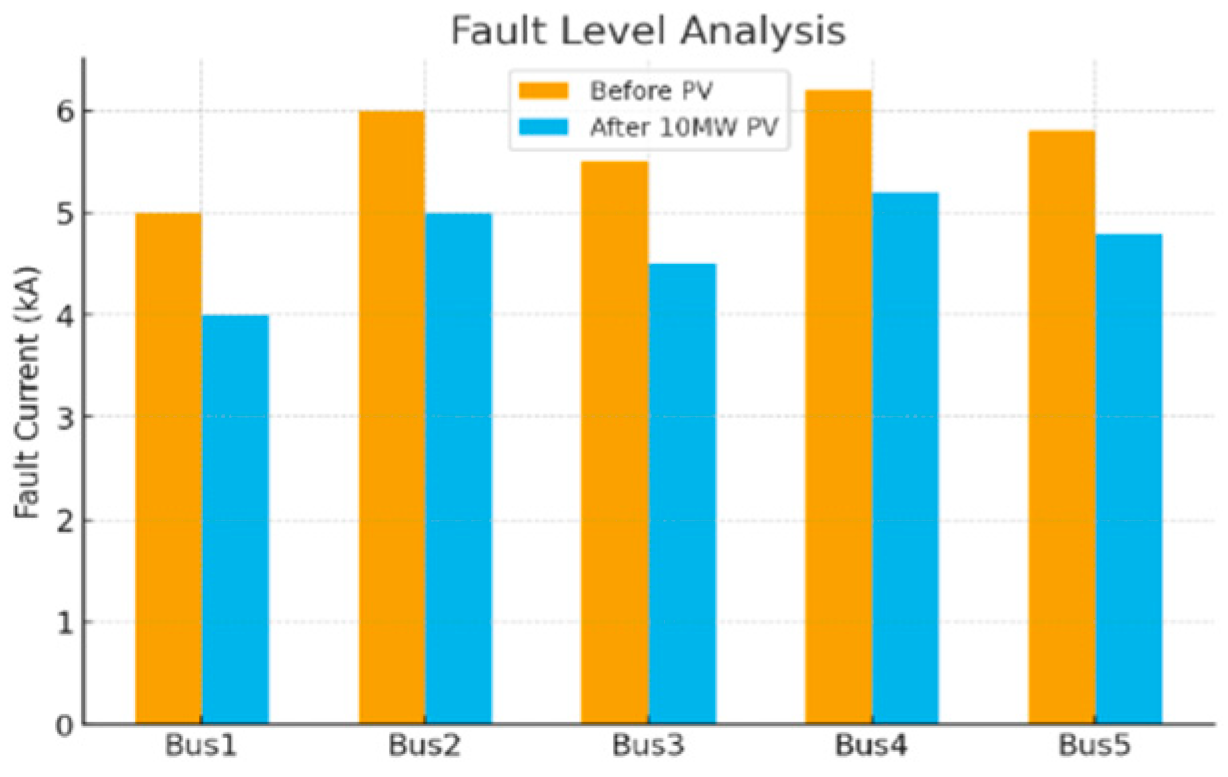
Fault currents at various buses are compared in Table 3 below. Compared to synchronous generators, the inverter-based PV plant contributes less to short circuits, which lowers fault current levels.
Table 3.
Fault currents.
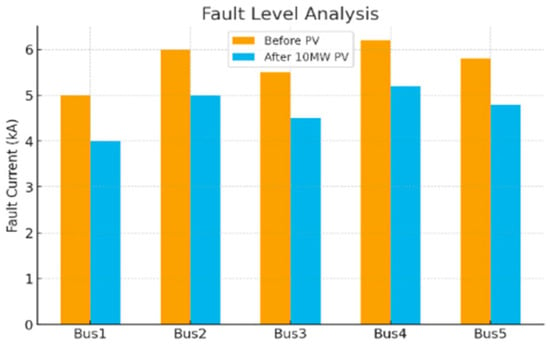
The fault analysis graph in Figure 4 below shows the behaviour of fault currents during the integration of a PV system into the grid.
Figure 4.
Fault level analysis.
3.4. Contingency Analysis Results
A major transmission line outage was simulated in order to perform an N–1 contingency study. The impact on line flows and bus voltages in the base case and following the integration of the 10 MW PV system is compiled in Table 4.
Table 4.
Contingency study.
- Detailed discussion of all results
Following PV integration, the voltage profile results consistently demonstrate an improvement of roughly 0.01 p.u. at all buses. For a weak grid like Namibia’s, where voltage drops are frequent because of lengthy transmission lines and constrained generation capacity, these improvements, despite their modest size, are significant. Transmission losses are decreased because local PV generation eliminates the need for power transfer from far-off generators and imports. This is consistent with similar results in weak-grid environments in Africa, where localized voltage support is provided by distributed PV.
However, the benefits are moderate because PV plants are inverter-based and generally operate at unity power factor, supplying only active power. Without reactive power capability, voltage improvements remain limited. If the PV plant were configured with Volt/VAR control, larger improvements could be achieved.
4. Conclusions
This study investigated the impact of renewable energy integration into the Namibian power grid, focusing on load flow, voltage stability, fault level, and contingency performance. Simulation results from a 10 MW photovoltaic plant connected to a five-bus test system demonstrated that renewable integration provides several technical benefits. Bus voltage magnitudes improved by approximately 0.01 p.u., while QV analysis revealed an increase in voltage stability margins. Fault level analysis showed a consistent reduction in short-circuit currents across all buses, and contingency analysis indicated reduced line loading and improved post-contingency voltages. These results confirm that distributed renewable generation enhances grid resilience and reduces dependence on long-distance power imports. However, challenges remain. The reduction in fault currents poses risks to traditional overcurrent protection schemes, necessitating adaptive or differential protection solutions.
Author Contributions
Conceptualization, T.H. and R.J.; methodology, S.M.; software, R.J.; validation, T.H., S.M. and R.J.; formal analysis, T.H.; investigation, R.J.; resources, S.M.; data curation, T.H.; writing—original draft preparation, R.J.; writing—review and editing, S.M.; visualization, R.J.; supervision, T.H.; project administration, S.M.; funding acquisition, T.H. All authors have read and agreed to the published version of the manuscript.
Funding
This research received no external funding.
Institutional Review Board Statement
Not applicable.
Informed Consent Statement
Not applicable.
Data Availability Statement
The data and simulation models used in this study including Matlab and OpenDSS files, are available from the corresponding author upon reasonable request.
Conflicts of Interest
The authors declare no conflict of interest.
References
- Katanga, L.N. Analysis of Tolerable Capacity Limits of Intermittent Renewable Energy in Namibia’s Power System; University of Namibia: Windhoek, Namibia, 2021; Available online: https://repository.unam.edu.na/bitstreams/6b3bd981-59a9-4ba9-849a-b3f53b09e388/download (accessed on 14 May 2026).
- Adnan, A.Z.; Yusoff, M.E.; Hashim, H. Analysis on the Impact of Renewable Energy to Power System Fault Level. Indones. J. Electr. Eng. Comput. Sci. 2018, 11, 652–657. [Google Scholar] [CrossRef] [Scilit]
- Samuel, I.A.; Katende, J.; Awosope, C.O.A.; Awelewa, A.A.; Adekitan, A.I.; Agbetuyi, F.A. Power System Voltage Collapse Prediction Using a New Line Stability Index. Int. J. Electr. Comput. Eng. 2019, 9, 5125–5133. [Google Scholar]
- Serem, N.; Letting, L.K.; Munda, J. Voltage Profile and Sensitivity Analysis for a Grid Connected Solar, Wind and Small Hydro Hybrid System. Energies 2021, 14, 3555. [Google Scholar] [CrossRef] [Scilit]
- Electricity Control Board (ECB). Namibia Renewable Energy Grid Code: Final; ECB: Windhoek, Namibia, 2020. Available online: https://www.ecb.org.na/wp-content/uploads/2022/07/ECB_Namibia-RE-Grid-Code-Final_21July20_v3.pdf (accessed on 14 May 2026).
- NamPower. Annual Report 2023; NamPower: Windhoek, Namibia, 2023; Available online: https://www.nampower.com.na (accessed on 14 May 2026).
- Electricity Control Board (ECB). Namibia Electricity Supply Industry Annual Report 2022; ECB: Windhoek, Namibia, 2022.
- Kundur, P. Power System Stability and Control; McGraw-Hill: New York, NY, USA, 1994. [Google Scholar]
- Grainger, J.J.; Stevenson, W.D. Power System Analysis; McGraw-Hill: New York, NY, USA, 1994. [Google Scholar]
- Iweh, C.D.; Gyamfi, S.; Tanyi, E.; Effah-Donyina, E. Distributed Generation and Renewable Energy Integration into the Grid: Prerequisites, Push Factors, Practical Options, Issues and Merits. Energies 2021, 14, 5375. [Google Scholar] [CrossRef] [Scilit]
- IEEE Std 1547-2018; IEEE Standard for Interconnection and Interoperability of Distributed Energy Resources with Associated Electric Power Systems Interfaces. IEEE Power & Energy Society: New York, NY, USA, 2018.
- Chis, C.; Eberhard, R.; Kaplan, J.M. Namibia’s Electricity Sector: Structure, Performance, and Reform. J. Energy S. Afr. 2017, 28, 47–58. [Google Scholar]
- Ackermann, T.; Andersson, G.; Söder, L. Distributed Generation: A Definition. Electr. Power Syst. Res. 2001, 57, 195–204. [Google Scholar] [CrossRef] [Scilit]
- Harrison, G.P.; Wallace, A.R. Optimal Power Flow Evaluation of Distribution Network Capacity for the Connection of Distributed Generation. IEE Proc.—Gener. Transm. Distrib. 2005, 152, 115–122. [Google Scholar] [CrossRef] [Scilit]

Disclaimer/Publisher’s Note: The statements, opinions and data contained in all publications are solely those of the individual author(s) and contributor(s) and not of MDPI and/or the editor(s). MDPI and/or the editor(s) disclaim responsibility for any injury to people or property resulting from any ideas, methods, instructions or products referred to in the content. |
© 2026 by the authors. Licensee MDPI, Basel, Switzerland. This article is an open access article distributed under the terms and conditions of the Creative Commons Attribution (CC BY) license.