


Abstract
African universities face persistent energy insecurity that disrupts teaching, research, and campus operations. While renewable energy adoption is growing, hydrogen-based hybrid renewable energy systems (HRES) remain underexplored, and standard evaluation tools are lacking. This paper presents a replicable techno-economic framework for integrating renewable-hydrogen systems into university microgrids using Hybrid Optimization Model for Multiple Energy Resources (HOMER) simulation. The framework evaluates reliability, environmental impact, economic feasibility, and scalability under real campus conditions. A case study of the Mangosuthu University of Technology (MUT) Engineering Building compares three scenarios: grid-plus-diesel backup, (photovoltaic) PV–battery–hydrogen hybrid with grid support, and PV–battery–hydrogen hybrid with diesel backup. Results indicate that the PV–battery–hydrogen configuration with grid support achieved 98% reliability, a 74% reduction in Carbon dioxide (CO2) emissions, and an Levelized Cost of Energy (LCOE) of $0.124/kWh, outperforming the current grid–diesel setup. These findings confirm the framework’s effectiveness as a benchmarking tool and its potential to guide African universities toward resilient, low-carbon energy systems aligned with national transition goals.
1. Introduction
Energy insecurity remains a major challenge for institutions across sub-Saharan Africa, including universities. Regular blackouts, load-shedding events, and unstable grid supplies interrupt academic programs, laboratory activities, digital infrastructure, and campus operations [1,2,3]. Studies report consistent disruptions to lectures, research, and residence facilities, which affect academic performance and institutional productivity [2,3].
Universities reflect broader national energy transition challenges. Campuses carry complex load profiles, high reliability requirements, and growing digital infrastructure demands. Institutions must maintain a consistent energy supply while reducing dependence on diesel generators and fossil-based power sources [4]. Many campuses attempt to adopt renewable systems, but they face similar constraints seen at the national level, including policy uncertainty, high capital costs, infrastructure limitations, and operational challenges [5].
Although renewable hydrogen is gaining interest because of Africa’s strong solar and wind potential, most studies focus on industrial-scale or export-orientated hydrogen systems, not institutional microgrids [6,7]. Existing research also lacks standardised frameworks designed for campus environments with mixed load characteristics and continuous operational demands.
This study introduces a structured evaluation framework to help universities assess renewable-hydrogen systems based on reliability, sustainability, economics, and scalability. The aim is to support decision-making and long-term planning for African universities working toward resilient, low-carbon energy systems. Moreover, it contributes to the growing discourse on sustainable energy transitions in Africa by developing a replicable techno-economic evaluation framework for renewable-hydrogen hybrid systems tailored to university campuses. Unlike prior studies that focus on national or industrial applications, this research contextualizes hydrogen integration within institutional microgrids, addressing the operational realities of African universities [8,9]. The framework’s novelty lies in its multi-dimensional approach, integrating technical, economic, and environmental sub-models, assessed through metrics such as LCOE, Net Present cost (NPC), and CO2 offset, to ensure balanced evaluation and policy relevance. Furthermore, by introducing a replicability index and applying the framework to a real campus case study, it offers a scalable and evidence-based tool for energy planning, benchmarking, and sustainability decision-making across higher education institutions [10].
2. Literature Review
Energy insecurity is a significant barrier to academic development in many African countries. Universities rely on stable electricity for laboratories, libraries, digital learning platforms, and administrative systems, yet most institutions remain tied to national grids that experience regular outages [1,2]. South Africa, Nigeria, Zimbabwe, and Kenya continue to experience load-shedding events that disrupt normal campus operations and reduce research productivity [3,4].
Campus microgrids have emerged as a viable strategy to address these challenges. Several African universities have implemented solar PV systems to reduce reliance on unstable grids. Studies report that solar PV improves reliability, supports essential services during outages, and reduces the operational expenses associated with diesel generator use [11,12]. However, these systems often lack sufficient storage, leading to curtailment during excess generation and poor performance during extended outages. This creates a need for solutions that provide both short-term and long-term energy buffering.
Diesel generators are still the default backup across the continent due to their rapid response and low initial cost, yet they are associated with high fuel expenses, noise pollution, and significant carbon emissions [13]. Frequent generators use also increases maintenance expenses and reduces the financial benefits of renewable integration. Universities seeking sustainability certifications or carbon reduction targets face institutional pressure to reduce fossil fuel use, further motivating the search for cleaner backup solutions.
Despite considerable progress in renewable energy research across Africa, there remains a clear research gap in the development of standardised, replicable frameworks for evaluating renewable-hydrogen systems within university infrastructures. Most existing studies focus on national or rural electrification contexts, overlooking universities as microcosms of energy transition challenges with complex and continuous power demands [8]. Research on hydrogen energy in Africa has largely cantered on industrial and export applications, with limited attention to localized, campus-level techno-economic assessments [9]. Furthermore, current analyses often employ tools such as HOMER in isolation, focusing narrowly on cost optimization while neglecting multi-objective considerations like environmental performance, system reliability, and replicability [14]. The absence of comprehensive and scalable evaluation frameworks hinders cross-institutional benchmarking and policy alignment. Moreover, the integration of optimization algorithms and Artificial intelligence (AI)-driven predictive modelling into hydrogen-based hybrid system design for educational facilities remains largely unexplored [15]. Therefore, there is an urgent need for a unified, data-driven framework that assesses the technical, economic, and environmental dimensions of renewable-hydrogen integration in African universities, enabling evidence-based energy planning and advancing sustainability goals across the higher education sector.
3. Methodology Framework
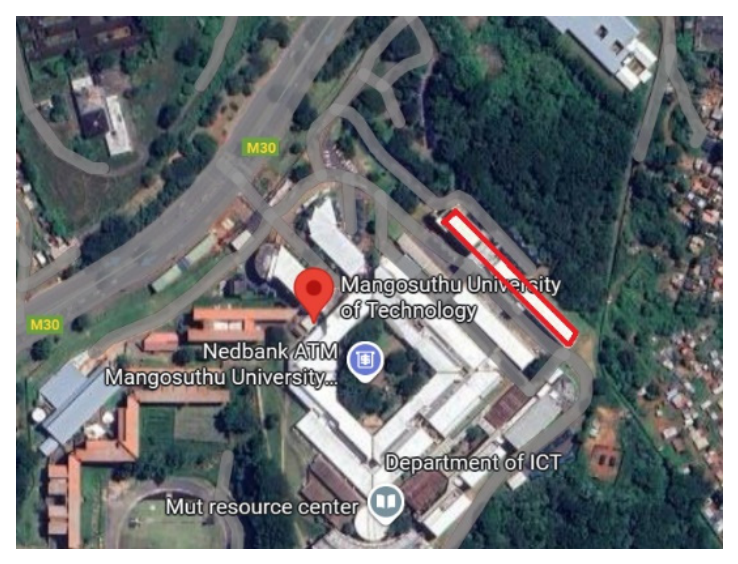
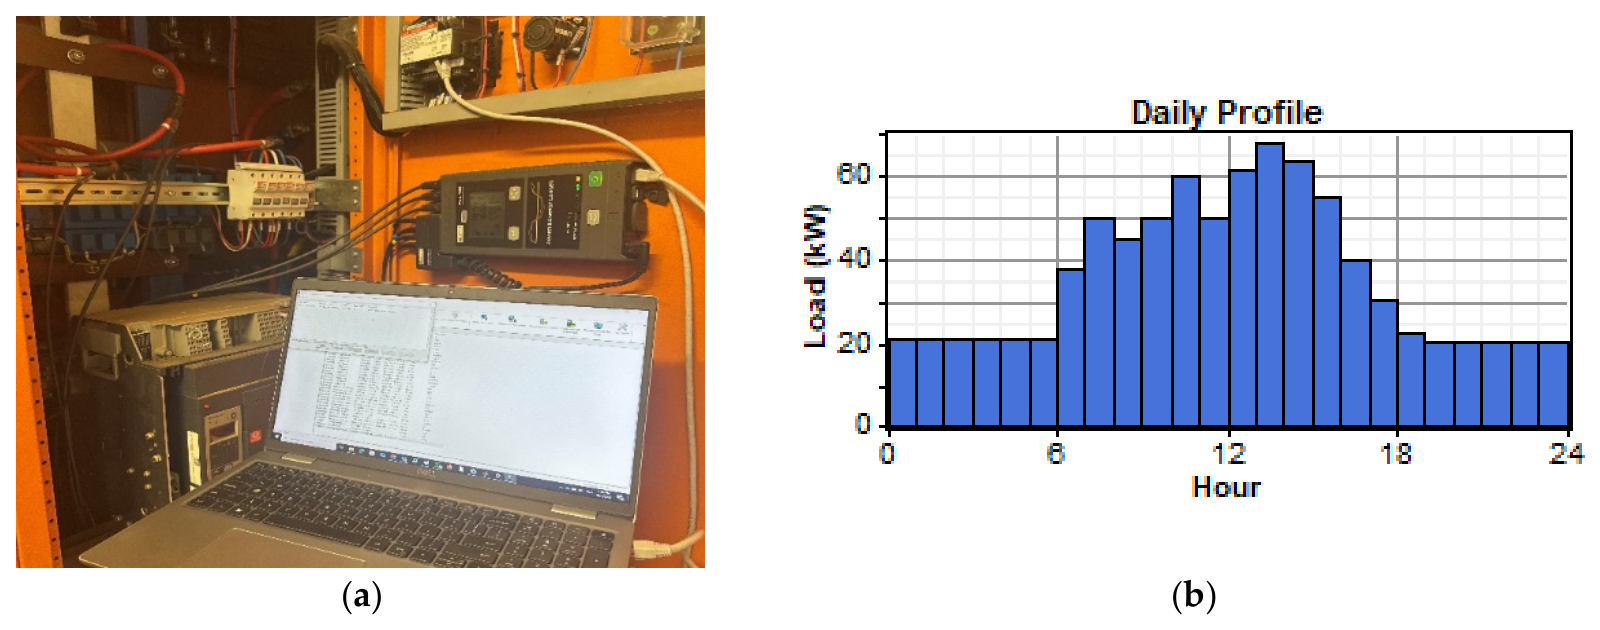
The methodology is structured to ensure modularity, scalability, and data transparency. Modularity allows generation, storage, and conversion components to be modelled separately and then integrated, enabling easy adaptation or extension. Scalability ensures that the framework can accommodate campuses of varying sizes and energy demands, from small rural colleges to large urban universities. Data transparency ensures that all input parameters, assumptions, and calculation methods are clearly defined, reproducible, and suitable for data-scarce contexts common in African universities [12]. The study incorporates detailed load and resource data along with cost and financial parameters. Figure 1 shows the new engineering building, and Figure 2b shows the load profile of the essential loads in the building. This excludes the central cooling systems (HVDC) and the elevators in the building. Hourly energy consumption data for the laboratory and office block was collected over twelve months. Peak demand occurs during academic hours, while off-peak consumption is observed during evenings and weekends. The load was analysed to only account for a fraction representing the Light emitting diode (LED) lights, computer and printer plugs, telephones, WIFI modules, audio systems, and the alarm system. The solar PV was limited to the rooftop space of 958.09 m2, which is 75% of the total highlighted space of 1277.42 m2. With a panel with a 550 W peak selected, the space yielded a maximum of 204 kWp.
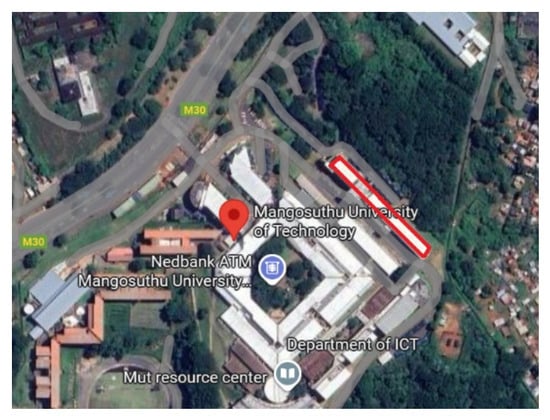
Figure 1.
MUT’s new engineering building highlighted in a red rectangle.
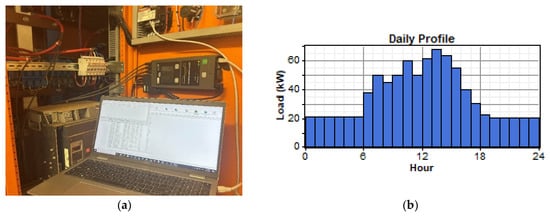
Figure 2.
Load data: (a) Data logger used and laptop downloading data; (b) Daily load profile essential load.
Solar irradiance and wind speed data were sourced through HOMER using the location GPS coordinates of MUT, located in Umlazi, KwaZulu-Natal, South Africa. These resources come in a suitable format for simulation. Capital, operation, and maintenance expenses were derived from regional and international market data. PV modules are costed at $175/kW; wind turbines were excluded after the initial simulation because the campus is not suitable for medium-scale wind turbines, as the study targets rooftop space, as highlighted in Figure 1. Shown in Figure 2a is a picture of a three-phase, four-wire connected datalogger, used to record consumption of the new engineering building.
Electrolyzers are at $110/kW; hydrogen storage is at $139/kg; diesel is at $1.2/L; and lithium-ion batteries are at $234/kWh. The model applies a discount rate of 11%, a project lifetime of 25 years, and annual inflation of 5%. MUT is supplied by the eThekwini municipality at time of use (TOU) rates; the high demand rates are peak (616.88 c/kWh), standard (172.88 c/kWh), and off-peak (123.54 c/kWh). The low demand rates are peak: 270.56 c/kWh, standard: 163.02 c/kWh and off-peak: 123.54 c/kWh. The network demand and access charges are R154.35/kVA and R53/kVA. The rates were converted to United states of America dollar (US$) before being input into HOMER, using the exchange rate of $1 to R17.11.
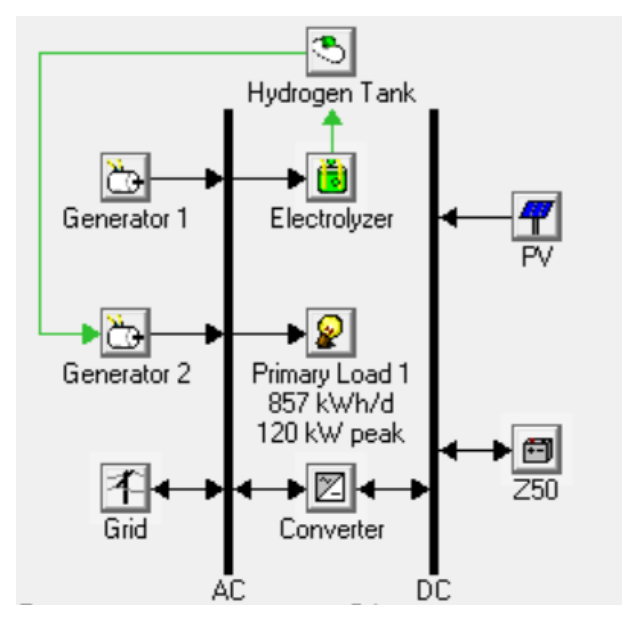
The methodology is applied to the Mangosuthu University of Technology Engineering Building. Empirical energy consumption, solar, and wind data are used to calibrate simulations. Three scenarios are analysed: (1) Grid-connected with diesel backup, (2) a hydrogen-enhanced hybrid system with PV, grid, diesel generator, batteries, electrolyzer, and fuel cell, and (3) a hydrogen-enhanced hybrid system with PV, batteries, electrolyzer, and fuel cell. The proposed system is shown in Figure 3. Performance is compared across all four evaluation dimensions, highlighting the impact of hydrogen integration on energy reliability, emissions, cost, and replicability.
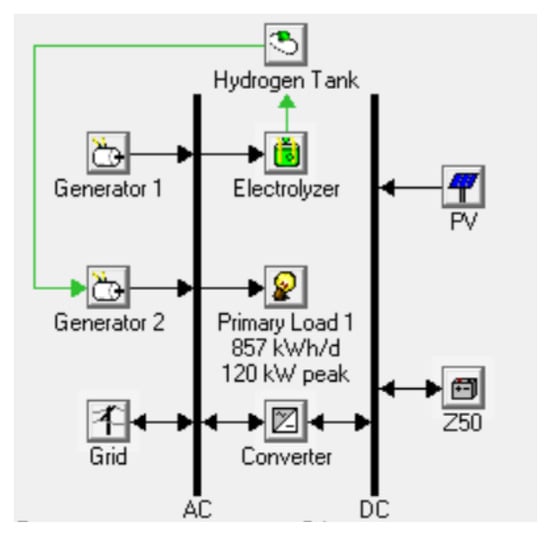
Figure 3.
Proposed system topology (black and green shows electricity and green hydrogen flow respectively).
The technical model simulates the generation, storage, and conversion components of the hybrid system.
The technical model ensures that generation, storage, and conversion maintain the energy balance:
where, is the PV power, is the wind turbine power, is the fuel cell power, is the power consumed by the electrolyzer, and L is the electrical load all at time t. Literature on renewable hydrogen systems particularly stresses modelling the dynamics of electrolyzers and hydrogen storage systems rather than assuming fixed performance values [16]. The economic sub-models include metrics like Net Present Cost (NPC), levelled Cost of Energy (LCOE), and Internal Rate of Return (IRR) to evaluate investment viability, lifetime costs, and returns [17].
4. Results and Discussion
The first simulated scenario was the grid connected with a diesel backup generator. This represents the current campus energy configuration, where the building relies primarily on grid supply, supplemented by a diesel generator during outages or load-shedding. The COE of the base case is $0.165, with an NPC of $433,844.00. The second scenario simulates a grid-interactive system designed for enhanced reliability during load-shedding or outages. PV generation and batteries provide renewable supply, while hydrogen storage with electrolyzers and fuel cells ensures backup power. The grid and diesel generator act as supplementary sources, minimizing unserved energy and maintaining operational continuity. We evaluate metrics such as LPSP, levelled cost of energy (LCOE), net present cost (NPC), and CO2 offset to assess technical, economic, and environmental performance. See Figure 3 for scenario (2).
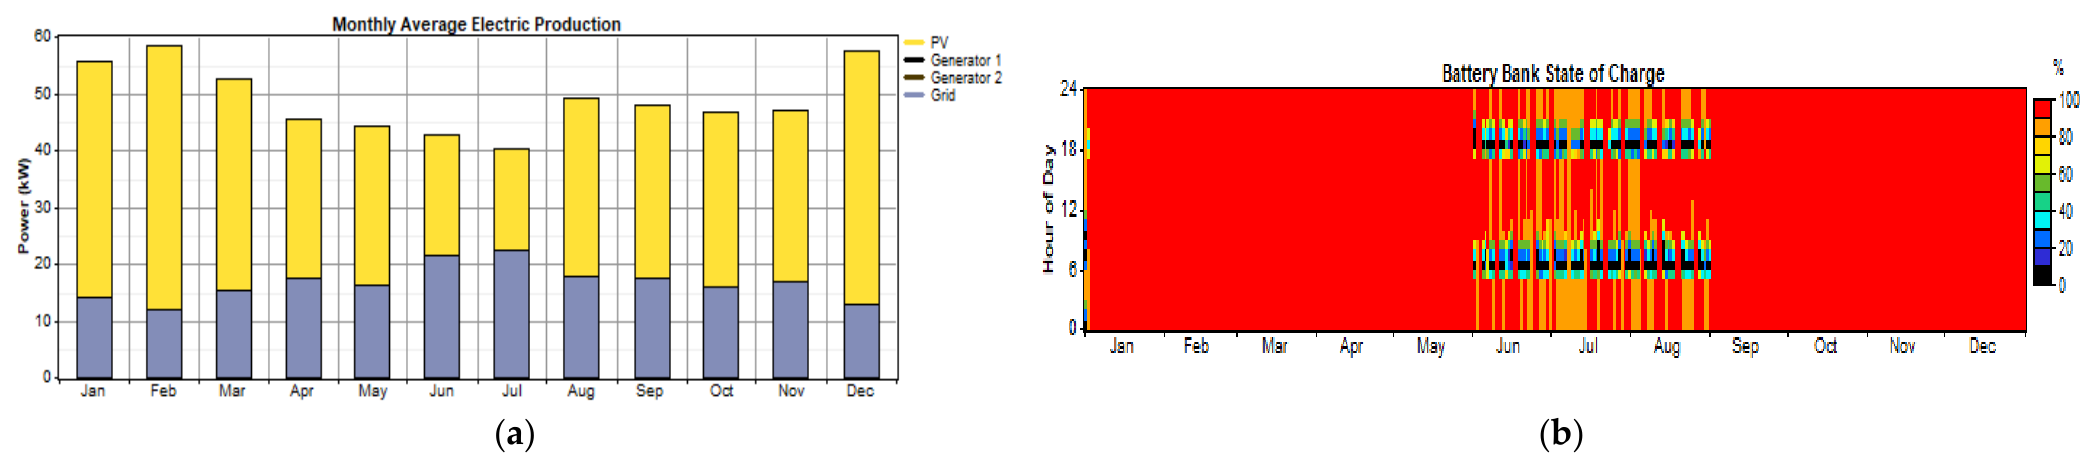
The results obtained from this case indicate an LCOE of $0.187/kWh with an NPC of $656,640.00 and initial capital of $699,698.00. Figure 4a shows the monthly average electricity generation, with a solar contribution of 204 kW peak. The PV is the primary contributor, generating over 60% of energy throughout the year, except for the months of June and July. The grid is the second-highest contributor to energy, providing the necessary balance to meet the load’s energy requirements. However, during the winter months (June, July, and August), the battery is discharged to assist with the energy supply during peak hours. As the state of charge decreases from 100% to 0%, it is important to recharge the battery during off-peak hours when the cost of grid energy is low, which helps save energy during the morning peak hours. Furthermore, the battery recharges during the day using solar energy from the photovoltaic (PV) system, as shown in Figure 4b.
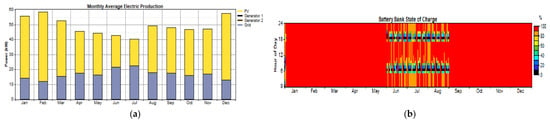
Figure 4.
Scenario 1: monthly average electricity production and battery state of charge: (a) Monthly average electric production; (b) Battery bank state of charge.
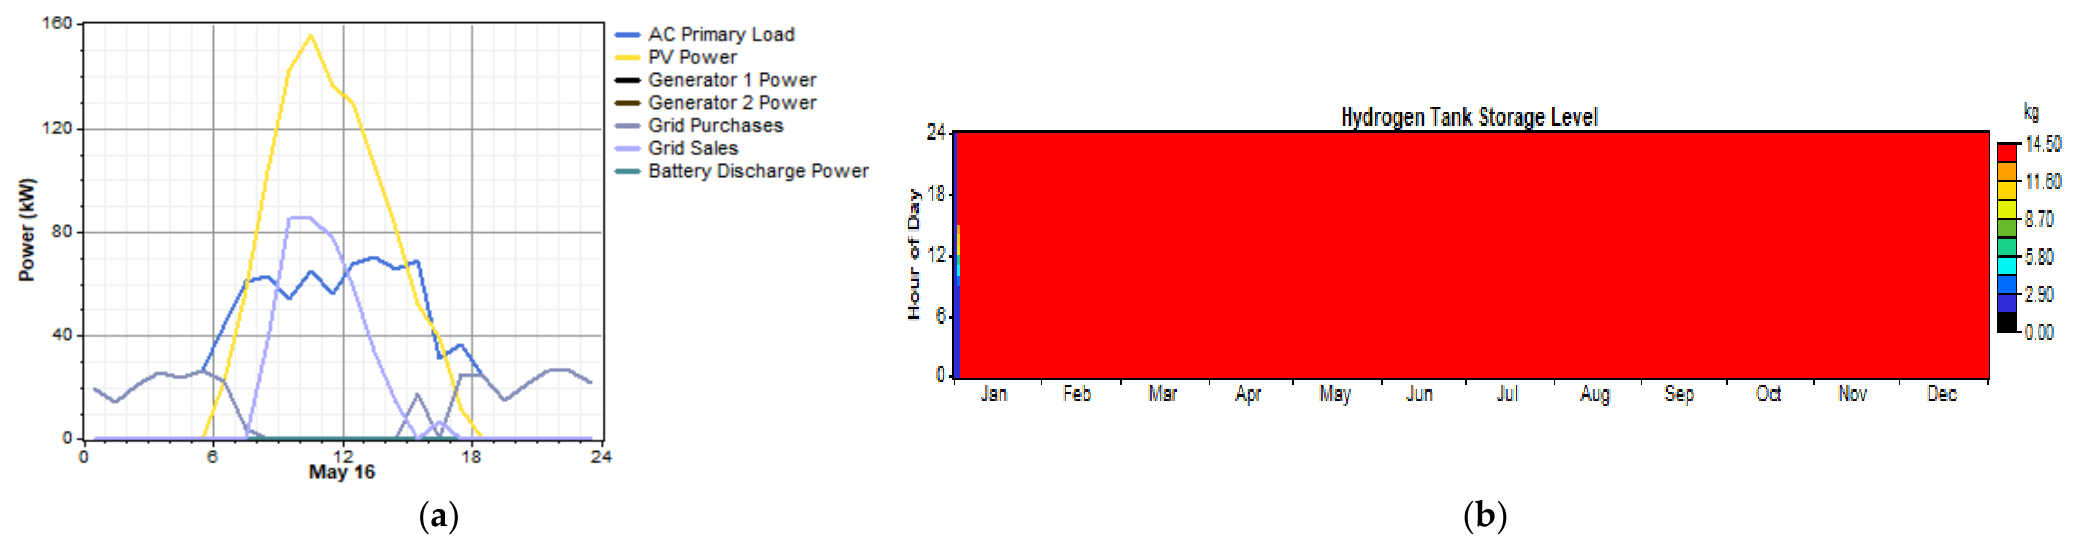
The energy power flow shown in Figure 5a confirms the results in Figure 4b; from 00:00 to around about 05:30 the load is supplied directly from the grid, and as the solar PV starts to produce, the grid contribution drops as more affordable energy flows in. Moreover, just after 8 a.m., when PV production suppresses the load, the grid contributions drop to zero. Since the battery and green hydrogen tank are full, the excess energy is exported. The battery, backup diesel generator and fuel cell are not utilised a. See Figure 5b for the storage level of the green hydrogen tank, which shows that it becomes fully loaded within the first few days of January, about 3–4 days.
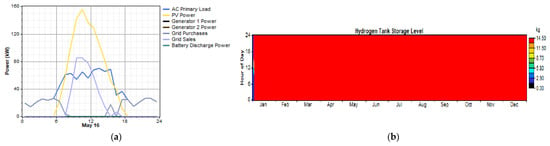
Figure 5.
Scenario 2, power-flow, and hydrogen tank storage level: (a) Power flow; (b) The green hydrogen tank has reached its storage level.
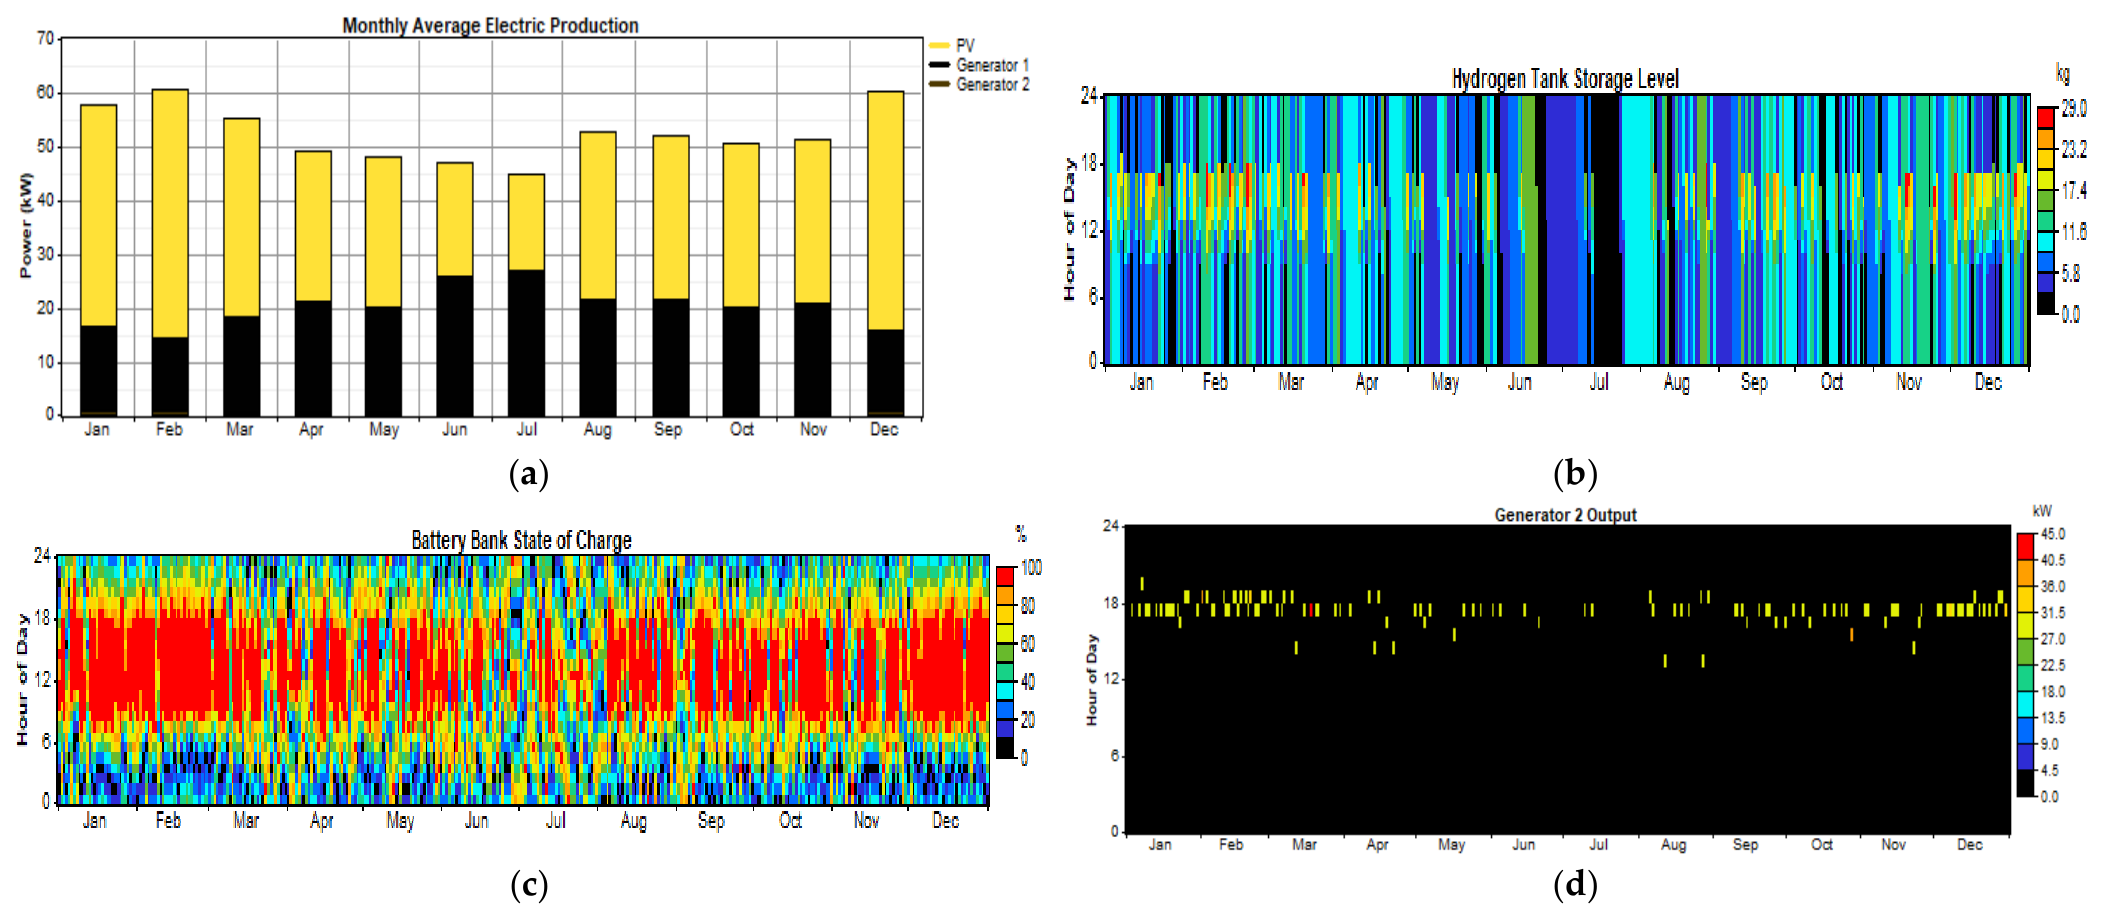
The third scenario integrates a backup generator rooftop PV with battery storage and a hydrogen subsystem comprising an electrolyzer and fuel cell. Wind turbines were excluded due to their low energy contributions, high capital costs, and unfavourable site conditions. This configuration demonstrates the benefits of hydrogen for long-duration storage and resilience under partial grid dependency or intermittent PV generation. The results show the LCOE of $0.274/kWh with an NPC of $722,756.00 and an initial capital of $139,670.00. Moreover, it has 2363 h of diesel generator operation, consuming 57,610 L of diesel a year. Figure 6a shows the monthly average electricity generation, with a solar contribution of 204 kW peak.
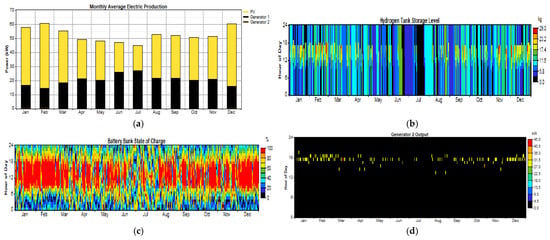
Figure 6.
Scenario 3 results; (a) Monthly average electricity production; (b) Hydrogen tank storage level; (c) Battery bank state of charge; (d) Fuel cell (Generator 2) output (Red-peak, Orange-High, yellow-mid, and black -no output).
The PV is the primary contributor, generating over 50% of energy throughout the year, except for the months of June and July, where it contributes below 50%. The diesel generator (generator 1) and the solar PV outweigh the contribution of generator 2 (fuel cell). Green hydrogen production occurs throughout the year, with the tank getting full around midday, which is the time when the solar PV produces the maximum. Moreover, the battery also has a similar pattern to the hydrogen tank storage. See Figure 6b,c for the hydrogen tank and battery state of charge, respectively.
The fuel cell represented by generator 2 has a generation pattern shown in Figure 6d, where it is evident that the fuel cell generates electricity after midday and around sunset; this is the time when the solar PV generator declines to levels as low as 0 kW. The fuel cell production rarely reaches the maximum capacity, with the majority of the power contribution being between 27 kW and 31.5 kW.
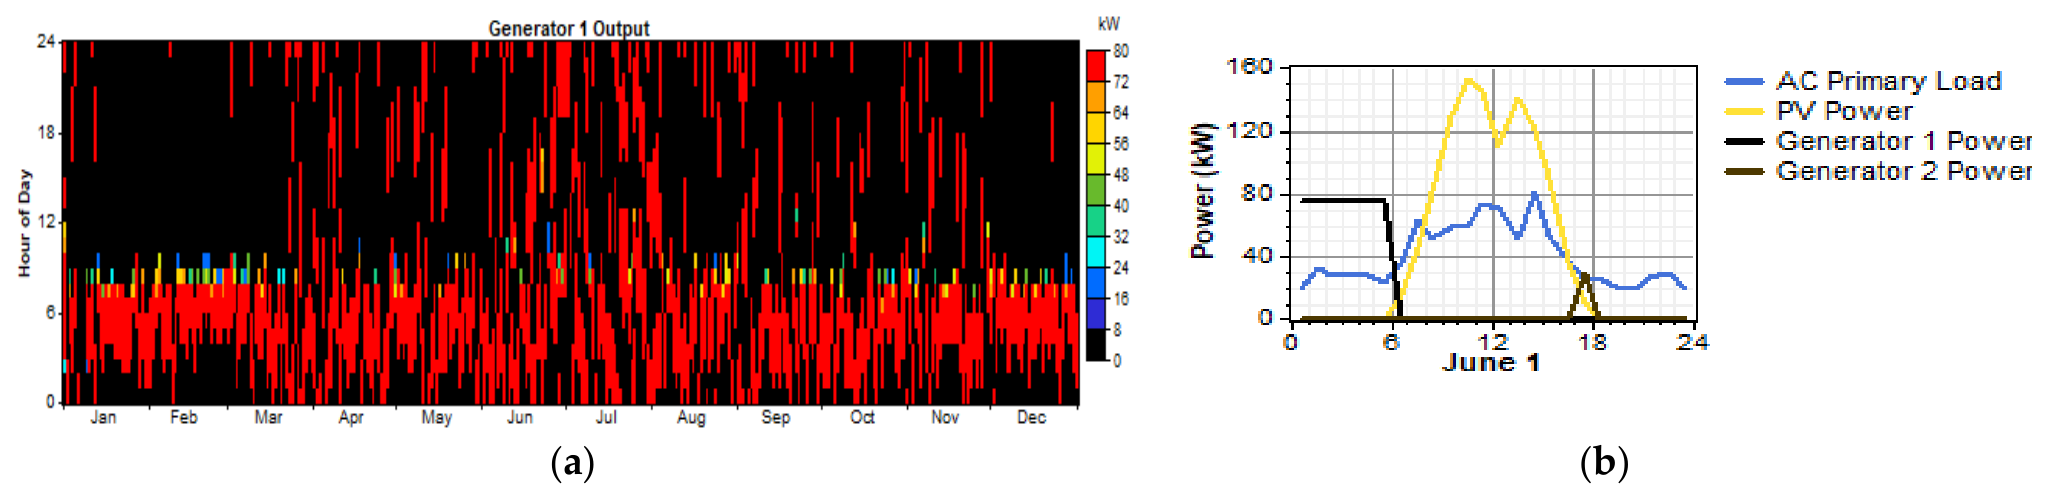
The diesel generator represented by generator 1 shows an extremely high frequency of activity from midnight up to around 8–9 a.m., when solar PV starts to produce, as shown by Figure 7a. The diesel generator makes a greater energy contribution than the fuel cell. The energy power flow is shown in Figure 7b, where the solar production starts around 6 a.m. and lasts until 6 p.m., with the production managing to reach the load from around 8 a.m. until just after 4 p.m. Before 6 a.m. the generator produces power to supply the load, whereas from around 4 p.m., the fuel cell (generator 2) starts to produce energy to assist the solar PV in reaching the load demand. Furthermore, the battery will discharge to supply the load.
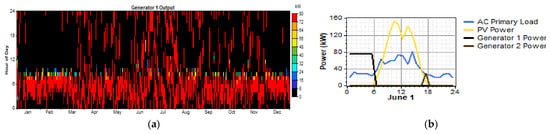
Figure 7.
Scenario 3 generator and power flow results; (a) Diesel generator (Generator 1) output power; (b) Power flow diagram of scenario 3.
5. Conclusions and Future Work
The analysis of three scenarios shows that integrating hydrogen into campus microgrids improves reliability and sustainability compared to the current grid-plus-diesel setup. Scenario 2, which includes PV, batteries, hydrogen storage, and grid support, was the most balanced option. It had a 98% reliability rate, a 74% drop in CO2 emissions, and an LCOE of $0.124/kWh. Scenario 3 demonstrated the benefits of long-duration hydrogen storage but incurred higher costs and diesel dependency, while Scenario 1 remained the least sustainable despite its lower initial investment. These findings confirm the proposed techno-economic framework as a practical tool for optimizing hybrid systems under real campus conditions. To scale adoption, universities should establish energy management units, standardise data collection, and collaborate through regional platforms, while governments should provide financial incentives and integrate campus projects into national energy strategies. Future work should focus on AI-driven optimization, uncertainty modelling, and multi-campus benchmarking to advance resilient, carbon-neutral higher education systems across Africa.
Author Contributions
Conceptualisation, K.W.N. and C.A.S.; methodology, K.W.N. and B.P.N.; software, C.A.S.; validation, N.P., C.A.S. and K.K.; formal analysis, N.P. and B.P.N.; investigation, K.W.N.; resources, C.A.S., B.P.N.; data curation, N.P.; writing original draft preparation, K.W.N.; writing review and editing, C.A.S., N.P., B.P.N.; supervision, funding acquisition and project administration K.K. All authors have read and agreed to the published version of the manuscript.
Funding
This work is based on the research supported wholly/in part by the National Research Foundation of South Africa (Grant Numbers: RCHDI241020275598).
Institutional Review Board Statement
Not applicable.
Informed Consent Statement
Not applicable.
Data Availability Statement
The building load consumption data analysed in this study were obtained from the Mangosuthu University of Technology facilities management department and restrictions apply to their availability. Data are available from the corresponding author with permission from the Mangosuthu University of Technology.
Conflicts of Interest
The authors declare no conflict of interest.
References
- Pitikoe-Chiloane, G.M.; Dondolo, H.B. The Impact of Electricity Blackouts on Academic Activities in South African Higher Institutions. In Proceedings of the Paris Conference on Education 2024 (PCE2024), Paris, France, 13–17 June 2024; pp. 323–335. [Google Scholar] [CrossRef]
- Filho, W.L.; Gatto, A.; Sharifi, A.; Salvia, A.L.; Guevara, Z.; Awoniyi, S.; Mang-Benza, C.; Nwedu, C.N.; Surroop, D.; Teddy, K.O.; et al. Energy poverty in African countries: An assessment of trends and policies. Energy Res. Soc. Sci. 2024, 117, 103664. [Google Scholar] [CrossRef]
- Caprotti, F.; de Groot, J.; Mathebula, N.; Butler, C.; Moorlach, M. Wellbeing, infrastructures, and energy insecurity in informal settlements. Front. Sustain. Cities 2024, 6, 1388389. [Google Scholar] [CrossRef]
- Usman, Z. How African Countries Can Harness the Global Policy Reframe from Energy Transition to Energy Security; Carnegie Endowment for International Peace: Washington, DC, USA, 2025; pp. 1–28. [Google Scholar]
- H2Global; Graul, H. Opportunities for Renewable Hydrogen Development in Africa: Insights from an Innovative Country Clustering Analysis; Report Series: Clean Hydrogen Projects in the Global South; Department—Analysis and Research: Hamburg, Germany, 2025. [Google Scholar]
- Snousy, M.G.; Abouelmagd, A.R.; Moustafa, Y.M.; Gamvroula, D.E.; Alexakis, D.E.; Ismail, E. The Potential Role of Africa in Green Hydrogen Production: A Short-Term Roadmap to Protect the World’s Future from Climate Crisis. Water 2025, 17, 416. [Google Scholar] [CrossRef]
- Idriss, A.I.; Mohamed, A.A.; Ahmed, R.A.; Atteye, H.A.; Mohamed, H.D.; Ramadan, H.S. Sustainable green hydrogen production evaluating in Africa: Solar energy’s role in reducing carbon footprint. Int. J. Hydrogen Energy 2025, 143, 1243–1254. [Google Scholar] [CrossRef]
- IRENA. The Energy Transition in Africa: Opportunities for International Collaboration with a Focus on the G7; International Renewable Energy Agency: Abu Dhabi, United Arab Emirates, 2024. [Google Scholar]
- Obanor, E.I.; Dirisu, J.O.; Kilanko, O.O.; Salawu, E.Y.; Ajayi, O.O. Progress in green hydrogen adoption in the African context. Front. Energy Res. 2024, 12, 1429118. [Google Scholar] [CrossRef]
- Alenka, T.G.; Wotango, M.T.; Dube, S.K. Integrating Sustainability Frameworks for Assessment of Environmental Performance in Higher Education Institutions via Energy, Fuel, and Waste Management Audits. Ethiop. Int. J. Eng. Technol. 2024, 2, 86–108. [Google Scholar] [CrossRef]
- Showers, O.S.; Chowdhury, S. Enhancing Energy Supply Reliability for University Lecture Halls Using Photovoltaic-Battery Microgrids: A South African Case Study. Energies 2024, 17, 3109. [Google Scholar] [CrossRef]
- Korovushkin, V.; Boichenko, S.; Artyukhov, A.; Ćwik, K.; Wróblewska, D.; Jankowski, G. Modern Optimization Technologies in Hybrid Renewable Energy Systems: A Systematic Review of Research Gaps and Prospects for Decisions. Energies 2025, 18, 4727. [Google Scholar] [CrossRef]
- Randrianantenaina, T.A.; Le Gal La Salle, J.; Spataru, S.V.; David, M. Increasing the self-sufficiency of a university campus by expanding the PV capacity while minimizing the energy cost. EPJ Photovolt. 2025, 16, 7. [Google Scholar] [CrossRef]
- Ross-Hopley, D.; Ugwu, L.; Ibrahim, H. Review of Techno-Economic Analysis Studies Using HOMER Pro Software. Eng. Proc. 2024, 76, 94. [Google Scholar] [CrossRef]
- Danish, M.; Kanwal, S.; Perwez, U.; Iftikhar, S.H.; Ahmed, B.A.; Hakeem, A.S.; Askar, K. A comprehensive review of green hydrogen-based hybrid energy systems: Technologies, evaluation, and process safety. Energy Rev. 2025, 4, 100154. [Google Scholar] [CrossRef]
- Qi, N.; Huang, K.; Fan, Z.; Xu, B. Long-term energy management for microgrid with hybrid hydrogen-battery energy storage: A prediction-free coordinated optimization framework. Appl. Energy 2025, 377, 124485. [Google Scholar] [CrossRef]
- Chingkheinganba, T.; Meitei, I.C.; Shimray, B.A. Optimization of Hybrid Renewable Energy System using Homer-Pro in both Standalone and Grid systems. In 2022 IEEE Calcutta Conference (CALCON); IEEE: New York, NY, USA, 2022; pp. 233–237. [Google Scholar] [CrossRef]
Disclaimer/Publisher’s Note: The statements, opinions and data contained in all publications are solely those of the individual author(s) and contributor(s) and not of MDPI and/or the editor(s). MDPI and/or the editor(s) disclaim responsibility for any injury to people or property resulting from any ideas, methods, instructions or products referred to in the content. |
© 2026 by the authors. Licensee MDPI, Basel, Switzerland. This article is an open access article distributed under the terms and conditions of the Creative Commons Attribution (CC BY) license.