Proceeding Paper

Multi-Objective Evolutionary Prediction with an Artificial Intelligence-Based Approach for Urban Energy Planning †

by
Md Rakibul Islam
1,
Aritra Islam Saswato
1 and
Md Salah Uddin
2,*
1
Department of Electrical and Computer Engineering, North South University, Dhaka 1229, Bangladesh
2
Department of Mathematics and Physics, North South University, Dhaka 1229, Bangladesh
*
Author to whom correspondence should be addressed.
Presented at the 1st International Online Conference on Designs (Designs 2026), 9–10 February 2026; Available online: https://sciforum.net/event/Designs2026.
Eng. Proc. 2026, 138(1), 5; https://doi.org/10.3390/engproc2026138005
Published: 26 May 2026

Abstract

This study investigates the relationship between weather conditions (temperature, humidity), air pollutants (PM2.5, PM10, and CO), and photovoltaic (PV) degradation characteristics using location-specific machine learning frameworks. A data augmentation technique was employed to enhance the predictive modeling datasets. The research evaluates four machine learning models: AdaBoost, Gradient Boosting, Decision Tree, and Random Forest. We found strong regression analysis values using the addressed machine learning models. Furthermore, feature importance analysis reveals that PM2.5 has the most significant impact on PV module degradation.

1. Introduction

In recent years, the global shift toward sustainable energy sources has attracted considerable attention, with photovoltaic (PV) solar technology emerging as a cornerstone of the future energy landscape. Nevertheless, PV solar panels face significant operational challenges arising from environmental stressors and air pollution, and prolonged exposure accelerates panel aging. This degradation directly affects the long-term economic viability and reliability of solar energy. While previous studies have examined the weather-dependent power efficiency of PV modules, the regionally specific interrelationships among environmental stressors and their combined impact on power efficiency remain underexplored [1,2]. A deeper understanding of these dynamics is essential for improving PV cell efficiency and operational performance.
During operation, a photovoltaic (PV) module is exposed to numerous environmental stressors, including humidity, temperature variations, ultraviolet (UV) radiation, wind-induced vibration, soiling from particulate matter, and wind-blown dust. Humidity facilitates potential-induced degradation (PID) and corrosion of metallic interconnects [3]. Temperature fluctuations induce thermomechanical fatigue, leading to solder bond failures and cracked cells [4]. UV radiation degrades encapsulant materials, resulting in delamination and yellowing that reduce light transmittance [5]. Soiling from particulate matter and wind-blown dust can produce combined effects that are detrimental to module performance. Furthermore, air pollutants, specifically particulate matter (PM), nitrogen oxides (NOx), carbon compounds (CO, CO2), and sulfur dioxide (SO2), adversely affect PV efficiency. The multi-parametric influence of these environmental stressors on PV module degradation poses significant challenges for conventional physics-based or statistical modeling approaches.
Artificial intelligence (AI) represents a paradigm-shifting approach for deciphering the complex, non-linear, and multivariate relationships between environmental stressors and the degradation dynamics of photovoltaic (PV) modules. In this study, machine learning frameworks were applied to site-specific data to investigate the influence of temperature, humidity, and various particulate matter components on the degradation rate of PV modules.

2. Research Background

Researchers investigated the degradation of AI-integrated photovoltaic (PV) cells across different regions by leveraging diverse meteorological, atmospheric, and pollutant datasets. Dudáš et al. examined the influence of particulate matter (PM2.5 and PM10) using a Random Forest (RF) machine learning framework, incorporating one year of air pollution and weather data [6]. The weather data included temperature, pressure, and relative humidity [6]. Their findings identified PM2.5 as the dominant factor affecting PV module efficiency degradation. Verma et al. employed machine learning-based regression analysis on one-year datasets of atmospheric, environmental, and pollution parameters to assess their impact on PV cell efficiency [7]. Their data were collected in Jaipur, India, from a 2.64 kW polycrystalline solar panel. They included four pollutant parameters (PM10, NOx, SO2, benzene), temperature, relative humidity, and additional atmospheric variables. Hu et al. explored the effect of PM2.5 concentration on the degradation dynamics of PV energy generation efficiency in Hebei Province, China. They used multiple machine learning methods: Support Vector Regression (SVR), RF, AdaBoost, Decision Tree (DT), K-Nearest Neighbor (KNN), and Backpropagation Neural Network (BP) [8]. Their approaches were applied on an 80/20 training–testing split for model development. In the present study, we employed a data augmentation technique to enrich the dataset and examined the degradation rate, characterized by the fill factor of an aged 250 W PV module over four years in Dhaka, Bangladesh. To this end, we investigated four machine learning frameworks: AdaBoost, Gradient Boosting (GB), DT, and RF.

3. Method

3.1. Data Collection

The weather data (temperature and humidity), air pollutant concentrations, and photovoltaic (PV) module performance parameters were obtained from publicly available sources in the literature. The average monthly temperature and relative humidity for Dhaka City over a 12-month period were extracted from the 2022 Yearbook of the Bangladesh Bureau of Statistics [9,10], consistent with the geographic focus of this study. Air quality data, including particulate matter and carbon monoxide (CO) concentrations, were sourced from a study conducted at the Dhaka Export Processing Zone (DEPZ) in Dhaka, Bangladesh, covering the period 2019–2023 [11]. The PV module degradation rates, specifically the fill factor (FF) data for this module, were utilized, collected from a four-year study conducted in Dhaka on an aged 250 W PV module [12]. The fill factor is a key quality indicator of a PV module, as it reflects the electrical quality of the power output from a photovoltaic cell.

3.2. Data Augmentation

The initial dataset available for this study comprised only 40 samples, which was insufficient for developing machine learning models. To address this limitation, a data augmentation technique was employed to enhance the data structure. Specifically, synthetic samples were generated through linear interpolation between randomly selected pairs of original data points. This method is known as the Synthetic Minority Over-sampling Technique (SMOTE) [13]. SMOTE addresses class imbalance by creating synthetic samples rather than replicating existing ones, thereby reducing the risk of overfitting. Unlike traditional oversampling approaches that simply duplicate data points, SMOTE introduces diversity by generating new instances along the feature space between selected samples. As a result, this technique increases the dataset size while preserving the original statistical properties [13].
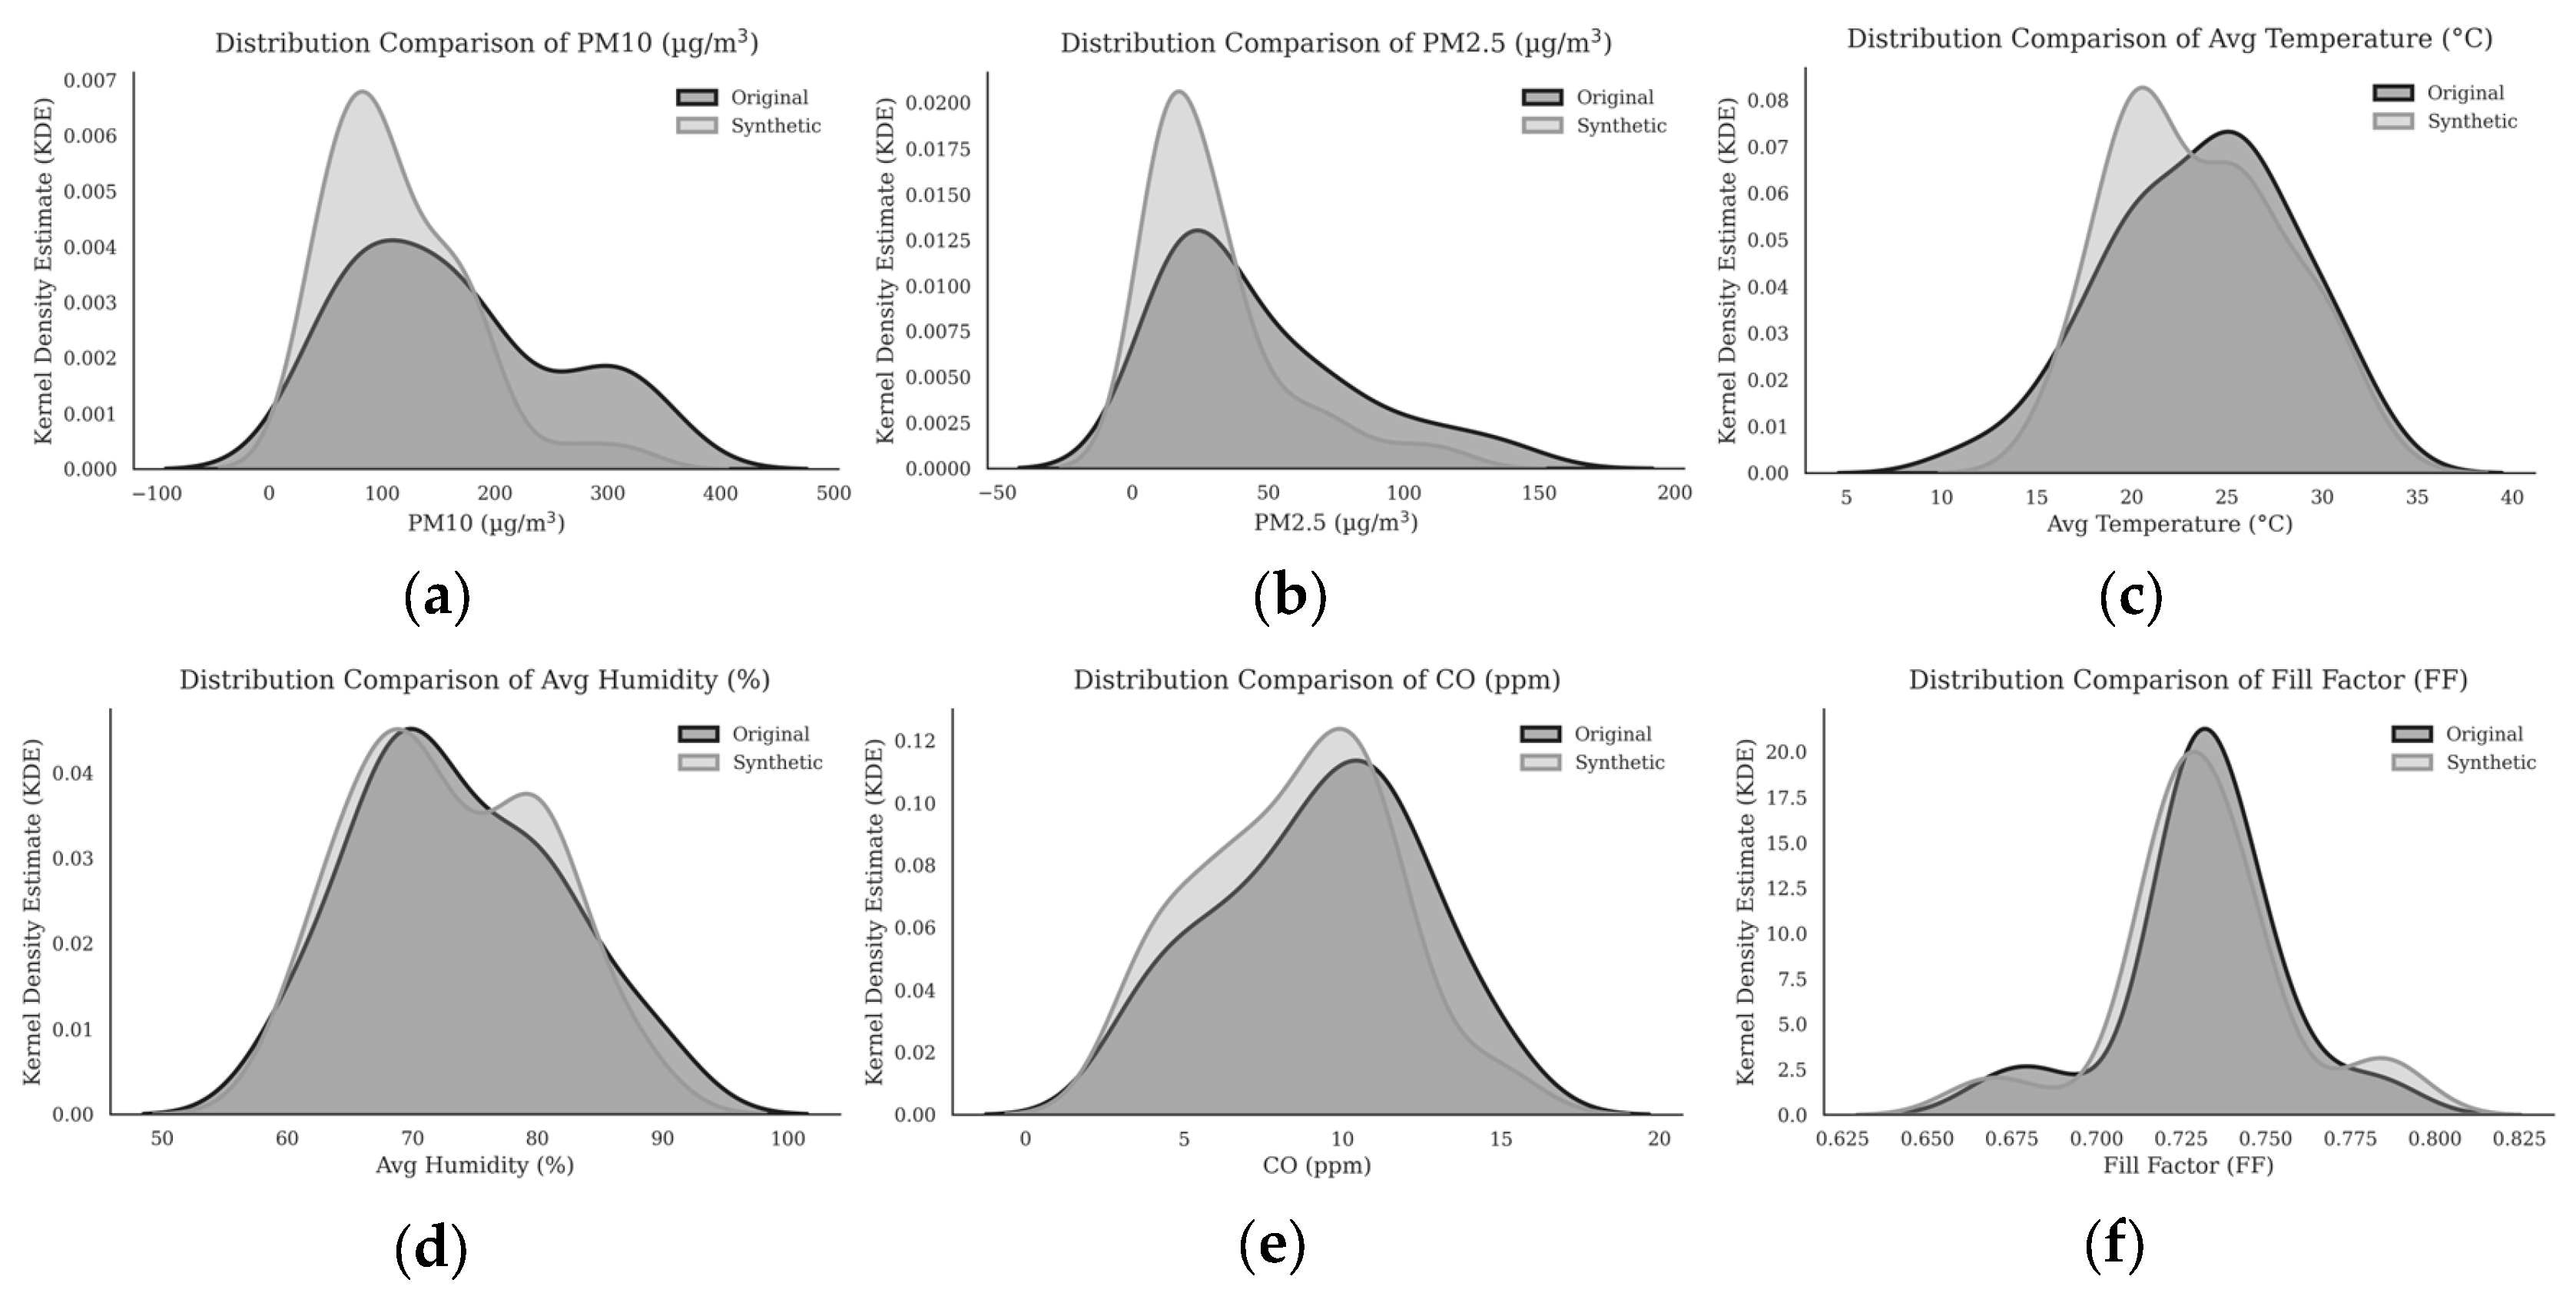
In this study, the Synthetic Minority Over-sampling Technique (SMOTE) was employed to generate synthetic samples by interpolating between randomly selected instances belonging to the same class. The newly generated datasets were subsequently combined with the original ones. To assess the similarity between the original and synthetic datasets, the distributions of variables and classes were compared, as illustrated in Figure 1 and Figure 2. The results demonstrate that the synthetic datasets preserve the key characteristics of the original data. It is widely recognized that SMOTE and other data augmentation methods can substantially improve the predictive performance of models, particularly when working with small datasets [13,14]. Following the application of SMOTE, a total of 80 datasets were made available for training and evaluating the machine learning models.

3.3. Data Normalization

The normalization step involved scaling the data, transforming features, and addressing missing values. All features were scaled using the StandardScaler, which centers each variable to have a mean of zero and a standard deviation of one. This step is essential given that the input variables are measured on different scales; without scaling, features with larger numerical ranges could dominate the learning process. Missing data were handled by removing incomplete rows via a filtering procedure (dropna), applied consistently to both input and output variables. Consequently, only complete and consistent observations were retained for model training. Given the small size of the dataset, imputation techniques were not employed, as they might introduce bias; retaining only complete cases helped preserve data reliability. Finally, the dataset was split into training and testing subsets using an 80/20 partition to support the development and evaluation of the machine learning models.

3.4. Model Development

In this machine learning–based approach, we employed four algorithms: AdaBoost, Gradient Boosting, Decision Tree, and Random Forest.
AdaBoost (Adaptive Boosting) is an ensemble learning method that sequentially combines multiple weak learners to form a single strong classifier. It improves predictive accuracy by assigning higher weights to misclassified data points in each successive iteration, thereby forcing subsequent learners to correct previous errors.
Gradient Boosting (GB) is another ensemble-based framework that builds a strong predictive model by sequentially integrating multiple weak models. At each iteration, a new model is trained to address the residual errors of the current ensemble and to minimize a specified loss function.
The Decision Tree (DT) is an intuitive supervised machine learning algorithm widely used for both classification and regression tasks. It organizes a series of hierarchical conditions into a tree-like structure to make predictions. The algorithm recursively partitions the dataset into smaller, more homogeneous subsets based on feature values, selecting at each step the feature that best reduces uncertainty or error.
Random Forest (RF) is an ensemble model that constructs numerous decision trees during training. For classification tasks, it outputs the majority vote of the individual trees; for regression tasks, it returns the mean prediction.
Following model development, we applied feature importance analysis to evaluate the contribution of each input variable to the model’s predictions. This technique helps identify which features most strongly influence outcomes. It is essential for enhancing model interpretability, reducing overfitting by eliminating noisy variables, improving computational efficiency, and extracting actionable insights from data patterns.
In our model development, the input variables were average temperature, average humidity, PM2.5 (µg/m3, 24 h), PM10 (µg/m3, 24 h), and CO (ppm, 8 h). The output variable was the fill factor of the photovoltaic (PV) module.
To ensure model reproducibility, the hyperparameters used in developing the machine learning models were listed in Table 1.

4. Result and Discussion

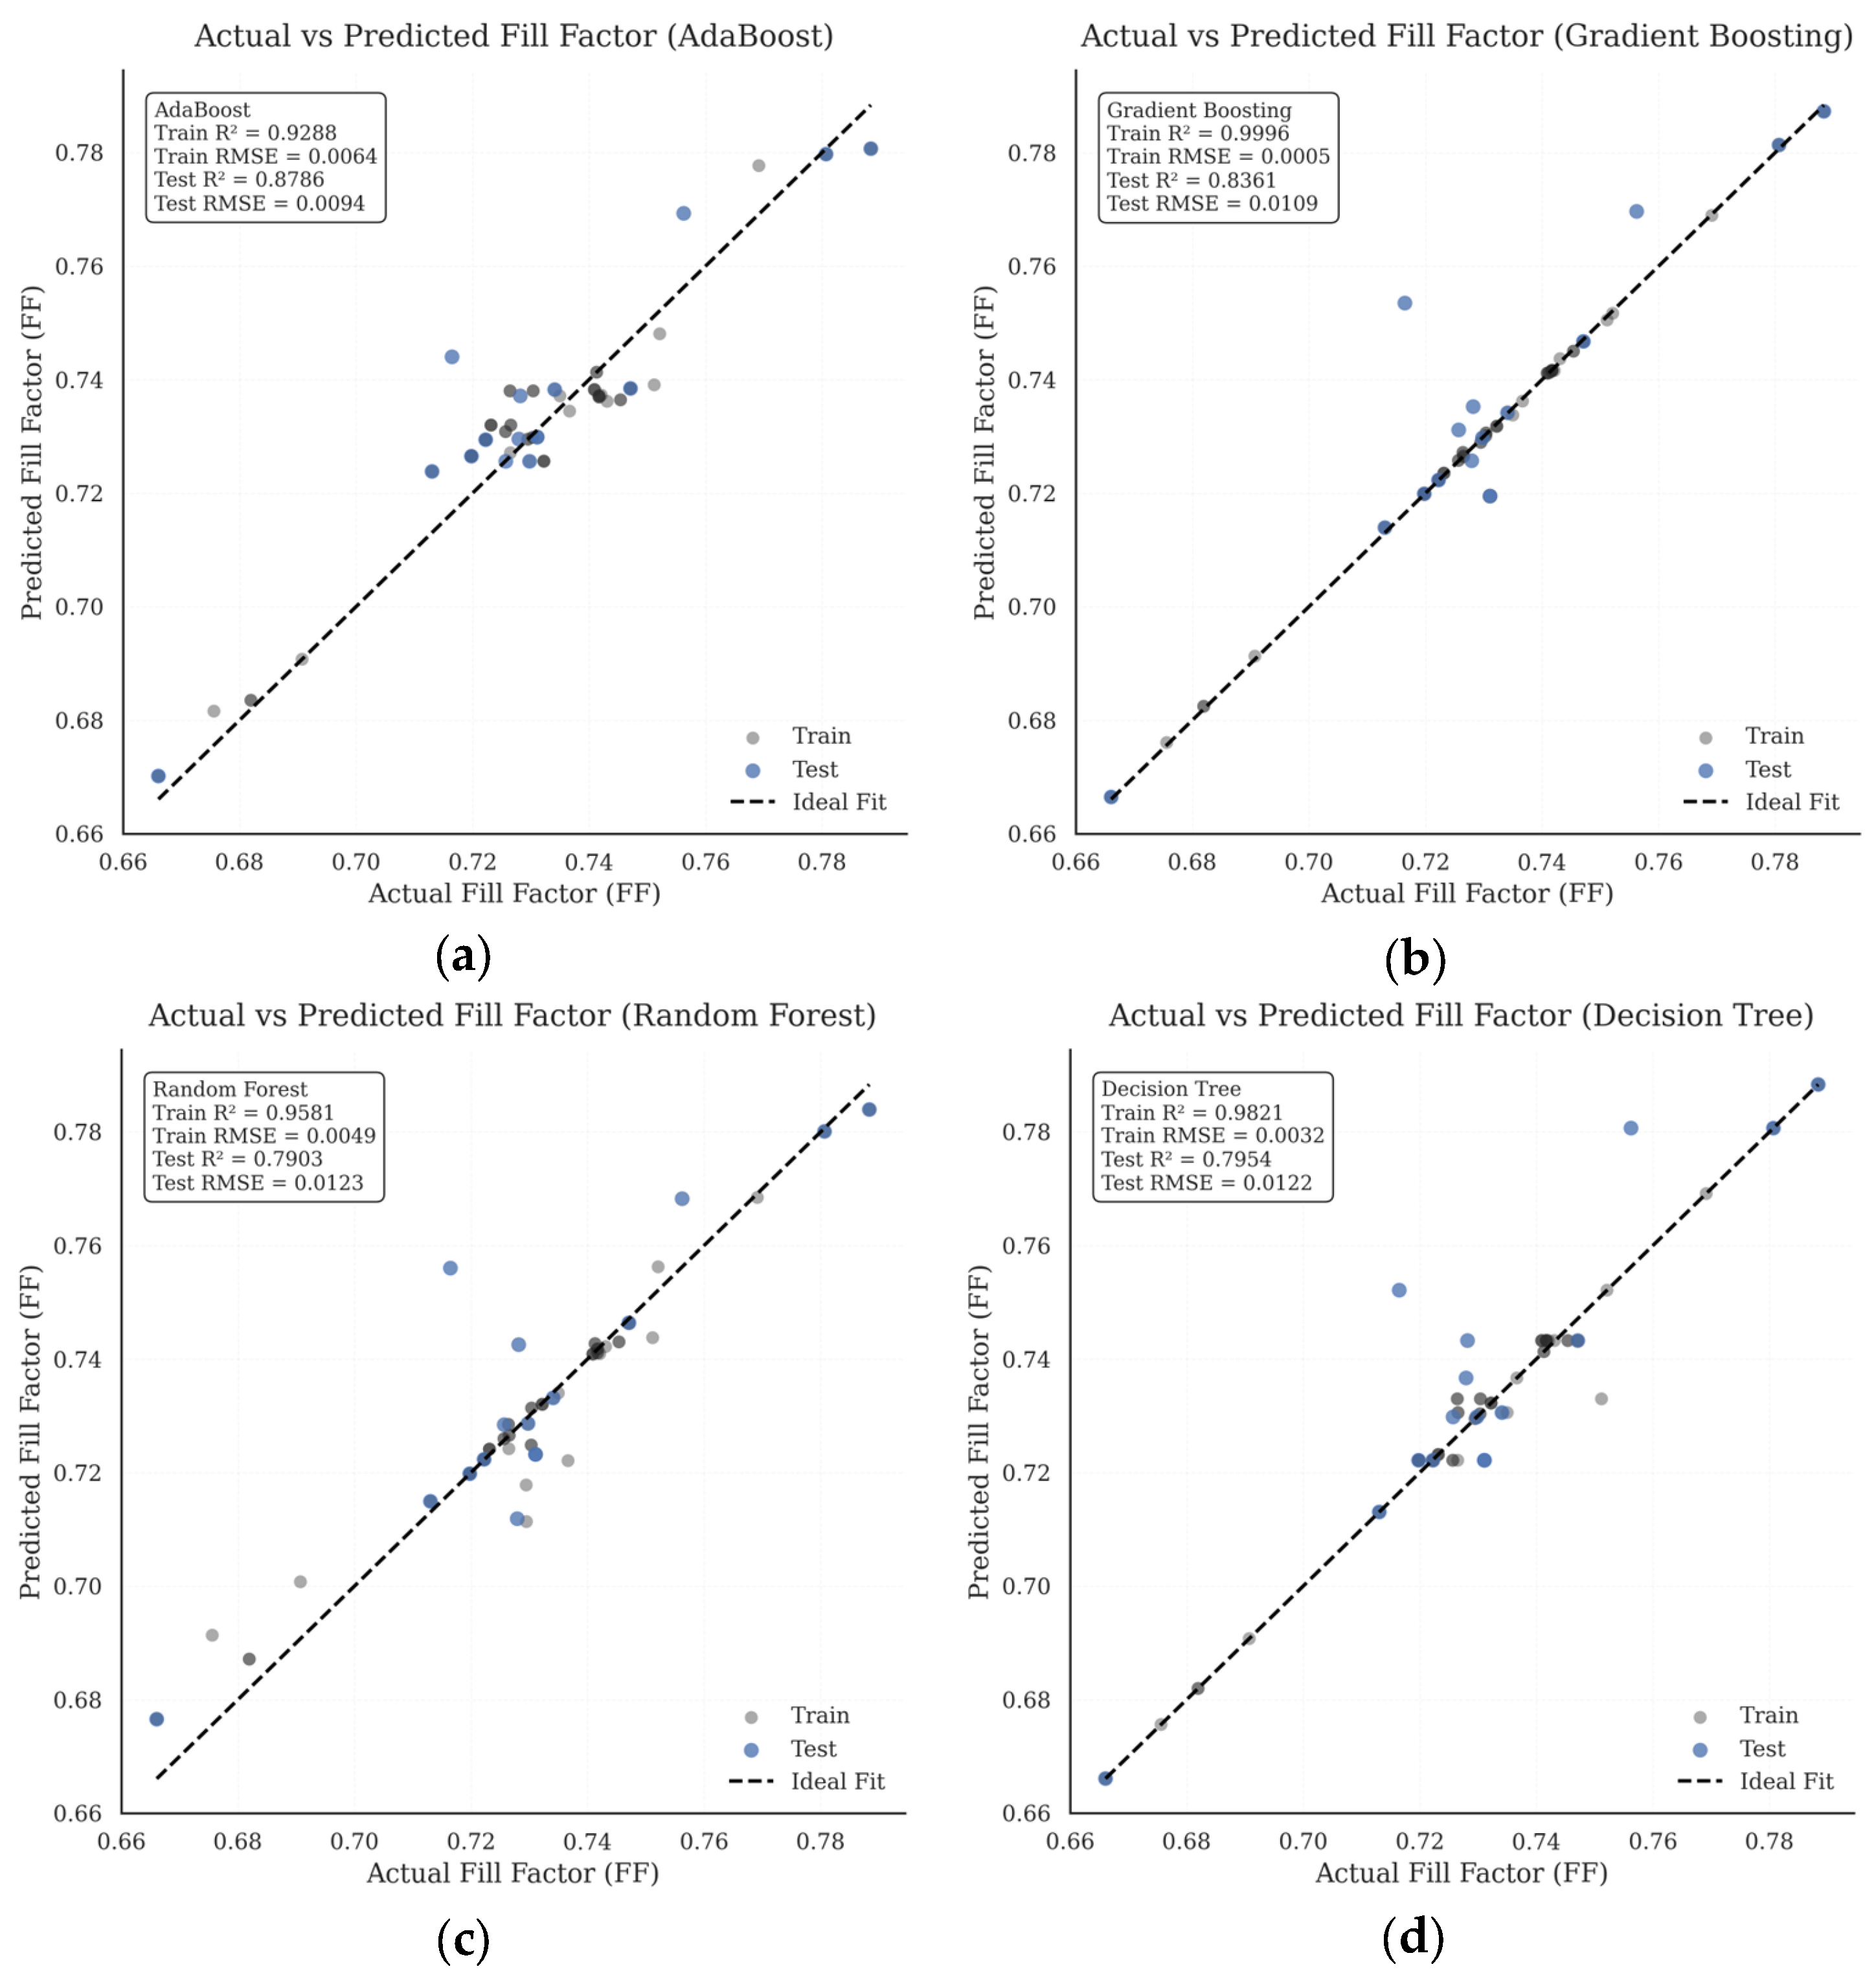
The performance of the applied machine learning models was evaluated using the coefficient of determination (R2) and the root mean squared error (RMSE), with results summarized in Table 2. The training data yielded high R2 values and very low RMSE. Similarly, the test data exhibited high R2 and low RMSE. The AdaBoost model achieved the maximum R2 and minimum RMSE, with values of 0.8786 and 0.0094, respectively. During training, the same model produced R2 and RMSE values of 0.9288 and 0.0064. The Gradient Boosting model demonstrated higher performance on the training datasets, attaining an R2 of 0.9996 and an RMSE of 0.0004; on the test data, its R2 was 0.8361 and RMSE 0.0109. Among the other models, the decision tree (DT) and random forest (RF), the test R2 values were 0.7954 and 0.7903, with corresponding RMSE values of 0.0122 and 0.0123, respectively. The predicted graphs for all models are shown in Figure 3. To enhance robustness and mitigate the effect of randomness, a 5-fold cross-validation procedure was applied to every model. The evaluation reports both the mean and standard deviation of the R2 scores, thereby quantifying performance consistency across different data splits. The results are:
  • AdaBoost: R2 = 0.6838 ± 0.2201
  • Gradient Boosting: R2 = 0.6905 ± 0.2572
  • Random Forest: R2 = 0.6634 ± 0.3648
  • Decision Tree: R2 = 0.5160 ± 0.3841
Table 2. Performance Comparison of the Implemented ML Models.
ModelTraining DatasetsTesting Datasets
R2RMSEMAEMAPER2RMSEMAEMAPE
AdaBoost0.92880.00640.00540.00750.87860.00940.00670.0092
Gradient Boosting0.99960.00040.00030.00040.83610.01090.00570.0079
Decision Tree0.98210.00320.00170.00220.79540.01220.00720.0099
Random Forest0.95810.00490.00260.00370.79030.01230.00750.0104
Figure 3. Predictive model development by applying ML frameworks: (a) AdaBoost; (b) Gradient Boosting; (c) Decision Tree; (d) Random Forest.
Engproc 138 00005 g003
The observed standard deviations reflect some variability across folds, which is expected given the relatively small dataset size. Consequently, cross-validation offers a more realistic estimate of model generalization.
We reported a performance gap between training accuracy (0.9996) and test accuracy (0.83) for the Gradient Boosting model, indicating overfitting during model development. This issue likely arises from the limited dataset size combined with the high capacity of ensemble methods, which may cause the model to capture noise and fine-grained patterns present in the training data.
The dataset was partitioned into training and test sets prior to any preprocessing steps that could potentially introduce leakage. Specifically, operations such as scaling and synthetic data generation (SMOTE) were applied exclusively to the training set, while the test set remained completely unseen throughout model training and hyperparameter tuning. Therefore, the observed overfitting is primarily attributable to model complexity relative to dataset size rather than to data leakage. Table 2 additionally reports the Mean Absolute Error (MAE) and the Mean Absolute Percentage Error (MAPE), two standard statistical metrics for assessing the accuracy of predictive models.
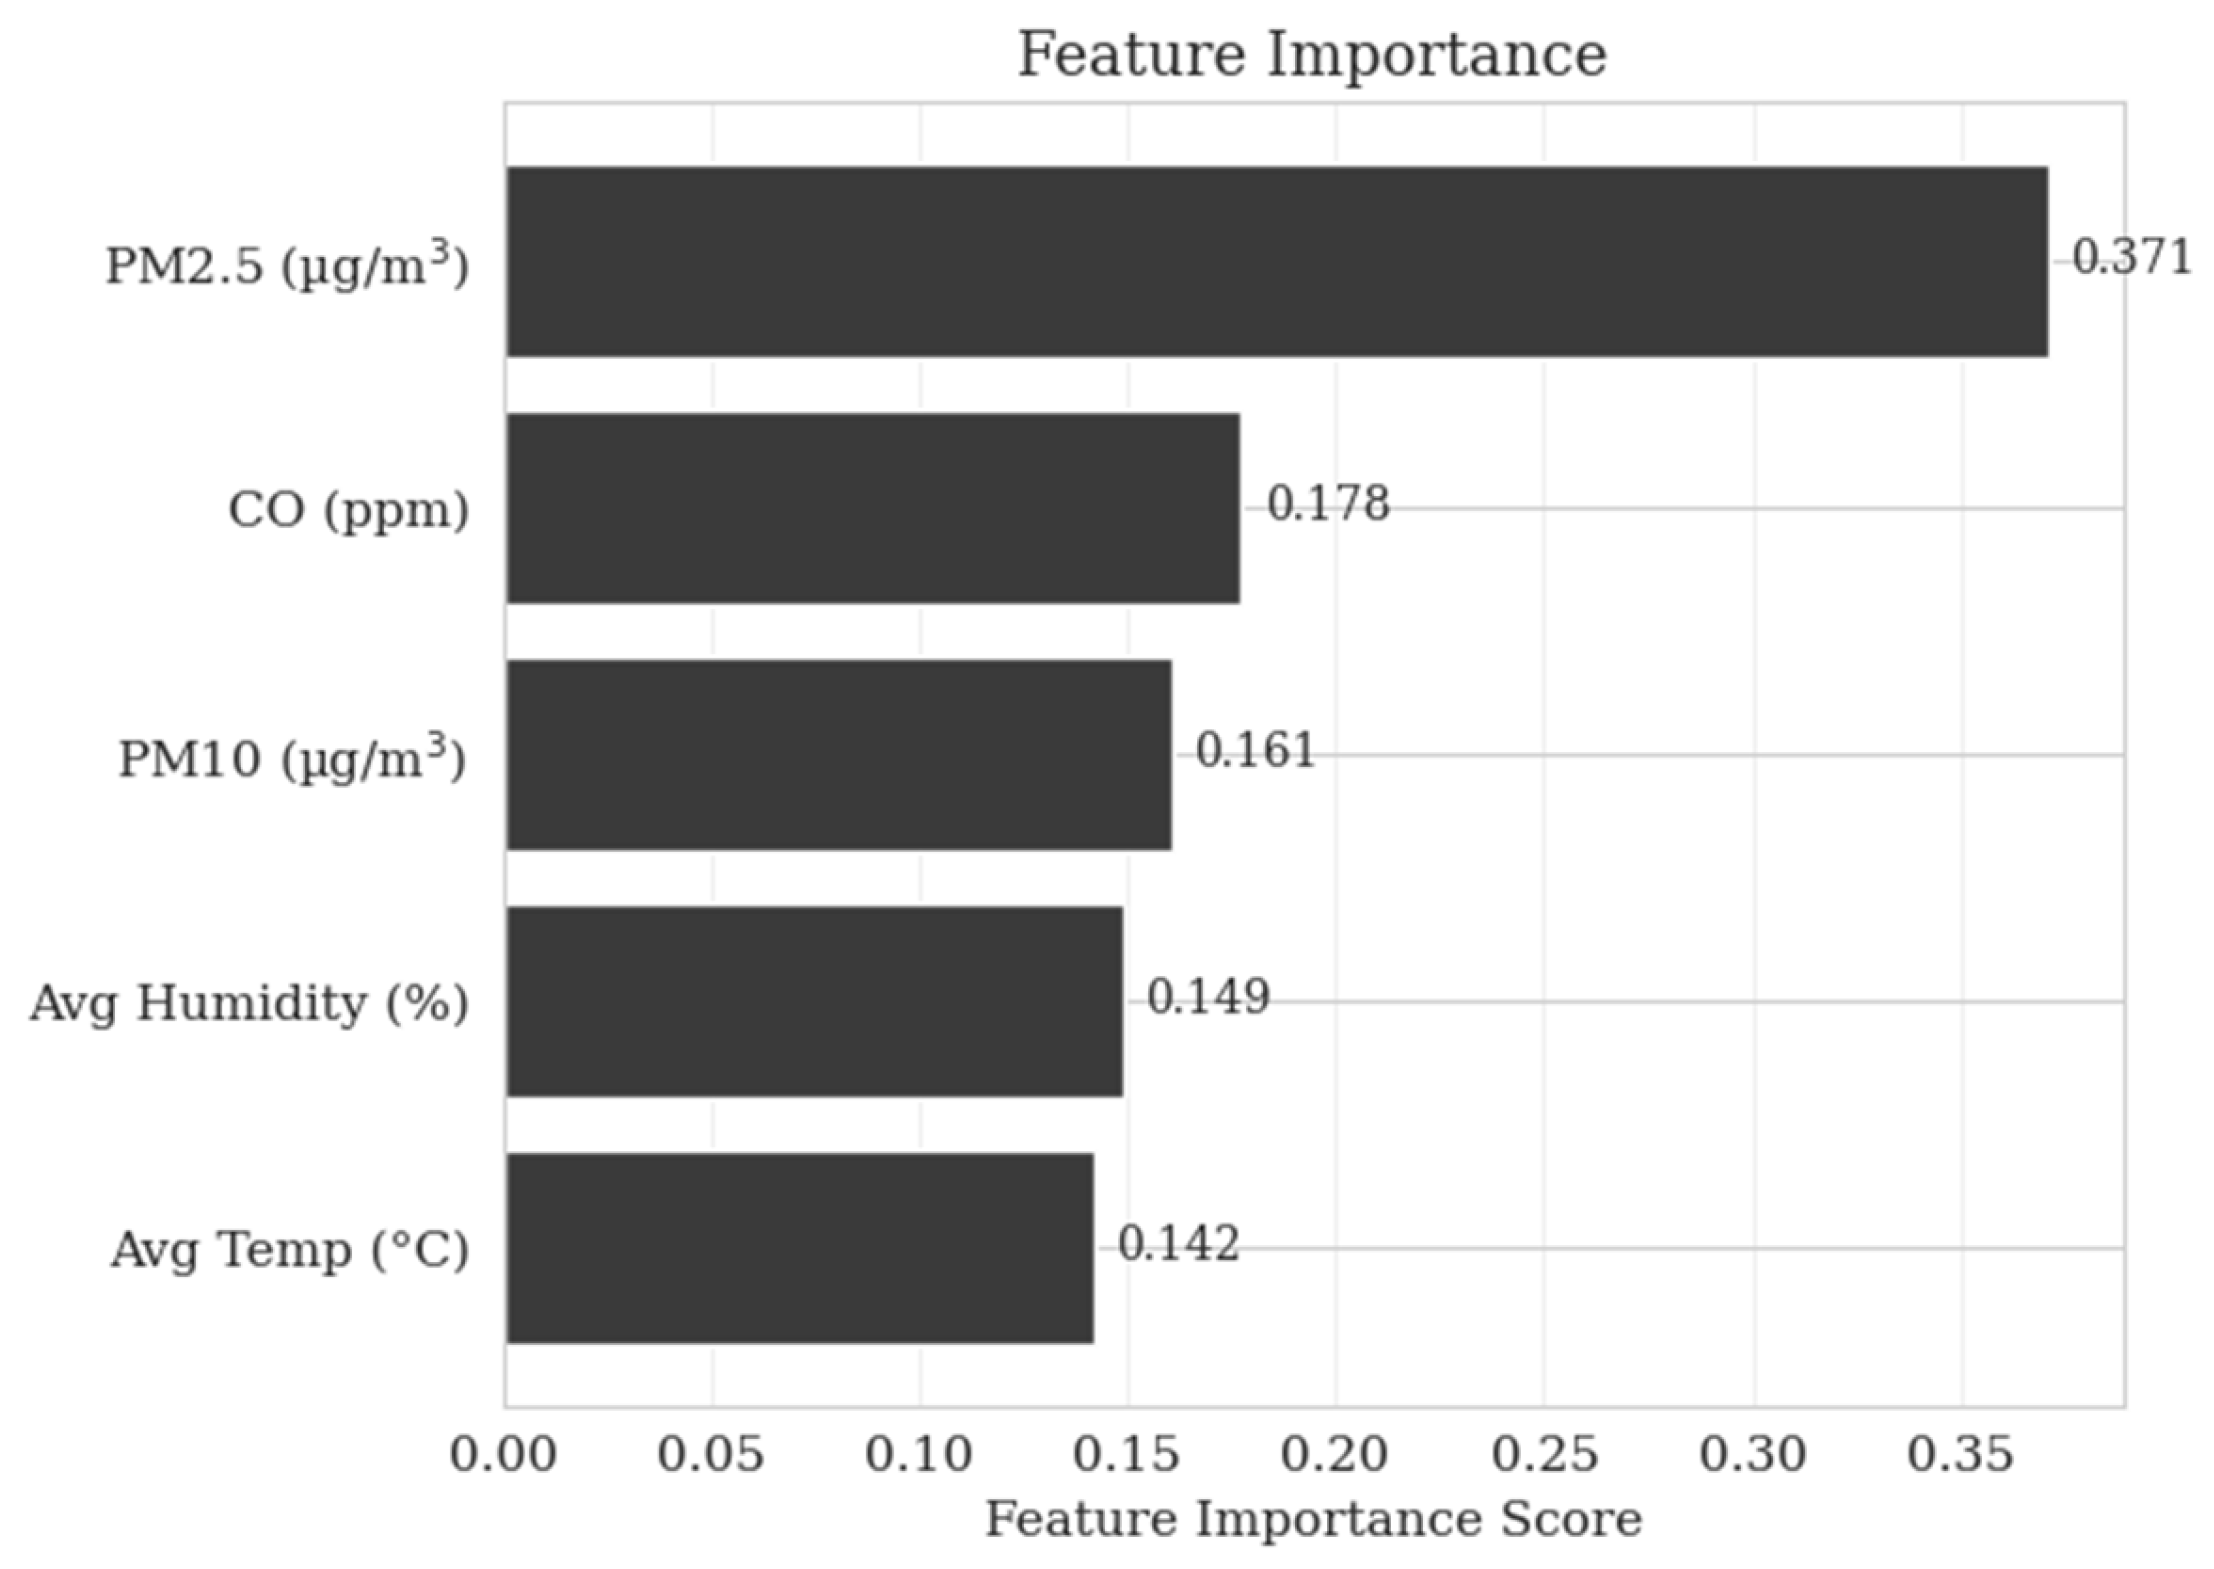
To assess the influence of input variables on the output parameter, a feature importance analysis was conducted. Five input parameters were considered: particulate matter (PM2.5 and PM10), carbon monoxide (CO), average temperature, and average humidity. The output variable was the fill factor of a 250 W photovoltaic (PV) module that had been aged for four years. The resulting feature importance ranking was presented in Figure 4. Among the input variables, PM2.5 was found to have the most significant impact on the fill factor. CO and PM10 ranked next in terms of their influence on the module’s degradation. Notably, average temperature was identified as the least impactful factor affecting the degradation of the aged 250 W PV module.

5. Conclusions

In this study, we investigated the influence of particulate matter and weather factors on the site-specific degradation of a 250 W photovoltaic (PV) module. Although we utilized data available in the literature, the existing datasets were insufficient for developing machine learning models. To address this limitation, we applied data augmentation techniques, specifically the Synthetic Minority Over-sampling Technique (SMOTE), to generate synthetic data from the original datasets.
We employed multiple machine learning frameworks: AdaBoost, Gradient Boosting (GB), Decision Tree (DT), and Random Forest (RF), to model the relationships among weather conditions, air pollution, and their impact on the PV module degradation rate. The machine learning models exhibited high R-squared and low root mean square error (RMSE) values during testing. However, overfitting was observed across the models. Among them, AdaBoost demonstrated comparatively less overfitting than the other models.
We also found that PM2.5 particulate matter exerts the most substantial effect on the degradation behavior of the 250 W PV module, while temperature was identified as the least impactful factor affecting module performance during operation. The availability of more comprehensive and robust datasets would enable researchers to further improve machine learning model performance. Future studies should explore the combined effects of weather variability and air pollution levels to better understand the degradation dynamics of photovoltaic modules.

Author Contributions

Validation, formal analysis, data curation, writing—review and editing, M.R.I.; Validation, formal analysis, A.I.S.; Conceptualization, investigation, data curation, writing—original draft preparation, methodology, writing—review and editing, supervision, M.S.U. All authors have read and agreed to the published version of the manuscript.

Funding

The Office of Research at North South University funded the research through the Conference Travel & Research Grant (CTRG-24-SEPS-42).

Institutional Review Board Statement

Not applicable.

Informed Consent Statement

Not applicable.

Data Availability Statement

The raw data supporting the conclusions presented in this article are available from the corresponding author upon request.

Acknowledgments

We would like to acknowledge the support of the Department of Mathematics and Physics, School of Engineering and Physical Sciences, and Office of Research at North South University.

Conflicts of Interest

The authors declare that there are no conflicts of interest.

Abbreviations

The following abbreviations are used in this manuscript:
PVPhotovoltaic
MLMachine Learning
PMParticulate Matter
RFRandom Forest
AdaBoostAdaptive Boosting
DTDecision Tree
GBGradient Boosting
SMOTESynthetic Minority Over-sampling Technique
RMSERoot Mean Squared Error

References

  1. Kim, J.G.; Kim, D.H.; Yoo, W.S.; Lee, J.Y.; Kim, Y.B. Daily prediction of solar power generation based on weather forecast information in Korea. IET Renew. Power Gener. 2017, 11, 1268–1273. [Google Scholar] [CrossRef]
  2. Stankov, B.; Terziev, A.; Vassilev, M.; Ivanov, M. Influence of wind and rainfall on the performance of a photovoltaic module in a dusty environment. Energies 2024, 17, 3394. [Google Scholar] [CrossRef]
  3. Hoffmann, S.; Koehl, M. Effect of humidity and temperature on the potential-induced degradation. Prog. Photovolt. Res. Appl. 2014, 22, 173–179. [Google Scholar] [CrossRef]
  4. Zarmai, M.T.; Ekere, N.N.; Oduoza, C.F.; Amalu, E.H. Evaluation of thermo-mechanical damage and fatigue life of solar cell solder interconnections. Robot. Comput.-Integr. Manuf. 2017, 47, 37–43. [Google Scholar] [CrossRef]
  5. Pinochet, N.; Couderc, R.; Therias, S. Solar cell UV-induced degradation or module discolouration: Between the devil and the deep yellow sea. Prog. Photovolt. Res. Appl. 2023, 31, 1091–1100. [Google Scholar] [CrossRef]
  6. Dudáš, A.; Udristioiu, M.T.; Alkharusi, T.; Yildizhan, H.; Sampath, S.K. Examining effects of air pollution on photovoltaic systems via interpretable random forest model. Renew. Energy 2024, 232, 121066. [Google Scholar] [CrossRef]
  7. Verma, R.; Parashar, B.; Kulshrestha, P.; Shukla, B.K. Machine learning perspectives on solar panel efficiency: The impact of pollutants and environmental factors. In Intelligent Infrastructure and Smart Materials: Sustainable Technologies for a Greener Future; Springer Nature: Cham, Switzerland, 2025; pp. 135–150. [Google Scholar] [CrossRef]
  8. Hu, A.; Duan, Z.; Zhang, Y.; Huang, Z.; Ji, T.; Yin, X. Impact of PM2.5 pollution on solar photovoltaic power generation in Hebei Province, China. Energies 2025, 18, 4195. [Google Scholar] [CrossRef]
  9. Bangladesh Bureau of Statistics (BBS). Year Book of Agricultural Statistics-2022; 34th Series; Statistics and Informatics Division, Ministry of Planning, Government of the People’s Republic of Bangladesh: Dhaka, Bangladesh, 2023. Available online: https://bbs.gov.bd/pages/static-pages/6922e0d6933eb65569e28cbf (accessed on 7 January 2026).
  10. Chowdhury, R.; Nur, F.N.; Islam, M.N.; Islam, M.N.; Das, P.; Afridi, A.S. SPAS-Dataset-BD: Dataset for smart precision agriculture system in Bangladesh. Data Brief. 2025, 61, 111727. [Google Scholar] [CrossRef] [PubMed]
  11. Rahman, M.; Rashid, F.; Kumar, D.; Habib, M.A.; Ullah, A. Dataset of air pollutants (PM2.5, PM10, CO) concentrations in the export processing area of Dhaka, Bangladesh. Data Brief. 2024, 55, 110594. [Google Scholar] [CrossRef] [PubMed]
  12. Al Mansur, A.; Amin, M.R.; Islam, M.I.; Shihavuddin, A.S.M. Electrical data of 10 W, 40 W, 80 W, and 250 W photovoltaic modules under aging condition. Data Brief. 2023, 47, 108989. [Google Scholar]
  13. Chawla, N.V.; Bowyer, K.W.; Hall, L.O.; Kegelmeyer, W.P. SMOTE: Synthetic minority over-sampling technique. J. Artif. Intell. Res. 2002, 16, 321–357. [Google Scholar] [CrossRef]
  14. Torgo, L.; Ribeiro, R.P.; Pfahringer, B.; Branco, P. SMOTE for regression. In Proceedings of the Portuguese Conference on Artificial Intelligence, Berlin, Germany, 3–6 September 2013. [Google Scholar] [CrossRef]
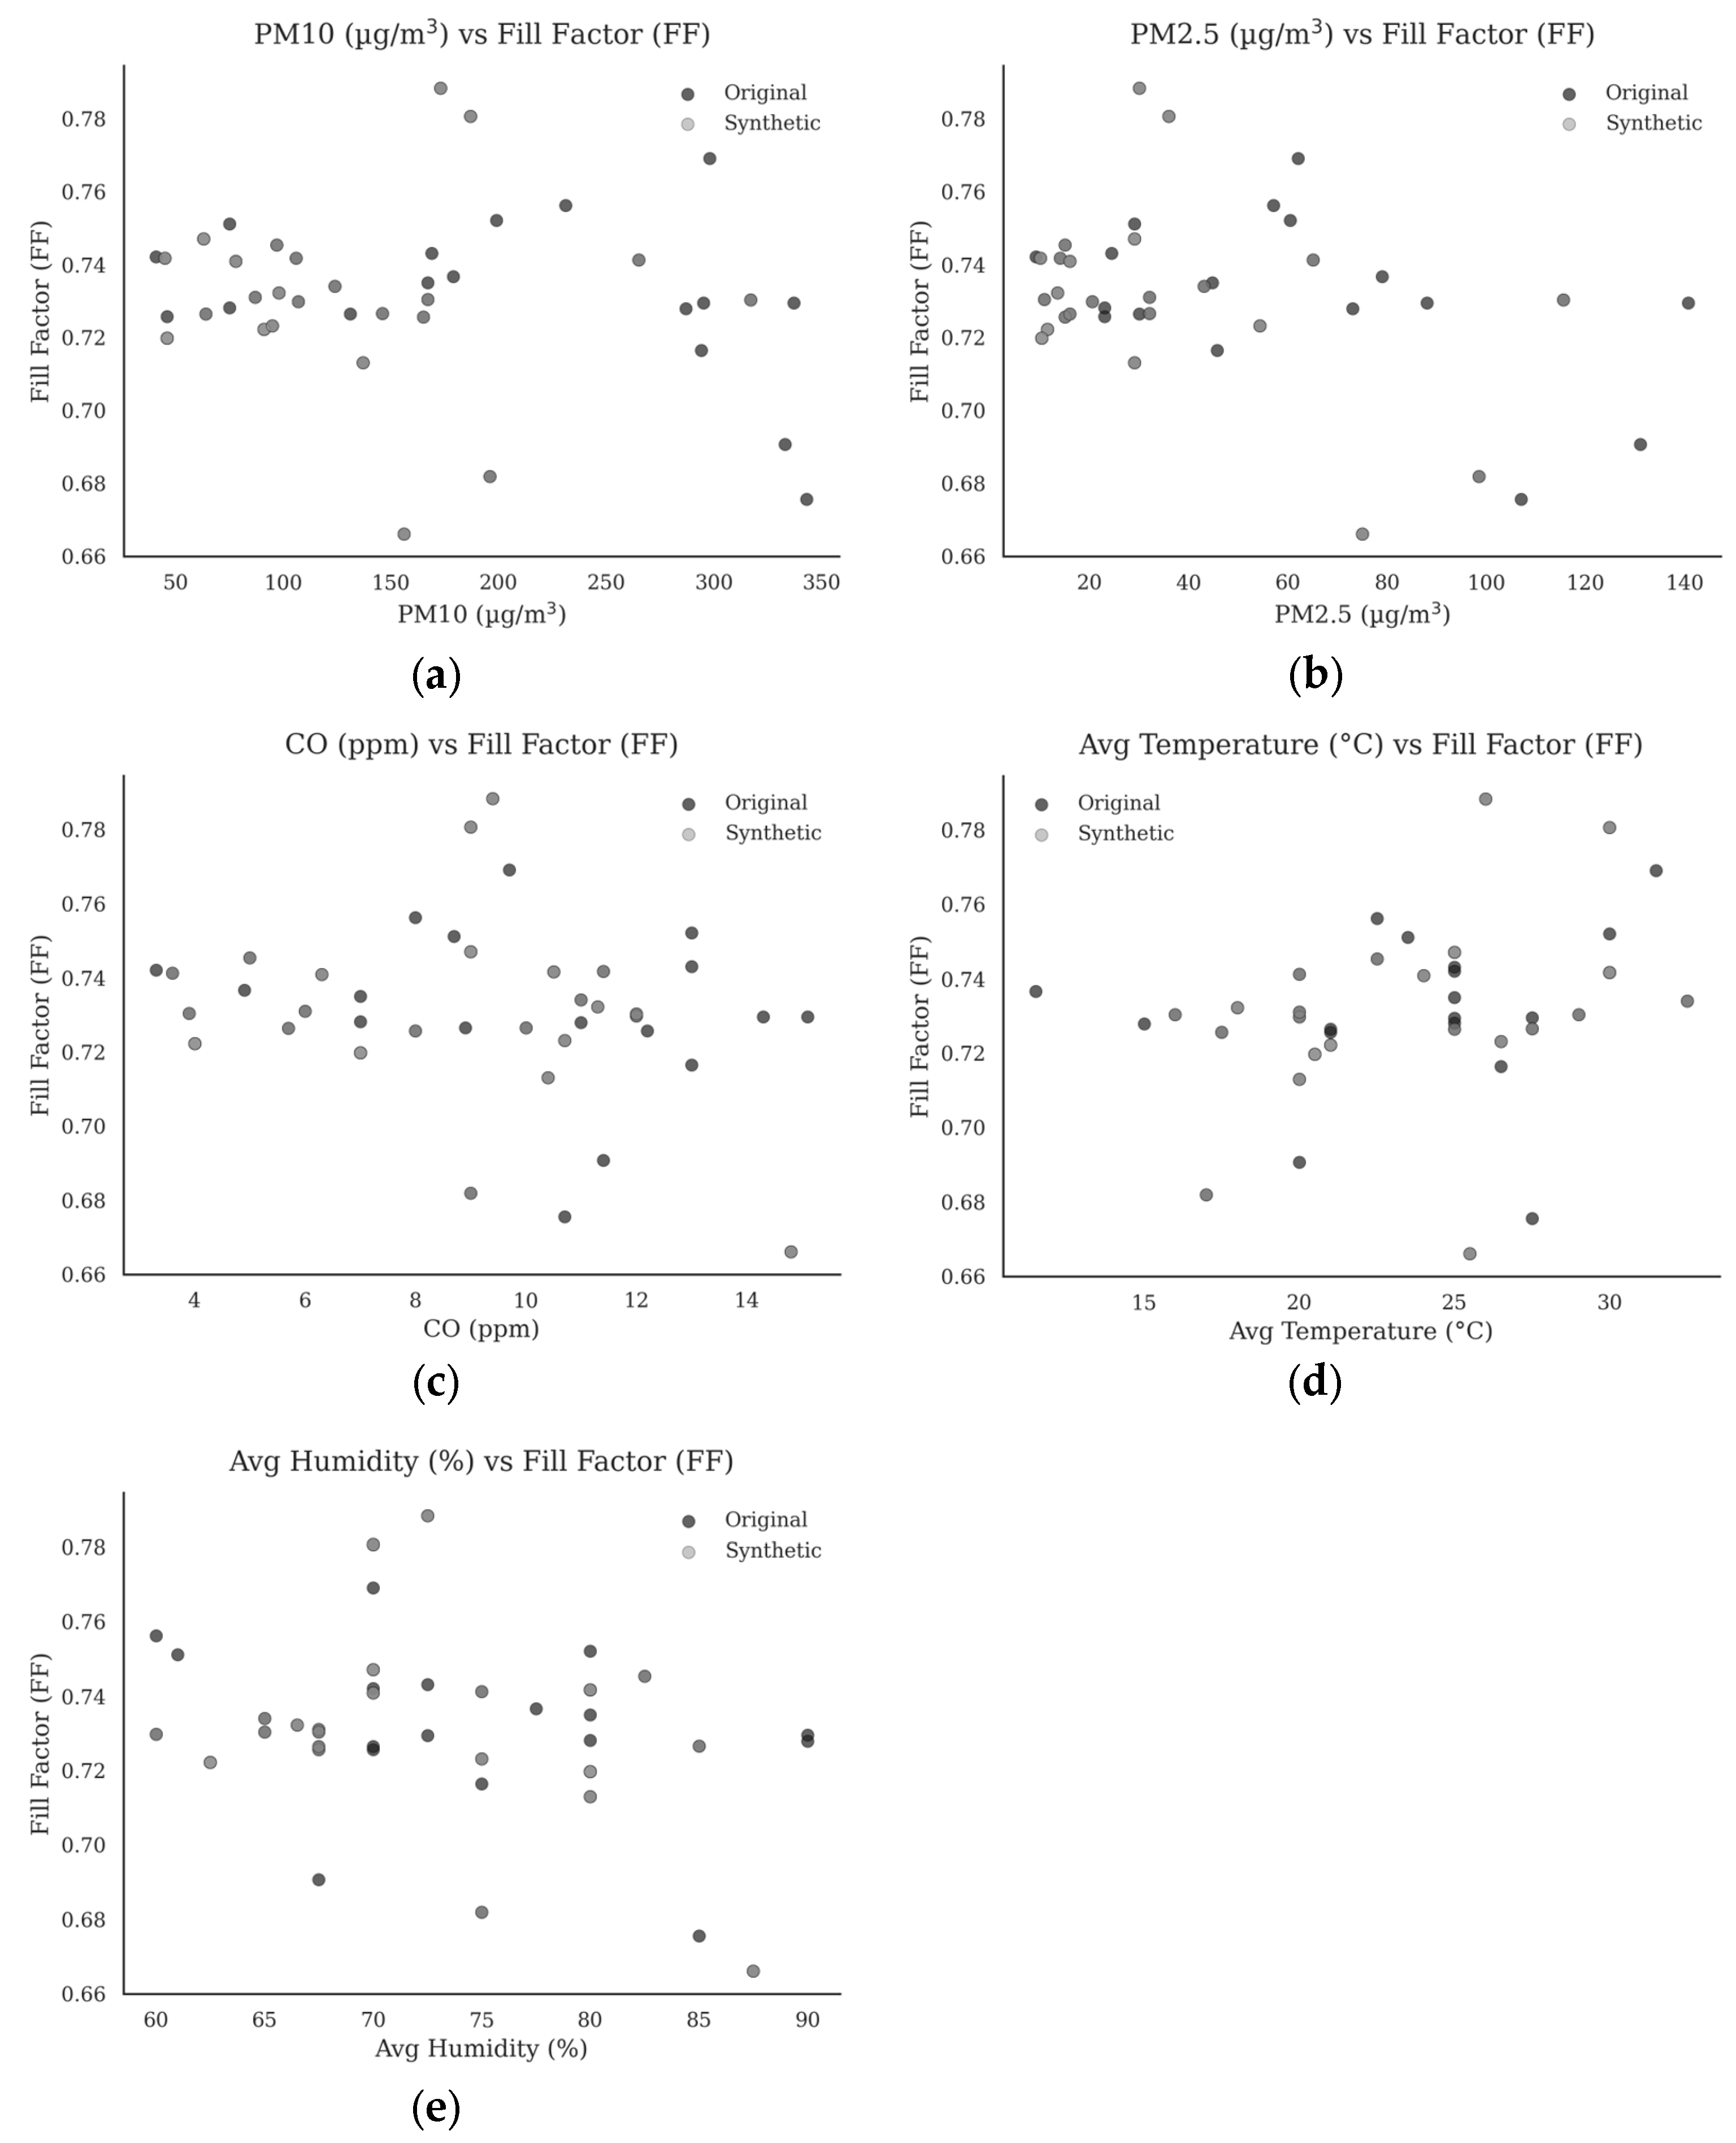
Figure 1. Correlation between weather parameters and Fill Factor: (a) PM10 vs. Fill Factor; (b) PM2.5 vs. Fill Factor; (c) CO vs. Fill Factor; (d) average temperature vs. Fill Factor; (e) average relative humidity vs. Fill Factor.
Engproc 138 00005 g001
Figure 2. Comparison of kernel density estimation (KDE)-based distributions between the original and synthetic datasets for six weather variables: (a) PM10, (b) PM2.5, (c) average temperature, (d) average humidity, (e) carbon monoxide (CO), and (f) fill factor.
Engproc 138 00005 g002
Figure 4. A feature importance analysis was conducted to identify the parameter with the greatest influence on the fill factor of the photovoltaic module. Among the evaluated variables, PM2.5 (µg/m3) exhibited the highest feature importance score, whereas the average temperature (°C) yielded the lowest.
Engproc 138 00005 g004
Table 1. Hyperparameter Configuration of the Implemented Machine Learning Models.
ModelParameterValue
AdaBoostn_estimators50
learning_rate1.0
losslinear
Gradient Boostingn_estimators100
learning_rate0.1
max_depth3
Decision Treecriterionsquared_error
max_depth5
min_samples_split2
min_samples_leaf1
Random Forestn_estimators100
max_depthNone
min_samples_split2
max_features1.0
Disclaimer/Publisher’s Note: The statements, opinions and data contained in all publications are solely those of the individual author(s) and contributor(s) and not of MDPI and/or the editor(s). MDPI and/or the editor(s) disclaim responsibility for any injury to people or property resulting from any ideas, methods, instructions or products referred to in the content.