


Abstract
This study aims to enhance manufacturing efficiency in noodle production by integrating Lean Six Sigma and the Theory of Inventive Problem Solving (TRIZ). The DMAI structure of Lean Six Sigma is employed, with TRIZ tools incorporated into the improvement stage to generate innovative, technically feasible solutions. Results indicate that the noodle production process operates at a three-sigma performance level, with seven major categories of waste identified as the primary contributors to inefficiency. Implementation of the proposed improvement framework is projected to reduce total production time to 10,345 s and increase the proportion of value-added activities to 95.55%.
1. Introduction
The consumption of dry noodles in Indonesia has been increasing, which aligns with the rising wheat imports used as the primary raw material. Noodles, made from wheat flour, eggs, and water, are a popular substitute for rice. Company X is one of the companies producing noodles in Indonesia. The production capacity of this company can reach 2.5–3 tons of raw materials per day. Wastes such as defective products, waiting times, unnecessary movements, overproduction, and excess inventory have been identified.
Efficient production processes are crucial for achieving high company performance and minimizing waste. Waste includes anything that does not add value but still consumes resources [1]. Common types of waste in industry are overproduction, waiting, excessive transportation, defects, unnecessary inventory, unnecessary motion, underutilized people, inappropriate processing, power and energy wastage, environmental pollution, unnecessary overhead, and inappropriate design [2]. To improve production efficiency, methods such as Kaizen, Manufacturing Cycle Effectiveness (MCE), and Six Sigma are employed. Killbridge-Wester groups workstations based on cycle time to minimize the number of workstations without considering defect rates [3]. Kaizen emphasizes continuous improvement through the 5S principles (Seiri, Seiton, Seiso, Shiketsu, Shitsuke) but lacks quantitative efficiency measurement [4]. MCE utilizes cycle time data to minimize non-value-added activities and enhance efficiency; however, it does not address defect reduction [5]. Six Sigma aims to improve process capability by reducing variation and defects [6].
When combined with Lean principles, Six Sigma becomes Lean Six Sigma, which can help industries improve processes, reduce waste, and lower costs [7]. Lean focuses on continuous waste reduction and increasing product value [8,9]. Lean Six Sigma uses analytical tools to identify non-value-added activities and defects, aiming to minimize waste in both production and non-value-added activities [9,10]. Applying Lean Six Sigma, integrating with TRIZ, is expected to systematically enhance production efficiency, meet quality standards, increase productivity, and provide better customer value. This study aims to determine the sigma level of the noodle production processes at Company X, analyze the types of waste generated during noodle production, and provide recommendations to reduce waste in these processes.
2. Methodology
This research employed an integrated approach incorporating Lean Six Sigma and TRIZ methods. The Six Sigma framework was deployed through the four stages of DMAIC (Define, Measure, Analyze, and Improve), with TRIZ methodology applied during the Improve phase to leverage problem-solving and innovation. The scope of this framework excludes the Control phase. It does not include cost analysis, indicating that this study focuses on analyzing and improving process performance rather than evaluating long-term viability or economic impact.
2.1. Define
The Define phase includes determining standard time, creating a Current State Map (CSM), and identifying inefficiencies in noodle production.
2.2. Measure
The Measure phase involves three main steps: defect data collection, control chart development, and sigma level calculation. In this study, a p-chart is used to analyze the number of defective products in a series of inspections with varying sample sizes [11].
2.3. Analyze
The Analysis phase is conducted by selecting a Value Stream Analysis Tool (VALSAT) and identifying Waste Causes using a Fish Bone Diagram. The selection process for the VALSAT tool involves considering the average score from the waste assessment questionnaire using the VALSAT matrix. The three highest multiplication scores will be the basis for selecting the VALSAT tool to be used in this study. Fishbone Diagrams are used to identify the dominant factors that cause waste by identifying aspects of production, such as materials, labor, methods, machinery, and environment.
2.4. Improve
The Improvement Phase involves formulating strategies to enhance noodle production efficiency based on the identified waste. The Improvement Phase includes developing a Future State Map (FSM) by verifying and reducing non-value-added activities and proposing improvements to minimize the common waste types within the company. The recommended improvements are expected to streamline the production process, making it more efficient and effective while reducing potential waste.
3. Result and Discussion
3.1. Noodle Production
The production process for noodles at Company X involves several stages, including preparing raw materials, mixing, forming sheets and strands (pressing), steaming, weighing, drying, cooling, quality control, and packaging. The total calculated cycle time for the noodle production process is 19,068 s.
3.2. Minimizing Waste with Lean Six Sigma-TRIZ Method
3.2.1. Define
The production process consists of 9 workstations covering 33 types of process activities. The development of the current state map (CSM) is based not only on existing written data and information but also involves direct interaction with the Value Stream Manager. Creating the CSM involves categorizing timing information for each production process into three categories: VA (Value-Added), NNVA (Non-Value-Added Necessary), and NVA (Non-Value-Added). The classification of activity types and categories is presented in Table 1.
Table 1.
The classification of activity types and categories.
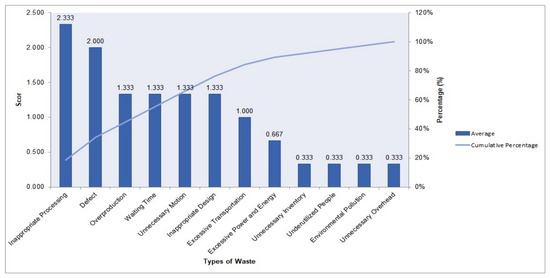
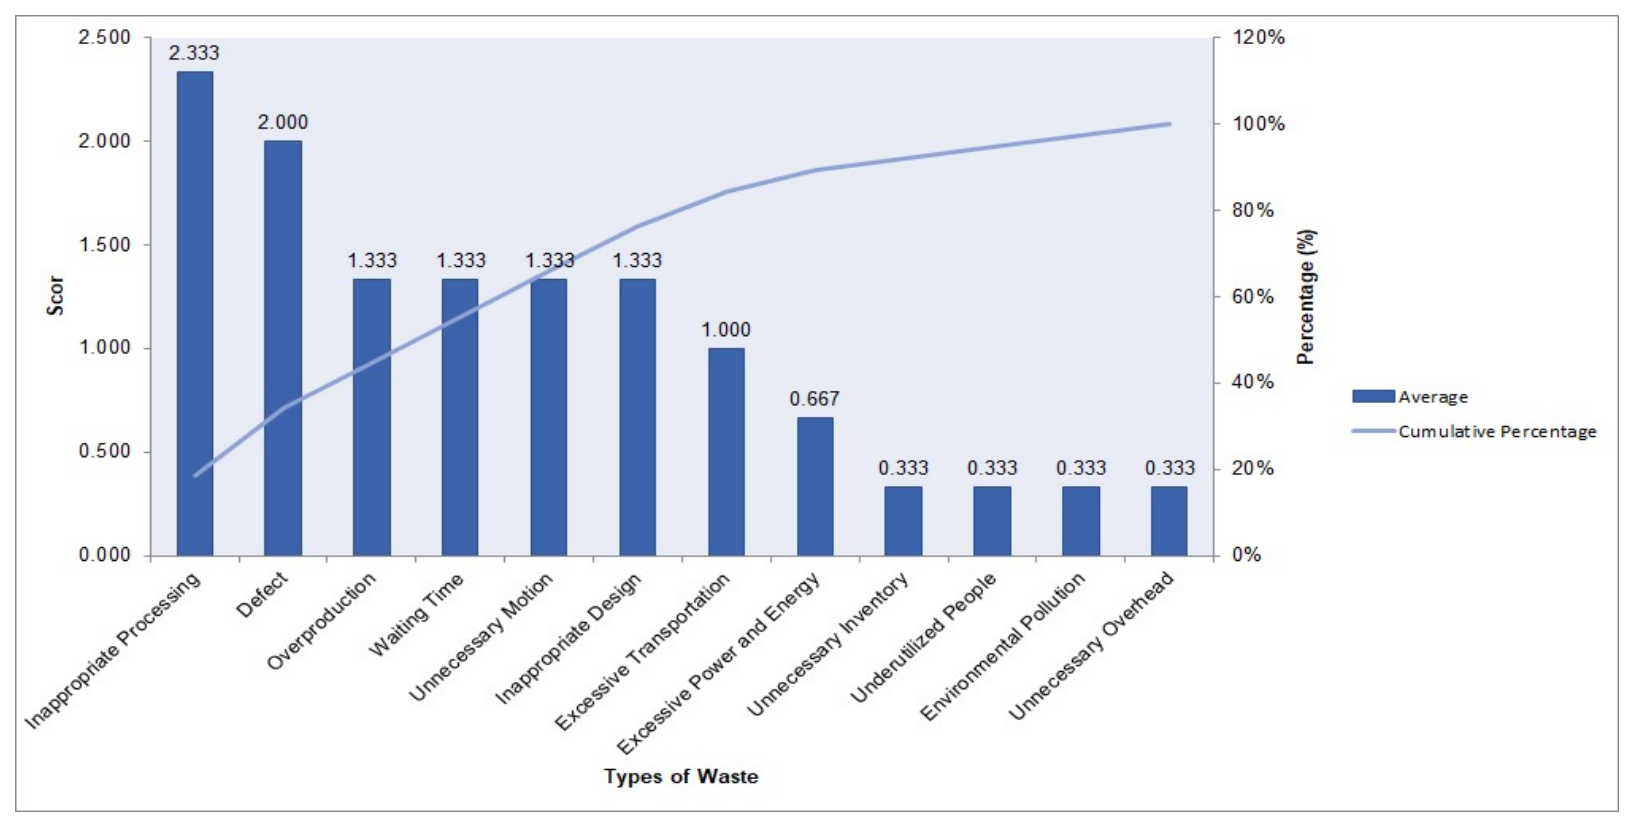
In this study, 12 types of waste have been identified. All identified wastes were analyzed using a Pareto diagram. The Pareto diagram (Figure 1) shows that 7 types of waste are prioritized: Defect, Inappropriate Processing, Overproduction, Waiting Time, Unnecessary Motion, Inappropriate Design, and Excessive Transportation. According to the Pareto principle (80:20), in which 80% of defects are caused by 20% of the reasons, improvements will focus on these 7 types of waste, which collectively account for approximately 80% of total defects in noodle production at the company. Addressing these 7 dominant types of waste is expected to resolve 80% of the waste issues in noodle production at Company X.
Figure 1.
Waste Priority Pareto Diagram.
3.2.2. Measure
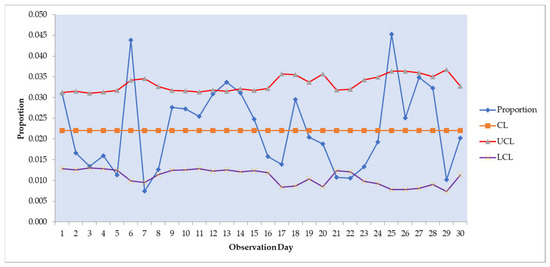
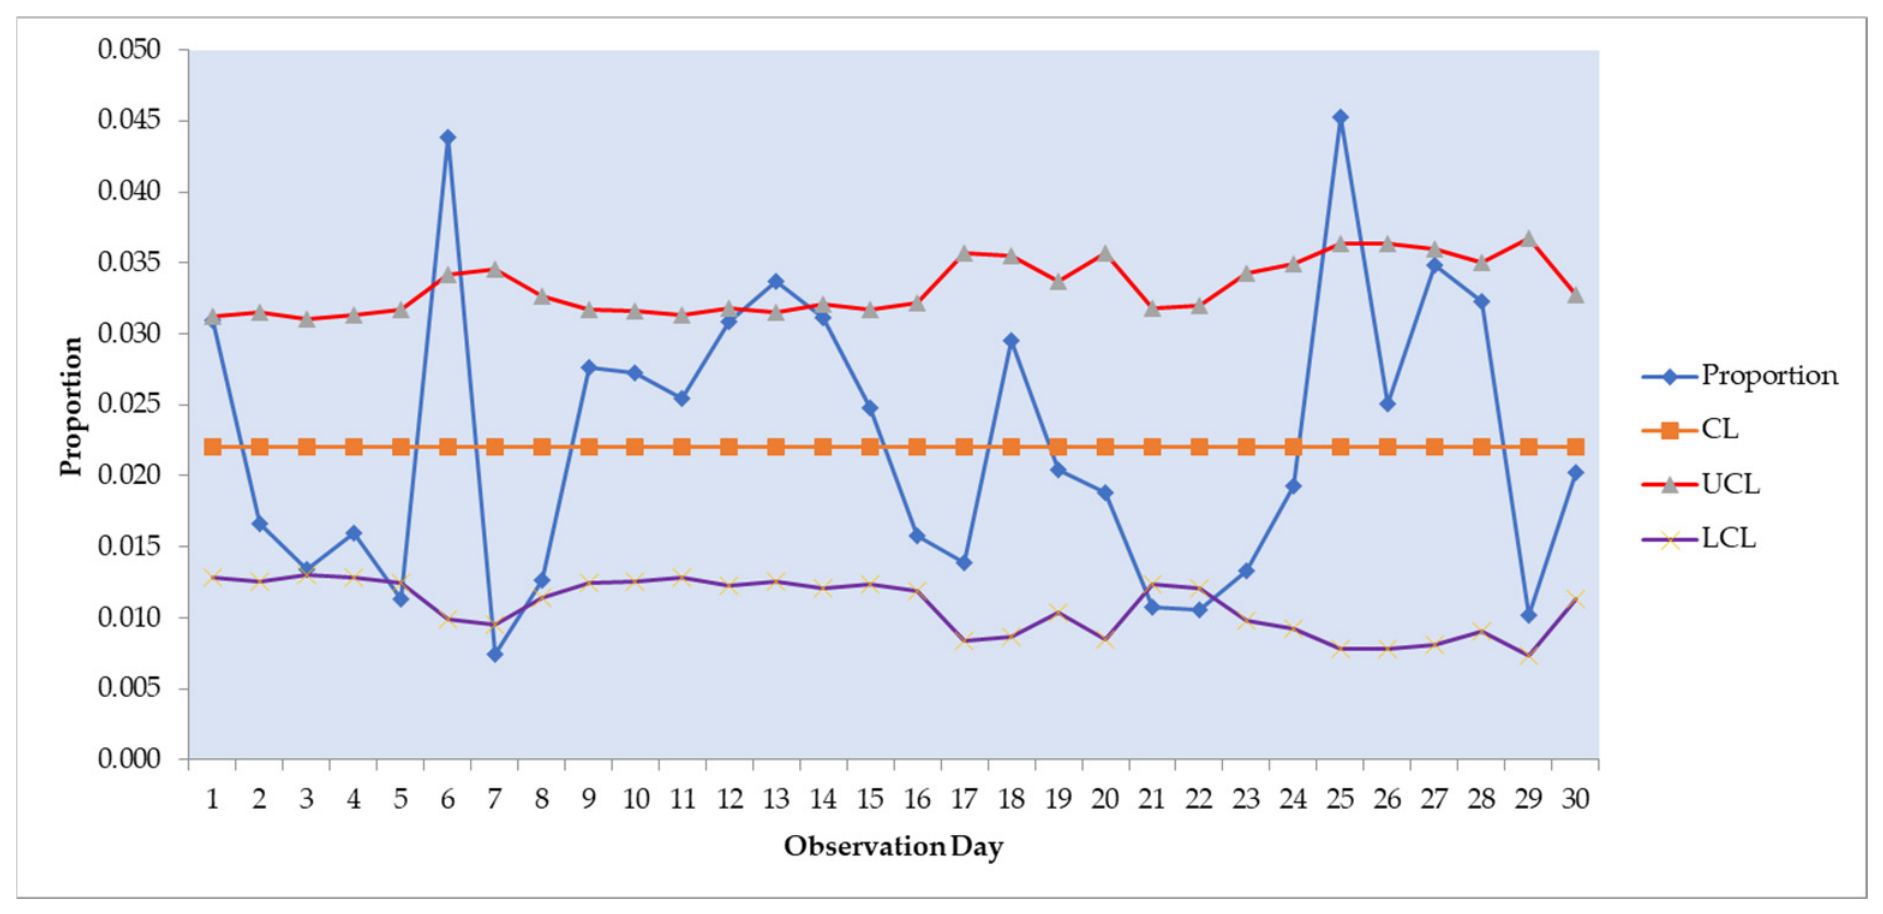
This company has two types of defective products: rejects and rework. Reject is noodle products that are contaminated and cannot be processed further. The company sells rejects as animal feed. On the other hand, rework is noodle products that are not contaminated and can be processed again. Data collection for defects was conducted through 30 repetitions. Defective product data is displayed as a P-Chart control chart (Figure 2). The control chart shows the average line, upper control limit, and lower control limit of the proportion of defective products produced. Based on the calculations, the average proportion of noodle product defects is 0.0221, corresponding to a defect rate of 2.21%. The calculated DPO value was 0.0110, while the DPMO calculated was 11,025.15. The DPMO value indicates that the company produces approximately 11,026 defects per 1,000,000 opportunities. Company X has achieved the average sigma level found in Indonesia. According to Hia & Situmeang [12], the sigma level in Indonesian industries ranges from 2.5 to 3 sigma. This suggests that the company has achieved a fairly high sigma level for a developing company.
Figure 2.
P-Chart Control Map for Noodle Product Defects.
3.2.3. Analyze
The VALSAT tools are used to identify and eliminate waste in noodle production at this company, as shown in Table 2. The seven main VALSAT tools consist of Process Activity Mapping (PAM), Supply Chain Response Matrix (SCRM), Production Variety Funnel (PVF), Quality Filter Mapping (QFM), Demand Amplification Mapping (DAM), Decision Point Analysis (DPA), and Physical Structure Mapping (PSM) [13]. Rankings were obtained for each VALSAT tool. The VALSAT tools selected are the top three rankings: Process Activity Mapping (PAM), Quality Filter Mapping (QFM), and Supply Chain Response Matrix (SCRM). This selection was made in consultation with the company. Using tools ranked among the top three enables the company to bypass the complexity of available options and focus on more effective solutions with a significant impact. Furthermore, the selection of these top three tools also considers the resource limitations and data constraints associated with each tool.
Table 2.
VALSAT Selection Results.
PAM is a tool in VALSAT used to minimize waste by mapping all activities, then identifying and classifying them into three main categories: value-adding activities (VA), necessary non-value-adding activities (NNVA), and non-value-adding activities (NVA) [14,15]. A summary of activity types is presented in Table 3. The mapping of activity types reveals that operational activities have the highest percentage, specifically 61.41%. This value is derived from the percentage of Operation time (11,710 s) compared to the total process time (19,068 s). The second-highest percentage is attributed to delayed activities, accounting for a significant 36%. This figure is calculated by subtracting the Delay time (686 s) from the total process time (19,068 s). Delay activities represent a form of waste that prolongs production time and thus needs to be minimized.
Table 3.
Summary of Activity Types.
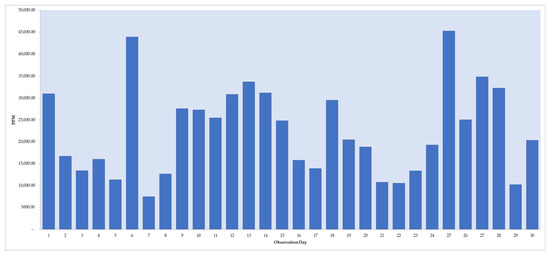
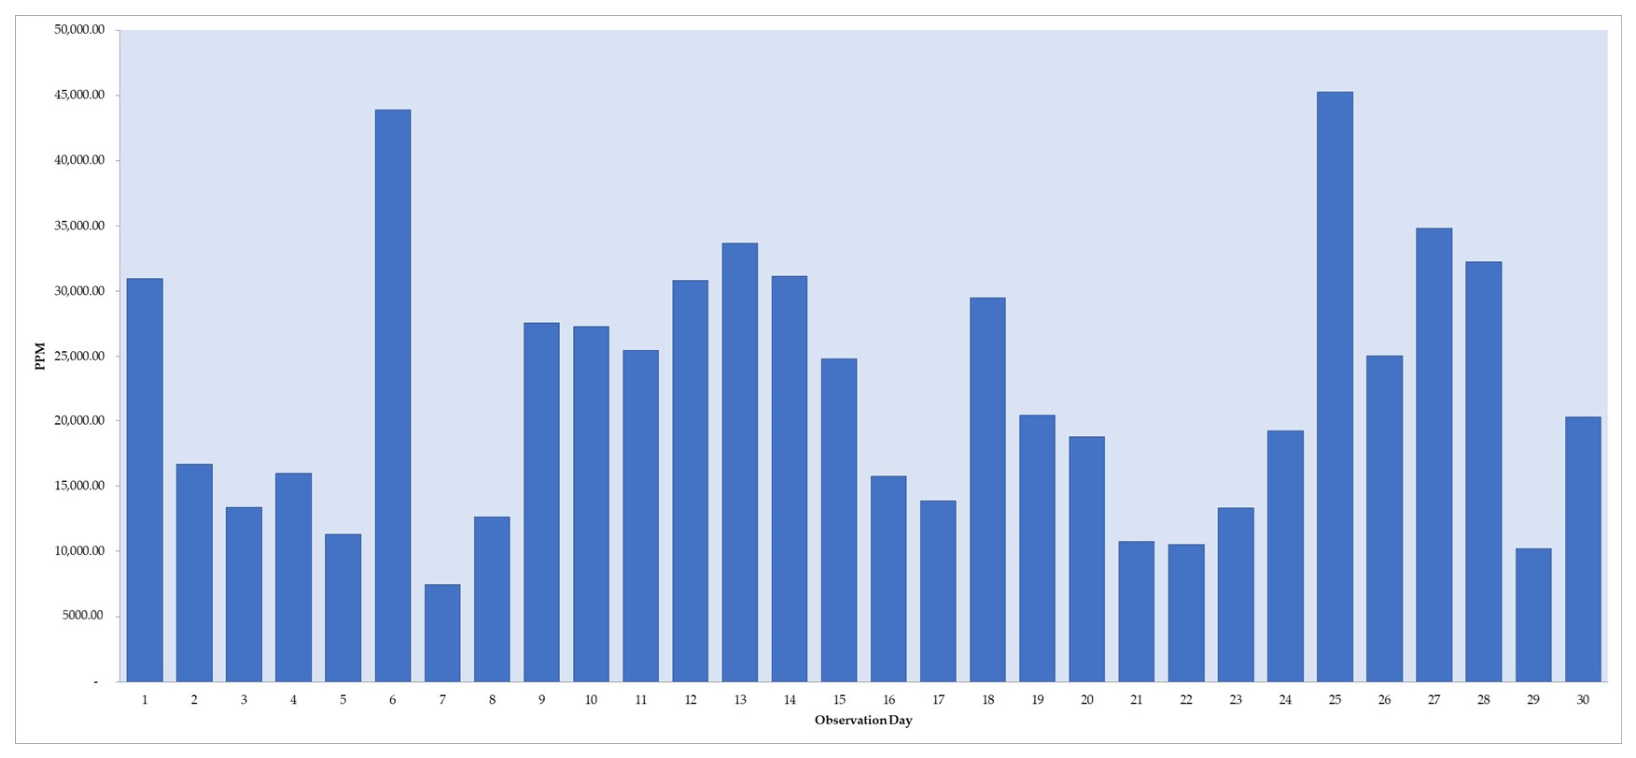
Quality Filter Mapping (QFM) is a tool used to identify quality-related product defects along the supply chain [15]. Based on the calculations, the average rejection rate for noodle products is 2.243%. Additionally, the total PPM obtained is 672,876.9 with an average PPM value of 22,429.2. These values align with the company’s sigma level identification, which indicates it operates at sigma level 3. Visualization of daily product defect rates using QFM is shown in Figure 3.
Figure 3.
Quality Filter Mapping Product Defects Daily.
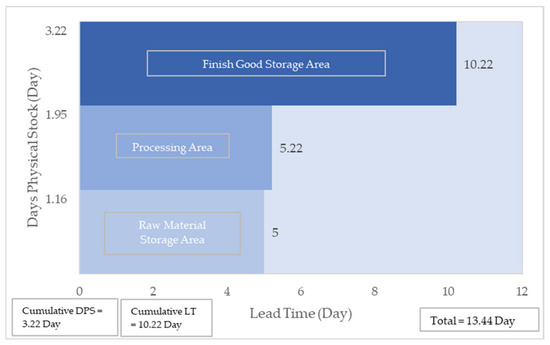
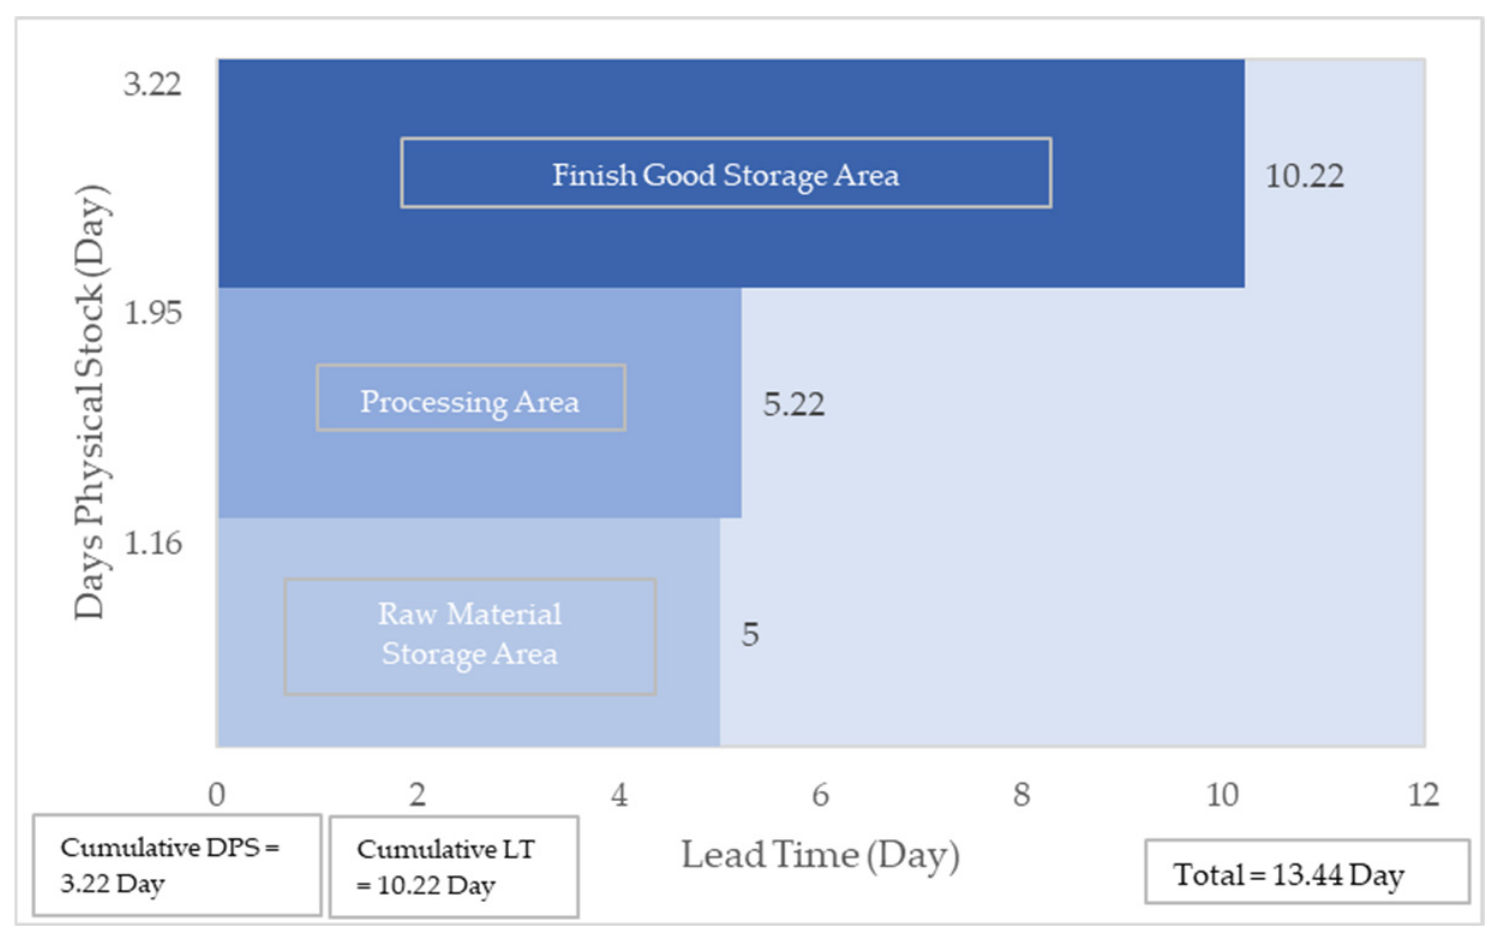
The Supply Chain Response Matrix (SCRM) graph (Figure 4) depicts the vertical axis as materials or products within the system. In contrast, the horizontal axis displays cumulative waiting times in the noodle production process. The vertical axis shows the cumulative Days Physical Stock (DPS) value of 2.18 days, while the horizontal axis shows the cumulative lead time value of 10.22 days. The graph depicts the highest DPS value in the finished goods storage area. A higher DPS value indicates a longer inventory accumulation along the demand fulfillment system [16]. The high DPS value in the finished goods storage area suggests a buildup of products there. Accumulation in the finished goods warehouse is due to the need to reprocess (rework) noodles, which affects the accuracy of production scheduling and planning. This accumulation suggests inaccurate purchasing forecasts, necessitating an inventory management system that can adapt to changing customer demand.
Figure 4.
Supply Chain Response Matrix Graph.
The identification of waste causes in noodle production is conducted using a Fishbone diagram. Based on the fishbone diagram analysis, the main causes of the problems faced are human factors (human error), suboptimal work methods, machinery and equipment that are not always standardized, and a work environment that does not support stability in the production process. Additionally, varying raw material quality, inaccurate measurements, and management policies that are not fully integrated exacerbate the root causes further. This analysis underscores the need for a systematic, collaborative approach to enhancing quality, beginning with workforce training, standardizing procedures, and refining management and quality control systems. These efforts will not only reduce the potential for product defects but also foster a culture of continuous improvement that drives overall industrial competitiveness.
To enhance the analytical rigor of this study, results from VALSAT (PAM), QFM, and SCRM were triangulated. Across all three tools, defects and rework consistently emerge as the primary sources of inefficiency. PAM reveals substantial delay and rework-related activities, QFM quantifies their impact through a defect rate of about 2.2% and a DPMO near 11,000, and SCRM shows significant DPS accumulation in finished goods due to reprocessing. Together, these findings demonstrate that quality losses not only create local NNVA and NVA activities but also drive broader disruptions, including scheduling inaccuracies, excess inventory, and extended lead times. The triangulation further confirms the presence of waiting, overproduction, and inappropriate processing. PAM highlights long delays across key workstations, SCRM indicates prolonged cumulative lead time, and QFM reflects fluctuating defect patterns that destabilize process flow. These analytical results form a coherent diagnostic foundation that guides the improvement strategies developed in the FSM and subsequently refined through TRIZ-based mechanisms.
3.2.4. Improve
The Future State Map (FSM) is compiled by considering improvements in activity time. Improvements are made by optimizing activities that add value and eliminating or reducing those that do not. The Before-After comparison clearly demonstrates that the proposed Lean Six Sigma-TRIZ improvements significantly reduced non-value-added activities (NVA and NNVA), as shown in Table 4.
Table 4.
Before–After Analysis of Activity Value Categories.
Based on Table 5, the 95.54% value is obtained by comparing the percentage of Value-Added Activity time (9884 s) after improvement to the total process time after improvement (10,345 s). The value of 4.46% was obtained by comparing the percentage of Necessary Non-Value-Added Activity time after improvement (461 s) to the total process time after improvement (10,345 s). The recommended improvement in activity time is expected to reduce NNVA and NVA, which are among the company’s waste categories. According to Indrawati et al. [17], the Lean concept focuses on reducing and eliminating activities that do not add value. The recommended improvements can reduce activity time by 8723 s by eliminating 2 NNVA activities and 1 NVA activity and reducing several other activity times. In addition, the recommended improvements are predicted to increase the VA percentage from 61.41% to 95.54%, reduce the NNVA percentage from 37.48% to 4.46%, and reduce the NVA percentage to 0%.
Table 5.
Results of Activity Time Improvement.
The FSM clarifies which activities require improvement, but implementing these changes involves resolving several technical contradictions. TRIZ principles were therefore applied to generate technically feasible, innovation-driven solutions, with each action supported by a mechanistic rationale that explains its effect on waste reduction and process stability [17]. Each improvement action is supported by a mechanistic rationale that demonstrates its effectiveness in reducing waste and strengthening process capability. TRIZ-based causal mechanisms for Waste Reduction are presented in Table 6.
Table 6.
TRIZ-Based Causal Mechanisms for Waste Reduction.
The integration of Lean Six Sigma and TRIZ provides a structured path from problem identification to engineered solution design. Lean Six Sigma, through the DMAIC process sequence, enables systematic detection of waste, quantification of process variation, and identification of root causes using tools such as PAM, QFM, and SCRM. However, Lean Six Sigma alone usually results in gradual improvements and does not sufficiently address the technical contradictions inherent in defects, delays, and unstable process downtime. TRIZ overcomes these limitations by offering innovative principles that transform diagnostic insights into technically grounded solutions. Through principles such as Early Action, Continuous Action, Mechanical Substitution, and Incorporation, TRIZ addresses the conflicts between accuracy and speed, productivity and operator workload, and process consistency and complexity. These mechanisms explain how improvements such as pre-calibrated weighing, standardized environmental controls, ergonomic layouts, and integrated planning systems reduce NNVA and NVA activities at the source. Therefore, this integrated framework strengthens the Improvement phase: Lean Six Sigma identifies and measures inefficiencies, while TRIZ defines innovative, technically feasible, and precisely described interventions to eliminate them. This integration results in a cause-and-effect chain that links root causes to measurable performance improvements, enabling an 8723-s reduction in non-value-added time and an increase in value-added activities from 61.41% to 95.55%.
4. Conclusions
This study reveals that integrating Lean Six Sigma with TRIZ provides a structured, innovation-based framework to enhance manufacturing efficiency in noodle production. Initial assessments showed that the process was operating at a three-sigma level, with a defect rate of 2.21%, and that non-value-added activities were significant. Through the Define-Measure-Analyze stages, dominant waste sources (defects, improper processing, waiting, overproduction, unnecessary motion, unsuitable design, and excessive transportation) were identified and quantitatively validated using PAM, QFM, and SCRM. Triangulation of these tools confirmed strong consistency in diagnosing delays related to quality, flow issues, and systemic inventory buildup. Improvements were developed through a Future State Map (FSM) demonstrating a significant reduction in non-value-added activities time, eliminating 8723 s of NNVA and NVA activities, and increasing the proportion of value-added work from 61.41% to 95.55%. TRIZ principles play an important role in solving technical contradictions that limit process performance, enabling engineering solutions such as pre-calibrated weighing, stable processing conditions, ergonomic layout adjustments, and integrating production and inventory coordination. These mechanistic interventions strengthen process capability and contribute to smoother flow, fewer rework cycles, and reduced delays. This study confirms that integrating Lean Six Sigma and TRIZ not only improves operational efficiency but also provides a coherent causal path from root cause identification to technically robust corrective actions. This framework can serve as a practical reference for food processing companies seeking to reduce waste, stabilize operations, and increase productivity through structured continuous improvement. The triangulated diagnostic approach, which uses PAM, QFM, and SCRM, adds methodological rigor, ensuring that corrective actions are based on consistent cross-tool evidence.
Author Contributions
Conceptualization, W.G.R., A.R.P.S., and R.S.; methodology, W.G.R., A.R.P.S., and R.S.; software, A.R.P.S.; validation, W.G.R., A.R.P.S., and R.S.; formal analysis, W.G.R. and A.R.P.S.; investigation, A.R.P.S.; resources, A.R.P.S.; data curation, W.G.R. and R.S.; writing—original draft preparation, W.G.R., A.R.P.S. and R.S.; writing—review and editing, W.G.R. and Y.-T.J.; visualization, W.G.R. and A.R.P.S.; supervision, W.G.R., R.S., and Y.-T.J.; project administration, W.G.R.; funding acquisition, W.G.R. All authors have read and agreed to the published version of the manuscript.
Funding
This research was funded by the Faculty of Agroindustrial and Biosystem Technology, Universitas Brawijaya, through a PNBP research grant (number 1034/UN10.F10.06/TU/2023).
Institutional Review Board Statement
Not applicable.
Informed Consent Statement
Not applicable.
Data Availability Statement
The data supporting the findings of this study are available from the corresponding author upon reasonable request.
Conflicts of Interest
The authors declare no conflicts of interest.
References
- Sucipto; Susilowati, E.; Effendi, U. Reducing waste on wheat flour packaging: An analysis of Lean Six Sigma. IOP Conf. Ser. Earth Environ. Sci. 2020, 475, 012002. [Google Scholar] [CrossRef] [Scilit]
- Widiwati, I.T.B.; Liman, S.D.; Nurprihatin, F. The implementation of Lean Six Sigma approach to minimize waste at a food manufacturing industry. J. Eng. Res. 2024, 13, 611–626. [Google Scholar] [CrossRef] [Scilit]
- Haq, H.S.; Pulansari, F.; Suryadi, A. Analisis keseimbangan lintasan menggunakan metode Largest Candidate Rule, Killbridge and Western Method, Ranked Positional Weights. JUMINTEN 2020, 1, 13–24. [Google Scholar] [CrossRef] [Scilit]
- Tahasin, T.A.; Gupta, H.S.; Tuli, N.T. Analyzing the impact of 5S implementation in the manufacturing department: A case study. Int. J. Res. Ind. Eng. 2021, 10, 286–294. [Google Scholar] [CrossRef]
- Jebbor, I.; Benmamoun, Z.; Hachimi, H. Optimizing Manufacturing Cycles to Improve Production: Application in the Traditional Shipyard Industry. Processes 2023, 11, 3136. [Google Scholar] [CrossRef] [Scilit]
- Arango, D.L.; Sokolov, A.; Raut, S.; Hossain, N.U.I. Leveraging Lean Six Sigma to Optimize the U.S. Air Force Safety Reporting Process. Eng. Proc. 2024, 76, 70. [Google Scholar] [CrossRef] [Scilit]
- Costa, L.B.M.; Filho, M.G.; Fredendall, L.D.; Ganga, G.M.D. Lean six sigma in the food industry: Construct development and measurement validation. Int. J. Prod. Econ. 2021, 231, 107843. [Google Scholar] [CrossRef] [Scilit]
- Habib, M.A.; Rizvan, R.; Ahmed, S. Implementing lean manufacturing for improvement of operational performance in a labeling and packaging plant: A case study in Bangladesh. Results Eng. 2022, 17, 100818. [Google Scholar] [CrossRef] [Scilit]
- van Assen, M.F. Lean, process improvement and customer-focused performance. The moderating effect of perceived organisational context. Total Qual. Manag. Bus. Excell. 2018, 32, 57–75. [Google Scholar] [CrossRef] [Scilit]
- Purnomo, D.H.; Lukman, M. Reduce Waste using Integration of Lean Six Sigma and TRIZ Method: A Case Study in Wood Industry. J. Tek. Ind. 2020, 21, 139–152. [Google Scholar] [CrossRef] [Scilit]
- Quinino, R.C.; Cruz, F.R.; Quinino, V.B. Control chart for process mean monitoring combining variable and attribute inspections. Comput. Ind. Eng. 2021, 152, 106996. [Google Scholar] [CrossRef] [Scilit]
- Hia, S.W.; Situmeang, F.T.H. Reveal Six Sigma implementations in Indonesian manufacturing industries. In Proceedings of the 3rd Asia Pacific International Conference on Industrial Engineering and Operations Management, Johor Bahru, Malaysia, 13 September 2022. [Google Scholar]
- Batwara, A.; Kediya, S.; Kayande, R.A. An analytical framework for optimizing supply chain operations with lean practices. Supply Chain Anal. 2025, 11, 100145. [Google Scholar] [CrossRef] [Scilit]
- Suhardi, B.; Hermas Putri K.S., M.; Jauhari, W.A. Implementation of value stream mapping to reduce waste in a textile products industry. Cogent Eng. 2020, 7, 1842148. [Google Scholar] [CrossRef] [Scilit]
- Dara, H.M.; Raut, A.; Adamu, M.; Ibrahim, Y.E.; Ingle, P.V. Reducing non-value added (NVA) activities through lean tools for the precast industry. Heliyon 2024, 10, e29148. [Google Scholar] [CrossRef] [Scilit] [PubMed]
- Kholil, M. Implementation of Lean Manufacturing to Reduce Hold Types of Mission Case Products using DMAIC and KAIZEN Approach. Int. J. Sci. Acad. Res. 2023, 03, 34–43. [Google Scholar] [CrossRef] [Scilit]
- Indrawati, S.; ‘aZzam, A.; Adrianto, E.; Miranda, S.; Prabaswari, A.D. Lean concept development in fast food industry using integration of Six Sigma and TRIZ method. IOP Conf. Ser. Mater. Sci. Eng. 2020, 722, 012044. [Google Scholar] [CrossRef] [Scilit]

Disclaimer/Publisher’s Note: The statements, opinions and data contained in all publications are solely those of the individual author(s) and contributor(s) and not of MDPI and/or the editor(s). MDPI and/or the editor(s) disclaim responsibility for any injury to people or property resulting from any ideas, methods, instructions or products referred to in the content. |
© 2026 by the authors. Licensee MDPI, Basel, Switzerland. This article is an open access article distributed under the terms and conditions of the Creative Commons Attribution (CC BY) license.