


Abstract
Cacao grading in the Philippines has relied on slow and inconsistent visual inspection. To effectively detect defects in Trinitario cacao beans, we developed a compact, low-cost computer vision system using single-bean images captured with a Raspberry Pi 5 and Camera Module 3 under controlled lighting and distance conditions. The dataset comprises 1565 images, partitioned into training (80%), validation (10%), and testing (10%) sets. Each image was resized to 224 × 224 pixels, normalized with ImageNet statistics, and subjected to light augmentation. A ResNet-50 model was fine-tuned through transfer learning, employing AdamW optimization, warmup–cosine scheduling, label smoothing, exponential moving average, and early stopping, to classify beans into five categories: good, moldy, slaty, germinated, and over-fermented. On the held-out test set, the model achieved a 94.0% accuracy, strong per-class F1 scores, and high one-vs-rest mean average precision. Compared with a Visual Geometry Group-16 approach, which attained a 90.67% accuracy, the developed system improved performance by 3.3% while remaining inexpensive and easy to deploy. The lightweight system provides reliable and scalable cacao bean screening. Further improvements are anticipated through the expansion of underrepresented classes and refinement of class-specific thresholds.
1. Introduction
Cacao bean quality directly influences the taste, aroma, and market value of chocolate. In the Philippines, the Davao region accounts for more than 80% of national cacao production, with Trinitario as the predominant variety, valued for its fine flavor, resilience, and balanced yield–quality characteristics [1,2]. Despite its importance, quality control remains inconsistent, as grading continues to rely on manual inspection. This process is slow, subjective, and labor-intensive, with reports indicating that up to one in three defective beans may be overlooked [3].
Advances in computer vision and machine learning have demonstrated the potential to improve accuracy and repeatability in cacao grading. For example, a Visual Geometry Group network with 16 layers (VGG-16) combined with simple preprocessing achieved 90.67% accuracy in identifying external features [4]. A K-nearest neighbors method utilizing color, morphology, and shape features reached 93.33% accuracy on a small dataset [5]. A hybrid model integrating convolutional neural networks with adaptive neuro-fuzzy inference systems showed promise for grading applications [6]. However, much of the prior work has focused primarily on external sorting rather than detailed defect identification, relied on a limited range of models, and used relatively small datasets, thereby constraining generalization.
We applied deep learning for defect identification in Trinitario cacao beans using a Residual Network with 50 layers (ResNet-50), a convolutional architecture with residual connections that enables deeper and more stable training on complex images [7]. Through transfer learning, features learned from large benchmark datasets are adapted to cacao-specific textures and colors, which is particularly advantageous when domain-specific data are modest [8,9]. The developed five-class classifier distinguishes moldy, slaty, germinated, over-fermented, and good beans, improving precision and consistency over manual inspection and supporting Philippine producers in meeting international quality standards [1,2].
2. Materials and Methods
2.1. System Development
The inputs to the developed system are single-bean images of Trinitario cacao with expert labels for five defect classes, taken under fixed lighting and camera settings. In the process stage, images are standardized by cropping, resizing to 224 × 224, and normalizing, then lightly augmented. A ResNet-50 model with a five-class output is trained using transfer learning and is evaluated with a confusion matrix, accuracy, precision, recall, and F1. The outputs are the predicted defect class for each bean.
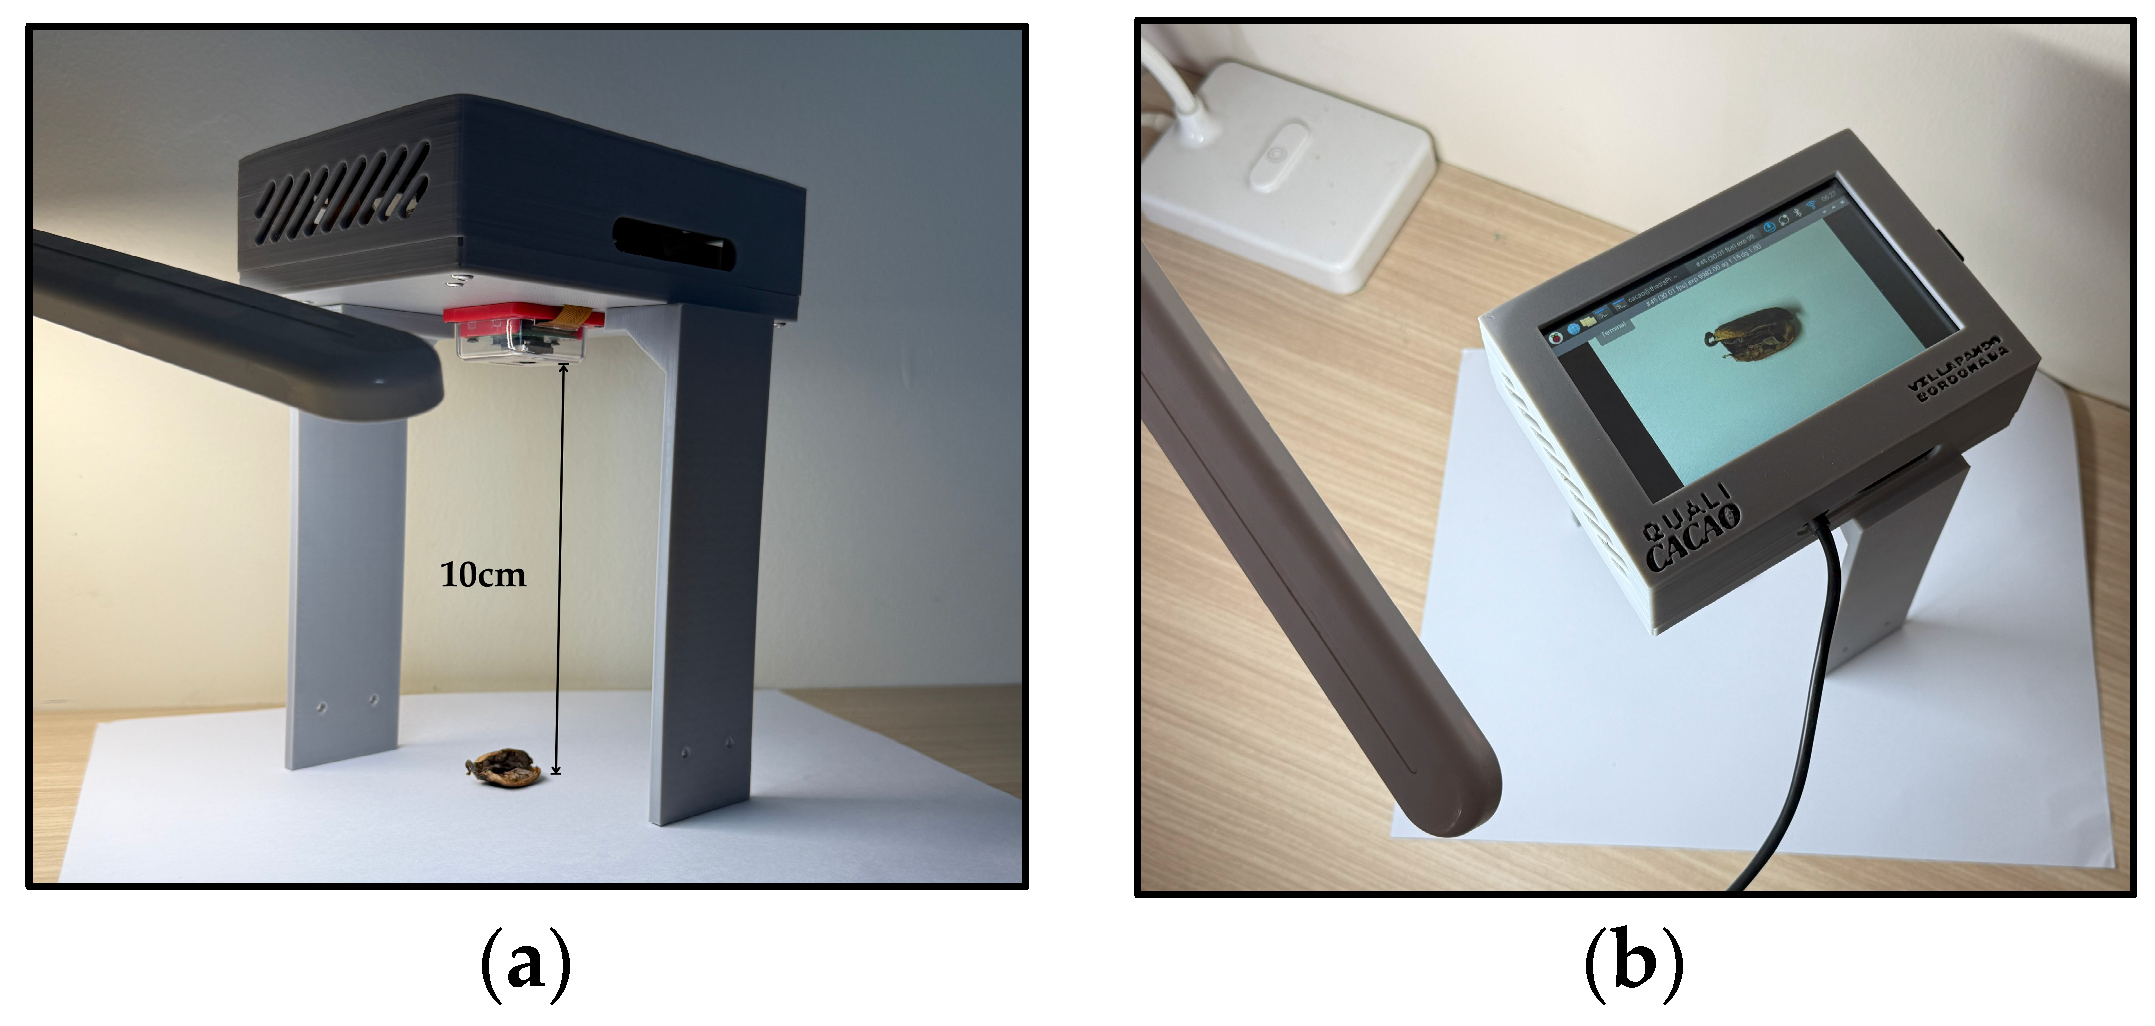
For imaging, we used a Raspberry Pi 5 with Camera Module (Raspberry Pi Ltd., Cambridge, UK) for an affordable, high-resolution capture. Each Trinitario bean was photographed alone on a plain white background under uniform LED lighting to reduce shadows and glare. The camera height and field of view were fixed to keep scale and focus consistent across images [10]. This controlled setup preserved surface details—texture, color, and visible defects—needed for accurate deep-learning classification (Figure 1).
Figure 1.
(a) Overhead camera positioned at 10 cm from the sample bean; (b) initial imaging setup with fixed camera, lighting, and background.
2.2. Dataset
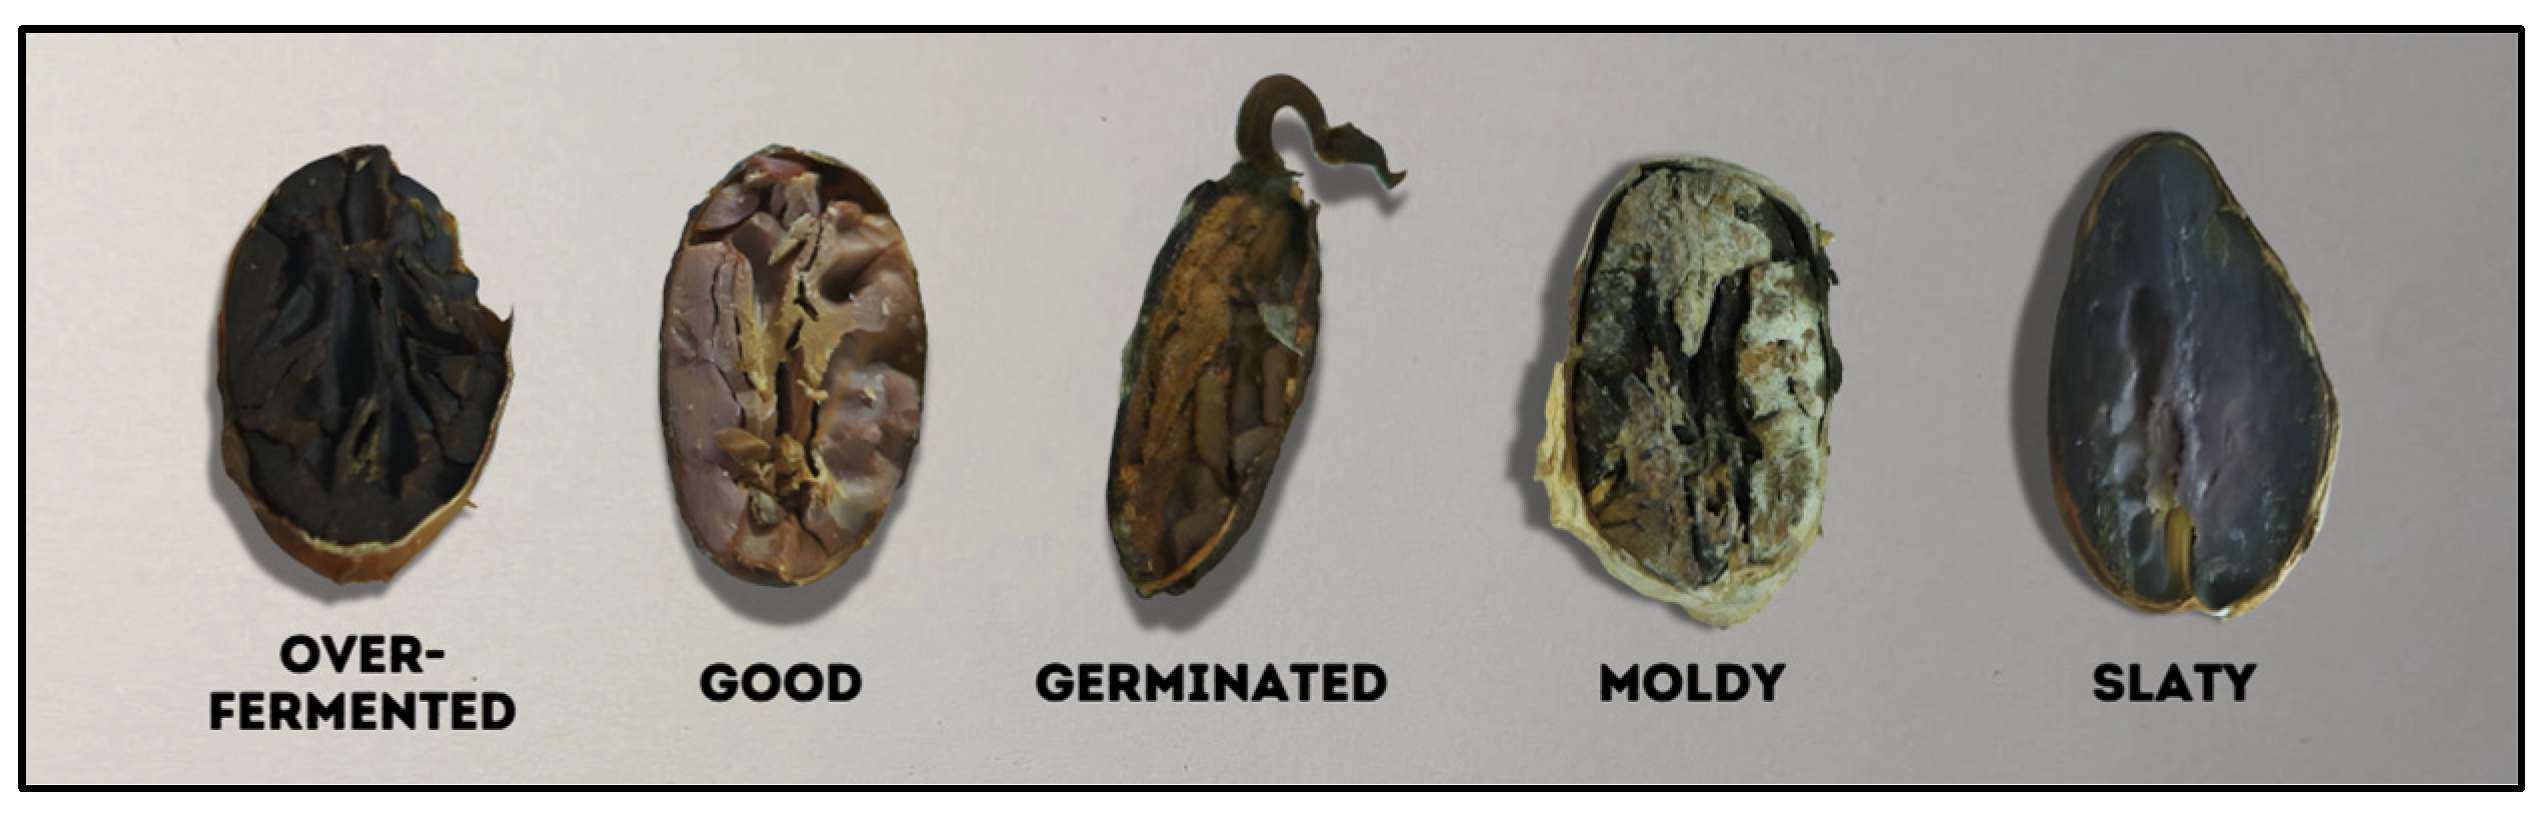
The samples were manually inspected and categorized by an expert in accordance with the Philippine National Standard for cacao beans, which specifies quality indicators for fermentation progress and defect classification. The dataset comprised five target classes representing common defect types: moldy, slaty, germinated, over-fermented, and good (Figure 2).
Figure 2.
Dataset classes shown (L–R): over-fermented, good, germinated, moldy, slaty.
A total of 1565 single-bean images of Trinitario cacao were curated and labeled by the expert into these five categories. The data were stratified and divided into training, validation, and test sets, with 1265 images (80%) allocated to training, 150 images (10%) to validation, and 150 images (10%) to testing. Class distributions were kept approximately balanced within each split to ensure fair evaluation. Labels were assigned based on external appearance and fermentation characteristics [2].
All images were standardized before model training. Each image was resized to 224 × 224 pixels to meet the input specification of the ResNet-50 [9] and normalized to the [0, 1] range to promote numerical stability and accelerate convergence [11]. To enhance robustness and reduce the risk of overfitting, data augmentation techniques were applied, including random horizontal flips, rotations, translations, and brightness adjustments. These transformations simulated realistic imaging variability and increased dataset diversity [11]. The dataset was subsequently partitioned into 80% training, 10% validation, and 10% test subsets, consistent with recommended practices for deep learning classification tasks [12].
2.3. Model Architecture and Training
We used ResNet-50 [7], a 50-layer CNN with residual skip connections that curb vanishing gradients and speed up training [13]. Its convolutional identity blocks with batch normalization and Rectified Linear Unit extract hierarchical features effectively [9]. We adopted ImageNet-pretrained weights for transfer learning to the cacao dataset [8,14]. The original fully connected layer was replaced by a 5-node dense layer with softmax for the five cacao conditions.
ResNet-50, pre-trained on the ImageNet dataset, was fine-tuned with a five-class softmax output head. Training was conducted on 224 × 224 image crops using the previously described augmentations, while the validation and test sets were processed with resizing and ImageNet normalization only. Optimization was performed using AdamW with a learning rate of 3 × 10⁻⁴ and a weight decay of 1 × 10⁻⁴. A five-epoch warm-up phase was followed by cosine learning rate decay over 50 epochs. Label smoothing was set to 0.05, the batch size was 32, and the exponential moving average was enabled. The best checkpoint, determined by validation accuracy, was selected using early stopping with a patience of eight epochs and subsequently evaluated on the held-out test set.
Performance was evaluated using multiple metrics, including accuracy, precision, recall, F1 score, and one-vs-rest average precision/mean average precision (AP/mAP) across macro, micro, and weighted averages. To further stabilize predictions, a light test-time augmentation strategy was applied, consisting of the original image and its horizontal flip (Figure 3).
Figure 3.
Block diagram of the (training/evaluation) pipeline.
3. Results and Discussion
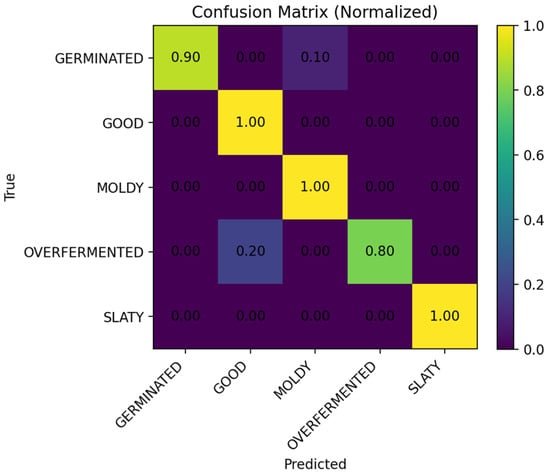
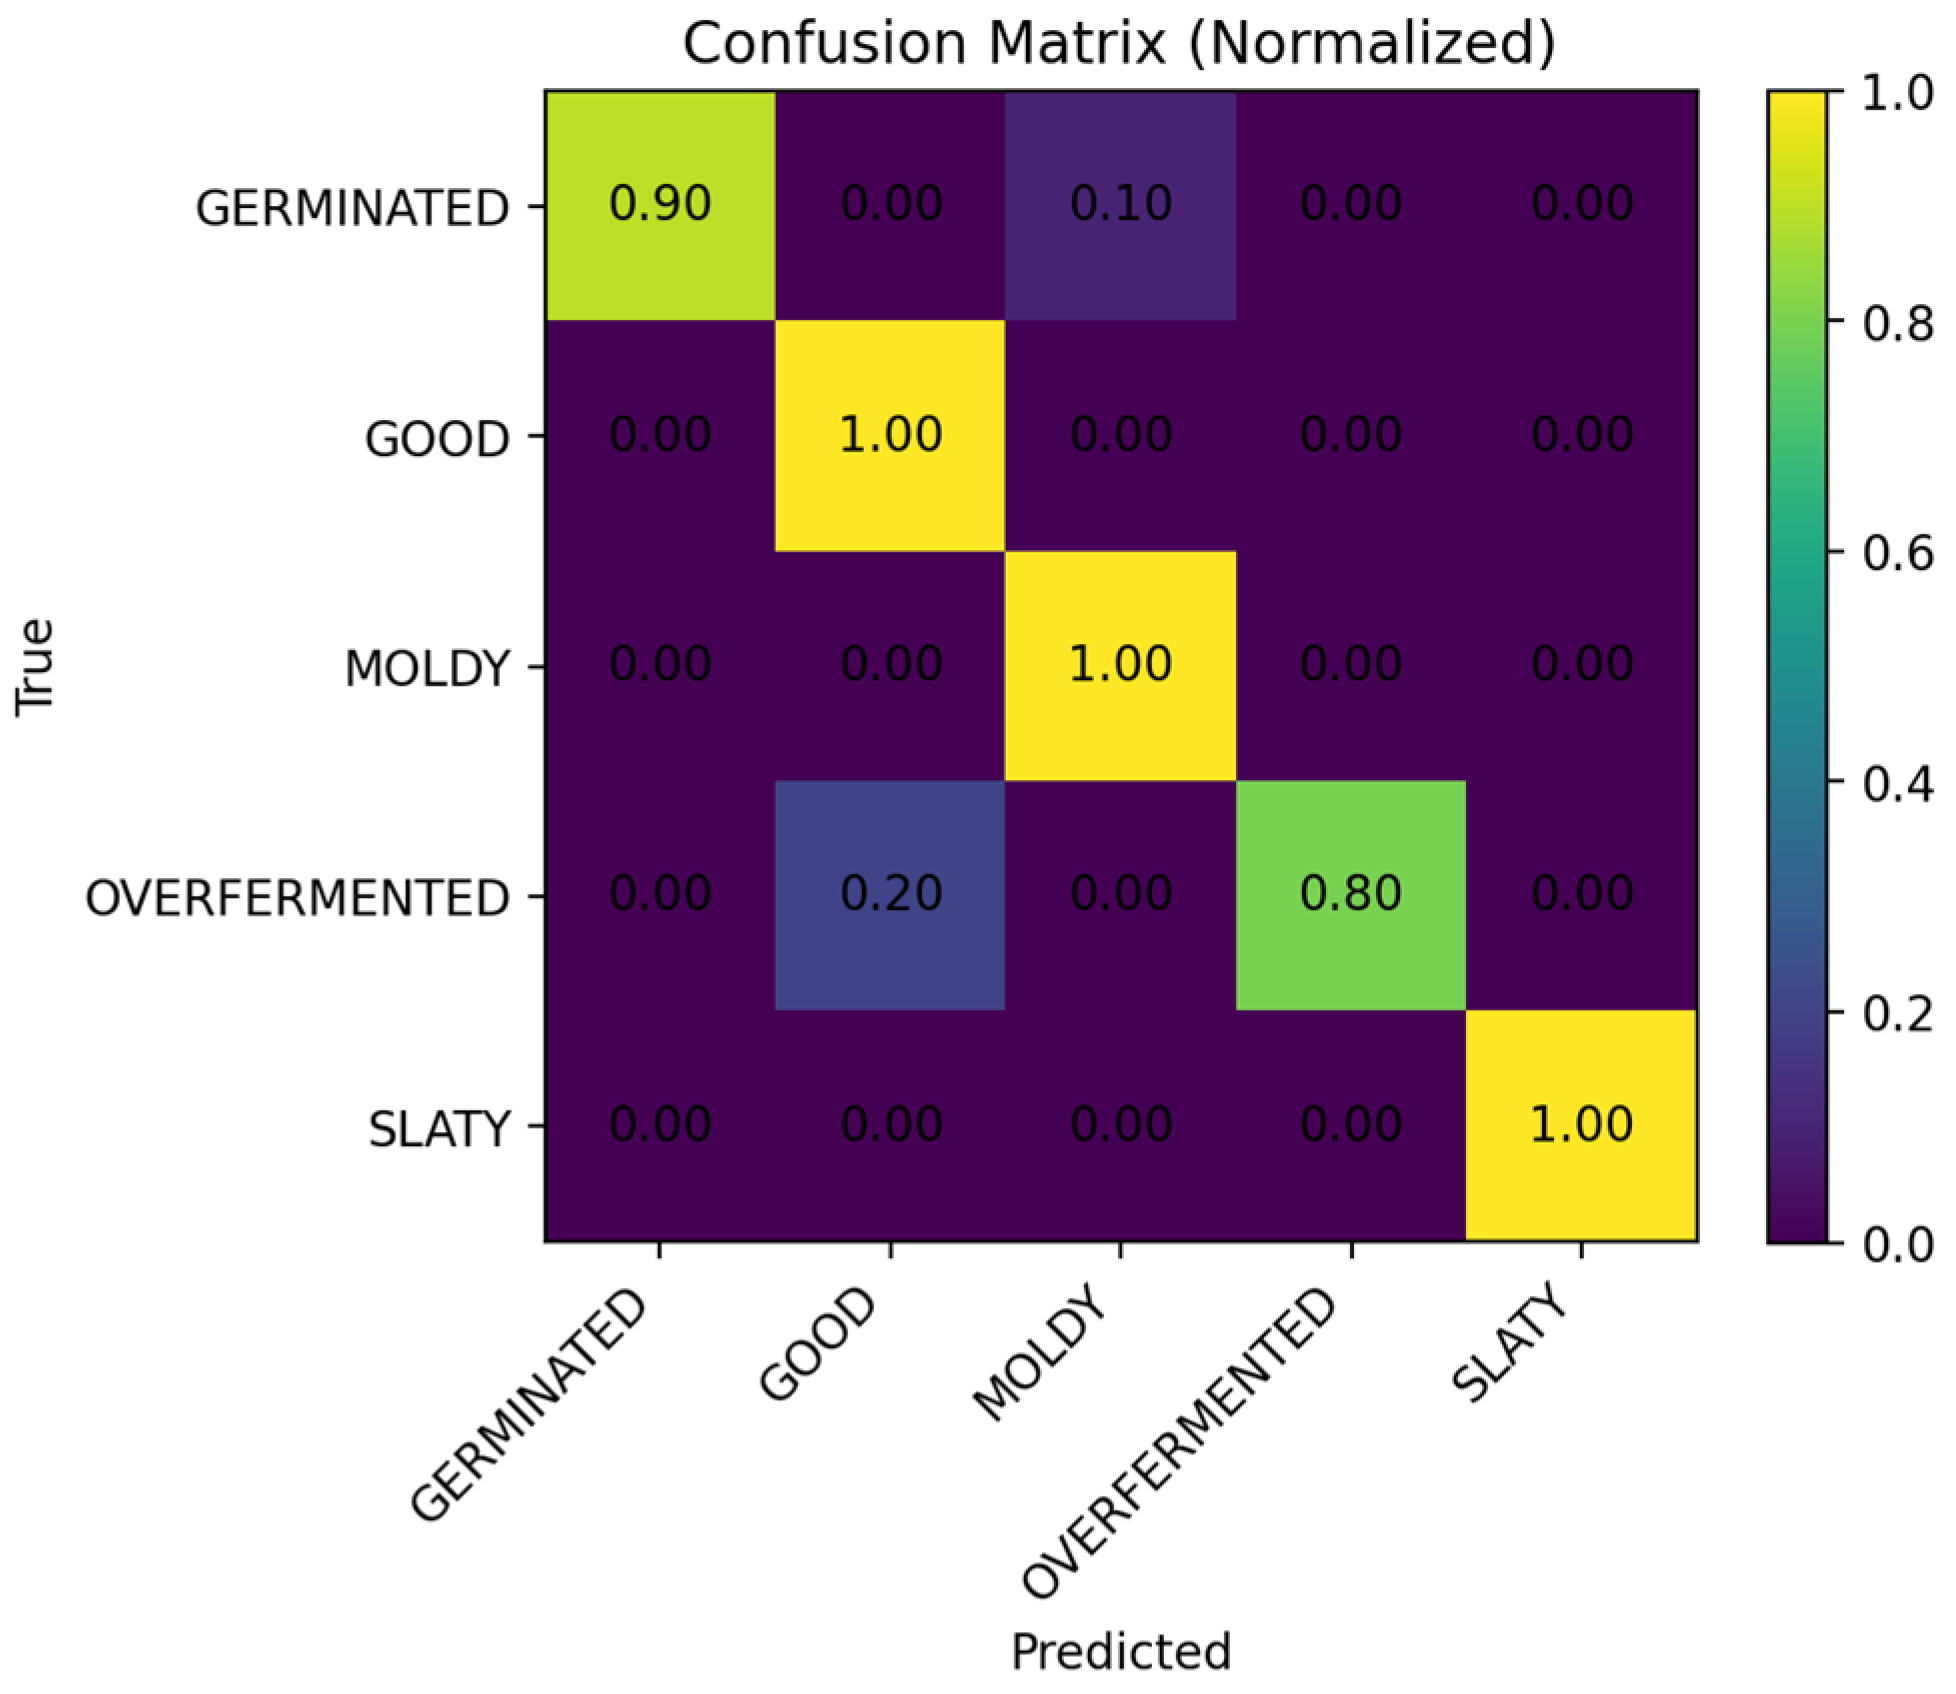
We evaluated the fine-tuned ResNet-50 on the held-out test set. Figure 4 presents the normalized confusion matrix, showing strong diagonal concentration across the five classes and limited off-diagonal errors. Misclassifications were primarily between good and fermented, and between over-fermented and neighboring classes, consistent with visual similarity in surface cues.
Figure 4.
Normalized confusion matrix.
The confusion matrix shows that the majority of test images were correctly classified. The remaining errors are concentrated in the over-fermented class, which achieved a recall of 0.80. In these cases, some samples were misclassified into neighboring categories, a result consistent with the visual similarity of surface cues such as color and texture progression. This pattern corresponds to the precision–recall asymmetry observed in Table 1.
Table 1.
Performance metrics from confusion matrix.
Class precision, recall, and F1-scores are summarized in Table 1. The overall classification accuracy reached 0.94. Macro and weighted averages closely align, reflecting the balanced distribution of classes in the test set. These results demonstrate high recognition performance for moldy, slaty, and germinated beans, while over-fermented beans show slightly lower recall (0.80), consistent with the residual off-diagonal counts observed in Figure 4.
These results indicate high recognition for Moldy, Slaty, and Germinated; Over-fermented shows slightly lower recall (0.80), matching the residual off-diagonal counts in Figure 4.
To complement the confusion matrix analysis, one-vs-rest AP was computed for each class on the test set, providing a measure of ranking quality across thresholds. The resulting Average Precision (AP) for each individual class is detailed in Table 2.
Table 2.
Per-class AP (one-vs-rest).
From these class-wise precision–recall curves, we computed the Mean Average Precision (mAP) using macro, micro, and weighted aggregation methods, as compared in Table 3.
Table 3.
Comparison of mAP metrics.
To interpret these metrics: the macro average is calculated as the arithmetic mean of the Average Precision (AP) for all classes, treating each defect type as equally significant regardless of its frequency. The micro average aggregates the contributions (true positives and false positives) of all classes globally to calculate the metric, effectively weighting each prediction equally. Finally, the weighted average is computed by taking the mean of the per-class APs, weighted by the number of true instances (support) for each class.
As shown in Table 3, the macro and weighted mAP values are identical (0.9700), which confirms the balanced nature of the test set and the model’s consistent ranking quality across all defect types.
The metrics confirm strong overall ranking performance across classes. The model achieved high accuracy (0.94), strong per-class F1-scores, and excellent one-vs-rest ranking quality (mAP = 0.97) on a balanced test split (Table 3). The residual weakness lies in the recall for over-fermented beans, which can be improved by expanding the number of over-fermented samples, applying targeted augmentations that preserve class-specific cues in borderline cases, class-specific thresholds, and calibration strategies derived from precision–recall curves to shift the operating point toward higher recall when necessary.
4. Conclusions and Recommendations
We developed a low-cost, fixed-setup imaging system combined with a fine-tuned ResNet-50 to classify five Trinitario cacao bean conditions. On a held-out, class-balanced test set, the model achieved a 94.0% accuracy, strong per-class F1-scores (e.g., Slaty = 1.00, Germinated = 0.95), and high threshold-free ranking quality, with macro mAP = 0.970, micro mAP = 0.959, and weighted mAP = 0.970. Most residual errors were associated with over-fermented beans (recall = 0.80), reflecting their visual similarity to neighboring classes.
With an expanded and diversified dataset with borderline cases, loss function adjustments or threshold tuning can be conducted to improve recall for over-fermented beans. Additional benchmarking of alternative compact backbone architectures such as Efficient Convolutional Neural Network, Mobile Neural Network Version 3, Convolutional Neural Network Next, and Vision Transformer (ViT) can be used to evaluate speed–accuracy–size trade-offs on edge hardware. Finally, the integration of the classifier into an IoT-based monitoring and sorting system can be adopted with Raspberry Pi-class edge nodes to capture images and generate predictions on-device, streaming batch statistics to a cloud dashboard and interfacing with low-cost actuators for automated post-classification sorting. Such additions enable continuous quality monitoring at the farm or cooperative scale, with auditable metrics and minimal operator burden.
Author Contributions
Conceptualization, K.A.R.B.; methodology, J.N.L.V., K.A.R.B. and G.V.M.; software, J.N.L.V.; validation, J.N.L.V., K.A.R.B. and G.V.M.; formal analysis, J.N.L.V., K.A.R.B. and G.V.M.; investigation, J.N.L.V. and K.A.R.B.; resources, G.V.M.; data curation, J.N.L.V. and K.A.R.B.; writing—original draft preparation, J.N.L.V. and K.A.R.B.; writing—review and editing, J.N.L.V., K.A.R.B. and G.V.M.; visualization, K.A.R.B.; supervision, G.V.M.; project administration, J.N.L.V.; funding acquisition, G.V.M. All authors have read and agreed to the published version of the manuscript.
Funding
This research received no external funding.
Institutional Review Board Statement
Not applicable.
Informed Consent Statement
Not applicable.
Data Availability Statement
Data is contained within the article.
Conflicts of Interest
The authors declare no conflict of interest.
References
- Department of Agriculture. Philippine Cacao Industry Roadmap 2021–2025; Department of Agriculture: Quezon City, Philippines, 2022. Available online: https://www.da.gov.ph/wp-content/uploads/2023/05/Philippine-Cacao-Industry-Roadmap.pdf (accessed on 6 March 2026).
- Bureau of Agriculture and Fisheries Product Standards (BAFS). Code of Practice for Philippine Cacao Beans. PNS/BAFPS 104:2011; Department of Agriculture—BAFS: Taguig City, Philippines, 2011. Available online: https://www.bps.dti.gov.ph (accessed on 6 March 2026).
- Figueroa, V.V. Reducing Human Error for Manual Visual Inspection. PDA Letter, 26 October 2023. Available online: https://www.pda.org/pda-letter-portal/home/full-article/reducing-human-error-for-manual-visual-inspection (accessed on 6 March 2026).
- Hortinela, C.C.; Tupas, K.J.R. Classification of Cacao Beans Based on Their External Physical Features Using Convolutional Neural Network. In Proceedings of the 2022 IEEE Region 10 Symposium (TENSYMP), Mumbai, India, 1–3 July 2022; pp. 1–5. [Google Scholar] [CrossRef] [Scilit]
- Oraño, J.F.V.; Padao, F.R.F.; Malangsa, R.D. Analyzing the Accuracy of KNN-Based Cacao Bean Grading System. In Proceedings of the 2019 IEEE 11th International Conference on Humanoid, Nanotechnology, Information Technology, Communication and Control, Environment, and Management (HNICEM), Laoag, Philippines, 29–30 November 2019; pp. 1–5. [Google Scholar] [CrossRef] [Scilit]
- Brosas, D.G.; Villafuerte, R.S.; Obediencia, D.C. Adaptive Neuro-Fuzzy Approach for Cacao Bean Grading Classification Process. In Proceedings of the 2020 Third International Conference on Vocational Education and Electrical Engineering (ICVEE), Surabaya, Indonesia, 3–4 October 2020; pp. 1–5. [Google Scholar] [CrossRef] [Scilit]
- He, K.; Zhang, X.; Ren, S.; Sun, J. Deep Residual Learning for Image Recognition. In Proceedings of the IEEE Conference on Computer Vision and Pattern Recognition (CVPR), Las Vegas, NV, USA, 27–30 June 2016; pp. 770–778. [Google Scholar] [CrossRef] [Scilit]
- Wasike, B. How to Build a Deep Learning Model with Keras and ResNet-50. Medium, 26 January 2023. Available online: https://medium.com/@bravinwasike18/building-a-deep-learning-model-with-keras-and-resnet-50-9dd6f4eb3351 (accessed on 6 March 2026).
- Potrimba, P. What Is ResNet-50? Roboflow Blog, 13 March 2024. Available online: https://blog.roboflow.com/what-is-resnet-50/ (accessed on 6 March 2026).
- Hrisko, J. Image Processing with Raspberry Pi and Python. Maker Portal, 23 April 2019. Available online: https://makersportal.com/blog/2019/4/21/image-processing-using-raspberry-pi-and-python (accessed on 6 March 2026).
- Duong, B.T. Optimizing Image Input: Preprocessing Steps Before Neural Networks for Computer Vision. Medium, 17 November 2023. Available online: https://baotramduong.medium.com/image-preprocessing-for-neural-network-3e81a93ced36 (accessed on 6 March 2026).
- Shepard, A.; Naheed, N. Application of Data Transformation Techniques and Train-Test Split. In Proceedings of the 2021 International Conference on Computational Science and Computational Intelligence (CSCI), Las Vegas, NV, USA, 15–17 December 2021; pp. 58–63. [Google Scholar] [CrossRef] [Scilit]
- Mujtaba, H. What Is ResNet or Residual Network|How ResNet Helps? Great Learning Blog. 2020. Available online: https://www.mygreatlearning.com/blog/resnet/ (accessed on 6 March 2026).
- Aziz, H. ResNet-50 Implementation. AI Mind (Medium), 23 July 2023. Available online: https://pub.aimind.so/resnet-50-implementation-8bde36f2301a (accessed on 6 March 2026).



Disclaimer/Publisher’s Note: The statements, opinions and data contained in all publications are solely those of the individual author(s) and contributor(s) and not of MDPI and/or the editor(s). MDPI and/or the editor(s) disclaim responsibility for any injury to people or property resulting from any ideas, methods, instructions or products referred to in the content. |
© 2026 by the authors. Licensee MDPI, Basel, Switzerland. This article is an open access article distributed under the terms and conditions of the Creative Commons Attribution (CC BY) license.