


Abstract
Milkfish (Chanos chanos), a widely consumed fish in the Philippines, is highly perishable, and conventional freshness assessments based on physical and olfactory inspection are often subjective and unreliable. To address this, we introduce an electronic nose system for the accurate classification of milkfish freshness based on spoilage-related gas emissions, namely methane, ammonia, hydrogen sulfide, and trimethylamine. The system integrates the MQ-series sensors and Taguchi gas sensor with Arduino Nano and Raspberry Pi 5 for data acquisition and signal processing. The k-nearest neighbor algorithm was used for classification, and its performance was evaluated using a confusion matrix. The data was gathered from 100 samples, consisting of 50 fresh and 50 spoiled fish. The evaluation demonstrated a peak classification accuracy of 92% for k-values between 1 and 15, confirming the system’s reliability. These findings indicate the system’s potential as a practical, low-cost, and efficient tool for enhancing consumer safety and quality assurance in the fish supply chain.
1. Introduction
The Philippines is a major producer of milkfish (Chanos chanos), which is a staple food for many Filipino families due to its affordability and availability as a food source. However, fish is a highly perishable food product that requires proper handling and storage to maintain its quality and freshness [1]. Spoilage in fish begins immediately after death, and factors such as high ambient temperatures in tropical climates like the Philippines can accelerate this process [2].
Given these challenges, there is a need for a reliable and accessible method for determining fish freshness to ensure consumer safety. Traditional assessment methods, which rely on physical appearance and smell, can be deceptive and unreliable. These issues are worsened by unsafe practices such as the use of formalin to illegally extend the shelf life of fish, which poses serious health risks, including cancer [3,4]. Furthermore, vendors of local markets dye the gills [5] and remove the eyes [6] to hide the freshness indicators of the fish. The consumption of spoiled fish can also lead to foodborne illnesses like histamine poisoning [7].
To address these problems, we developed a technological solution using an electronic nose, a widely used technology in determining spoilage or ripeness of other foods, including fruits, such as cantaloupe [8] and pomelos [9], and meats [10], or even to detect ingredients used in dishes [11]. The electronic nose was paired with the k-nearest neighbors (k-NN) algorithm. However, a common issue with k-NN is determining a proper k-value. Low k-values produce noise in the data, while larger values can be computationally expensive [12,13]. To address this issue, the accuracy of multiple k-values is checked to determine the most optimal k-value [14].
Therefore, we developed an electronic nose to capture the gas concentrations emitted by the milkfish samples as they spoiled over time. The collected data was then fed into a k-NN model to classify the fish’s freshness. The reliability of the final proposed model was then evaluated using a confusion matrix.
2. Methodology
2.1. Conceptual Framework
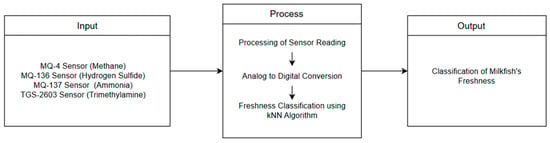
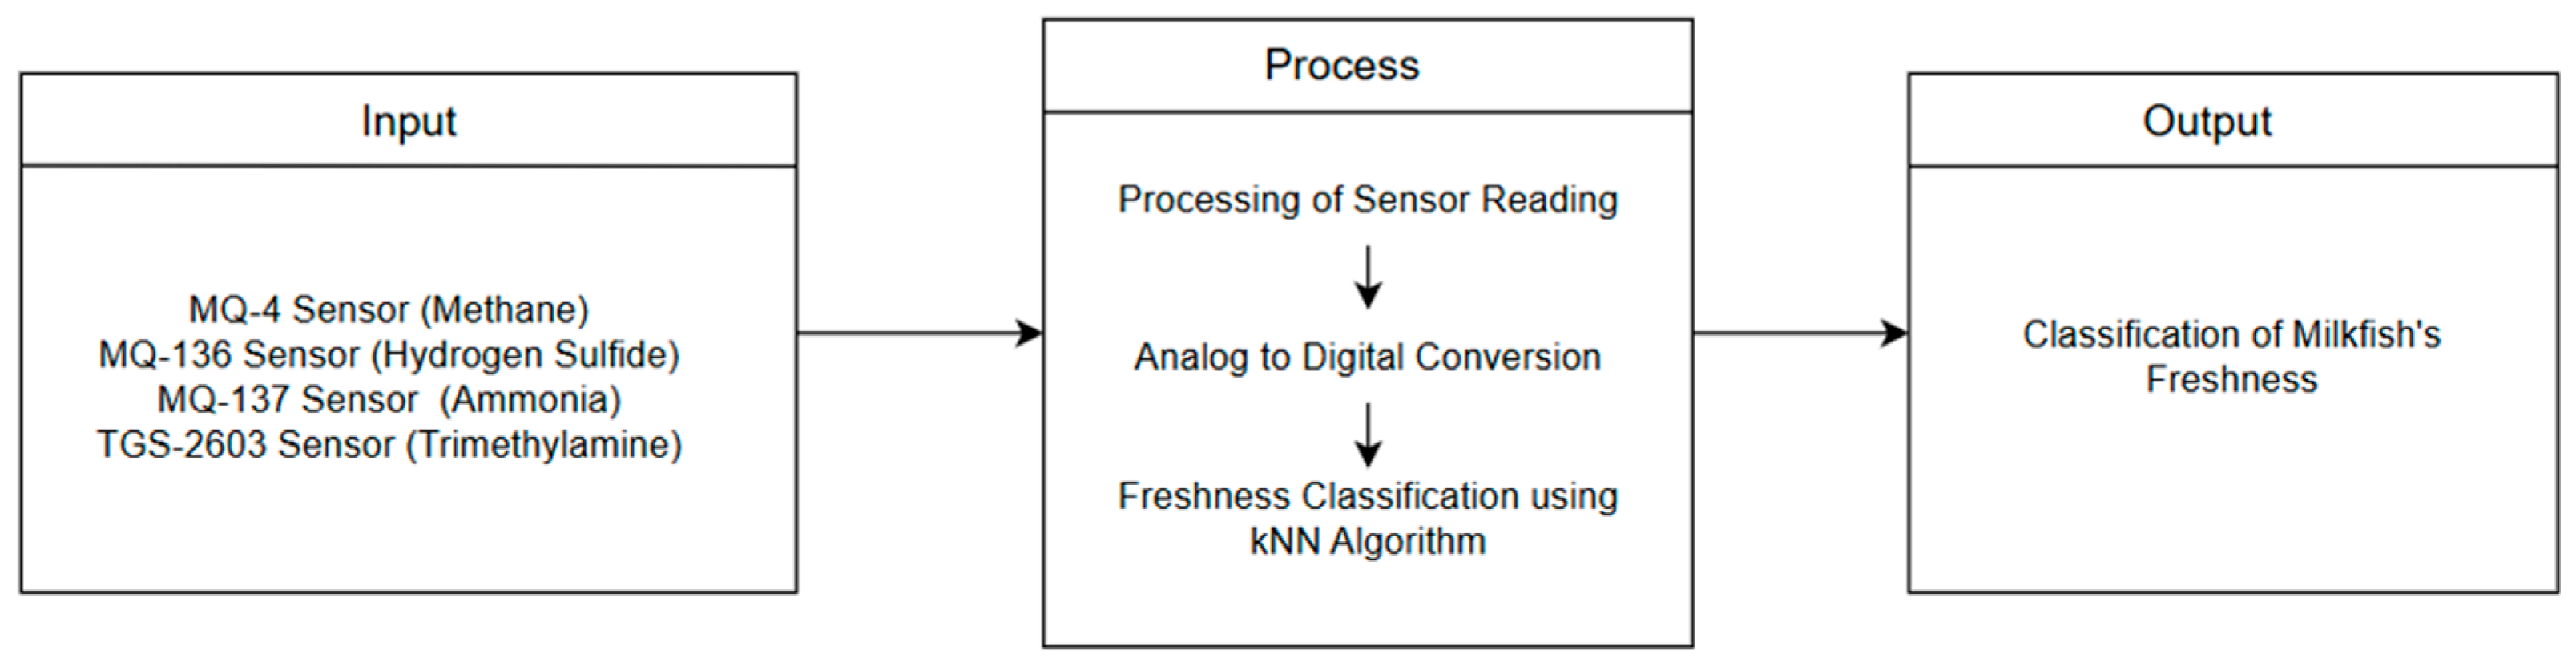
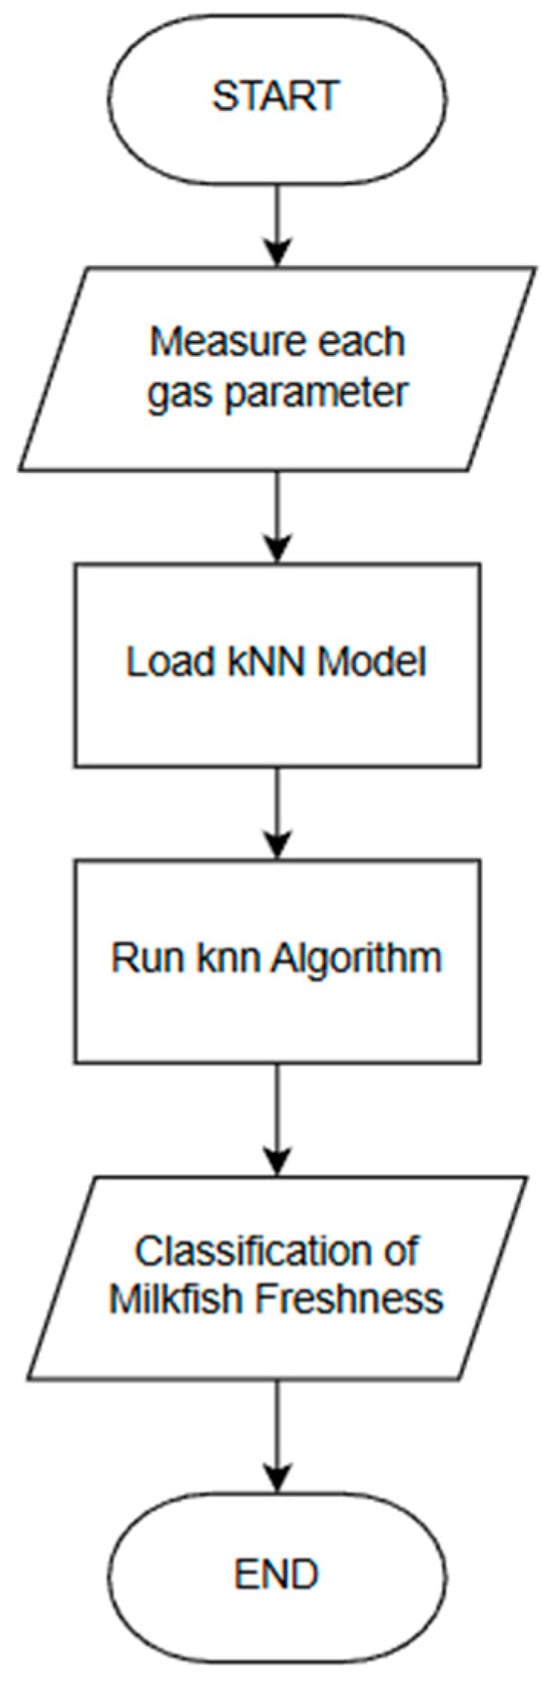
Figure 1 shows the conceptual framework for the classification of milkfish freshness. We designed an electronic nose that uses an array of gas sensors to determine milkfish freshness. The sample milkfish were collected from a supplier of seafoods, and the data was collected from these milkfish. The process begins with the collection of data, which serves as the k-nearest neighbors (k-NN) classification model. The gas sensors, specifically the MQ-4, MQ-136, MQ-137, and Taguchi gas sensor (TGS)-2603, are utilized to detect selected indicators for spoilage. These indicators are methane, hydrogen sulfide, ammonia, and trimethylamine respectively. The analog signals input from this sensor array are converted into digital signals to be interpreted by the model. The preprocessed data is fed into the k-NN algorithm, which processes the data by comparing it with the closest data sets from the established baseline using the assigned k-value of 5. The program concludes when the model has successfully classified the freshness of the milkfish and outputs the results on the LCD module.
Figure 1.
Conceptual framework for the classification of milkfish freshness.
2.2. Hardware Block Diagram
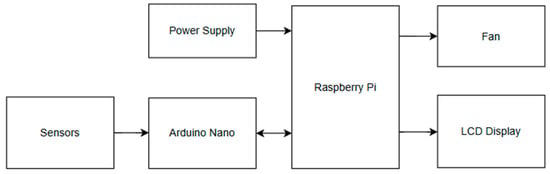
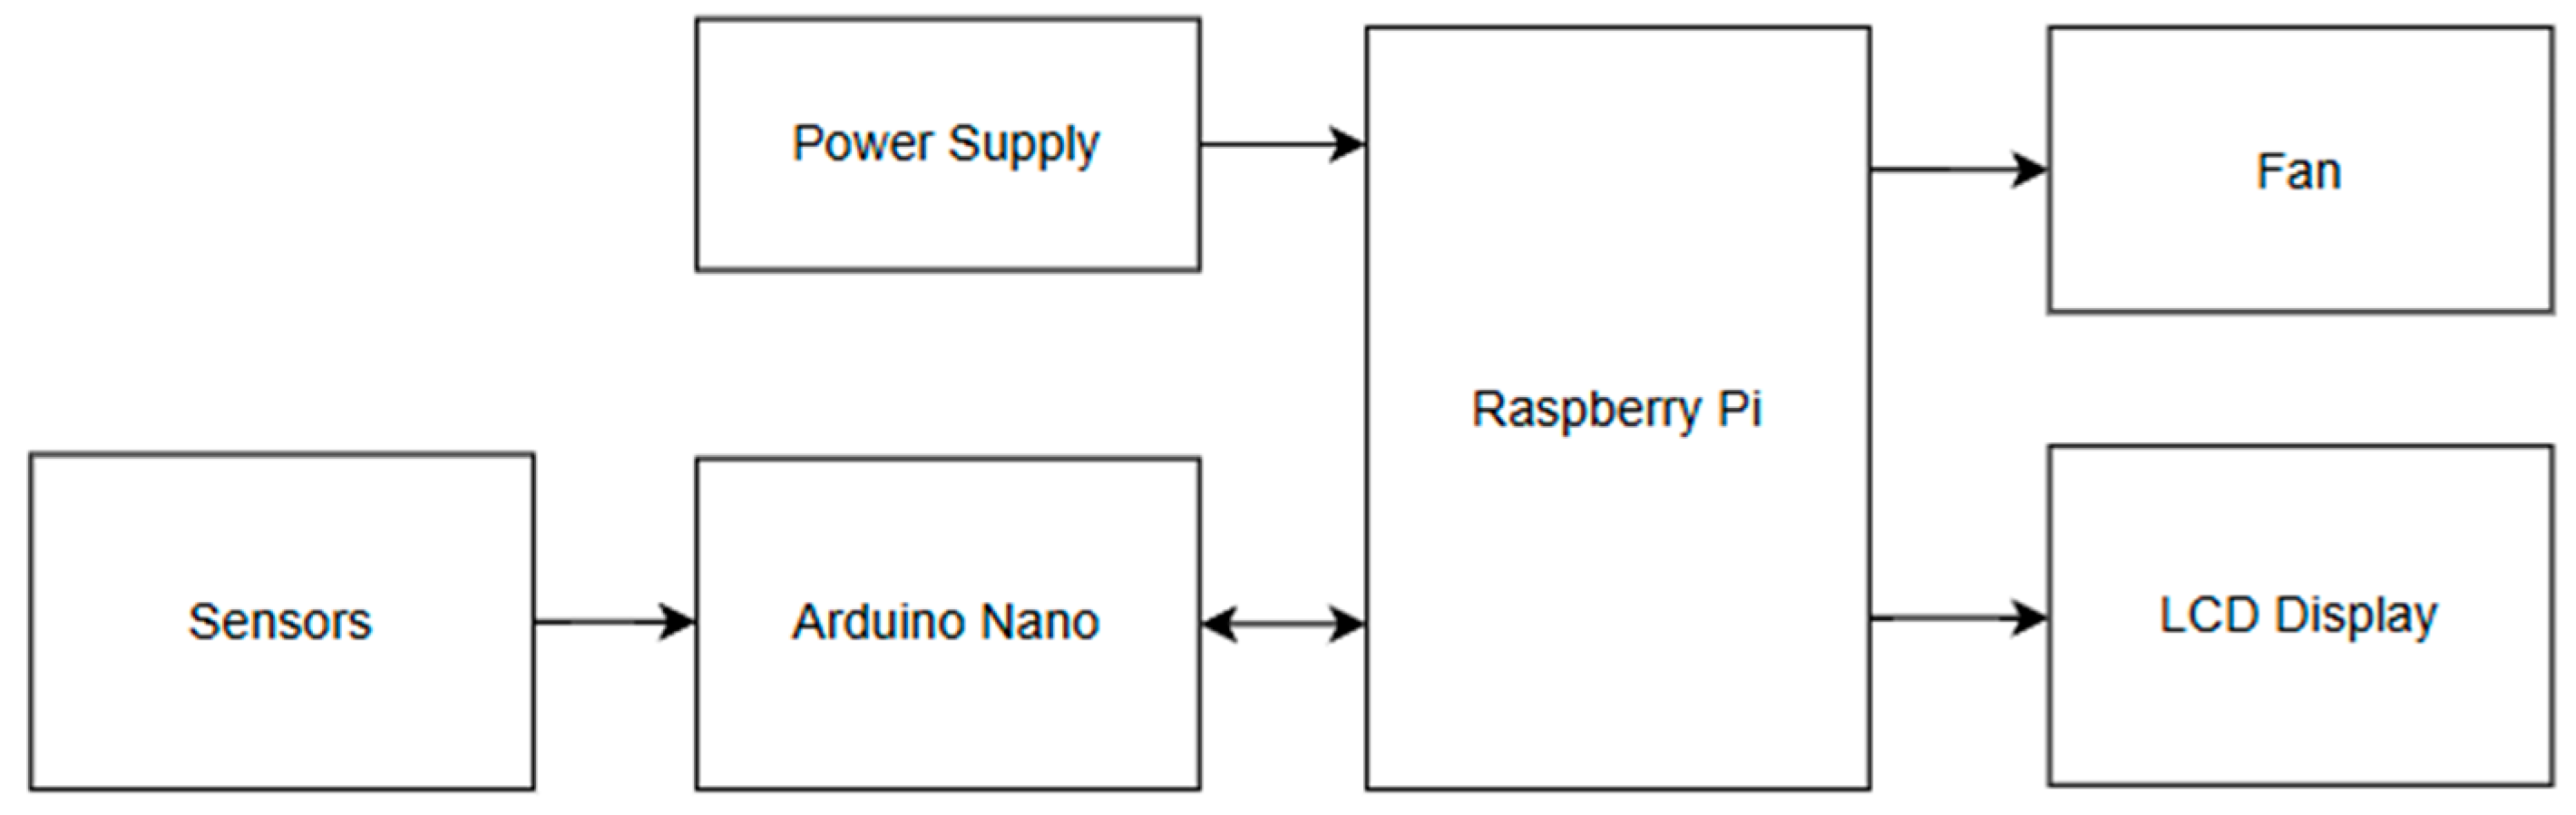
Figure 2 shows the hardware block diagram and the components of the electronic nose. The system comprises Raspberry Pi 5 as the microcontroller to process sensor data and run the algorithm, all powered by a dedicated power supply. Four gas sensors are used to detect the specific gases indicative of milkfish spoilage. To enable the Raspberry Pi to interpret this information, Arduino Nano is used as an analog-to-digital converter that converts the analog signals from the sensors into a digital format. Once the data is processed, the final freshness classification is displayed on an LCD screen. To complete the cycle and prepare for a new sample, a fan is used to funnel all the gases out of the chamber once the classification process is complete.
Figure 2.
Hardware block diagram of the electronic nose system.
2.3. Software
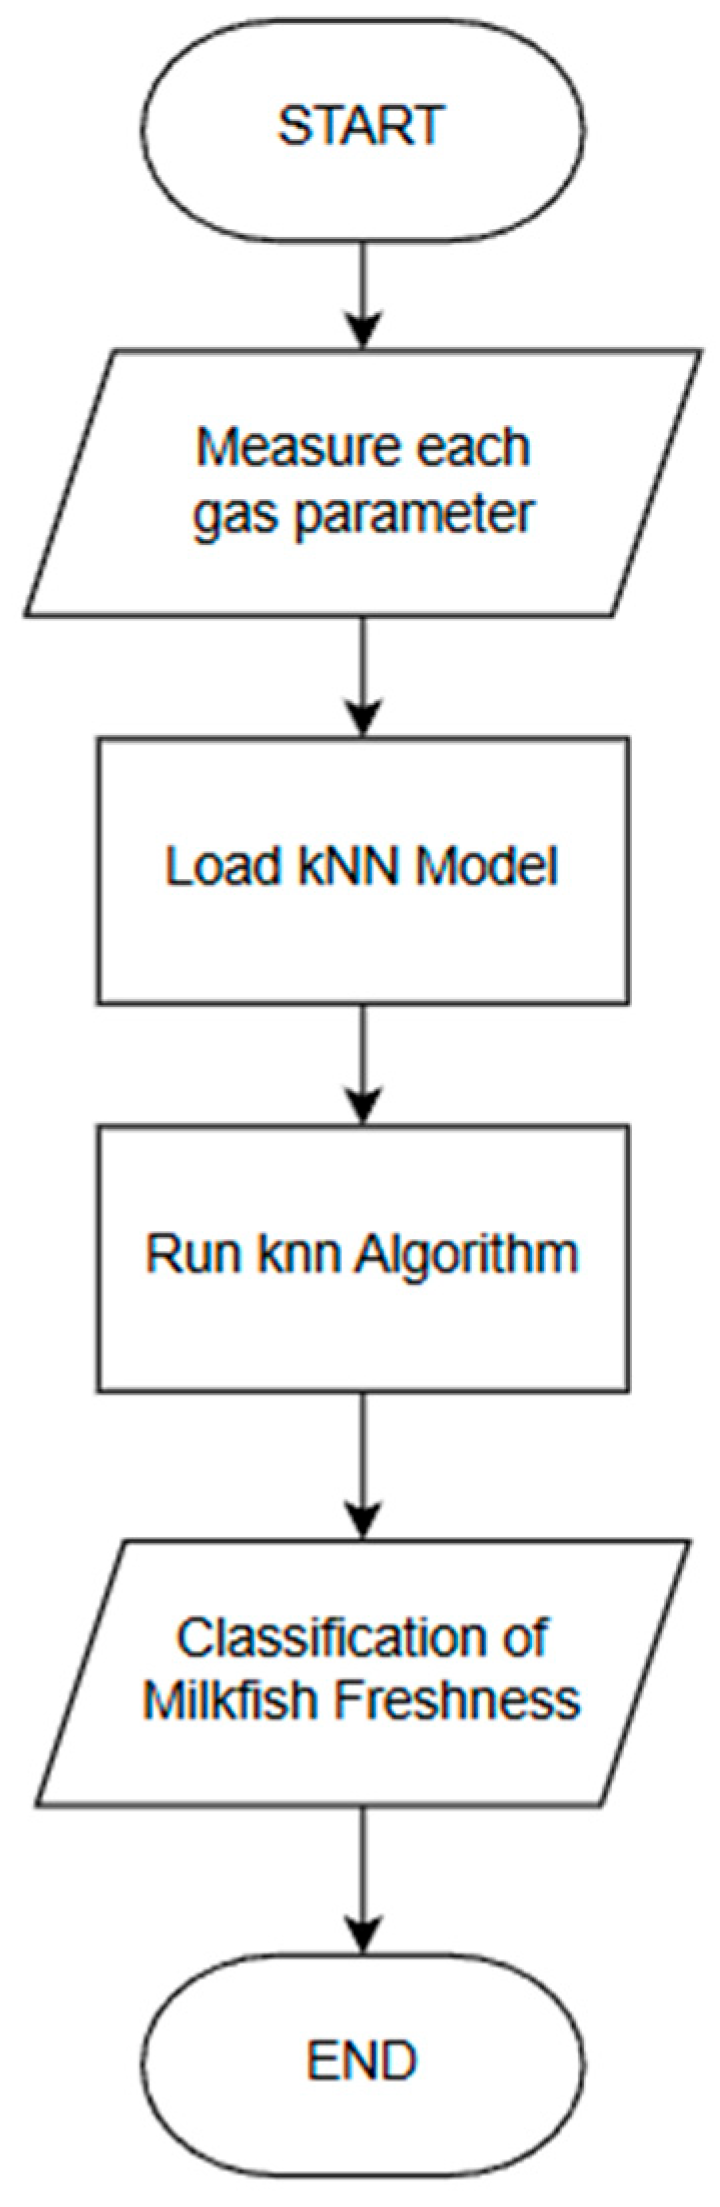
Figure 3 shows the system process. An array of gas sensors measures the concentration of their respective gases being emitted by the milkfish. These analog readings represent the chemical fingerprint of the sample at that moment. This raw, analog data is then converted into a digital format by the Arduino Nano. Once the sensor data is collected and digitized, Raspberry Pi 5 loads the pre-trained k-NN model. This model was trained on a dataset of 100 labeled milkfish samples, and it has learned the distinct gas measurements that correspond to fresh and spoiled fish. The model stores the data, including the optimal k-value of 5 for the classification of the new data. The newly measured gas concentration values of the sample are fed into the k-NN model.
Figure 3.
System process.
The algorithm then executes its classification logic. It calculates the Euclidean distance between the new sample’s data point and the 5 closest data points in its training set. It then checks for the majority label among these 5 nearest neighbors. If more of the neighbors are labelled as fresh, the new sample is classified as fresh, and vice versa. Depending on the outcome of the k-NN algorithm’s majority, the final classification is determined. The system outputs a result, which is either fresh or spoiled. The classification is then displayed on the LCD screen, providing the user with an assessment of the milkfish’s freshness. The process then ends, and the fan removes the leftover gas from the chamber to prepare for the next sample.
2.4. Experimental Setup
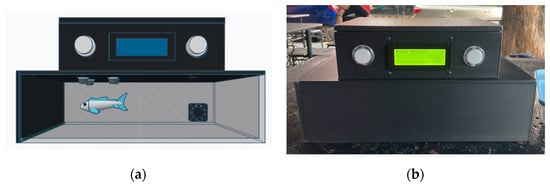
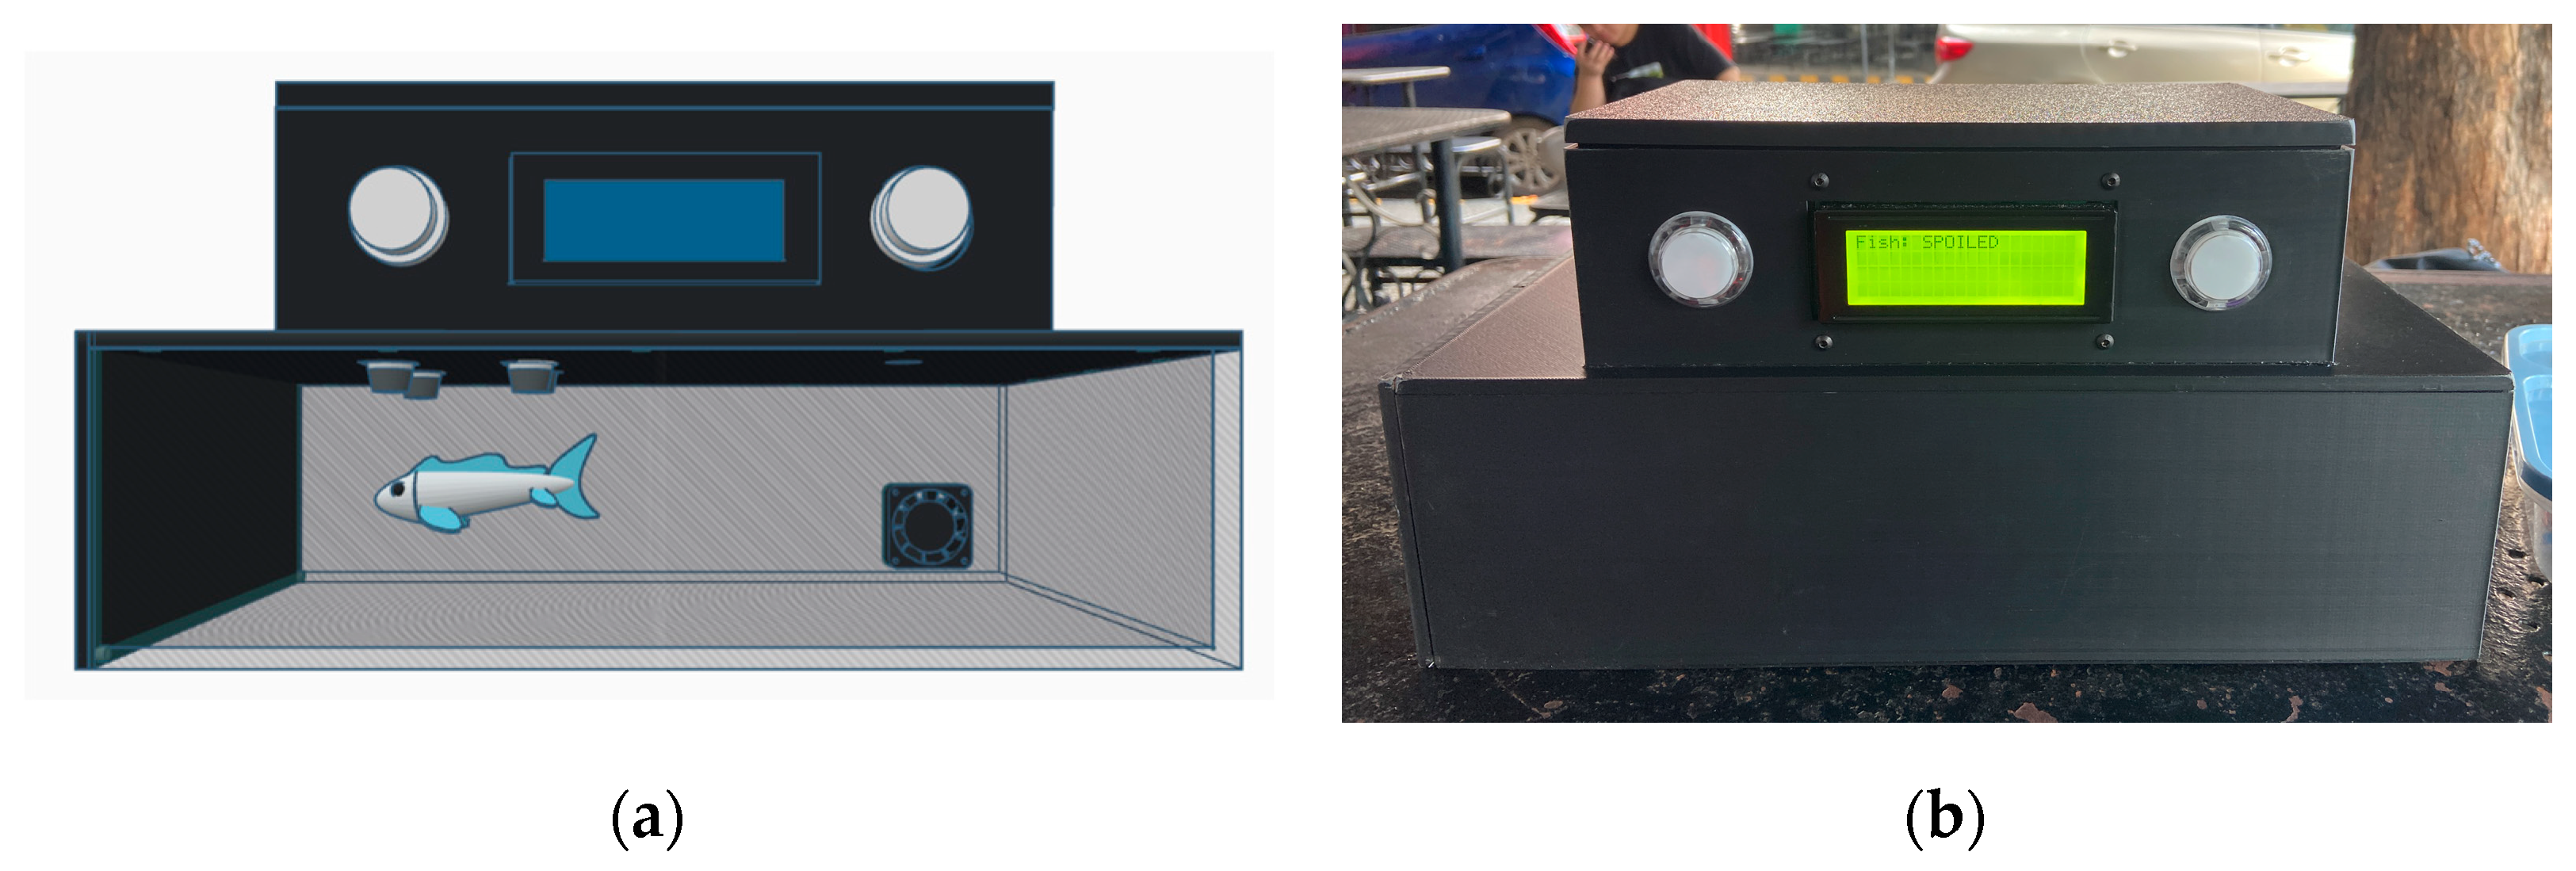
The system hardware is housed in a two-chamber enclosure. The bottom chamber contains the milkfish sample and the gas sensor array, designed to contain the emitted gases for accurate measurement. The top chamber houses the electronic components, including Raspberry Pi 5, Arduino Nano, the LCD screen, and buttons. Figure 4 shows the testing setup. The baseline of the gases is determined in a neutral or clean air environment. The fish is placed in the bottom chamber, and the door is closed to prevent the gases from escaping. After the gases are measured, the fish is removed, and the fan is turned on to remove gas residue.
Figure 4.
Experiment setup: (a) System diagram; (b) Actual experimental setup.
3. Results and Discussion
The dataset comprises measurements collected by researchers from 100 milkfish samples—50 fresh and 50 spoiled. The fish stored in a controlled environment for less than 10-h were classified as fresh, while those stored in a controlled environment for longer durations were considered spoiled. Each sample was recorded over a 10-s interval, and the final reading was obtained by averaging the values after subtracting the baseline from the fish measurements. These 100 samples were used for training. An additional 50 samples were collected, and they were evenly divided into validation and testing sets. The testing set included 13 fresh and 12 spoiled samples, while the validation set comprised 12 fresh and 13 spoiled samples.
3.1. k-Value Determination
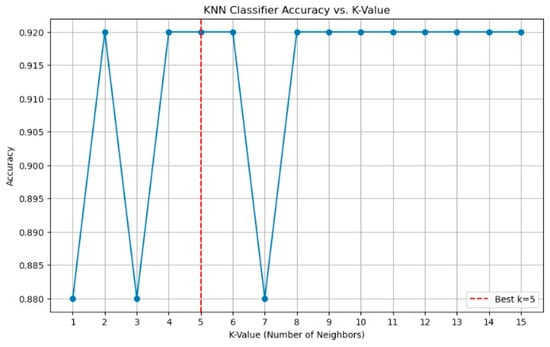
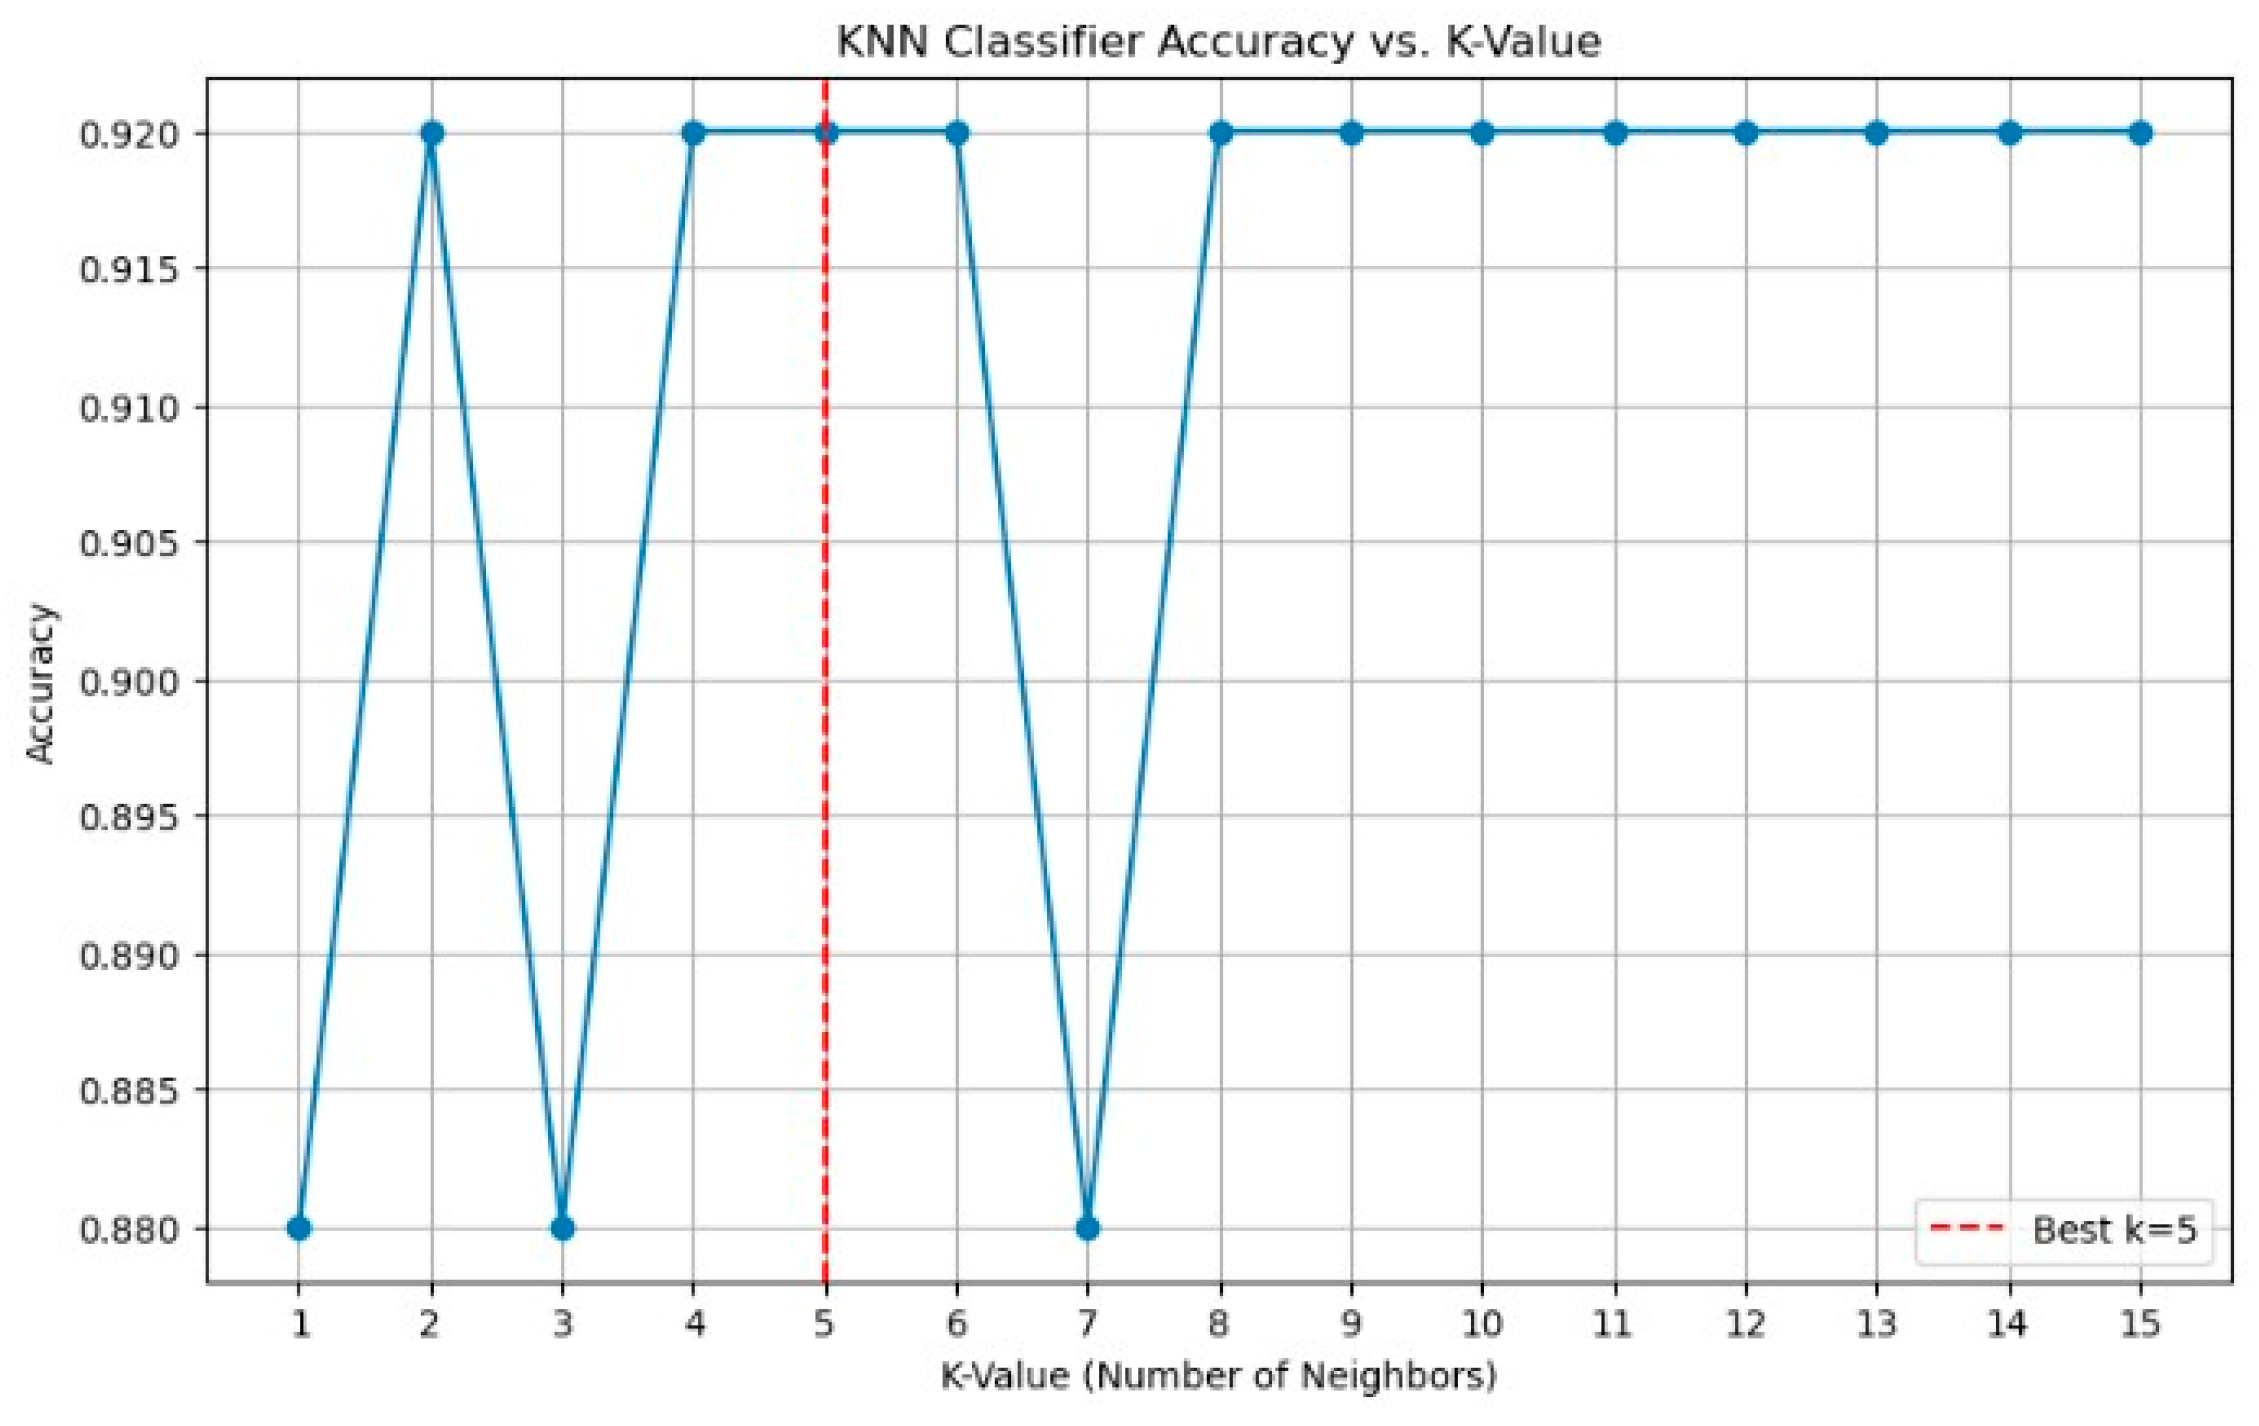
Figure 5 shows the validation accuracy of the different k-values from 1 to 15. The value of 5 was chosen as the k-value as it is the first odd value that resulted in the highest accuracy. An odd-number k-value is optimal for binary classification to prevent ties.
Figure 5.
Validation accuracy of k-values.
3.2. Statistical Treatment
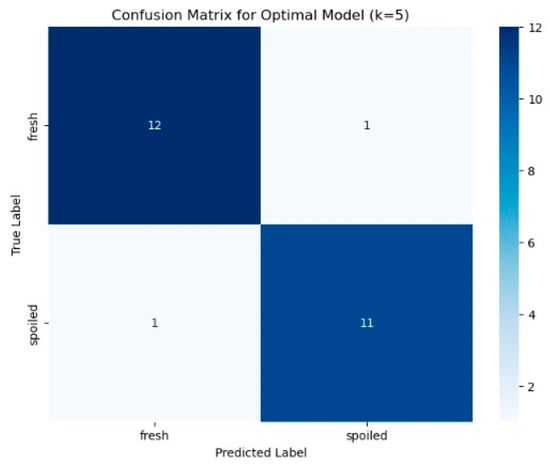
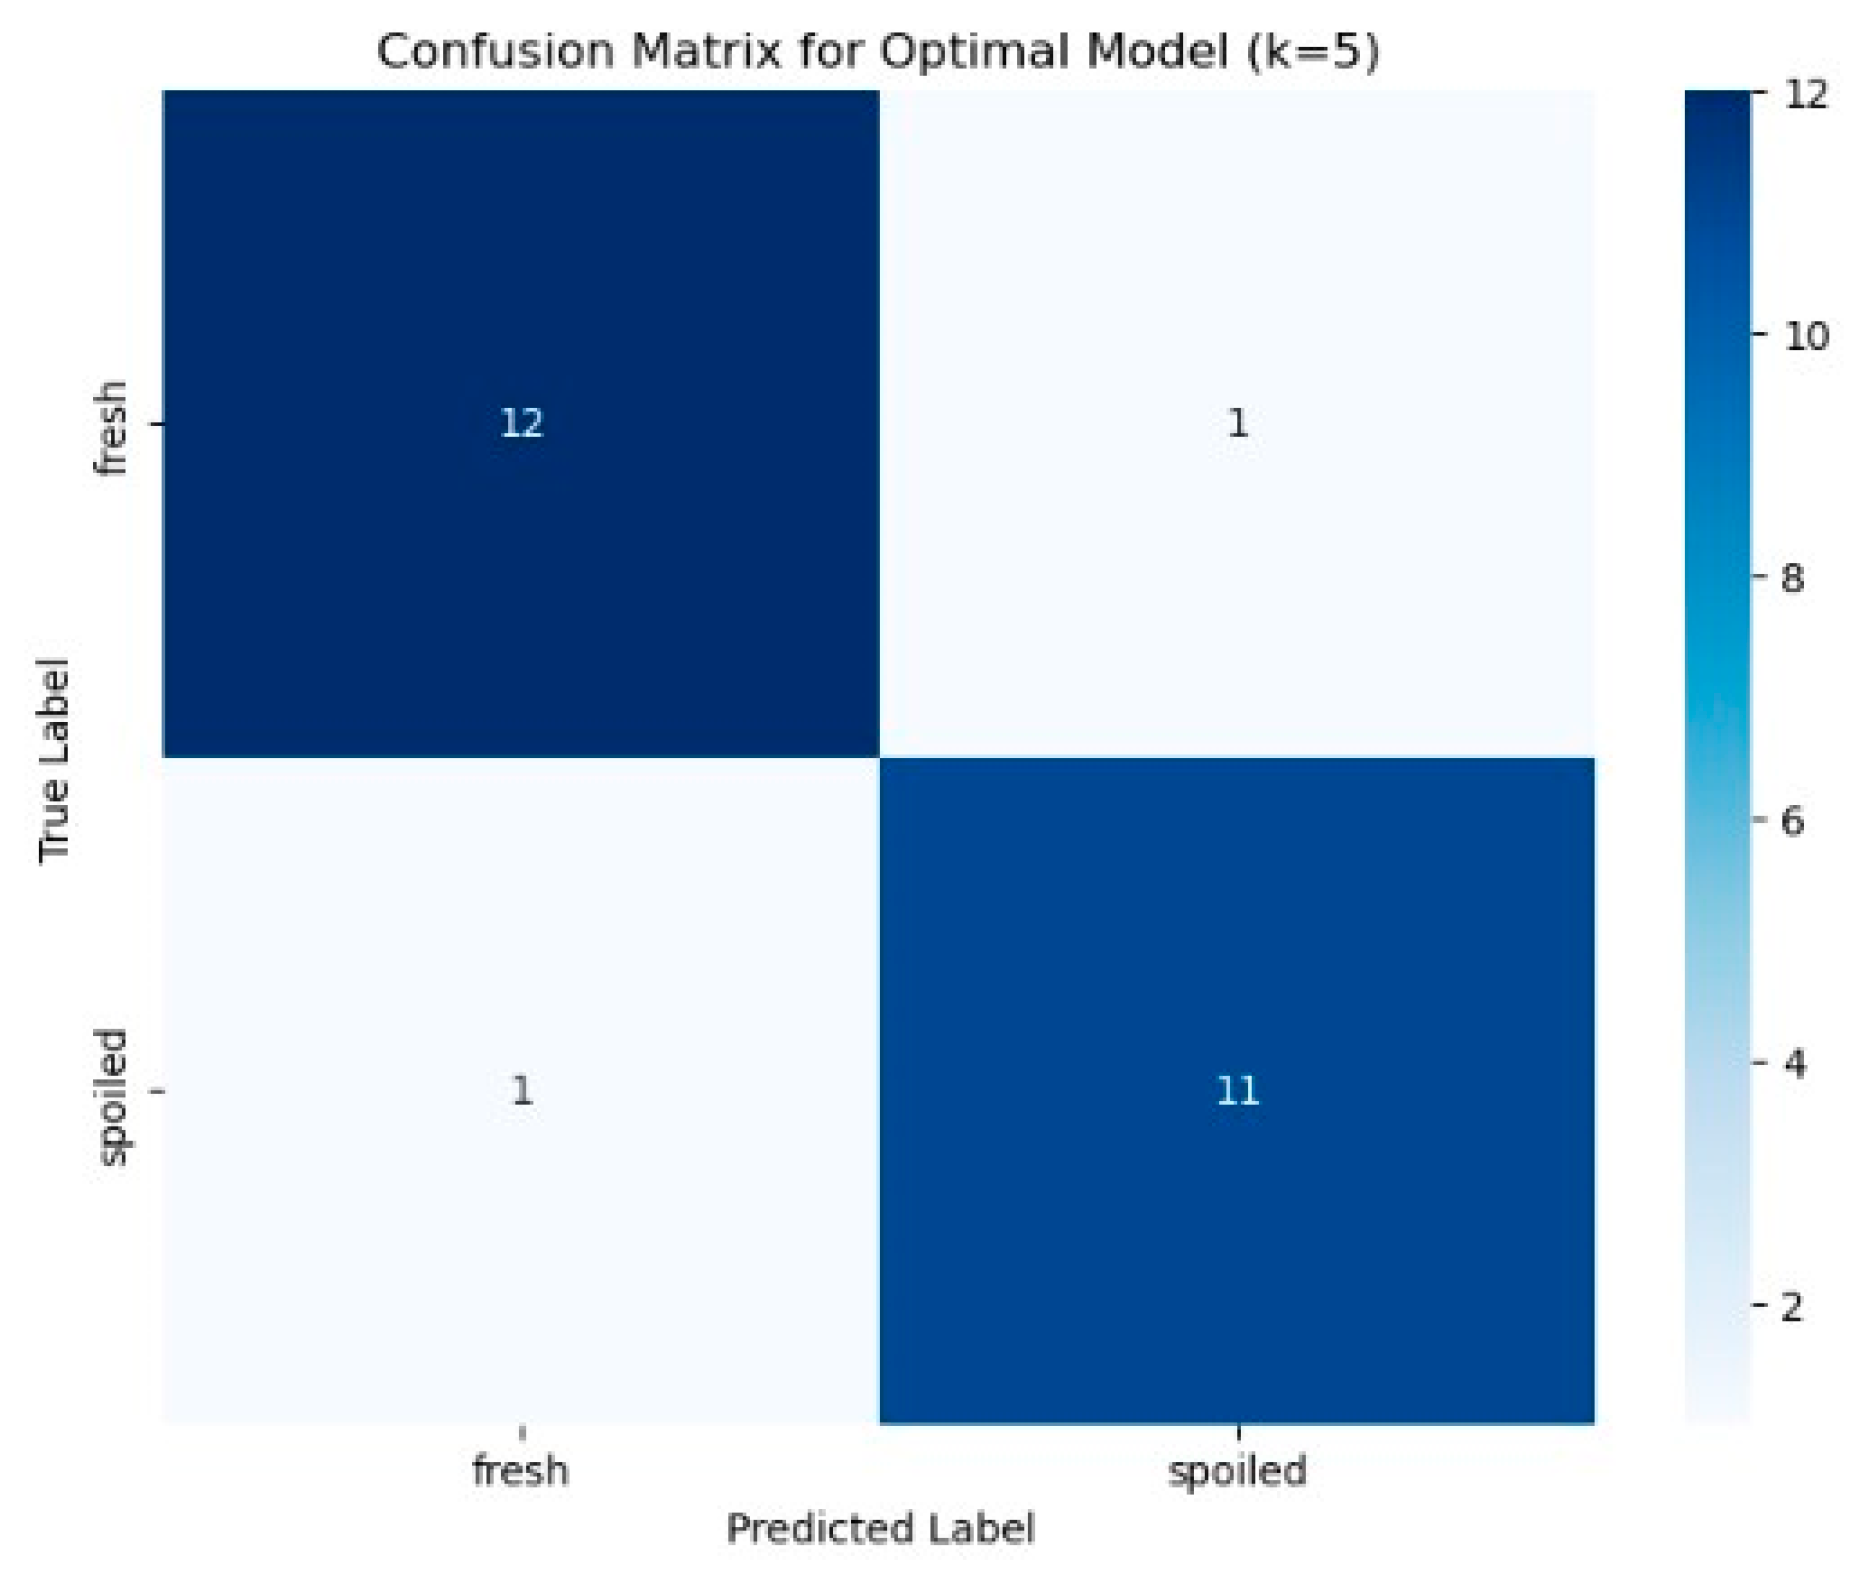
Figure 6 shows the results of the model during testing. It shows the performance of the model in classifying 25 samples—12 fresh and 13 spoiled. The model accurately classified all spoiled samples, but it also misclassified a fresh sample as spoiled, achieving an accuracy of 96% during testing, which is 4% higher than the validation accuracy. The sensitivity, which determines the effectiveness of the model in classifying fresh samples (true positive), was 91.7%. The specificity, which determines how effective the model classifying spoiled samples (true negative), was 100%.
Figure 6.
Confusion matrix of testing results.
Sensitivity, also referred to as recall, is used to measure a model’s accuracy in correctly identifying true positive cases. It is the ratio of true positive predictions to the total number of actual positive cases (Equation (1)). A high sensitivity score indicates that the model is effective at detecting positive cases.
Specificity is used to measure a model’s accuracy in identifying true negatives. It is the ratio of true negative predictions to the total number of actual negative cases. A high specificity indicates that the model is effective at identifying negative cases.
Accuracy is used to measure the correctness of the model’s overall prediction. It is the ratio of all correct predictions (both true positives and true negatives) to the total number of predictions.
where:
- True positive (TP): the model predicted that the milkfish was fresh, and the prediction was correct.
- True negative (TN): the model predicted that the milkfish was spoiled, and the prediction was correct.
- False negative (FN): the model predicted that the milkfish was spoiled, and but the prediction was incorrect
- False positive (FP): the model predicted that the milkfish was fresh, and the prediction was incorrect.
4. Conclusions
We developed and validated an electronic nose system for determining the freshness of milkfish. By integrating MQ-series and TGS gas sensors with a Raspberry Pi, an Arduino Nano, and the k-NN algorithm, the system achieved a classification accuracy of 96% on a dataset of 100 fish samples. The system is a low-cost, objective, and efficient alternative to traditional, subjective methods, establishing a reliable tool for enhancing quality assurance and consumer safety within the local fish supply chain. Despite the promising results, the environmental variables, such as ambient temperature and humidity, need to be controlled as they affect the consistency of the readings in different conditions. The data needs to be expanded to encompass the different stages of spoilage. Although the dataset was balanced in this study, it was limited to 100 samples, which may not encompass the different spoilage levels of the fish, despite the fish being left to spoil in a controlled environment.
Author Contributions
Conceptualization, J.P.D.F., J.L. and M.V.C.C.; methodology, J.P.D.F. and J.L.; software, J.P.D.F. and J.L.; validation, M.V.C.C.; formal analysis, J.P.D.F. and J.L.; investigation, J.P.D.F. and J.L.; resources, J.P.D.F. and J.L.; data curation, J.P.D.F. and J.L.; writing—original draft preparation, J.P.D.F. and J.L.; writing—review and editing, J.P.D.F., J.L. and M.V.C.C.; visualization, J.P.D.F. and J.L.; supervision, M.V.C.C.; project administration, M.V.C.C.; funding acquisition, J.P.D.F. and J.L. All authors have read and agreed to the published version of the manuscript.
Funding
This research received no external funding.
Institutional Review Board Statement
Not applicable.
Informed Consent Statement
Not applicable.
Data Availability Statement
The dataset generated during the current study is not publicly available, but it is available from the corresponding author upon reasonable request.
Conflicts of Interest
The authors declare no conflict of interest.
References
- Tavares, J.; Martins, A.; Fidalgo, L.G.; Lima, V.; Amaral, R.A.; Pinto, C.A.; Silva, A.M.; Saraiva, J.A. Fresh Fish Degradation and Advances in Preservation Using Physical Emerging Technologies. Foods 2021, 10, 780. [Google Scholar] [CrossRef] [Scilit] [PubMed]
- Humaid, S.A.; Jamal, M.T. The Effect of Storage Temperature (4 °C, 15 °C and 25 °C) on The Shelf Life of Whole Marine Fish (Rastrelliger Kanagurta). IOSR J. Environ. Sci. Toxicol. Food Technol. 2014, 8, 46–51. [Google Scholar] [CrossRef] [Scilit]
- Cruz, J.C.D.; Garcia, R.G.; Collado, A.N.M.; Jovero, R.J.S.; Macalangcom, R.V.; Tud, R.C. Formalin on Fresh Tilapia Via Electronic Nose and Assessment of Toxicity Levels with Reference to Average Adult Filipino Weight. In Proceedings of the 2019 11th International Conference on Humanoid, Nanotechnology, Information Technology, Communication and Control, Environment, and Management, HNICEM 2019; IEEE: New York, NY, USA, 2019. [Google Scholar]
- Benny, A.; Emilin Renitta, R.; Anitha Mary, X.; Dutta, P.K.; Karthik, C.; El-Kenawy, E.S.M. Machine Learning Algorithm Review for the Detection of Formalin in Fish. In IET Conference Proceedings; Institution of Engineering and Technology: Stevenage, UK, 2023; Volume 2023, pp. 344–349. [Google Scholar]
- Martinez, J.D.K.; Escio, J.M.L.; Pellegrino, R.V. Identification of Fish Freshness Through Gill Color Using CNN and L∗A∗B Image Segmentation. In Proceedings of the 2023 IEEE 5th Eurasia Conference on IOT, Communication and Engineering, ECICE 2023; Institute of Electrical and Electronics Engineers Inc.: New York, NY, USA, 2023; pp. 563–567. [Google Scholar]
- Murdika, U.; Sradeva, M.A.F.; Sulistiyanti, S.R.; Fitriawan, H.; Drajart, A.U.; Hakim, L. Detection of the Freshness Level of Goldfish Through Eye Objects Using Fuzzy Logic Method Based on Image Processing. In Proceedings—ICCTEIE 2023: 2023 International Conference on Converging Technology in Electrical and Information Engineering; Institute of Electrical and Electronics Engineers Inc.: New York, NY, USA, 2023; pp. 12–15. [Google Scholar]
- Eyer-Silva, W.A.; Hoyos, V.P.A.; Nascimento, L. Scombroid Fish Poisoning. Am. J. Trop. Med. Hyg. 2022, 106, 1300. [Google Scholar] [CrossRef] [Scilit] [PubMed]
- Gabriel, J.P.O.; Cabunilas, M.K.R.; Villaverde, J.F. Cantaloupe Ripeness Detection Using Electronic Nose. In Proceedings of the 2022 14th International Conference on Computer and Automation Engineering, ICCAE 2022; Institute of Electrical and Electronics Engineers Inc.: New York, NY, USA, 2022; pp. 44–49. [Google Scholar]
- Quinola, C.V.; Lapitan, J.N.; Pelletero, M.H.S.; Adtoon, J.J.; Linsangan, N.B. Non-Invasive Sweetness Classification for Citrus Maxima. In Proceedings of the 2020 IEEE 12th International Conference on Humanoid, Nanotechnology, Information Technology, Communication and Control, Environment, and Management, HNICEM 2020; Institute of Electrical and Electronics Engineers Inc.: New York, NY, USA, 2020. [Google Scholar]
- Ren, X.; Wang, Y.; Huang, Y.; Sun, D.; Xu, L.; Wu, F. E-Nose System Using CNN and Abstract Odor Map to Classify Meat Freshness. In Proceedings of the ITNEC 2023—IEEE 6th Information Technology, Networking, Electronic and Automation Control Conference; Institute of Electrical and Electronics Engineers Inc.: New York, NY, USA, 2023; pp. 1200–1204. [Google Scholar]
- Caya, M.V.C.; Cruz, F.R.G.; Blas, P.J.R.; Cagalingan, M.M.; Malbas, R.G.L.; Chung, W.-Y. Determining Spoilage Level against Time and Temperature of Tomato-Based Filipino Cuisines Using Nose. In Proceedings of the 2017 9th International Conference on Humanoid, Nanotechnology, Information Technology, Communication and Control, Environment, and Management, HNICEM 2017; IEEE: New York, NY, USA, 2017. [Google Scholar]
- Yumang, A.N.; Baguisi, J.M.; Buenaventura, B.R.S.; Paglinawan, C.C. Detection of Black Sigatoka Disease on Banana Leaves Using ShuffleNet V2 CNN Architecture in Comparison to SVM and KNN Techniques. In Proceedings of the 2023 15th International Conference on Computer and Automation Engineering, ICCAE 2023; Institute of Electrical and Electronics Engineers Inc.: New York, NY, USA, 2023; pp. 281–286. [Google Scholar]
- Linsangan, N.B.; Calites, J.V.G.; Reyes, J.T.L.; Sioson, G.C.D.; Pellegrino, R.V.; Juanatas, I.C. Filipino Sign Language to Text Converter Using K-Nearest Neighbor Algorithm. In Proceedings of the 2022 IEEE 14th International Conference on Humanoid, Nanotechnology, Information Technology, Communication and Control, Environment, and Management, HNICEM 2022; Institute of Electrical and Electronics Engineers Inc.: New York, NY, USA, 2022. [Google Scholar]
- Samar, H.J.M.; Manalang, H.J.J.; Villaverde, J.F. Melon Ripeness Determination Using K-Nearest Neighbor Algorithm. In Proceedings of the 2024 16th International Conference on Computer and Automation Engineering, ICCAE 2024; Institute of Electrical and Electronics Engineers Inc.: New York, NY, USA, 2024; pp. 461–466. [Google Scholar]
Disclaimer/Publisher’s Note: The statements, opinions and data contained in all publications are solely those of the individual author(s) and contributor(s) and not of MDPI and/or the editor(s). MDPI and/or the editor(s) disclaim responsibility for any injury to people or property resulting from any ideas, methods, instructions or products referred to in the content. |
© 2026 by the authors. Licensee MDPI, Basel, Switzerland. This article is an open access article distributed under the terms and conditions of the Creative Commons Attribution (CC BY) license.