


Abstract
Transonic buffet is a critical self-sustained shock/boundary-layer instability limiting the flight envelope of modern transport aircraft. This study investigates the interaction between shock buffet and forced wing motion on the Airbus XRF-1 wind tunnel model, using unsteady Reynolds-Averaged Navier–Stokes (URANS) simulations with the DLR TAU code. The investigation is carried out in deep buffet condition (, , ) and validated against wind tunnel data at the same flow condition. The buffet flow is superimposed with forced wing motions derived from a symmetric wing eigenmode at . Two different amplitudes scaled with the half-span s are considered: and . The baseline no-forcing URANS captures the buffet flow quite well with only small deviations in the standard deviation of the surface pressure coefficient . A special variant of the Discrete Fourier Transformation for the whole wing upper surface distribution revealed that the typical buffet frequencies are also matched. The analysis of the forced simulations revealed a strong influence of the local wing motion on the increase of . The spectral content showed a shift and damping or amplification of different buffet modes, which is relevant for the interaction of motion induced and buffed induced aerodynamic forces.
1. Introduction
Transonic buffet/buffeting is a limiting factor for the flight envelope. Therefore, understanding this phenomenon is critical for both aircraft development and certification. The buffet phenomenon is a self-sustained shock/boundary-layer instability that is observed at high subsonic Mach numbers and angles of attack beyond a critical threshold. It is characterized by shock-induced flow separation, coupled with shock movement in the chordwise direction and the spanwise propagation of flow structures, so-called buffet cells [1]. The characteristic frequency of this propagation is typically reported within a Strouhal number range of to (where is formed with the mean wing chord and free stream velocity) [2]. When the wing structure is excited, the coupled aerodynamic and structural phenomenon is called buffeting [3].
These two distinct but coupled aspects can be utilized to improve the understanding of the flow phenomenon: the inherent aerodynamic flow instability (shock buffet) present for a rigid structure and the interaction between shock buffet and a flexible structure (buffeting). Especially, the transfer of findings is difficult, as the wing structure varies between real aircraft, wind tunnel models, and numerical simulations. Simulations of forced wing motions at a selected wing eigenmode are carried out at varying forcing amplitudes. The effect of these forced model vibrations on the buffet flow is then determined, in order to extend the current knowledge about the buffet mechanisms.
2. State of the Art
Shock buffet and buffeting are extensively investigated topics, with one of the first investigations conducted by Hilton and Fowler [4] in 1947. Recent computational and experimental research has focused on understanding the underlying flow mechanisms, especially the transition from buffet on airfoils to swept and tapered wings. Global stability analysis, e.g., done by Paladini et al. [5], states that the buffet instability mechanism differs between airfoils and wings. Therefore, a deeper understanding of this phenomenon on realistic wing geometries is needed. Consequently, this study investigates transonic buffet using the Airbus XRF-1 transport aircraft configuration.
Recently, Goc et al. [6] employed Wall-Modeled Large Eddy Simulation (WMLES) to study the transonic flow over the NASA Common Research Model (CRM), focusing on identifying best practices for these simulations. Using a full aircraft model without symmetry boundary conditions better represents the experimental flow condition obtained from a full-model test. The same aircraft was investigated by Zahn et al. [7] using forced wing vibrations superposed onto the buffet flow. Their study primarily focused on predicting the resulting forced-motion flow using a neural network, which they achieved successfully. Regarding the buffet flow, they found that the forcing enhances the shock movement close to the wing tip. Timme et al. [8] also conducted buffet simulations with forced motion, applying forced wing torsion to the RCB12 wing. Their results revealed a new destabilizing global mode within the buffet frequency range. Belesiotis-Kataras et al. [9] employed the same simulation setup to investigate the effect of the forcing amplitude. They found that low-amplitude structural forcing had a negligible impact on the buffet dynamics, whereas higher amplitudes evoked flow responses both at the forcing frequency and within the buffet range. A fluid-structure interaction (FSI) simulation was conducted by Gao et al. (2017) [10] using a suspended airfoil. They found frequency lock-in where the buffet frequency locked onto the eigenfrequency of the elastic airfoil.
The experimental data for this investigation was measured in the European Transonic Windtunnel (ETW) [11,12,13] at flight Mach and Reynolds numbers. Also, numerical simulations without forcing were conducted by Spinner et al. [14].
3. Methodology
3.1. Reference Configuration
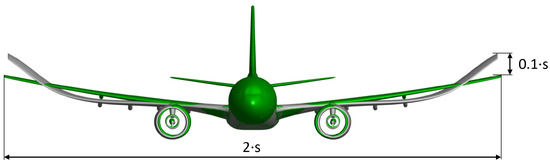
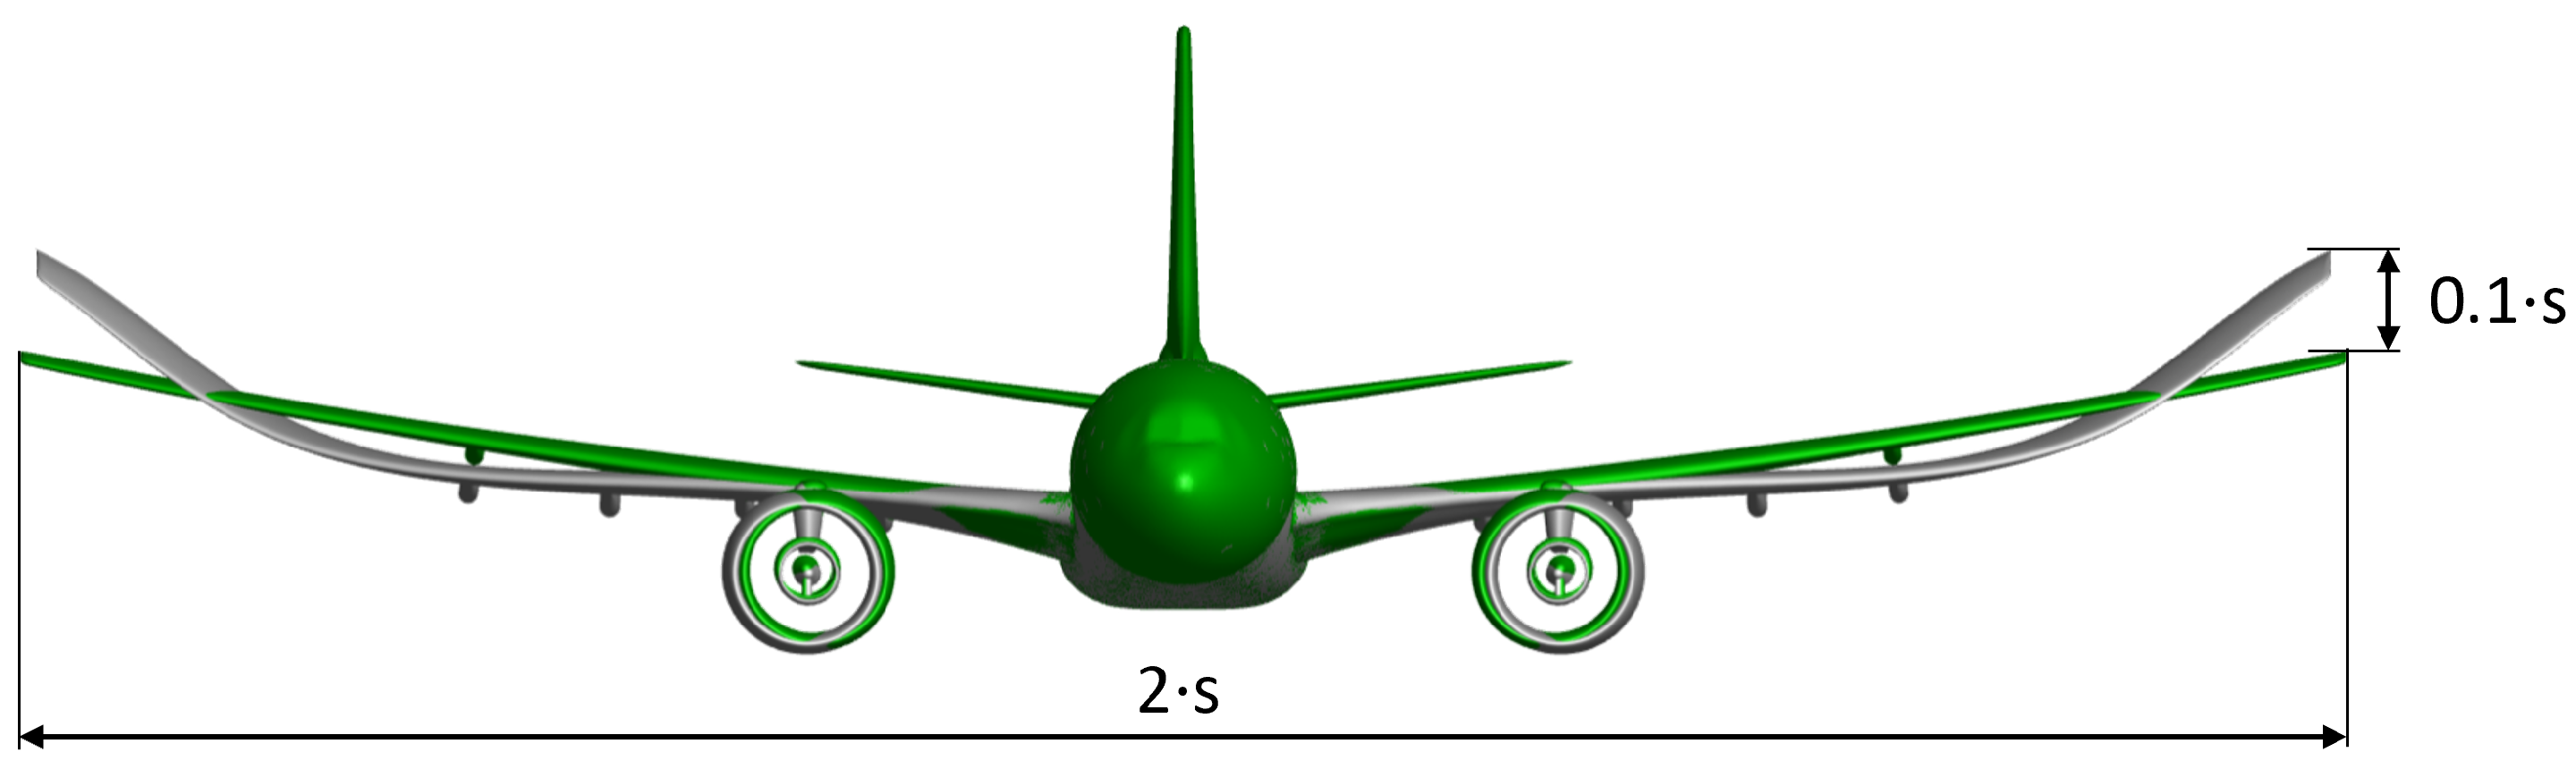
This investigation features the Airbus XRF-1 transport aircraft configuration as it was investigated in the wind tunnel by the FOR2895 research group [13]. It is equipped with two ultra-high bypass ratio (UHBR) nacelles, four flap track farings (FTFs) on each wing, and horizontal and vertical tails; Figure 1. The sting support used in the experiment was neglected during the simulation.
Figure 1.
Undeformed (green) XRF-1 wing geometry and the symmetric wing bending mode shape (gray). The deformation is shown at the maximum tip position of the harmonic forcing cycle, exaggerated with an amplitude of .
The investigated flow condition is taken from the experiment in deep buffet condition, where steady pressure sensitive paint (PSP) and unsteady pressure sensitive paint (iPSP) measurements are available for the wing upper side [15,16]. The Reynolds number is based on the wing mean aerodynamic chord of m, at a Mach number of and an angle of attack of . To minimize the deviation between simulation and experiment, the exact Wind-On shape of the model from the wind tunnel experiment is employed.
3.2. Structural Model and Selected Eigenmode
For the forced wing motion, the DLR Institute of Aeroelasticity [17] created a structural model representing the actual wind tunnel model used by the FOR2895 research group. This model is validated using a Ground Vibration Test (GVT). In order to investigate the influence of model vibrations on the buffet flow, an eigenmode with a measurable amplitude during the wind tunnel test is selected. The selected eigenmode has an eigenfrequency of and represents a symmetric wing bending mode. The amplitude of the forced wing motion is defined at the maximum wing tip position. The amplitudes were set to be and of the half span s of the wind tunnel model. The gray colored aircraft in Figure 1 shows the selected wing eigenform. The wing tip amplitude is exaggerated for a better visualization to .
The movement of the wing is realized via the TAU-Python module and the TAU-Deformation tool (version 2021.1.0). The grid is incrementally deformed at every timestep. Therefore, a deformation file is created for a selected number of wing surface nodes as the difference between their position in the previous timestep and the current one. Afterwards, the TAU flow solver is run for one physical timestep, and this cycle is repeated.
3.3. Numerical Approach
The investigation is carried out as unsteady Reynolds-averaged Navier-Stokes (URANS) simulations with the DLR TAU code (Version 2021.1.0) as flow solver. The selected turbulence model is the k- SST scale-adaptive simulation (SAS) [18] model, as it yielded the best results when compared with experimental data. The computational grid was generated with the commercial software ANSA (version 24.0.1). A mesh-dependency study yielded a 55-million-cell volume mesh. It is hexaeder-dominated, and the surface mesh consists mainly of quads with some triangles. A total of 33 prism layers ensures a sufficient resolution of the boundary layer with a normalized wall unit (y+) of less than one at the wall for the whole aircraft. The timestep was also determined by a time dependency study and is set at , with the convective time unit calculated by: with the mean aerodynamic chord and the farfield velocity . This results in around 300 timesteps per buffet cycle.
Further solver settings are as follows: 100 inner iterations per physical timestep. A central differencing scheme for the spatial discretization, and implicit backward Euler for the time integration of the URANS equations. The linear LU-SGS solver and Green Gauss gradient reconstruction are employed. Convergence is improved with dual time stepping. Meanflow fluxes use the TAU flux of the average scheme, while turbulence fluxes use the first-order Roe scheme. A low dissipation scheme is achieved with a 0.5 matrix-scalar dissipation ratio and a fourth-order dissipation coefficient of 1/128 for the numerical dissipation.
Forced wing motions is applied after an initial no-forcing phase, with the no-forcing case run in parallel for comparison. The first 1.5 forcing cycles are treated as transient and excluded. After that, for all simulations starting at the same physical time, a snapshot is taken every timestep. This results in a Nyquist frequency of . The more important lower frequency limit is determined by the inverse of the whole sampling time . Therefore, 7000 snapshots are taken to achieve a lower limit of .
For the spectral analysis, the Python library flowTorch (version 1.3) [19] is used. From that toolbox, a special method is selected to get the frequency content of the whole surface data in time. This method projects the data matrix of the selected surface onto the DFT (Discrete Fourier Transformation)-Vandermonde-Matrix. The squared normalization factors of this projection can then be plotted and show a similar result to a Fourier transformation of a 1D time signal. The advantages are that this method is independent of any probe position and the result can be used to reconstruct selected modes.
4. Results
4.1. Transonic Buffet Without Forcing
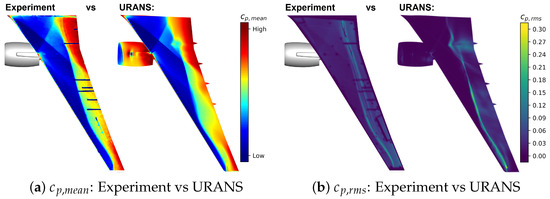
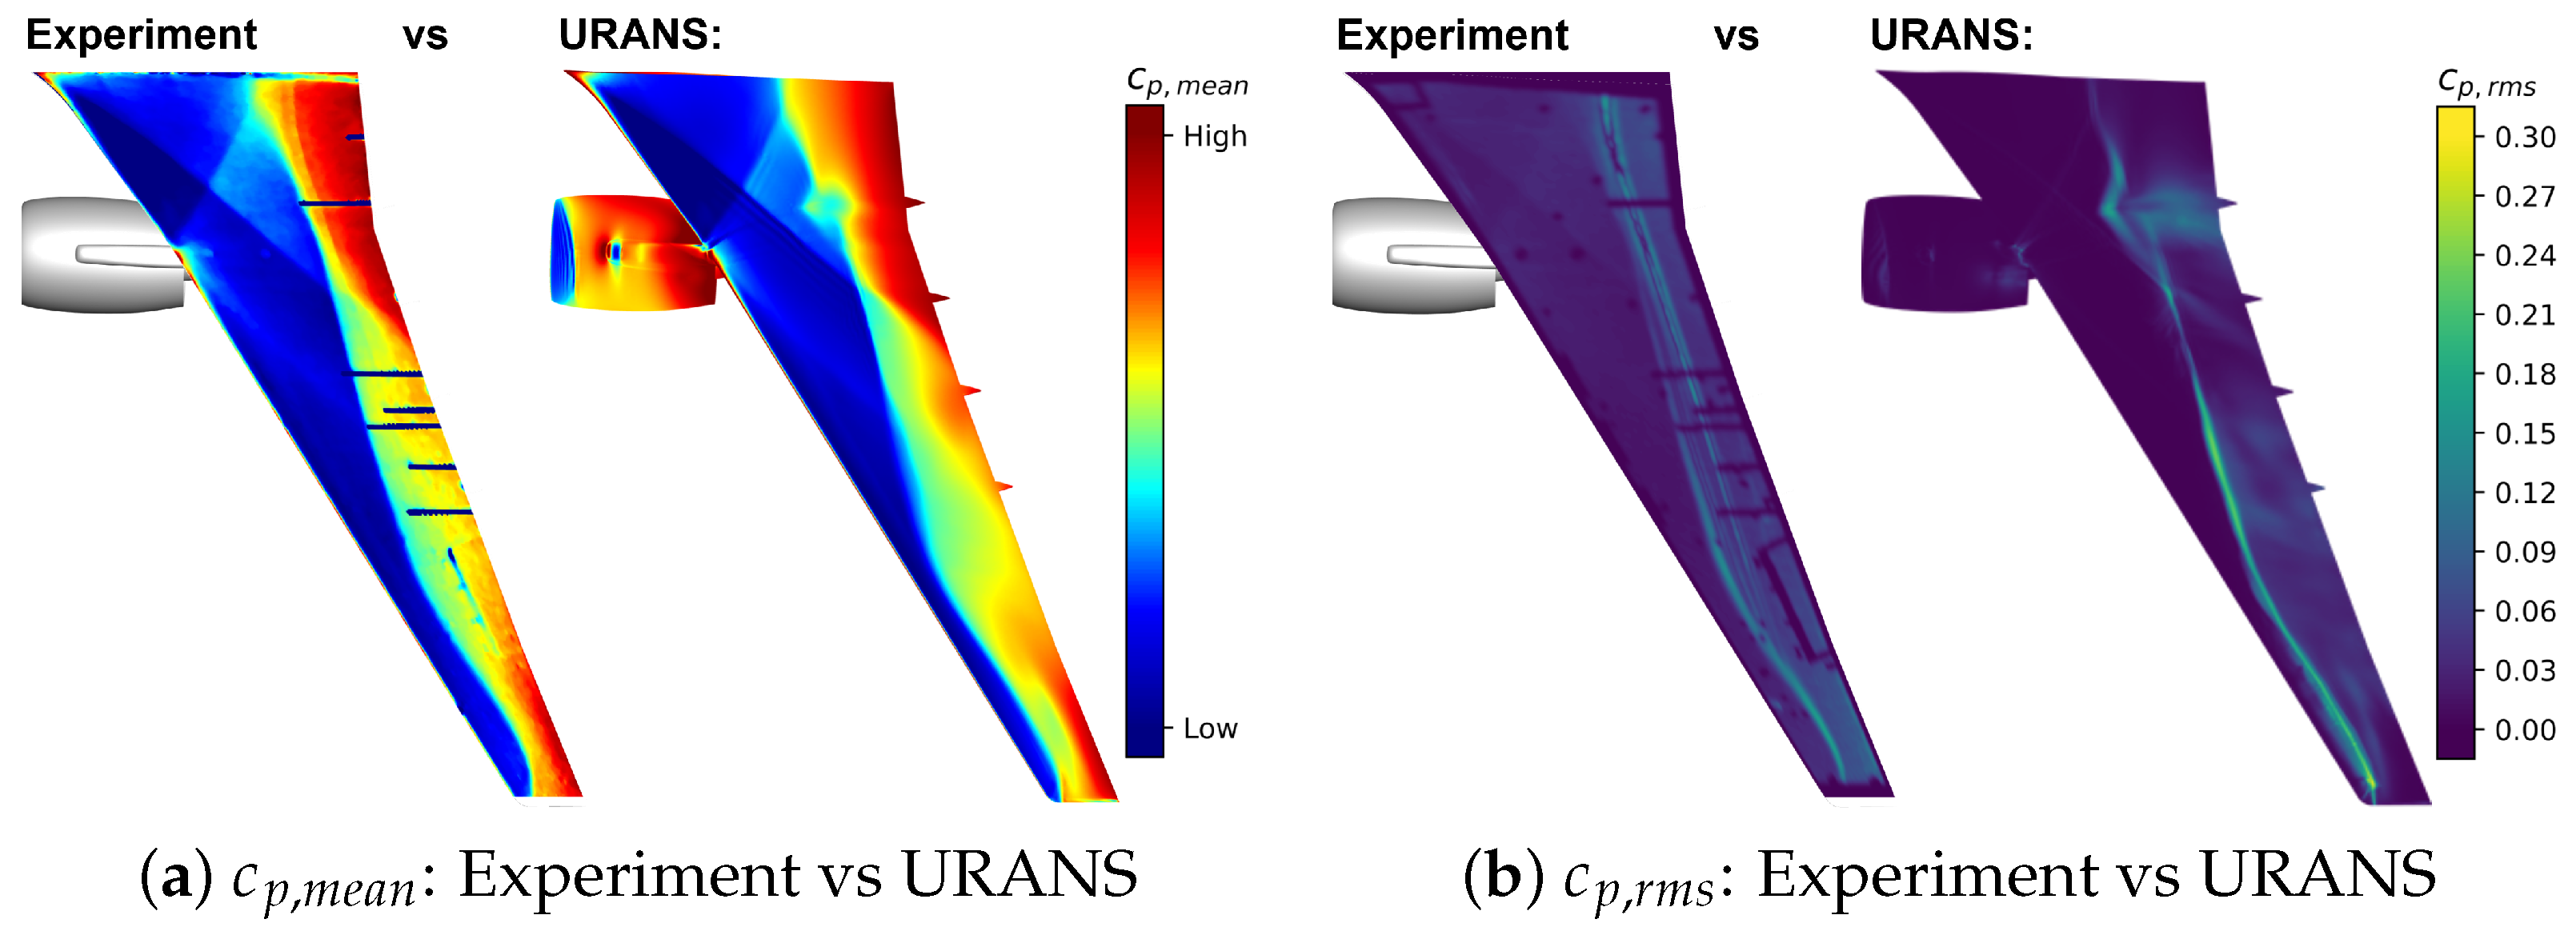
In Figure 2a, on the left-hand side, a color plot of the mean surface pressure coefficient from the PSP is shown. The abrupt change from low (blue) to intermediate (yellow) indicates the shock position over the wing. At the wing root, a distinct -shock pattern can be seen. That -shock is mixed with a shock originating from the pylon of the nacelle.
Figure 2.
Mean and standard deviation of surface pressure coefficient from the experiment and URANS simulation. For the experiment, is measured by steady pressure sensitive paint (PSP) and by unsteady pressure sensitive paint (iPSP) [15,16]. The URANS results are postprocessed correspondingly.
In the inner third of the wing, there is no flow separation behind the shock, indicated by a continuous change to higher (red). Further outboard, the pressure recovery is weaker, indicating flow separation due to the shock. From the middle of the wing to the tip, the chordwise shock position changes. The shock moves closer to the leading edge. Only near the wing tip, this trend is reversed, and the shock shifts back towards the trailing edge, which can be attributed to the decreasing incidence angle from root to tip. Areas without paint or high uncertainty were masked with black.
The overall mean pressure distribution is quite similar for the URANS result, depicted in the right image of Figure 2a. The largest difference is the shown UHBR and FTFs. Those were not measured by the PSP and therefore omitted. The other difference is a point of higher (light blue) than in the experiment, aft of the nacelle. This is a vortex induced by the pylon already discussed by Spinner et al. [14]. It seems the URANS predicts this vortex closer to the surface as in the experiment, and therefore its influence is visible in the surface . In the mid-section, the mean shock position is represented quite well by URANS. Near the wing tip, the shock does not bend backward, as in the experiment, despite the geometry matching the measured shape at Wind-On.
Figure 2b depicts an optical artifact close to the wing root. From the middle of the wing to its tip, a clear region of shock movement is shown by a lighter color. The area upwind of the shock exhibits higher levels in the experiment compared to the URANS, indicating a higher noise level in the experiment. For the URANS, the vortex induced by the nacelle can be seen in the plot as well. The region of the shock movement is quite similar to the experimental result with higher values for of instead of from the wind tunnel.
Overall, good agreement is found between the measurement and simulation, and the mean shock position is well captured. For further analysis of the buffet flow, only the URANS results will be taken as the noise levels and the different time resolution of the iPSP make a comparison of spectral data very complex.
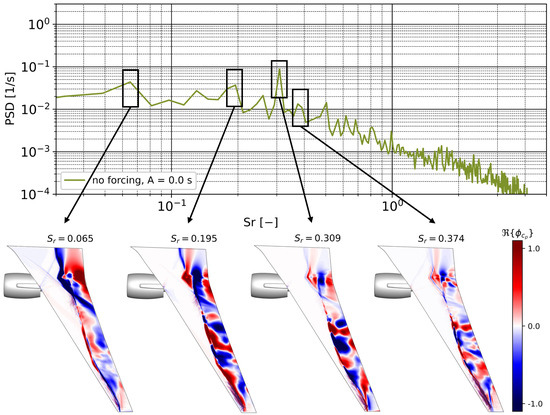
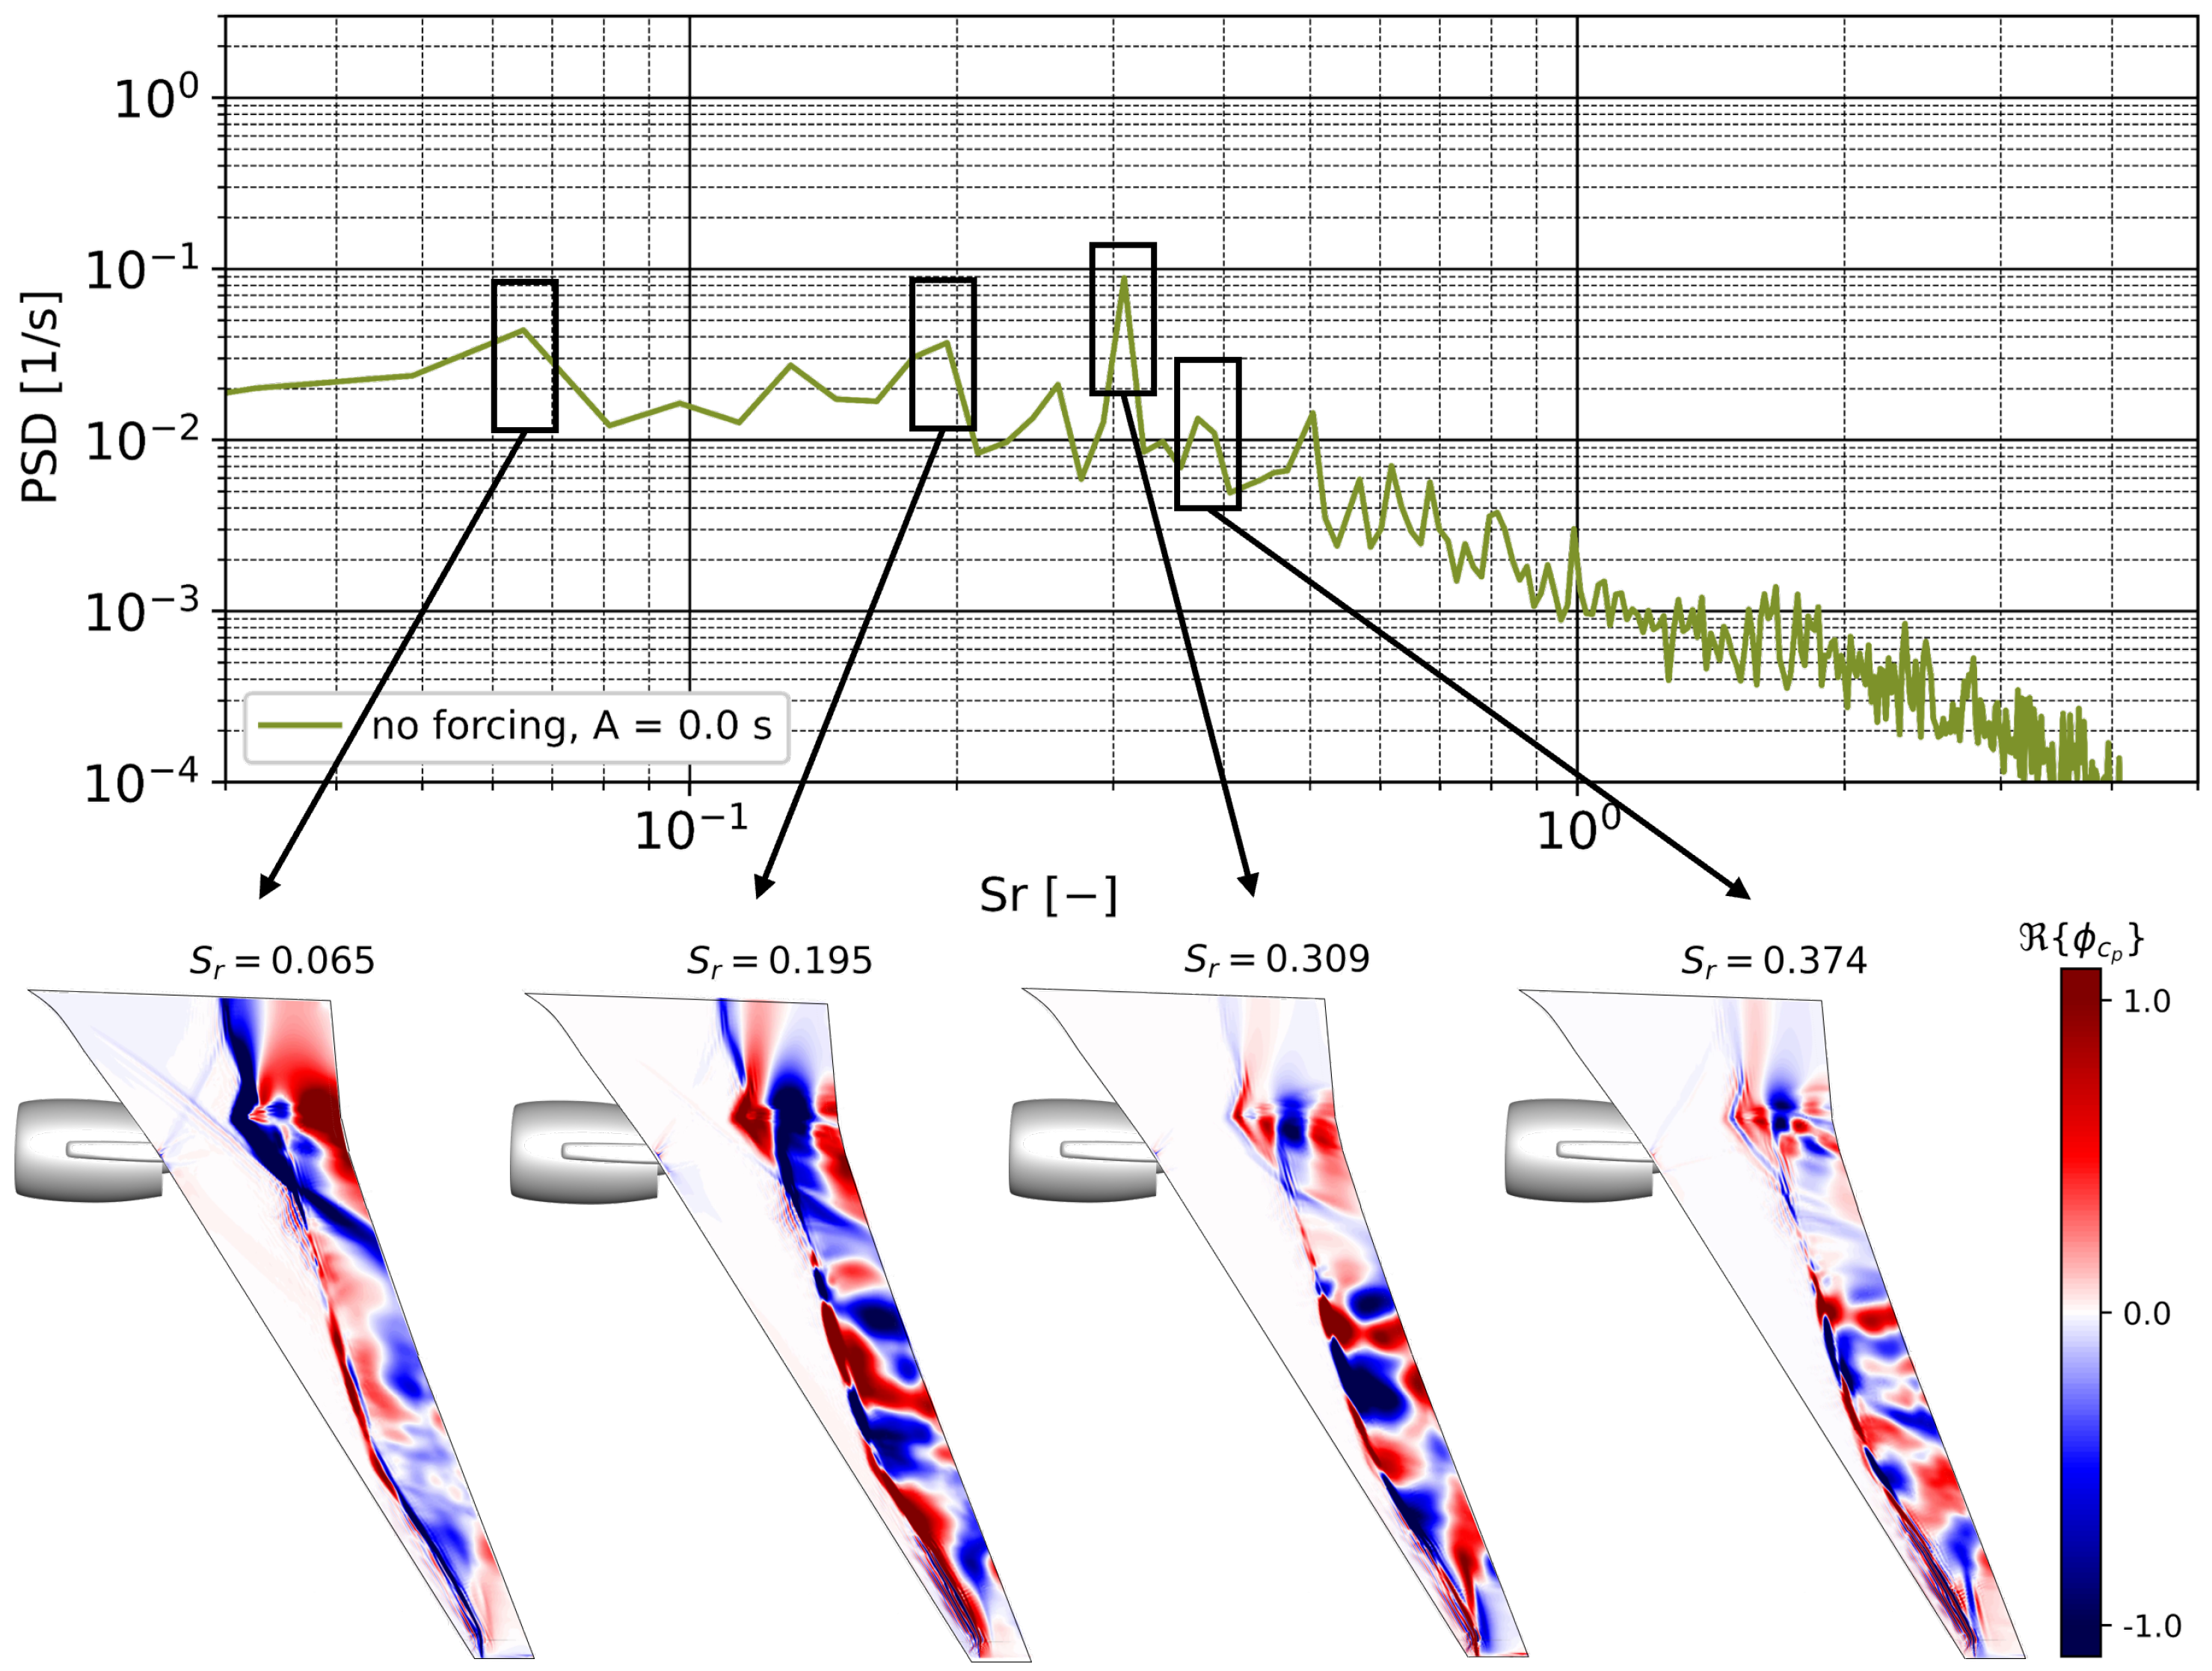
The spectral content of the unsteady pressure coefficient on the entire upper wing surface is depicted in Figure 3. The squared normalization factors of the DFT-Vandermonde-Matrix of the whole wing upper surface distribution, denoted as , are drawn over the Strouhal number . Certain important peaks in the spectrum are marked, and an instant snapshot of the real part of their reconstruction is depicted beneath. At around , a chordwise buffet mode appears. The entire shock movement area has the same color, indicating that the entire shock is moving in the chord direction. At , the first lower frequency spanwise moving mode can be seen. It already contains the typical buffet cells indicated by the alternation of red and blue regions in the shock region. The main buffet mode, indicated by the highest peak, is at . The reconstruction depicts the same pattern as for the lower frequency buffet mode, but with more buffet cells along the span. The next higher peak is at , showing a higher frequency buffet mode with a similar structure to the one at . Another higher buffet peak can be seen at but is not addressed. For even higher Strouhal numbers, the PSD value decreases drastically, indicating no more important modes.
Figure 3.
Double logarithmic plot of the squared normalization factors of the DFT (Discrete Fourier Transformation)-Vandermonde-Matrix of the whole wing upper surface distribution denoted as over the Strouhal number with the most significant modes indicated by black boxes and an instant snapshot of the real part of their reconstruction depicted beneath.
4.2. Influence of Forcing onto Buffet
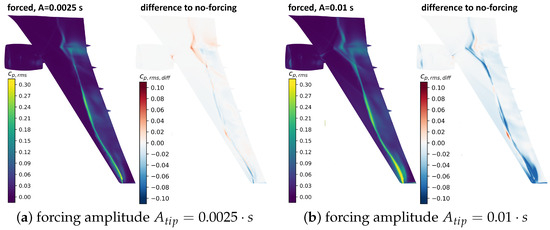
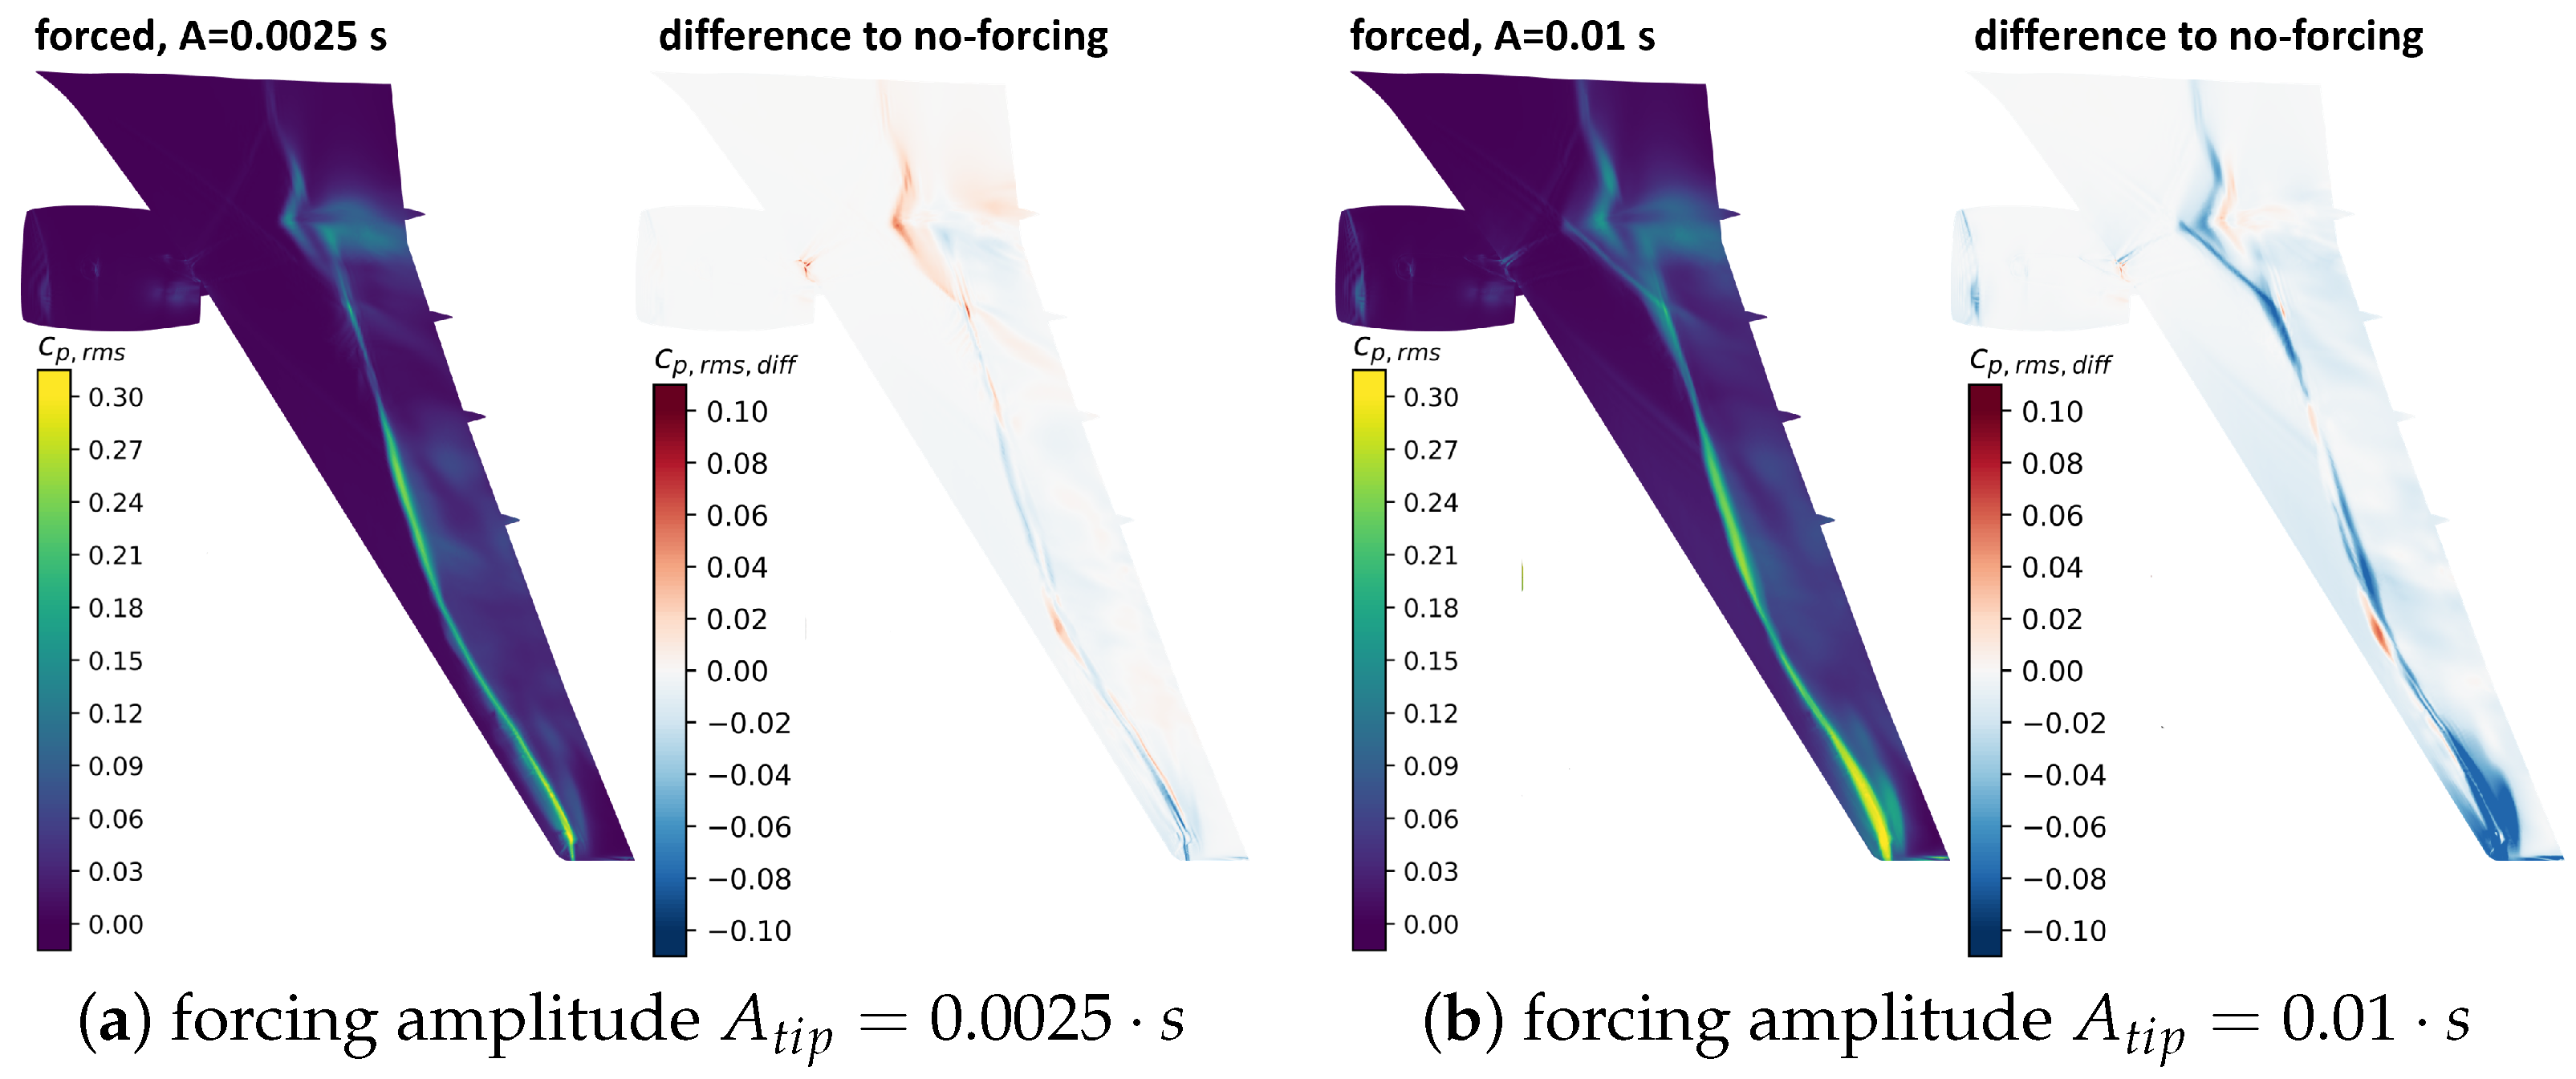
The imposed forced motion at the selected forcing amplitudes does not significantly alter the mean flow; therefore, is omitted from this part of the analysis. Examination of the distribution over the wing reveals noticeable differences only at the higher forcing amplitude; see Figure 4. To provide a clearer representation, difference plots between the no-forcing and the forced simulations are also included in Figure 4.
Figure 4.
Standard deviation of surface pressure coefficient from URANS and the difference to the no-forcing simulation for both amplitudes of and .
Figure 4a illustrates the results for the smaller forcing amplitude. In this case, the forcing induces only a minor increase in the oscillation intensity and no shift of the shock position. In contrast, the higher forcing amplitude (see Figure 4b) produces a more distinct effect: the intensity and extent of the shock motion increase notably near the wing tip due to the locally higher motion amplitude. The enhanced shock oscillation is further transported outboard with the buffet cells, amplifying the motion even at the wing nodes, where the local displacement remains zero. Another effect can be seen, especially in the plot showing the difference from the no-forcing simulation. Here, only in a small region at around of the half-span (indicated by the red region), the shock position is shifted.
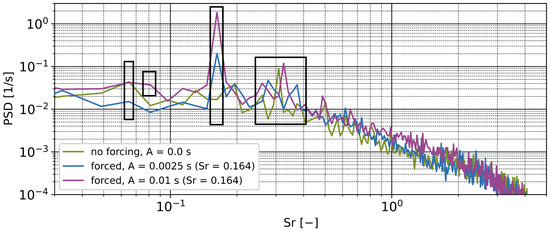
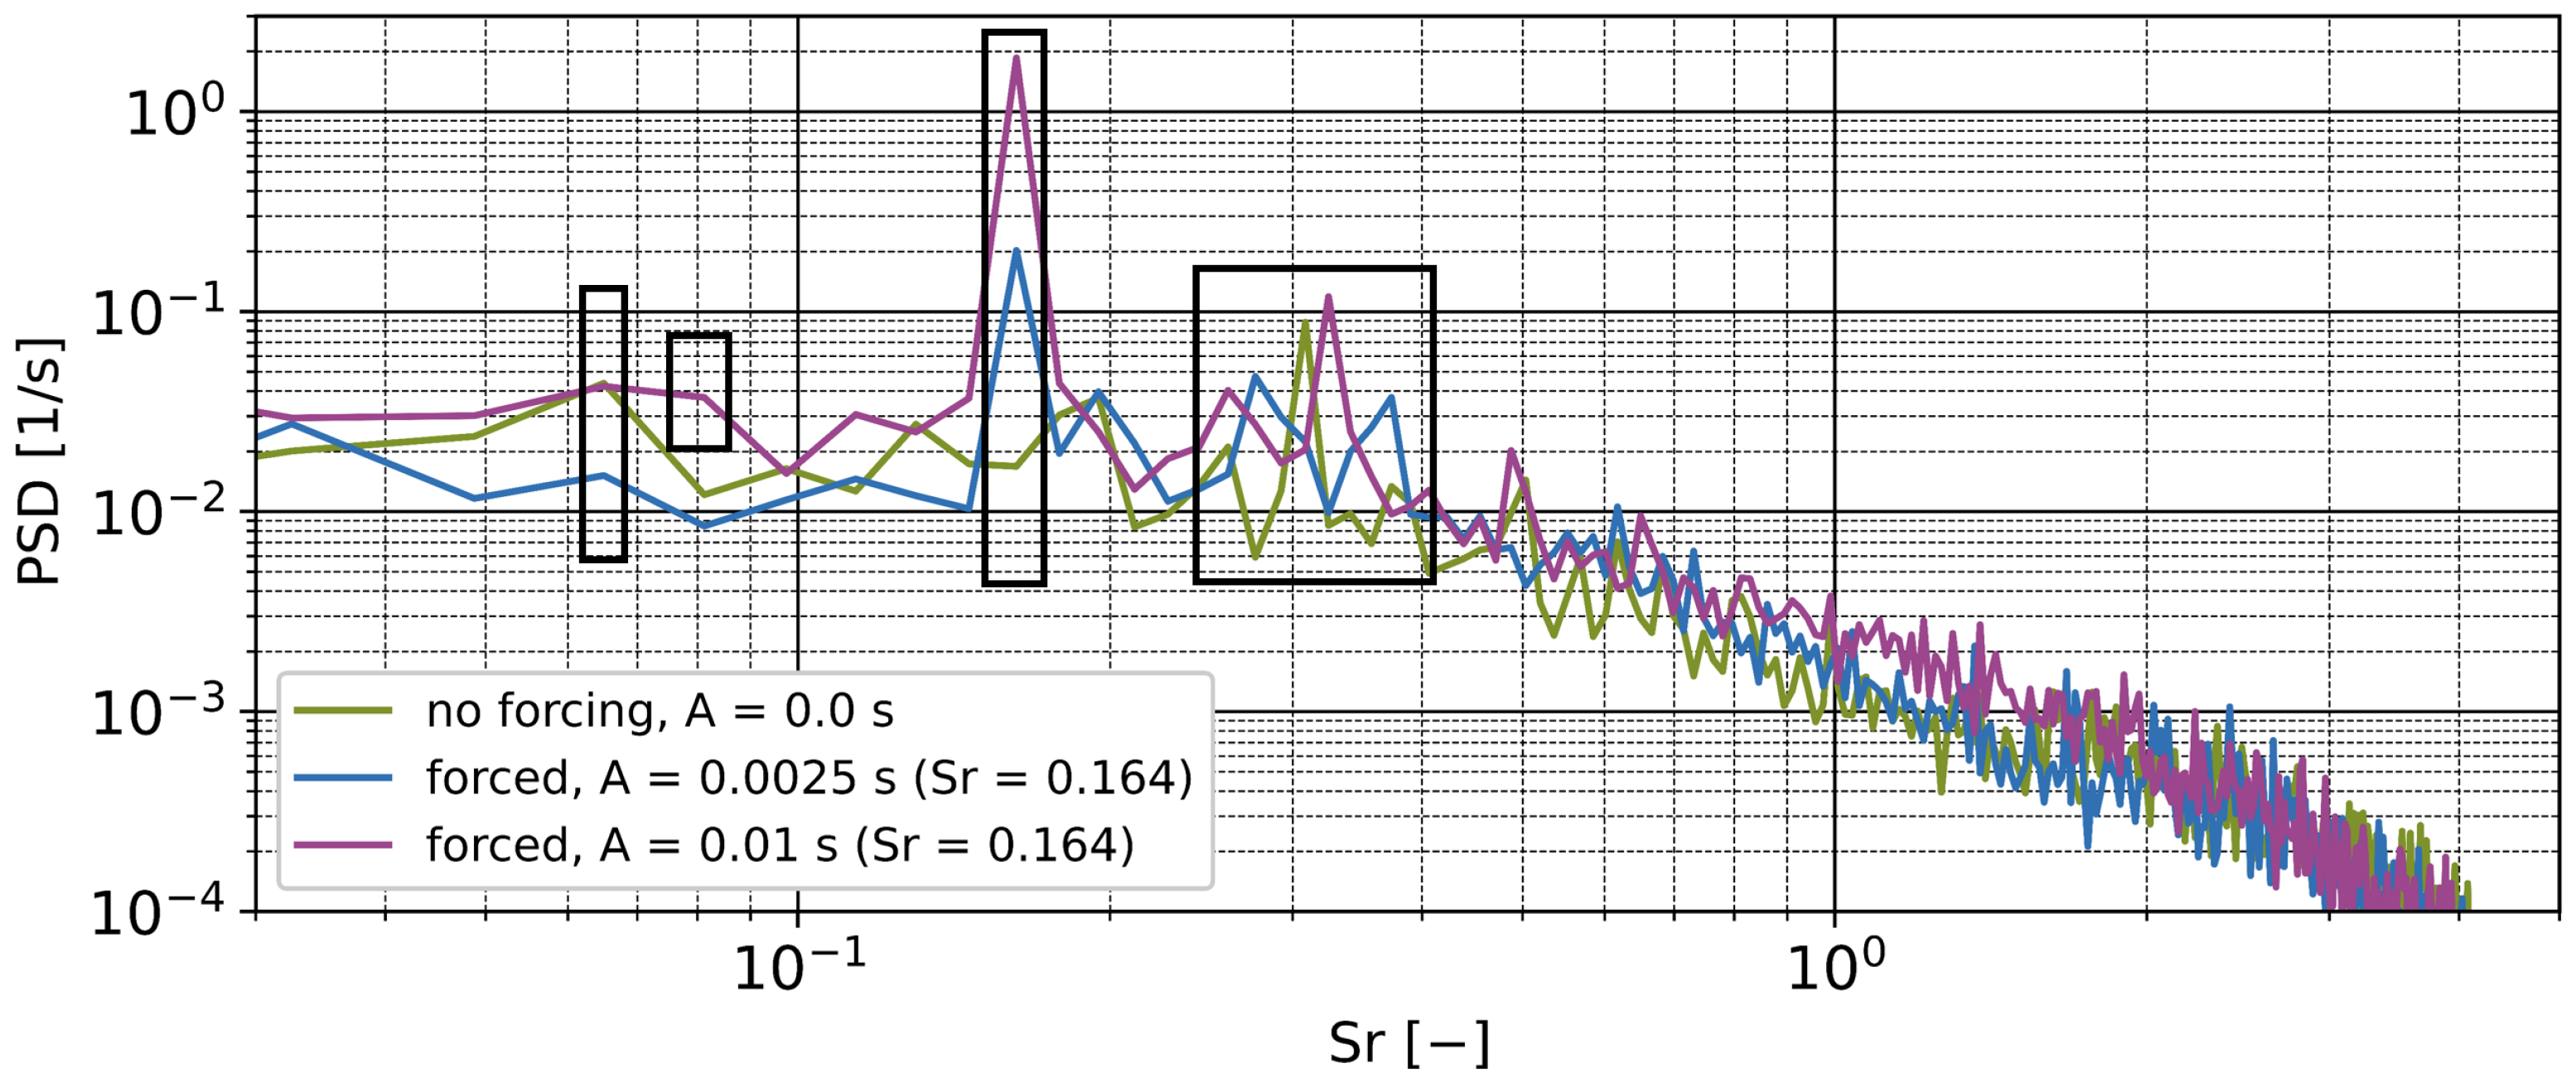
To further examine the effect of the forced wing motions on the shock buffet, the same spectral analysis is performed as for the no-forcing simulation. Also, the unsteady pressure coefficient on the entire upper wing surface is used as input. Figure 5 presents the squared normalization factors of the DFT-Vandermonde-Matrix, denoted as over the Strouhal number . The chordwise buffet mode at is neither shifted nor significantly altered in amplitude by the applied forcing.
Figure 5.
Double logarithmic plot of the squared normalization factors of the DFT (Direct Fourier Transformation)-Vandermonde-Matrix of the whole wing upper surface distribution, denoted as over the Strouhal number with the most significant modes indicated by black boxes.
At , a pronounced peak is observed for the two forced simulations, with its magnitude correlating with the forcing amplitude. This indicates that the flow responds to the applied forcing. For the higher forcing amplitude, additional peaks appear at the higher harmonic of the forcing around and at the lower harmonic around , suggesting that the entire flow field over the wing is influenced by the forcing.
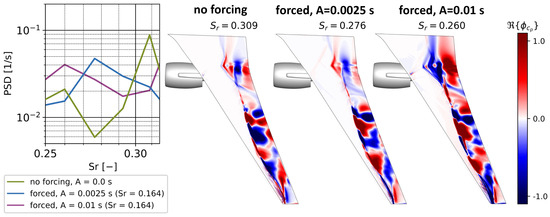
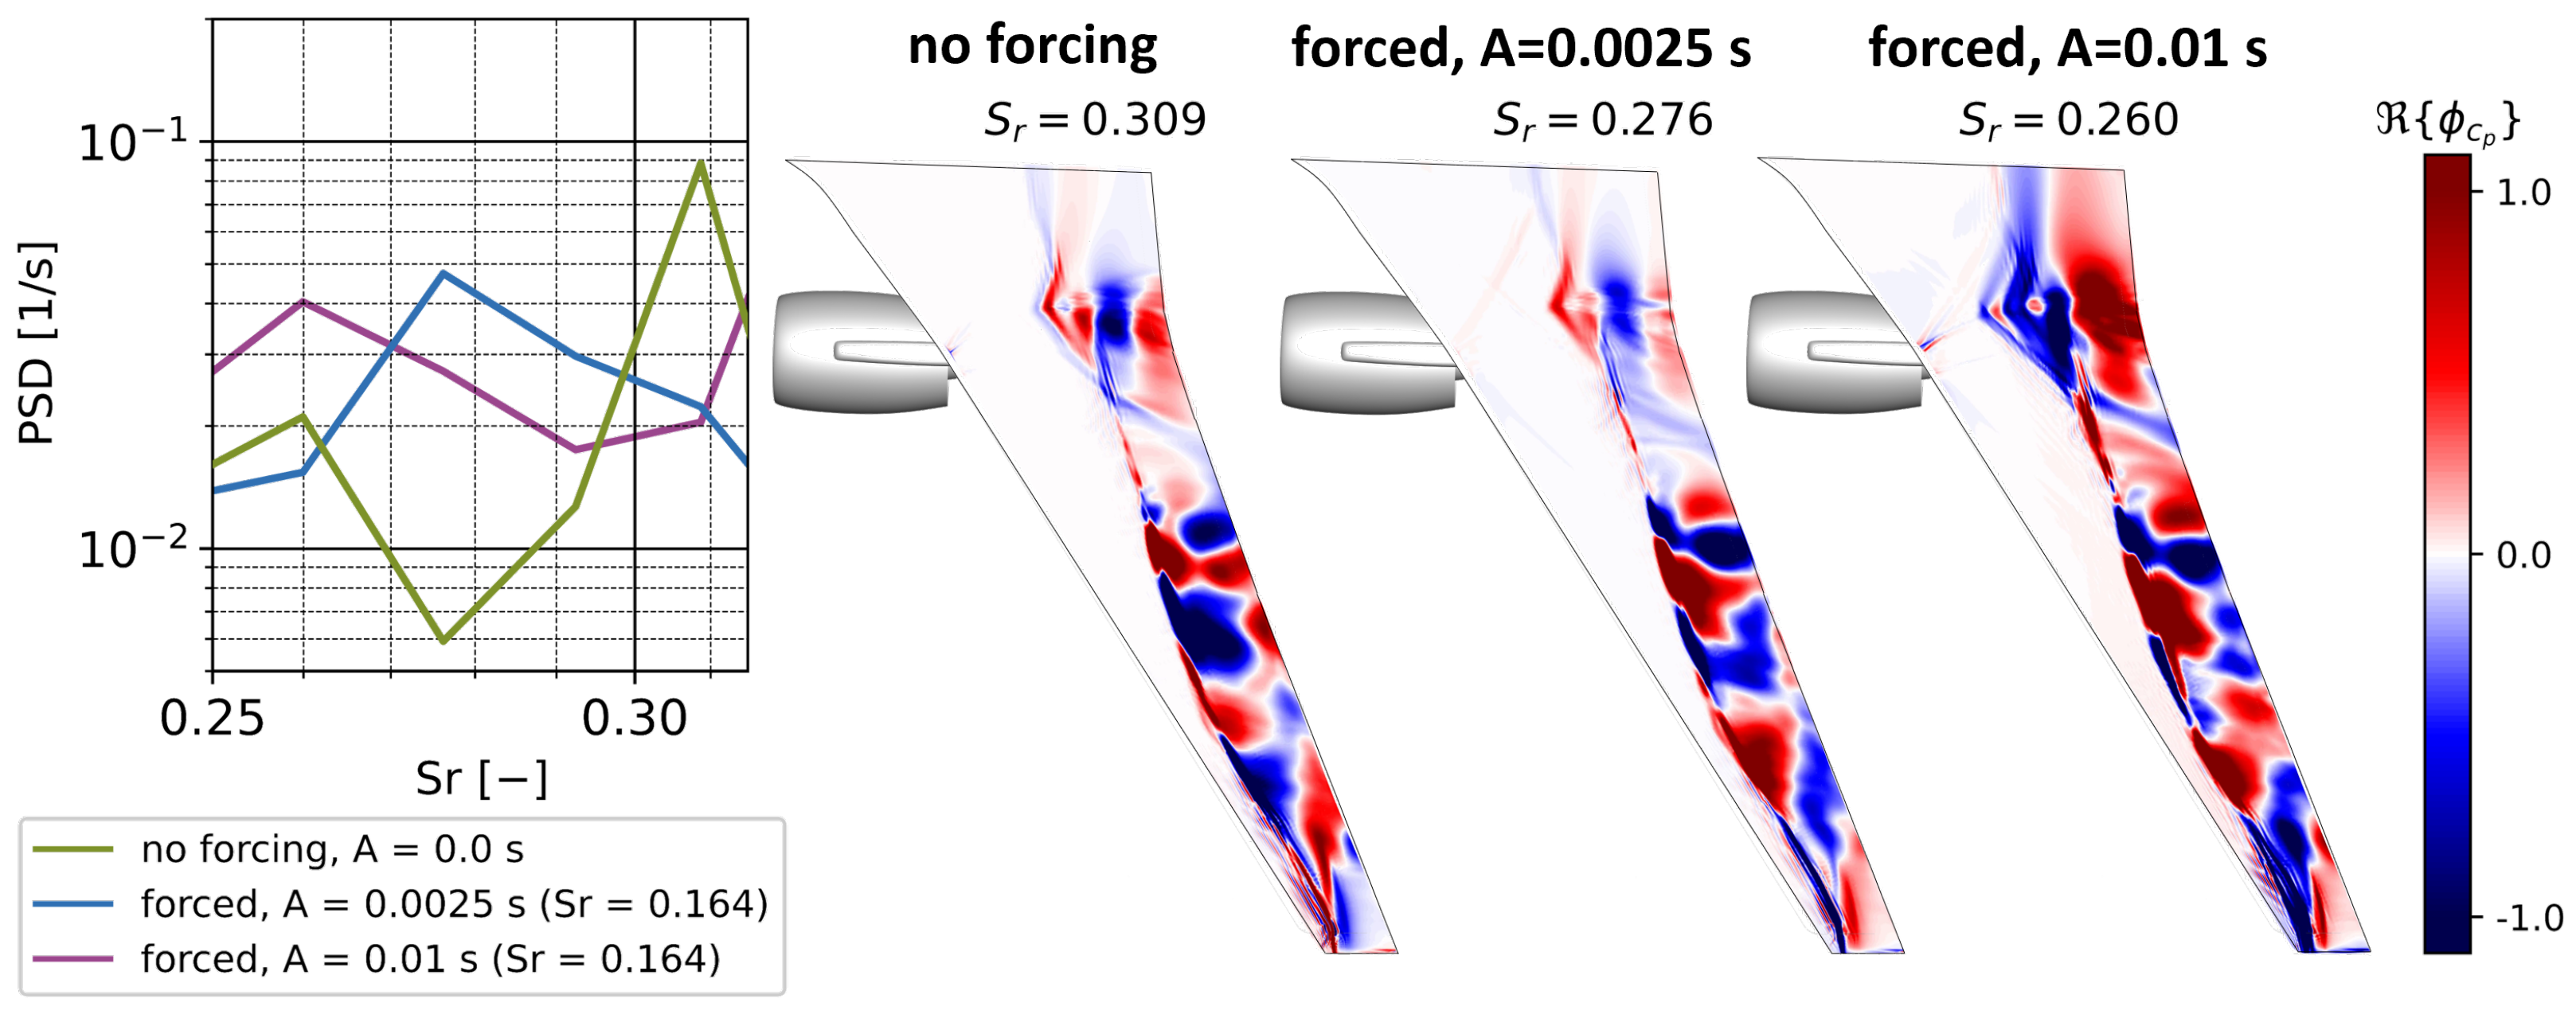
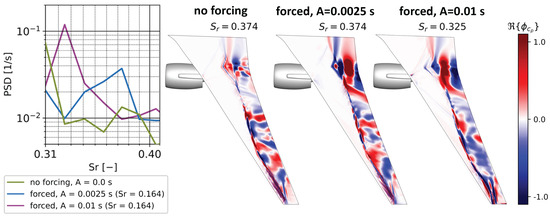
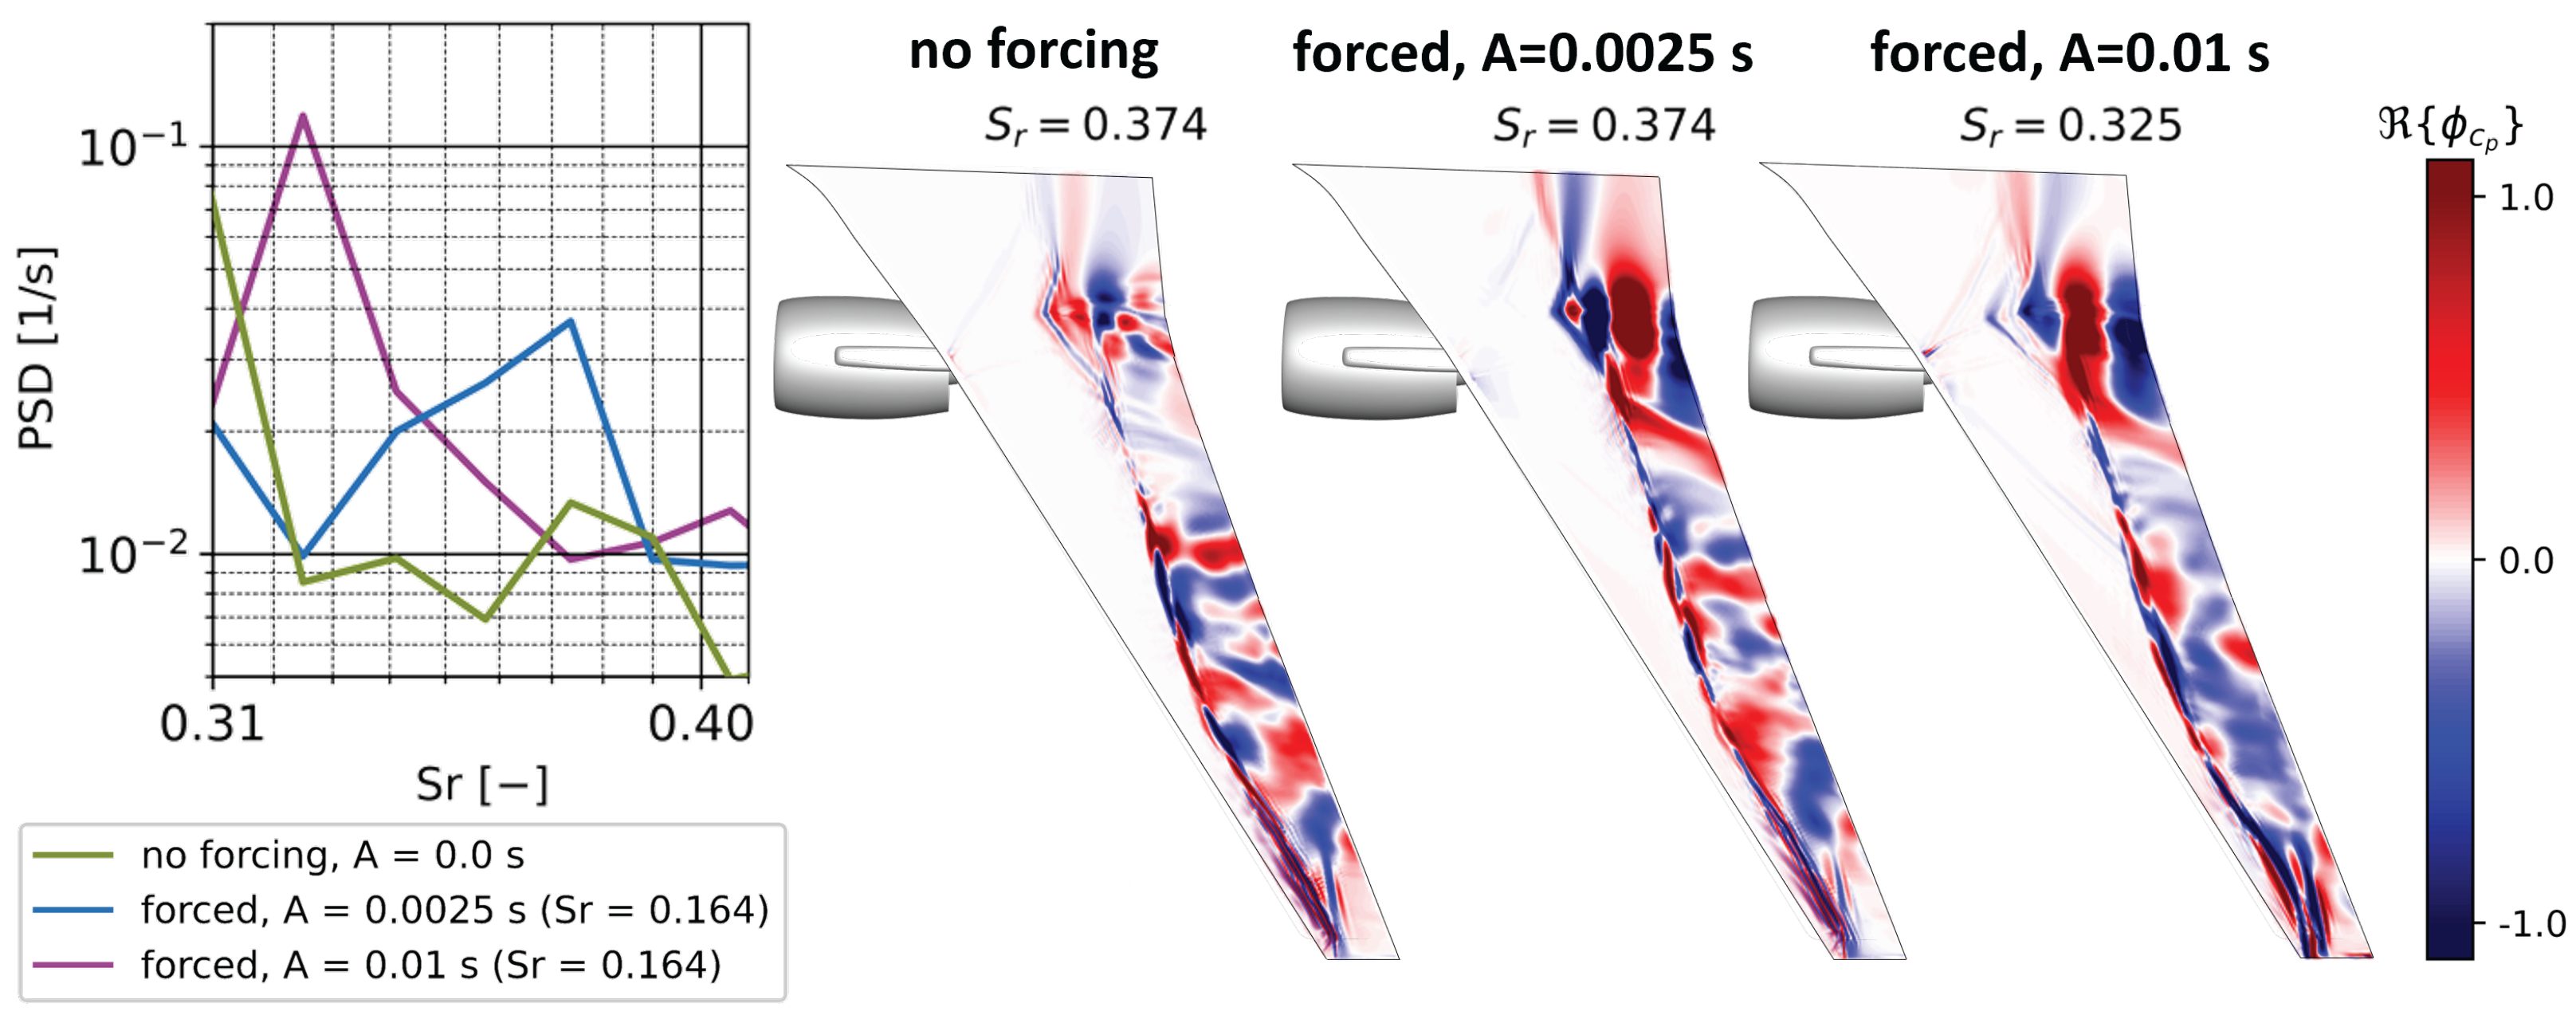
Within the buffet region, multiple peaks become visible and require further discussion through mode reconstruction. Figure 6 shows that the main buffet mode, located at , is shifted slightly towards lower frequencies due to the forcing, and its intensity is slightly reduced. Instantaneous snapshots of the real part of the reconstructed peaks exhibit very similar spatial patterns, indicating that they correspond to the same buffet mode. For the next higher buffet mode, at , a frequency shift can be observed as well (see Figure 7); however, in this case, the mode is not damped by the forcing but amplified. The reconstruction for the unforced case, and for , appears quite similar, whereas the reconstruction for still shows comparable behavior in the shock region but exhibits a distinct flow-separation pattern downstream of the shock.
Figure 6.
Focused view on the main buffet mode comparing the cases of no forced wing bending motion () and those with superimposed motions at varying amplitude (), respectively.
Figure 7.
Focused view on the second buffet mode comparing the cases of no forced wing bending motion () and those with superimposed motions at varying amplitude (), respectively.
5. Conclusions and Outlook
This investigation used URANS simulations of the Airbus XRF-1 wind tunnel model to examine the impact of forced wing motions on transonic shock buffet. The baseline no-forcing simulation successfully captured the characteristic buffet modes and showed good agreement with experimental data. Imposing forced motions for the selected symmetrical wing bending eigenmode () revealed an amplitude-dependent response. While the smaller amplitude of had a minor effect, the higher amplitude of significantly enhances shock oscillation intensity near the wing tip and alters the spectral content not only at the forcing frequency. With forced motion, the buffet mode at was slightly damped and shifted to lower frequencies. And the buffet mode at was amplified and also shifted to lower frequencies. This confirms the strong aerodynamic-structural coupling in transonic buffeting, highlighting the sensitivity of the inherent flow instability to structural dynamics. As the outlook for future investigations, different forcing eigenfrequencies with amplitude variations are planned. Special attention will be given to the influence of fluid modes and wing structural modes in the context of the unsteady aerodynamic loads. Ultimately, the next step will be to study these phenomena using FSI simulations.
Author Contributions
Conceptualization, methodology, validation, investigation, writing—review and editing, V.V. and C.B.; supervision, C.B. All authors have read and agreed to the published version of the manuscript.
Funding
The authors gratefully acknowledge the Deutsche Forschungsgemeinschaft DFG (German Research Foundation) for funding this work in the framework of the research unit FOR2895, subproject TP7, Grant number BR1511/14-2 and the Helmholtz Gemeinschaft HGF (Helmholtz Association), Deutsches Zentrum für Luft-und Raumfahrt DLR (German Aerospace Center) and Airbus for providing the wind tunnel model and financing the wind tunnel measurements as well as public support to mature the test methods applied by DLR and ETW.
Institutional Review Board Statement
Not applicable.
Informed Consent Statement
Not applicable.
Data Availability Statement
The data confidentiality is covered by a framework non-disclosure agreement between all parties participating in the DFG FOR 2895 initiative.
Acknowledgments
We are grateful to the colleagues from the DLR’s Institute of Aeroelasticity (AE) for the conduction of a ground vibration test, creation of a structural model and and the provision of results. Further, the authors would like to thank the Gauss Centre for Supercomputing e.V. (www.gauss-centre.eu) for funding this project by providing computing time on the GCS Supercomputer Super-MUC at Leibniz Supercomputing Centre (www.lrz.de), as well as the DLR for providing the TAU code.
Conflicts of Interest
The authors declare no conflicts of interest.
References
- Iovnovich, M.; Raveh, D. Numerical Study of Shock Buffet on Three-Dimensional Wings. AIAA J. 2015, 53, 449–463. [Google Scholar] [CrossRef] [Scilit]
- Masini, L.; Timme, S.; Peace, A.J. Scale-Resolving Simulations of a Civil Aircraft Wing Transonic Shock-Buffet Experiment. AIAA J. 2020, 58, 4322–4338. [Google Scholar] [CrossRef] [Scilit]
- Raveh, D.; Dowell, E. Aeroelastic Responses of Elastically Suspended Airfoil Systems in Transonic Buffeting Flows. AIAA J. 2014, 52, 926–934. [Google Scholar] [CrossRef] [Scilit]
- Hilton, W.F.; Fowler, R.G. Photographs of Shock Wave Movement; Reports and Memoranda No. 2692; National Physical Laboratory, Aeronautical Research Council; His Majesty’s Stationery Office: London, UK, 1947. [Google Scholar]
- Paladini, E.; Dandois, J.; Sipp, D.; Robinet, J.C. Analysis and Comparison of Transonic Buffet Phenomenon over Several Three-Dimensional Wings. AIAA J. 2019, 57, 379–396. [Google Scholar] [CrossRef] [Scilit]
- Goc, K.; Agrawal, R.; Moin, P.; Bose, S. Studies of transonic aircraft flows and prediction of initial buffet onset using large-eddy simulations. In Proceedings of the AIAA AVIATION 2023 Forum, Reston, Virginia, 12–16 June 2023. [Google Scholar] [CrossRef] [Scilit]
- Zahn, R. Deep Learning Approaches for Transonic Aerodynamic Buffet Analysis. Ph.D. Thesis, Technische Universität München, München, Germany, 2024. [Google Scholar]
- Timme, S.; Thormann, R. Towards Three-Dimensional Global Stability Analysis of Transonic Shock Buffet. In Proceedings of the AIAA Aviation, Washington, DC, USA, 13–17 June 2016. [Google Scholar] [CrossRef] [Scilit]
- Belesiotis-Kataras, P.; Timme, S. Harmonic Forcing Amplitude Effects in Globally Unstable Transonic Wing Flow. In Proceedings of the AIAA Scitech 2020 Forum, Orlando, FL, USA, 6–10 January 2020. [Google Scholar] [CrossRef] [Scilit]
- Gao, C.; Zhang, W.; Li, X.; Liu, Y.; Quan, J.; Ye, Z.; Jiang, Y. Mechanism of frequency lock-in in transonic buffeting flow. J. Fluid Mech. 2017, 818, 528–561. [Google Scholar] [CrossRef] [Scilit]
- Lutz, T.; Kleinert, J.; Waldmann, A.; Koop, L.; Yorita, D.; Dietz, G.; Schulz, M. Research Initiative for Numerical and Experimental Studies on High-Speed Stall of Civil Aircraft. J. Aircr. 2022, 60, 3. [Google Scholar] [CrossRef] [Scilit]
- Spinner, S.; Rudnik, R. Experimental assessment of wing lower surface buffet effects induced by the installation of a UHBR nacelle. CEAS Aeronaut. J. 2024, 15, 49–59. [Google Scholar] [CrossRef] [Scilit]
- Waldmann, A.; Ehrle, M.; Kleinert, J.; Yorita, D.; Lutz, T. Mach and Reynolds Number Effects on Transonic Buffet on the XRF-1 Transport Aircraft Wing at Flight Reynolds Number. Exp. Fluids 2023, 64, 102. [Google Scholar] [CrossRef] [Scilit]
- Spinner, S.; Rudnik, R. Vortex Interaction in Transonic Flow for Wing-Mounted UHBR Nacelles. In Proceedings of the AIAA SCITECH 2023 Forum, National Harbor, MD, USA, 23–27 January 2023. [Google Scholar] [CrossRef] [Scilit]
- Yorita, D.; Klein, C.; Henne, U.; Ondrus, V.; Beifuss, U.; Hensch, A.K.; Longo, R.; Guntermann, P.; Quest, J. Successful Application of Cryogenic Pressure Sensitive Paint Technique at ETW. In Proceedings of the 2018 AIAA Aerospace Sciences Meeting, AIAA SciTech Forum, Kissimmee, FL, USA, 8–12 January 2018. [Google Scholar] [CrossRef] [Scilit]
- Klein, C. Time resolved pressure measurements by means of PSP in cryogenic conditions. In Proceedings of the AIAA SCITECH 2022 Forum, San Diego, CA, USA, 3–7 January 2022. [Google Scholar] [CrossRef] [Scilit]
- Fehrs, M. Erstellung eines FE-Modells zur Durchführung gekoppelter CFD-CSM-Simulationen; Internal Report No. DLR-IB-AE-GO-2025-119; Deutsches Zentrum für Luft- und Raumfahrt DLR (German Aerospace Center): Göttingen, Germany, 2025; Available online: https://elib.dlr.de/215770/ (accessed on 13 April 2026).
- Menter, F.R.; Egorov, Y. The Scale-Adaptive Simulation Method for Unsteady Turbulent Flow Predictions. Part 1: Theory and Model Description. Flow, Turbul. Combust. 2010, 85, 113–138. [Google Scholar] [CrossRef] [Scilit]
- Weiner, A. Flowtorch: A Python Library for Analysis and Reduced-Order Modeling of Fluid Flows. GitHub Repository. 2023. Available online: https://github.com/AndreWeiner/flowtorch (accessed on 13 April 2026).
Disclaimer/Publisher’s Note: The statements, opinions and data contained in all publications are solely those of the individual author(s) and contributor(s) and not of MDPI and/or the editor(s). MDPI and/or the editor(s) disclaim responsibility for any injury to people or property resulting from any ideas, methods, instructions or products referred to in the content. |
© 2026 by the authors. Licensee MDPI, Basel, Switzerland. This article is an open access article distributed under the terms and conditions of the Creative Commons Attribution (CC BY) license.