


Abstract
The idea of using air cabs urban mobility is increasingly becoming a reality. In this project, research is conducted on an energy-efficient air conditioning system for an air cab to efficiently combine range and comfort in the cabin. For this, both simulations using a zonal model are conducted, and a thermal air cab demonstrator platform is developed. Measurements in the air cab demonstrator are used to investigate passenger comfort under various climatic conditions, including warm and moderate environments. In addition, the study focuses on evaluating the energetic efficiency of various air conditioning systems such as air cooling and close-to-body climatization. The data analysis compares user comfort and energy efficiency across technologies based on established comfort standards. This allows recommendations for energy-efficient air conditioning to be identified.
1. Introduction
The vision of air transportation for passengers over urban areas is getting closer. Unlike conventional aircraft, new technologies enable the vertical takeoff and landing of electrically powered aircraft (eVTOLs). The technical feasibility can soon be achieved. However, to make this vision a reality, challenges such as economic aspects and social acceptance still need to be overcome [1,2]. Improving energy-efficiency and reducing operating costs play a crucial role in lowering overall costs to make it more affordable for the majority. The potential for optimization is highlighted in [3], which states that on average, 20% of the energy in battery-operated vehicles is needed for air conditioning. However, under unfavorable weather conditions, this share can rise to as much as 60%. An energy-efficient climatization system is not only essential for reducing the total energy consumption and emissions of these systems but also plays a significant role in the thermal comfort of passengers. Dreslin et al. [4] emphasize how important it is to consider human factors in the development of eVTOLs to facilitate the implementation of these aircraft as a means of transport. In addition to improving safety and acceptance, this also includes increasing passenger comfort.
When evaluating the thermal indoor climate of an eVTOL, experiences from the automotive, aircraft, and building sectors can be referenced. In the building sector, the DIN EN ISO 7730 standard [5] is used for a thermal assessment of the indoor climate. The typical climate parameters for aircraft are largely defined by the ASHRAE 161 standard [6]. Experience shows that the recommended amount of air is sufficient for passenger aircraft to balance the internal loads from passengers and systems (e.g., in-flight entertainment), solar gains, and heat conduction gains/losses. When applied to a flying taxi with four passengers, a corresponding air supply rate of 0.0376 m3/s is recommended, based on passenger aircraft design. This amount is significantly lower than what typical vehicle climate control systems provide. In vehicle measurements, depending on the operating point and driving speed, three times [7] to ten times [8] the air exchange is blown in for cooling during the summer. Experiences with air conditioning concepts in smaller aircraft, such as business jets, show that there is also the possibility to switch between low-level and high-level air supply. This allows for the implementation of both displacement and mixed ventilation concepts within the cabin [9].
This study conducts a measurement-based investigation of various climate control systems for the passenger cabin of an eVTOL. The aim is to understand the interactions between energy efficiency and passenger comfort. To this end, a test environment is developed and set up in the form of a demonstrator. The results of this investigation are intended not only to contribute to the optimization of climate control systems in air cabs but also to provide valuable insights for the future development of sustainable urban air mobility solutions.
2. Methods
2.1. Experimental Environment
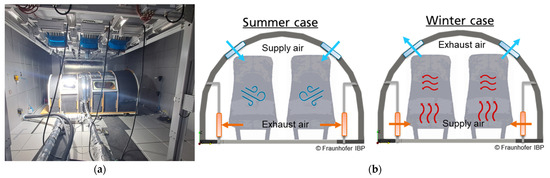
First, a test environment was developed, and a passenger cabin demonstrator was constructed. The cabin is a wooden skeleton structure with external dimensions of 3.3 m × 2.0 m × 1.6 m. The internal volume of the cabin is 2.85 m3. Figure 1a shows the interior and exterior view of the constructed test vehicle. For construction and cost reasons, wood was used instead of lightweight materials. Nevertheless, the thermal properties were considered to achieve realistic heat transfer coefficients (0.77 W/m2K for the walls and 0.45 W/m2K for the floor). The windows are made of thermal insulation glass with a U-value of 1.3 W/m2K.
Figure 1.
Exterior view of the demonstrator in the climate chamber (a) and the schematic ventilation concepts for the summer and winter case (b).
For good air circulation in the passenger cabin, simulations were conducted in advance, and the highest-rated solution was integrated into the demonstrator [10]. An adaptable ventilation system for hot and cold conditions was developed for this purpose. Four ventilation grilles with adjustable slats are installed at the top and bottom, which can function as supply or exhaust openings depending on heating or cooling requirements. In summer, cold air will be blown in from above, as is the case in passenger aircraft. This allows the cold air to sink to the floor and displace the warm air down towards the exhaust outlets. Conversely, in winter, warm air is introduced from below and is extracted from the head area. This ensures comfortable temperatures in the foot area and counteracts strong temperature stratification. The ventilation concept is shown in Figure 1b. A fan in both the supply and exhaust air streams enables controlled ventilation with a defined volumetric flow rate. For tempering the supply air, a heating register or a heat exchanger with a mobile cooling unit is installed in the supply air duct, depending on the supply air temperature.
The local climate control through seat heating or seat ventilation is implemented in two seats in the cabin. These seats can be controlled by a Beckhoff control system and can thus specifically influence the comfort of the passengers. The ventilation of the seat occurs in recirculation mode using a fan located behind the seat. The increased air speeds around the body to create a cooling effect.
The measurements take place in a temperature-controlled climate chamber of Fraunhofer IBP. This testing environment allows for the measurement and evaluation of various air conditioning systems under controlled conditions.
2.2. Experimental Design
In the experimental design, the objectives and the experimental parameters of the trials are established. Additionally, the procedure for data collection and the evaluation of the experimental data is defined. The goal of the measurement investigation is to ensure passenger comfort under stationary and transient boundary conditions. Various factors are considered, such as temperature, humidity, and air velocity within the passenger cabin. For the conduct of the experiments, experimental parameters are established (see Table 1).
Table 1.
List of test parameters for the measurements.
Data collection is carried out through objective measurement data acquisition and can be supplemented by subjective data collection in further investigations to obtain a comprehensive picture of the climate control conditions in the cabin. Sensors are used for continuous monitoring of relevant measurement parameters, capturing temperature, humidity, velocity, heat flux on the surface of the seats. The temperature and humidity sensors measure the air temperature and humidity in the passenger cabin as well as in the supply and exhaust air. Additionally, the volumetric flow rate of the supply and exhaust air is measured using flow probes in the ducts. The measurement system DressMAN [11], developed by Fraunhofer, is used to assess user comfort within the interior. The following measurement sensors are used:
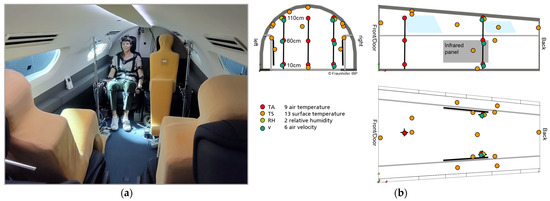
- In the cabin: 9 air temperature sensors and 13 measuring points for surface temperature, 2 air humidity sensors, 6 air velocity sensors (Ahlborn FV A605-TA1; ±1.5%);
- Seat: 6 temperature sensors and 3 heat flux sensors (FluxTeq PHFS-01; ±5%);
- Supply and exhaust air: 4 temperature sensors, 2 humidity sensors, 1 velocity sensor in each duct (Ahlborn FVAD 35 TH5; ±0.01 m/s);
- Ambient conditions: 1 temperature and 1 humidity sensor.
The sensor positions in the cabin are shown in Figure 2b in a schematic drawing and the actual implementation in the demonstrator in Figure 2a. To simulate internal heat loads, three dummies, each with 90 W, are placed on the seats to represent human heat emission. A test person wearing the DressMAN sensors sits on the back left seat (see Figure 2a). During the tests, the minimum required amount of fresh air according to ASHRAE 161 of 7.1 L/s per passenger is used. The supply air rate must be achieved through a mixture of at least 3.5 L/s of fresh air and recirculated air. An overall air rate of 9.4 L/s per passenger is recommended. Another focus is on assessing the energy efficiency of the employed climate control systems. The aim is to compare the systems in terms of their efficiency as well as to identify weaknesses.
Figure 2.
Interior view of the demonstrator with measurement profiles including temperature, humidity and velocity sensors, and the DressMAN sensors on the person (a) and a schematic drawing with sensor positions (b).
2.3. Data Evaluation
The test data are evaluated regarding energy efficiency and user comfort. For this purpose, the energy consumptions of the various air conditioning systems are calculated, and a total consumption is determined. This allows for a comparison of the different systems to identify the most energy-efficient solutions. The user comfort of the individual air conditioning systems is evaluated according to the standards of ASHRAE 161, DIN EN ISO 7730, and DIN EN 14505-2 [12]. The comfort assessment to DIN EN ISO 7730 is based on Fanger’s method and proposes the calculation of a PMV index (Mean Predicted Value) and the corresponding PPD (Predicted Percentage of Dissatisfied). To account for the influence of the seat heating, the additional heat flow over the contact area is included in the calculation of the Mean Predicted Value (PMV).
where M is the metabolic rate, W the external work and MW = M − W the internal heat production in the human body in W/m2. The surface of the body and the contact area with the seat are described by ABody,tot and Acontact. HL represents the heat flows from the body (HL1: heat loss skin; HL2: heat loss sweating; HL3: latent respiration heat loss; HL4: dry respiration heat loss; HL5: heat loss radiation; HL6: heat loss convection) and HeatfluxSeat is the added heat flow through the seat in W/m2. The PMV is used to assess whether the user perceives the thermal conditions as neutral, too warm (positive values) or too cold (negative values). A PMV of 0 corresponds to neutral comfort. Values between −0.5 and +0.5 are considered comfortable, equivalent to 10% dissatisfaction (PPD). DIN EN 14505-2 deals with the assessment of thermal conditions in a vehicle. Here, a total equivalent temperature is used for the evaluation. Equivalent temperature can be recorded in measurements using the DressMAN system [11]. In ASHRAE 161 and DIN EN ISO 7730, comfort is assessed based on defined comfort zones in terms of temperature and air flow (see Table 2).
Table 2.
Parameters for comfort assessment based on ASHRAE 161, DIN EN ISO 7730 and DINEN 14505-2.
3. Results
The measurement data are evaluated for the respective climatic conditions for a hot and moderate climate. The focus is on the seat located at the back left (see Figure 2a). The seat is equipped with seat ventilation. In the summer cases, the seat is also exposed to solar radiation through the window.
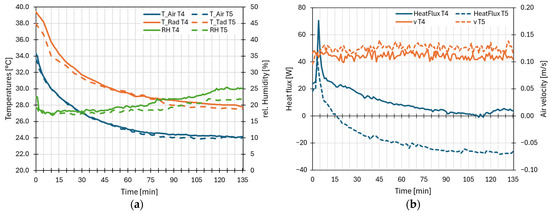
The displayed air temperatures are averages of the measured temperatures at the profile next to the person (at heights of 10 cm, 60 cm, and 110 cm). The radiation temperature is a weighted average of the surrounding surface temperatures. The air humidity is also measured at the profile next to the person at a height of 110 cm. The curves for the heat flows are derived from an averaging of the three heat flow sensors on the seat. The air velocities are also measured at 10 cm, 60 cm, and 110 cm next to the person and then averaged. The data is recorded at intervals of either 1 s or 10 s and averaged to obtain minute values. Based on the measurement data, the PMV and PPD curves are calculated.
3.1. Hot Climate
The hot climatic conditions occurred at 40 °C and with 900 W/m2 solar radiation directed unilaterally at the windows on the side of the seating evaluation. Two experiments were conducted. In the first experiment, the cabin was cooled with pure air cooling (T4). In the second experiment, seat ventilation (80% setting) was added to the air temperature control (T5). The diagrams in Figure 3 show the measured air and radiation temperatures, air humidity, as well as the heat flow over the seat and the air velocities in comparison.
Figure 3.
Measuring curves showing (a) temperature and humidity and (b) air velocities and heat fluxes to the seat for the summer cases (T4 without and T5 with seat ventilation).
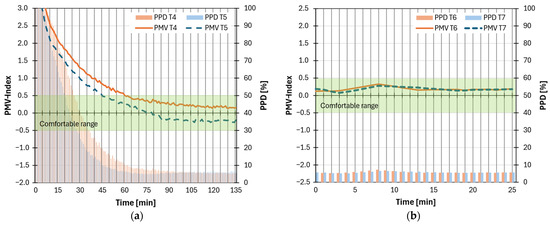
In Figure 3a, similar trends in radiation and air temperature as well as relative humidity can be seen. On the other hand, in Figure 3b are clear differences, particularly in the heat flow between the person and the seat. Seat ventilation allows more heat to be dissipated via the seat. Air velocities tend to be slightly higher than in test T4 without seat ventilation. These measured curves also serve as input values for the PMV calculation according to (1). The PMV calculation curve is depicted in Figure 4a. Summer clothing was considered in the calculation (clothing insulation = 0.5 clo).
Figure 4.
PMV and PPD curves for (a) summer cases (T4 without and T5 with seat ventilation) and for (b) moderate cases (T6 without and T7 with seat ventilation).
The comfortable range (−0.5 < PMV < 0.5) is reached without seat ventilation after 61 min. If local air conditioning through seat ventilation is added for air cooling, the time is reduced to 45 min, which corresponds to a reduction of 26%. Furthermore, in steady state (90–135 min), the PMV index can be lowered by approximately 0.5. This allows the air temperature to be increased by 1.5 °C, thus saving energy for air cooling.
To make statements about energy efficiency, the power that is necessary to cool an air flow rate of 37.6 L/s (4 passengers) by 1 °C is calculated. A power of 45.3 W is required for this. Since seat ventilation can increase the temperature by 1.5 °C, a saving of 68.0 W can be achieved through air cooling. In comparison, the recirculation fan for seat ventilation (recirculation fan 80%) requires a power of 1.5 W. Thus, a total energy saving of 66.5 W can be achieved through air cooling with the support of seat ventilation.
3.2. Moderate Climate
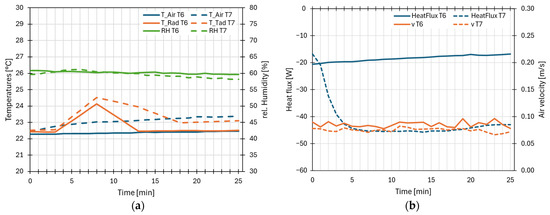
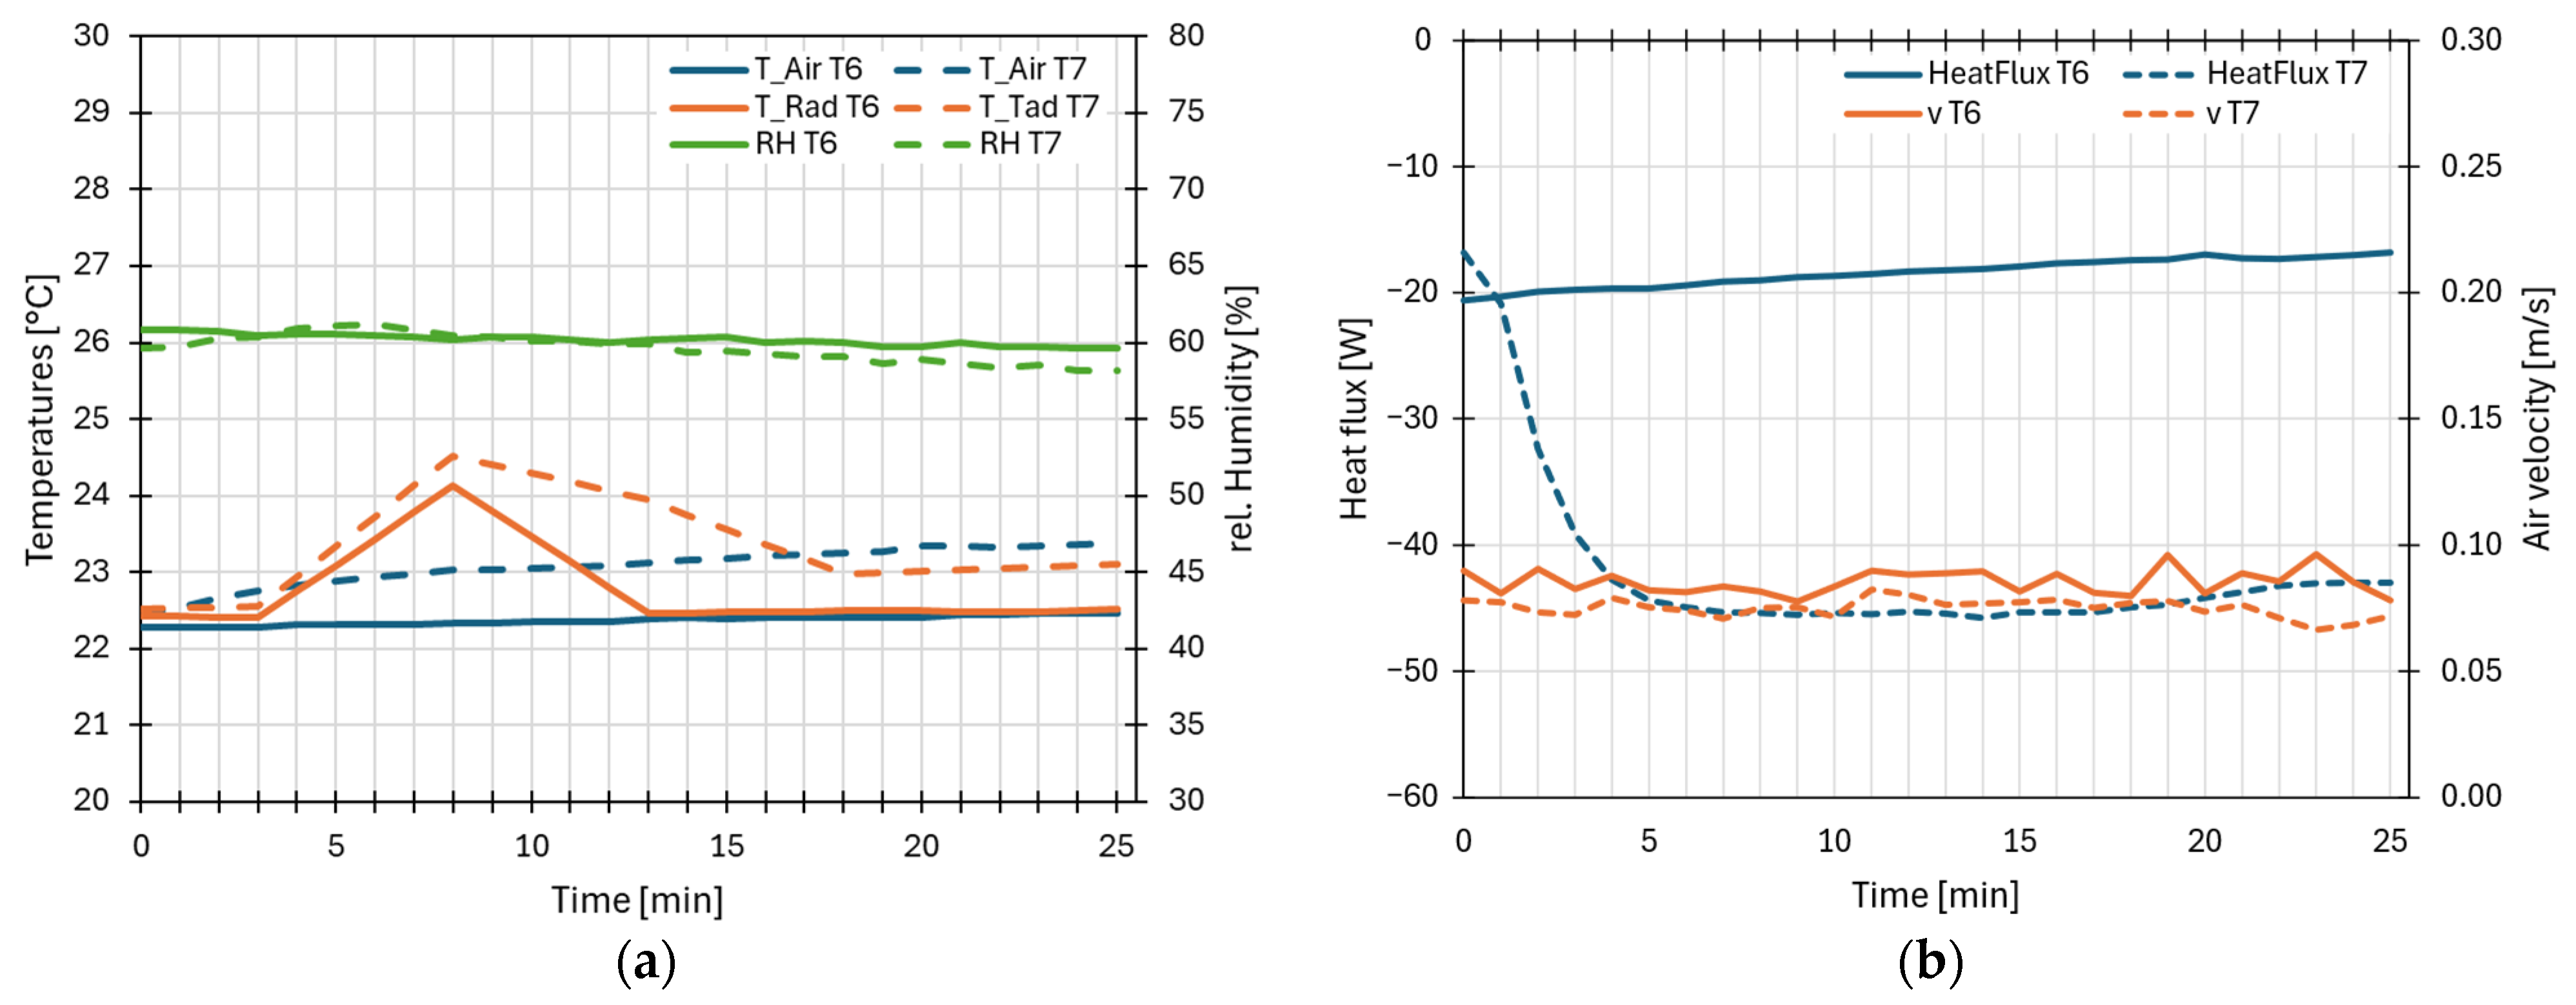
The moderate climate exclusively covers the stationary case at ambient temperatures of 10 °C. Despite the low outside temperature and the resulting heat losses through the cabin envelope, the internal heat loads from the occupants in the cabin prevail, requiring the supply air temperature to be lower than the cabin temperature. One test was conducted with a supply air temperature of 18.0 °C and without seat ventilation (T6), followed by another experiment with a higher supply air temperature of 19.5 °C and seat ventilation (recirculation fan 70%) (T7). The graphs presented in Figure 5 display the recorded air and radiation temperatures, air humidity, heat transfer across the seat and the air velocities of both cases. The graphs show differences in air and radiation temperatures within the cabin, which can be attributed to the varying supply air temperatures. The effects of seat ventilation on the heat flow over the seat are also clear. Relative humidity and air velocity exhibit similar values and trends. Additionally, the PMV and PPD indices are calculated from these parameters. Under these climatic conditions, a standard clothing assumption with a clothing insulation value of 1.0 clo is made for the PMV index calculation. The curves of the comfort assessment parameters are illustrated in Figure 4b.
Figure 5.
Measuring curves showing (a) temperature and humidity and (b) air velocities and heat fluxes for the moderate cases (T6 without and T7 with seat ventilation).
In the PMV analysis, it is evident that the indoor climate in the cabin can be classified as comfortable during the test period. In both cases, the PMV and thus the proportion of dissatisfied individuals (PPD) are approximately the same. The 1.5 °C higher air temperature is compensated by the seat ventilation, so the PMV index does not change. When looking at the power consumption, the same values arise as in the summer cases (see Section 3.1 Hot climate). The temperature increase of 1.5 °C corresponds to the results under hot conditions. Through seat ventilation, the cabin temperature can be increased allowing for the outside supply air to generate an additional heat sink for other systems requiring cooling and subsequently this could lead to an overall energetic improvement.
4. Discussion and Conclusions
In this study, tests were conducted to evaluate the efficiency and comfort of a ventilation concept for the passenger cabins of eVTOLs. The construction of a demonstrator for the passenger cabin allowed for the testing of various cooling scenarios. Additionally, further measurements are planned to assess the effectiveness of the ventilation system with air heating, seat heating, and infrared heating under cold ambient conditions. This will enable a comprehensive evaluation of the adaptable ventilation system for eVTOLs. The use of localized climate control technologies under hot and moderate climate conditions demonstrated advantages in several key areas. One benefit is the reduction in the time to comfort through seat ventilation by 16 min in hot climate conditions. This is relevant for both passenger satisfaction and efficient operation during ground and flight times. It should be noted that the measurements were conducted with the minimum fresh air rate according to ASHRAE 161. By increasing the supply air flow rate, the cooling time of 45 or 61 min can be further reduced. Furthermore, thermal comfort can be improved by a PMV index reduction of 0.5 due to seat ventilation. This allows for the compensation for higher air temperatures (1.5 °C). Consequently, not only can comfort be increased, but energy consumption can also be reduced by 67 W. Overall, the results provide valuable insights into passenger cabin ventilation and support the development of more comfortable and efficient aircraft.
Author Contributions
Conceptualization, C.M. and V.N.; methodology, C.M.; validation, C.M. and V.N.; formal analysis, C.M.; investigation, C.M.; data curation, C.M. and M.V.; writing—original draft preparation, C.M.; writing—review and editing, V.N.; visualization, C.M.; supervision, V.N.; project administration, V.N.; funding acquisition, V.N. All authors have read and agreed to the published version of the manuscript.
Funding
This research was funded by the Bavarian Ministry of Economic Affairs, Regional Development and Energy, FKZ HAM-2208-0027.
Institutional Review Board Statement
Not applicable.
Informed Consent Statement
Not applicable.
Data Availability Statement
The data presented in this study are available on request from the corresponding author.
Acknowledgments
We would like to thank Marie Pschirer, Maximilian Kienberger, Roman Baldini and Alexander Stephan for technical and practical assistance with the experiments.
Conflicts of Interest
The authors declare no conflicts of interest. The funders had no role in the design of the study; in the collection, analyses, or interpretation of data; or in the writing of the manuscript.
Abbreviations
The following abbreviations are used in this manuscript:
| IBP | Fraunhofer Institute for Building Physics |
| PMV | Predicted Mean Vote |
| PPD | Predicted Percentage of Dissatisfied |
References
- Pak, H.; Asmer, L.; Kokus, P.; Schuchardt, B.I.; End, A.; Meller, F.; Schweiger, K.; Torens, C.; Barzantny, C.; Becker, D.; et al. Can Urban Air Mobility become reality? Opportunities and challenges of UAM as innovative mode of transport and DLR contribution to ongoing research. CEAS Aeronaut. J. 2024, 16, 665–695. [Google Scholar] [CrossRef] [Scilit]
- Shahriar Ahmed, S.; Fountas, G.; Lurkin, V.; Anastasopoulos, P.C.; Zhang, Y.; Bierlaire, M.; Mannering, F. The State of Urban Air Mobility Research: An Assessment of Challenges and Opportunities. IEEE Trans. Intell. Transport. Syst. 2025, 26, 1375–1394. [Google Scholar] [CrossRef] [Scilit]
- Lahlou, A.; Ossart, F.; Boudard, E.; Roy, F.; Bakhouya, M. Optimal Management of Thermal Comfort and Driving Range in Electric Vehicles. Energies 2020, 13, 4471. [Google Scholar] [CrossRef] [Scilit]
- Dreslin, B.D.; Falanga, M.C.; Mai Ngam, J.; Chaparro, A.; Chaparro, B.S. Up in the Air: A Human Factors Approach to Enhancing eVTOL Passenger Experience. In Proceedings of the National Training Aircraft Symposium (NTAS), Daytona Beach, FL, USA, 27 February 2024. [Google Scholar]
- DIN EN ISO 7730; Ergonomics of the Thermal Environment—Analytical Determination and Interpretation of Thermal Comfort Using Calculation of the PMV and PPD Indices and Local Thermal Comfort Criteria (ISO 7730:2025). Beuth Verlag: Berlin, Germany, 2025.
- ASHRAE Standard 161; Air Quality within Commercial Aircraft; American National Standards Institute: Atlanta, GA, USA, 2023.
- Zhou, X.; Lai, D.; Chen, Q. Experimental investigation of thermal comfort in a passenger car under driving conditions. Build. Environ. 2019, 149, 109–119. [Google Scholar] [CrossRef] [Scilit]
- Jahn, P.B. Modellbasierte Applikation der Klimaregelung für Thermischen Komfort im Fahrzeug; Technische Universität München: Munich, Germany, 2021. [Google Scholar]
- Norrefeldt, V.; Pathak, A.; Lemouedda, A.; Siede, M.; Grün, G. Validation of the zonal thermal model VEPZO/RADZO for cold outside conditions on a business jet mock-up. In Proceedings of the AST 2015, Hamburg, Germany, 24–25 February 2025. [Google Scholar]
- Matheis, C.; Norrefeldt, V. Untersuchung Einer Energieeffizienten Klimatisierung eines EVTOLs Durch ein Zonales Raumkabinenmodell und Einen Kabinendemonstrator; Deutsche Gesellschaft Für Luft-und Raumfahrt—Lilienthal-Oberth e.V.: Bonn, Germany, 2024. [Google Scholar]
- Visser, M.; Park, S.; Stratbücker, S.; Norrefeldt, V.; Lindner, A. The DressMAN 3.2-System for evaluation of thermal comfort in the Passenger Cabin Ground Demonstrator. IOP Conf. Ser. Mater. Sci. Eng. 2022, 1226, 12114. [Google Scholar] [CrossRef] [Scilit]
- DIN EN 14505-2; Ergonomics of the Thermal Environment—Evaluation of Thermal Environments in Vehicles—Part 2: Determination of Equivalent Temperature (ISO 14505-2:2006). Beuth Verlag: Berlin, Germany, 2007.

Disclaimer/Publisher’s Note: The statements, opinions and data contained in all publications are solely those of the individual author(s) and contributor(s) and not of MDPI and/or the editor(s). MDPI and/or the editor(s) disclaim responsibility for any injury to people or property resulting from any ideas, methods, instructions or products referred to in the content. |
© 2026 by the authors. Licensee MDPI, Basel, Switzerland. This article is an open access article distributed under the terms and conditions of the Creative Commons Attribution (CC BY) license.