


Abstract
This paper presents a web-based visual analytics framework for robust multi-objective aircraft wing design. Aerodynamic and structural simulation data are generated for a redesigned CRM wing, with aspect ratio and skin root thickness as key variables. Ordinary Kriging surrogates are coupled with NSGA-III to explore trade-offs among lift-to-drag ratio, wing mass, and range. Input design uncertainties are propagated using Monte Carlo Simulation with Halton sampling, enabling low-cost robustness assessment. An interactive HTML–Python dashboard provides contour plots, sampled design points, and Pareto fronts, allowing engineers to perform what-if analyses and rapidly identify robust Pareto-optimal designs. Results show that a higher aspect ratio with lower skin thickness improves aerodynamic efficiency and range, while structural constraints and uncertainty bounds define feasible regions. The Kriging surrogate achieves a Surrogate Speed-Up Index (SSI) of , offering comparable insight into wing mass, range, and at roughly three-orders-of-magnitude-lower computational cost than direct mid-fidelity simulations.
1. Introduction
In engineering design, decisions must balance conflicting objectives, handle heterogeneous data, and account for uncertainty from incomplete or noisy information [1]. Aircraft design is especially challenging because aerodynamics, structures, propulsion, and acoustics are tightly coupled, while small efficiency or mass improvements can yield major economic and environmental benefits if safety and reliability are maintained [2]. Traditional MDO workflows often struggle to communicate trade-offs (e.g., lift-to-drag ratio, structural capacity, and fuel consumption) to diverse stakeholders. Visual analytics (VA), multi-objective optimisation (MOO) and uncertainty quantification (UQ) together provide a strong foundation for robust, data-driven aircraft design [3,4].
Early MDO frameworks used surrogate models and deterministic optimisation to speed up simulation-based analysis [5], but had limited capability to quantify and propagate uncertainty from manufacturing tolerances or incomplete physics [6]. More recent work introduced probabilistic and robust optimisation [4], alongside visual analytics for large heterogeneous datasets. Keim et al. [7] describe VA as integrating visualisation, data mining, human factors, and statistics; Piotrowski et al. [8] and Kipouros et al. [9] show that parallel coordinates and linked plots can reveal structure in high-dimensional engineering design spaces. Sacha [3] further formalises a knowledge generation model separating computer-side analysis from human-side exploration, verification, and insight formation.
Despite these advances, few systems integrate MDO, robust multi-objective optimisation with UQ, and visual analytics into a single end-to-end decision environment for aircraft design. Many studies focus on only one aspect (e.g., surrogate modelling or interactive visualisation), without leveraging the synergy of coupling different capabilities. To address this gap, we propose an open, visual-analytics-driven framework for robust multi-objective aircraft wing design, combining aerodynamic and structural data within surrogate-based NSGA-III optimisation and propagating uncertainty through Kriging models to assess Pareto-solution robustness. A web-based dashboard implements Sacha’s knowledge generation model [3], enabling domain experts to explore Pareto fronts, inspect uncertainty propagation, and perform what-if analyses in the browser without requiring expertise in optimisation algorithms or backend code. Although demonstrated for an aircraft wing, the framework is general and applicable to other engineering domains.
The paper is organised as follows. Section 2 describes the methodology of the current study. Section 3 introduces the aircraft wing geometry. Section 4 reports results obtained with the web-based tool and discusses the implications of the proposed framework. Finally, Section 5 summarises key findings and suggests directions for future research.
2. Methodology
2.1. Overall Workflow
Initially, multi-disciplinary simulation data is generated based on user requirements and processed through the visual analytics workflow (Figure 1). Aerodynamic and structural outputs are then merged, normalised, and stored in a unified repository, on which Kriging surrogates are trained. These surrogates drive the NSGA-III MOO model to explore trade-offs (e.g., lift-to-drag ratio vs. structural weight) and obtain Pareto-optimal designs. Robust design is incorporated through uncertainty quantification by perturbing key inputs (e.g., wing aspect ratio and skin root thickness) and assessing candidate feasibility. Finally, an HTML- and Python-based web interface provides interactive plots (e.g., Kriging surfaces, Pareto fronts, and parallel coordinates), allowing users to upload data, inspect and filter solutions, and iteratively refine designs in a visual analytics environment.
Figure 1.
System-level overview of the proposed visual analytics framework.
2.2. Models Employed
Only single-fidelity data are utilised to show the fast iterative process of the framework. However, the framework can easily accommodate multi-fidelity or even experimental data.
- Aerodynamic solver: The lifting line method is adopted to compute the aerodynamic forces and the flow field around the wing. Prior studies have confirmed its accuracy and efficiency for low-Reynolds-number rotor configurations [10,11,12]. This model is based on simplifying assumptions (e.g., inviscid, predominantly attached flow, and linearised sectional aerodynamics) that limit fidelity in strongly 3D, separated, or near-stall conditions. It also does not resolve viscous effects, shock-related transonic phenomena, or detailed local flow features, so absolute predictions should be interpreted as low-/mid-fidelity trends rather than high-fidelity performance estimates.
- Structural solver: Structural analysis in QBlade is performed by leveraging the finite element (FE) capabilities of the open-source multi-physics engine Project Chrono [13,14]. The FE-based structural model relies on modelling simplifications, such as idealised boundary conditions, simplified load transfer, and linear-elastic assumptions, to enable rapid analysis. It does not include full aeroelastic coupling (e.g., deformation feedback into aerodynamics), nor detailed nonlinear phenomena such as local buckling, material nonlinearity, or joint/fastener-level effects.
- Ordinary Kriging surrogate model: Ordinary Kriging assumes that nearby points in the design space have similar functional values, with their correlation governed by a parametric kernel across each input dimension [15].
- Monte Carlo Simulation (MCS): Monte Carlo Simulation (MCS) is a non-intrusive method for propagating uncertainty by repeatedly evaluating a deterministic model with inputs sampled from prescribed probability distributions [16]. The resulting output ensemble is then used to estimate statistics such as mean and variance [17].
- NSGA-III (multi-objective optimisation): NSGA-III is an extension of the NSGA-II evolutionary algorithm designed to handle many-objective optimisation problems where conventional diversity mechanisms, such as crowding distance, become ineffective [4].
2.3. Full-Stack Web-Based Architecture
The visual analytics framework couples a lightweight web-based frontend with a computational backend for Kriging-based uncertainty and optimisation calculations.
2.3.1. Frontend: Interactive Visualisation Layer
The frontend supports a simple workflow: upload data, explore it in multi-dimensional views, and generate interpolated response surfaces. Excel and CSV files are parsed client-side using SheetJS and the FileReader API, so proprietary datasets remain in the browser. Parsed and validated data are stored in React state and shown in interactive Plotly views, including parallel-coordinate plots and Kriging-based contour plots. All plots can be exported directly from the browser (e.g., PNG and EPS) for reports and publications.
2.3.2. Backend (Computational Layer): Data Processing and Kriging
Although deployed as a single-page web application, the system includes a computational backend that currently runs entirely in JavaScript to simplify deployment and preserve data confidentiality. The backend pipeline proceeds from file upload and binary reading, through XLSX parsing and header extraction, to a standard preprocessing stage prior to surrogate modelling. This preprocessing includes numeric conversion and validation, exclusion (or user warning) for rows with missing values in the selected input/output variables, and column-wise normalisation (e.g., min–max scaling over the available dataset) to improve numerical conditioning and to make variables with different physical units comparable. Missing values are not imputed in the current version; affected rows are excluded from surrogate training. And constant columns are detected and skipped from scaling to avoid a divide by zero.
The cleaned and normalised dataset is then stored in shared state and passed to the Kriging module, which performs grid-based prediction for visualisation and downstream analysis. The predicted response surfaces are subsequently returned to the Plotly-based display layer for interactive exploration.
2.4. Knowledge Generation Model and Decision-Making Environment
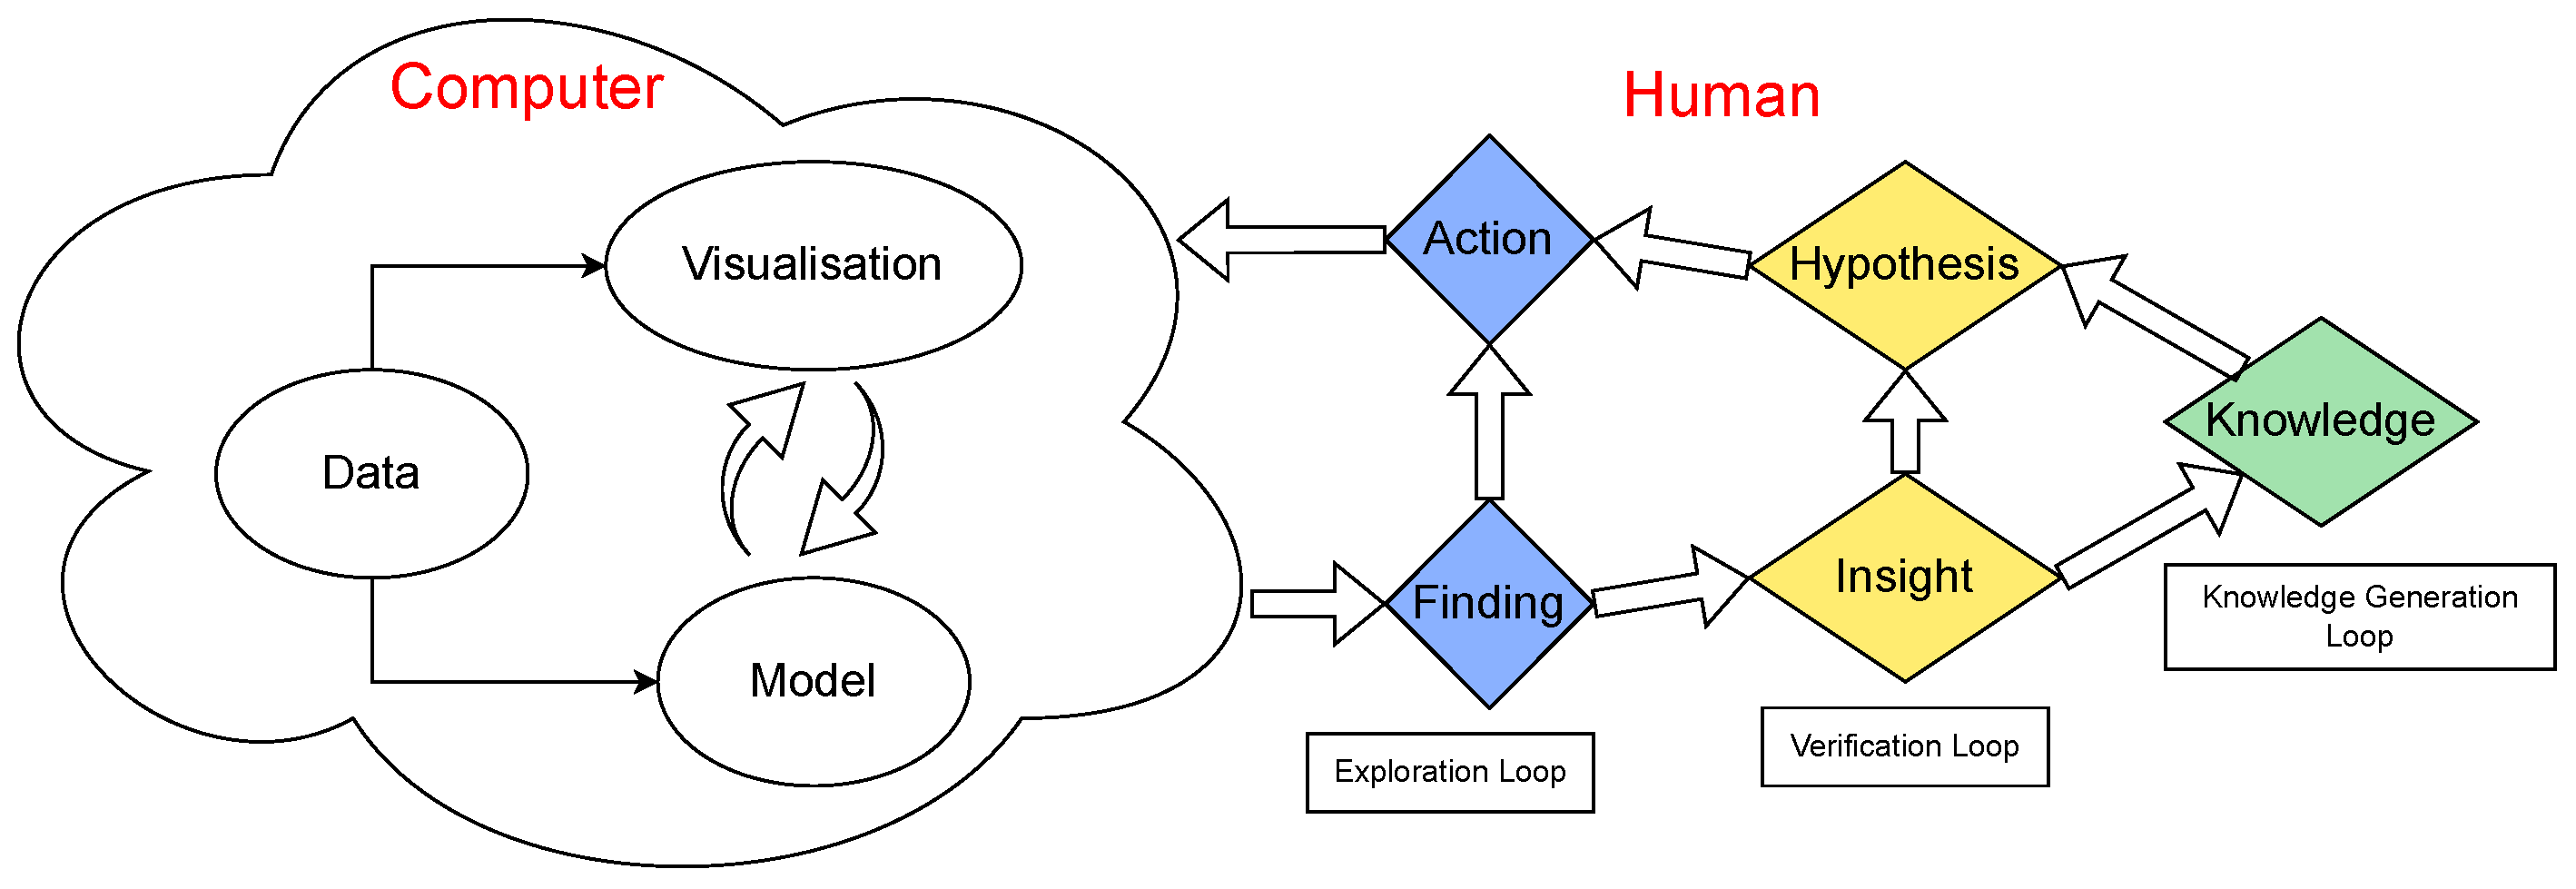
Figure 2 presents this study’s iterative knowledge generation model, extended from Sacha’s framework [3]. It integrates human reasoning with computational processes by cycling through exploration, verification, and knowledge loops. Our context involves multi-disciplinary multi-objective optimisation of an aircraft wing, focusing on aspect ratio and skin root thickness as key design parameters, while lift/drag ratio, wing mass, and range serve as primary objectives [18].
Figure 2.
Knowledge generation model for visual analytics.
In the exploration loop, aerodynamic and structural simulation data are processed into surrogate-based NSGA-III outputs, including Pareto fronts and correlation plots. Users interact with these visualisations by adjusting variables such as aspect ratio and observing their effects on lift/drag or wing mass. This supports the discovery of trends, for example, improved aerodynamic efficiency with a higher aspect ratio but increased structural weight.
In the verification loop, hypotheses formed during exploration (e.g., whether a thicker skin root improves the lift/drag trade-off under higher loads) are tested using additional simulations or refined surrogate analyses. The system flags potential constraint violations (e.g., excessive wing mass) and highlights affected regions of the design space in updated dashboards, helping ensure design feasibility.
Finally, in the knowledge generation loop, verified insights (e.g., favourable thickness ranges that balance mass and aerodynamic efficiency) are consolidated into actionable design knowledge. This can support the selection of Pareto-optimal configurations for further prototyping or motivate new parametric studies around promising aspect-ratio and skin-thickness combinations. Iterating through these loops continuously refines both design strategy and domain understanding.
3. Numerical Setup
Wing Geometry and Flow Conditions
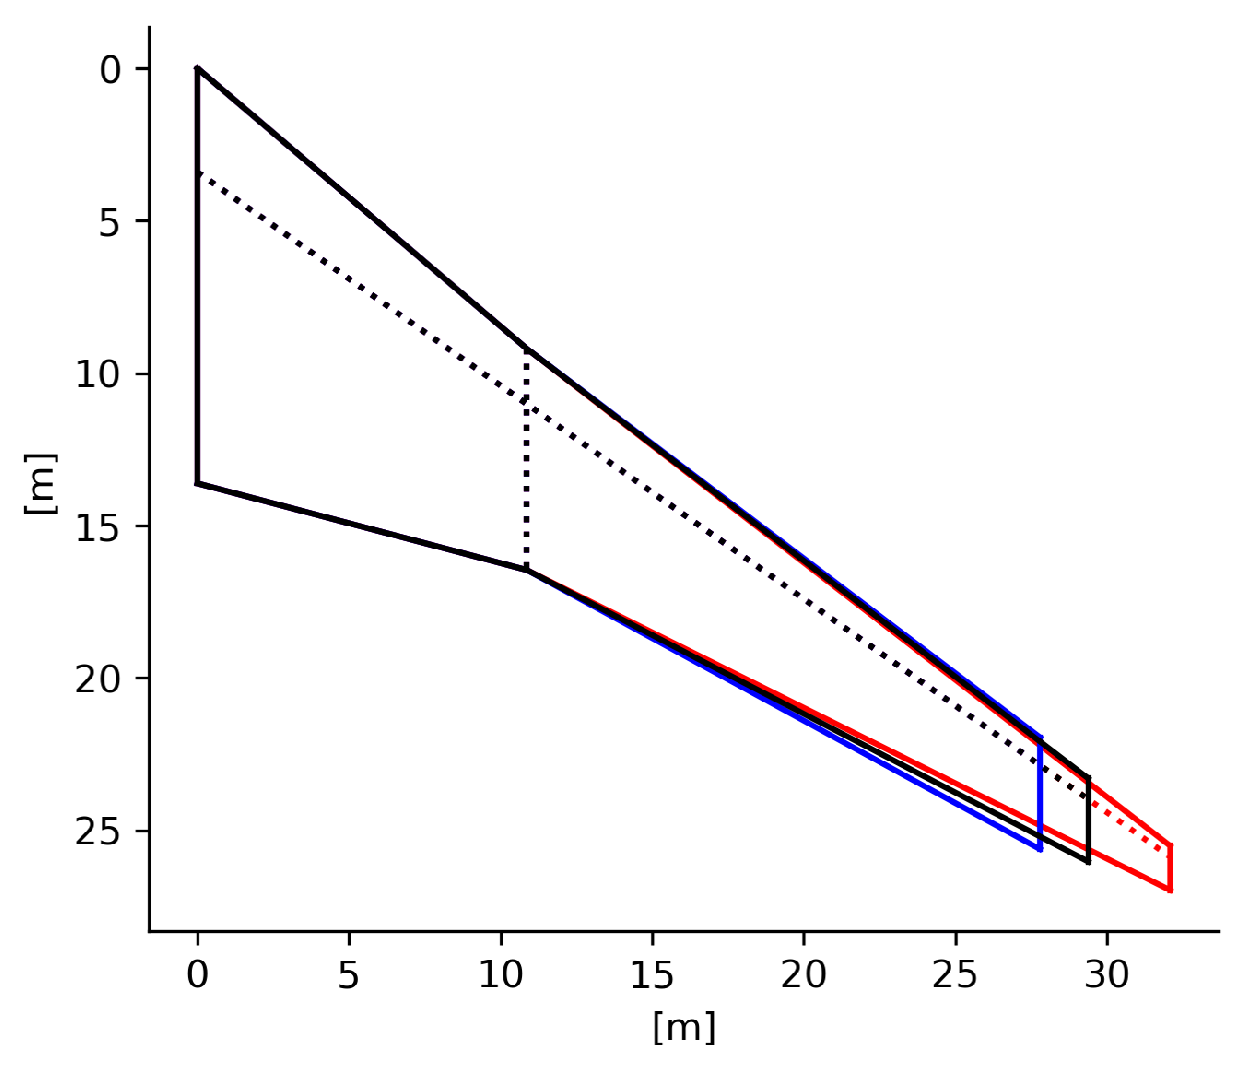
The CRM wing is used (Figure 3), using the baseline geometry and aerodynamic data from Vassberg et al. [2]. The wing portion beyond the crank is rescaled to vary aspect ratio, and the skin-thickness distribution is derived from the baseline root thickness. Aspect ratio is varied between 7 and 12, and skin root thickness between 5 and 30. The resulting design space is sampled using 100 Latin Hypercube points under uniform distributions. Throughout the study, true airspeed is fixed at 240 m/s and angle of attack at 0°.
Figure 3.
Top view of the baseline CRM wing, with two modifications highlighted in blue and red.
4. Results
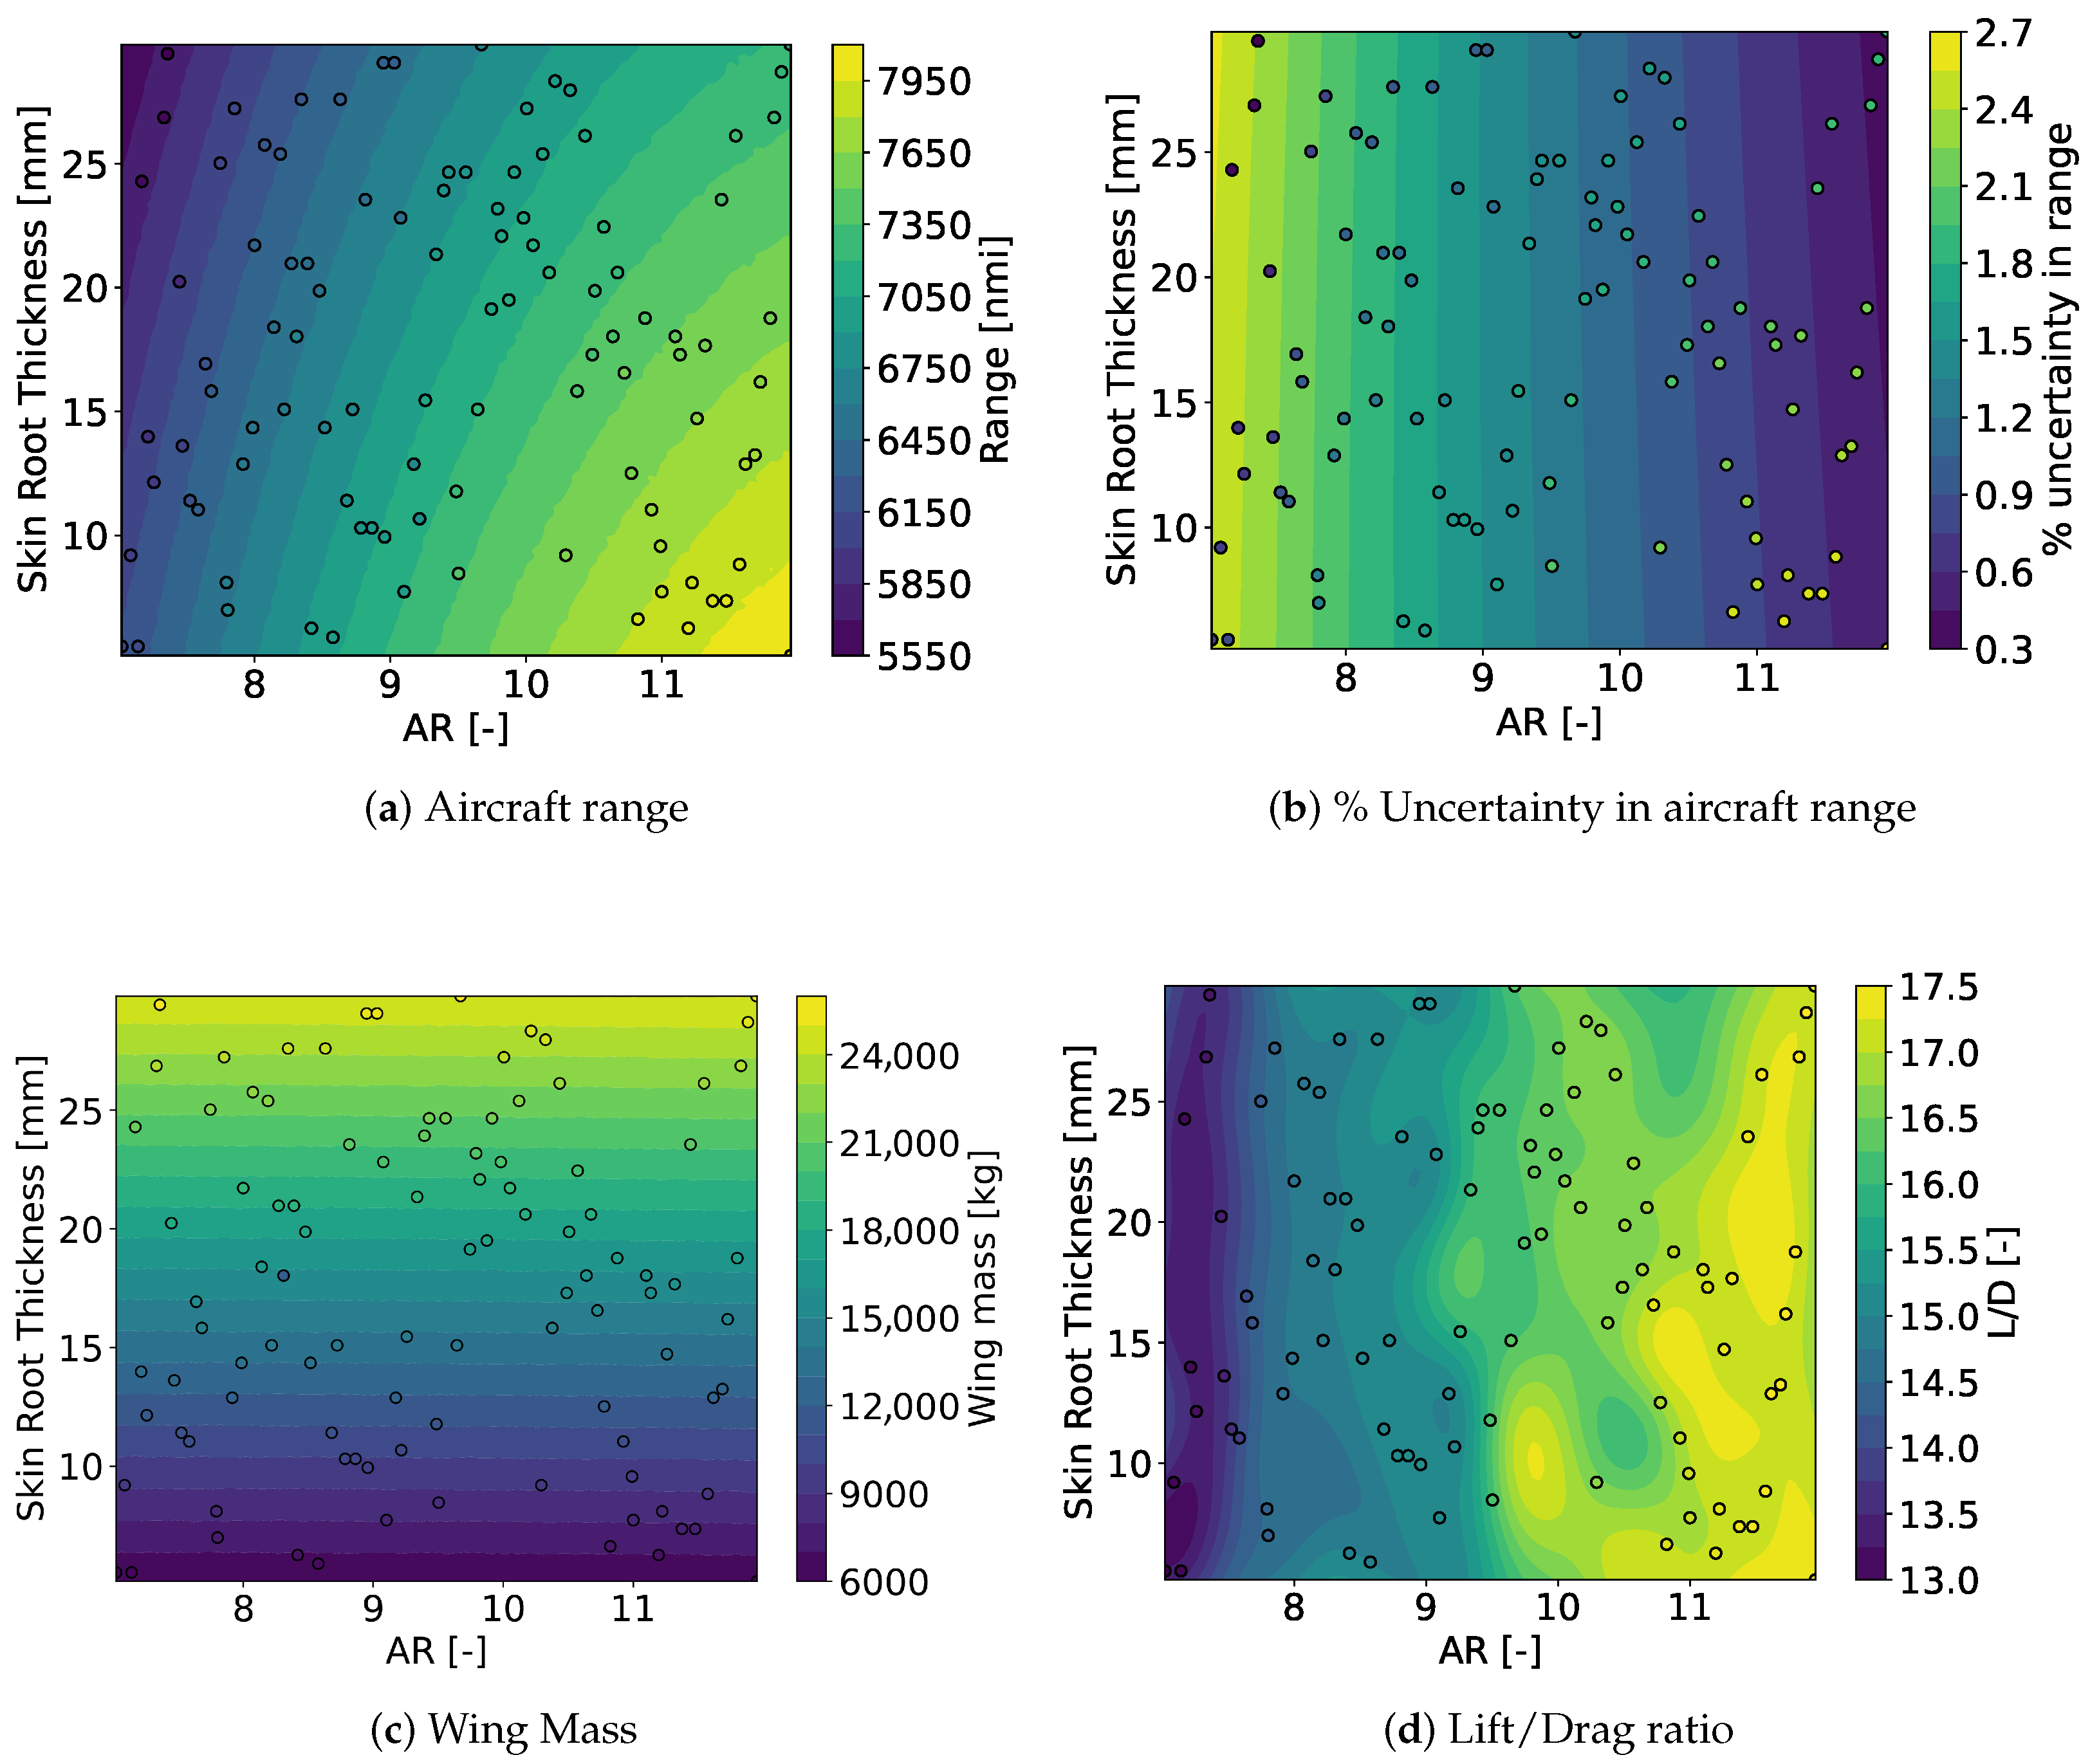
Figure 4 presents four surrogate model contour plots for aircraft range, wing mass, and L/D ratio and uncertainties corresponding to aircraft range. The range uncertainty plot shows the performance uncertainty expected for any combination of the design points.
Figure 4.
2D Kriging surrogate model results using initial data provided by the user and % uncertainty obtained for the 2D design space; AR—aspect ratio.
The simulation data were uploaded to the interactive dashboard, and 2D Kriging plots were generated. The L/D ratio is obtained from the aerodynamic model and wing mass from the structural model, while aircraft range is interpreted using the Breguet range equation [19]. In Figure 4a, the surrogate indicates that higher aspect ratios and lower skin thickness increase flight range. Figure 4b shows comparatively low percentage uncertainty at large aspect ratios, while skin thickness has a limited effect on uncertainty (or confidence level). Thus, the results suggest an optimised wing design with a higher aspect ratio and lower skin thickness, potentially requiring stronger manufacturing materials.
For wing mass (Figure 4c), mass is relatively insensitive to aspect ratio but increases with skin root thickness, as expected structurally. The L/D ratio in Figure 4d generally increases with aspect ratio and shows limited sensitivity to skin thickness. These regions, therefore, indicate aspect-ratio/skin-thickness combinations that can deliver high aerodynamic performance with acceptable confidence intervals.
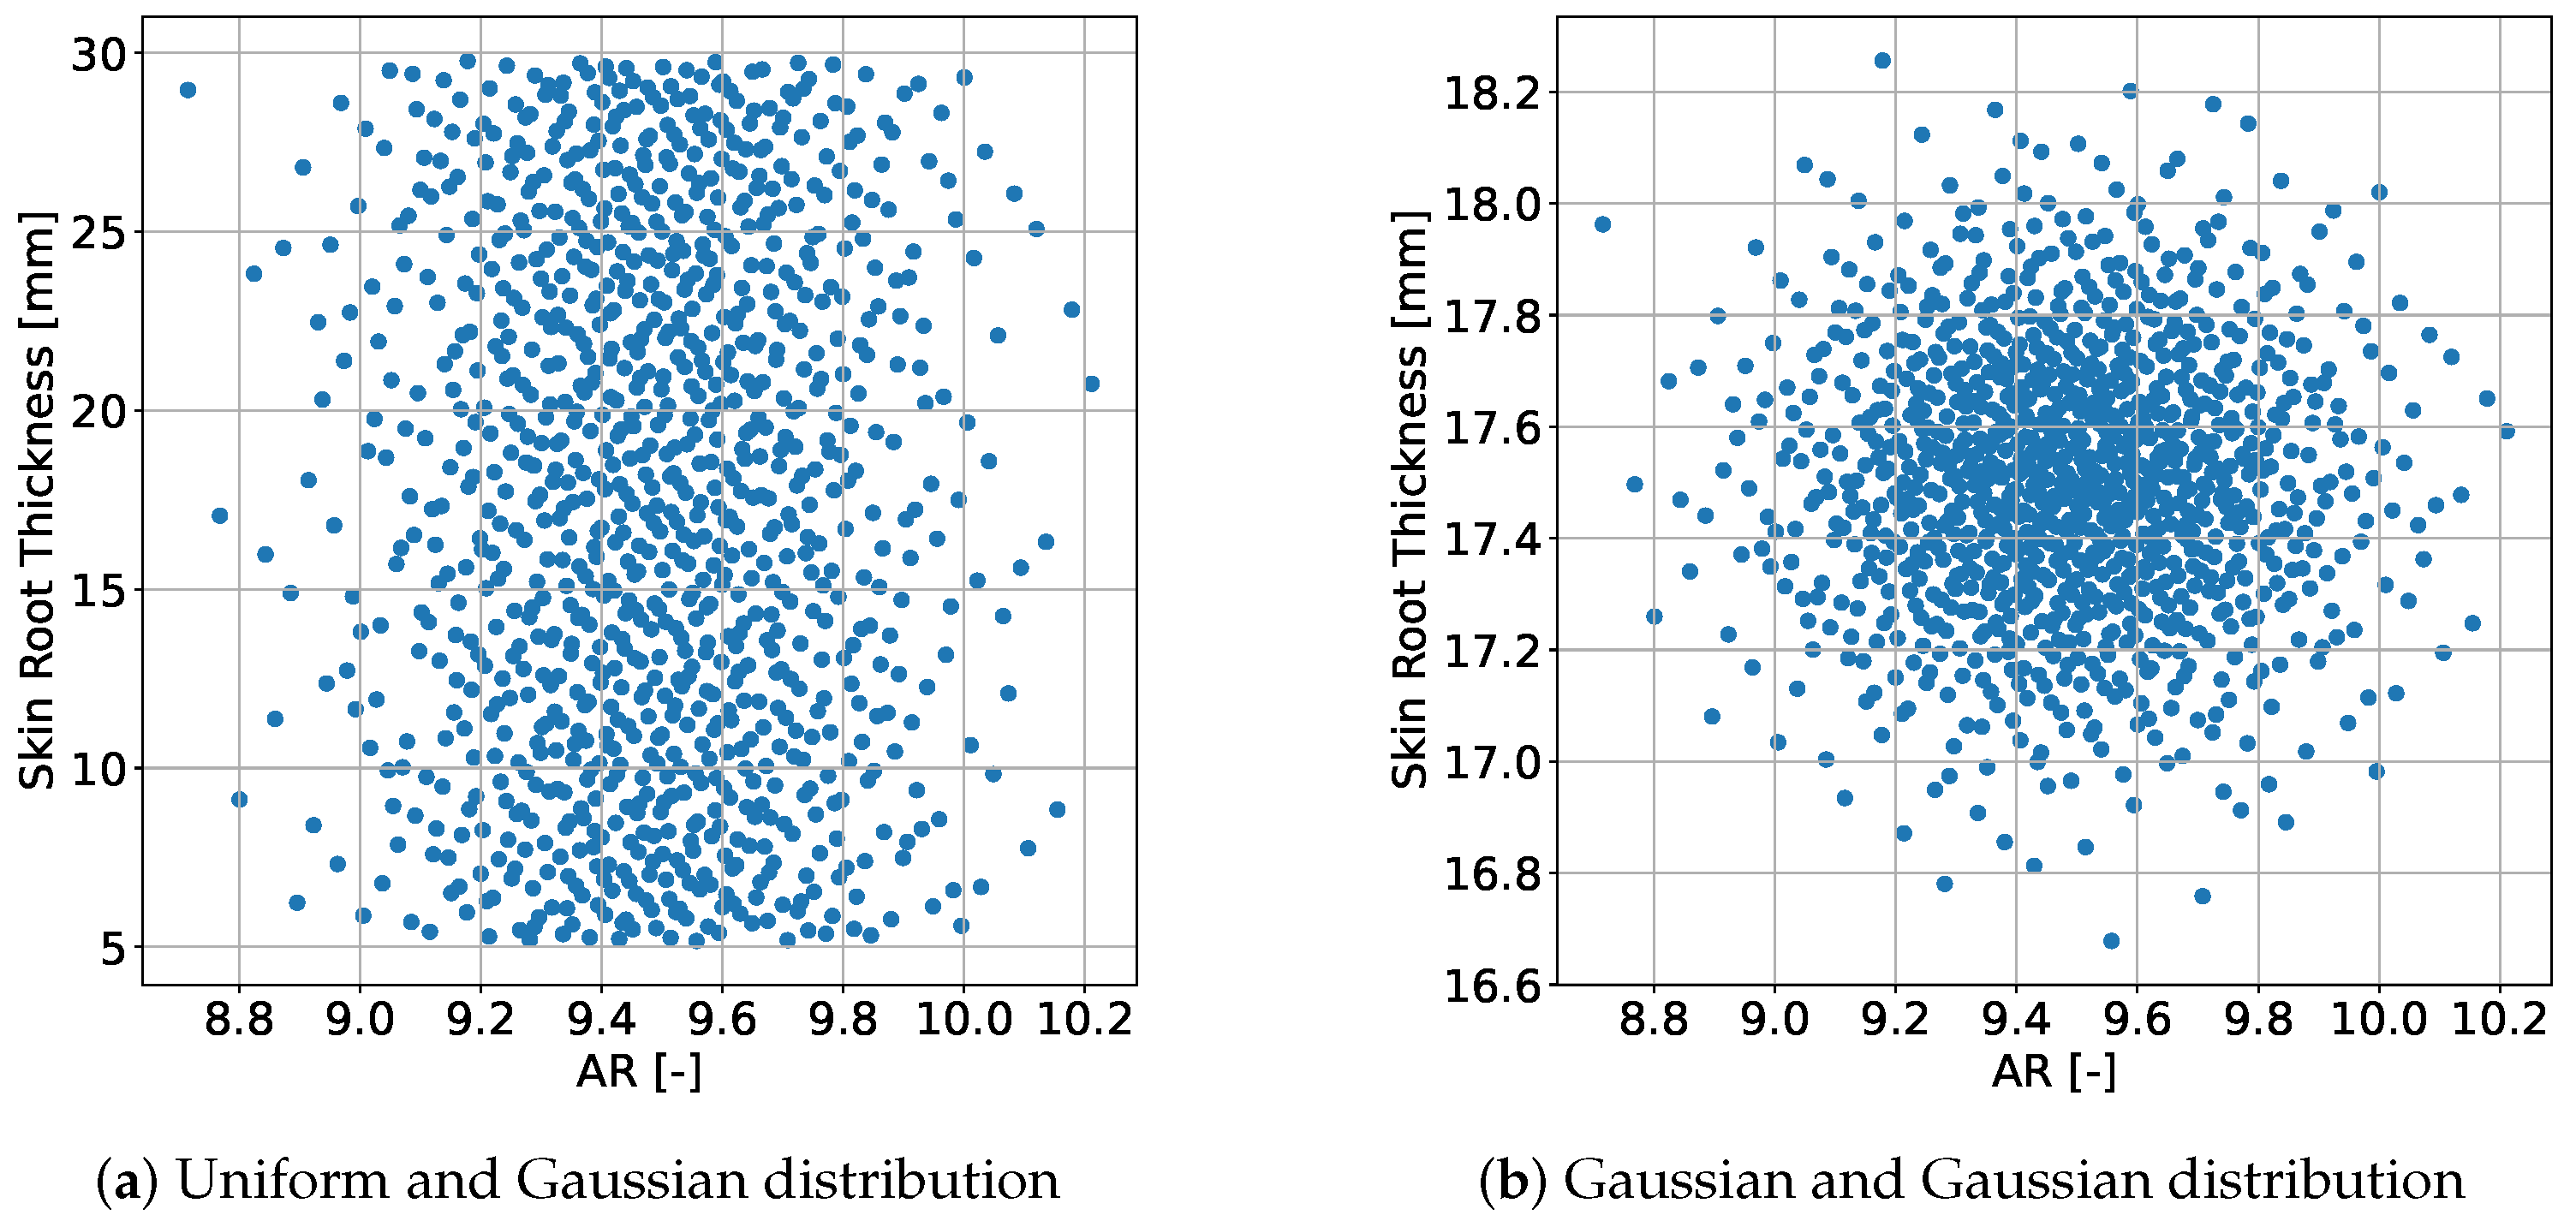
Figure 5 illustrates quasi-random Halton sampling options exposed in the dashboard. Halton sampling was selected as the default in this study because, for the low-dimensional (two design variables) uncertainty propagation considered here, it provided good coverage of the design space with fewer samples than LHS or random sampling and showed fast empirical convergence of robustness metrics (e.g., mean and variance) in preliminary tests [10]; it also supports straightforward incremental sample addition for interactive workflows. Sobol sequences may be equally competitive or preferable in some higher-dimensional settings; the framework is therefore extensible to alternative low-discrepancy sequences.
Figure 5.
Different types of sampling distributions for uncertainty quantification using the Halton sequence.
Figure 5a uses a Gaussian distribution for aspect ratio and a uniform distribution for skin root thickness, representing naturally varying versus deliberately bounded parameters. Figure 5b models both parameters as Gaussian, with mean and standard deviation taken from experimental or historical data. By switching between these options, users can assess how distribution assumptions affect uncertainty propagation in aerodynamic and structural parameters and account for these effects in robust design optimisation.
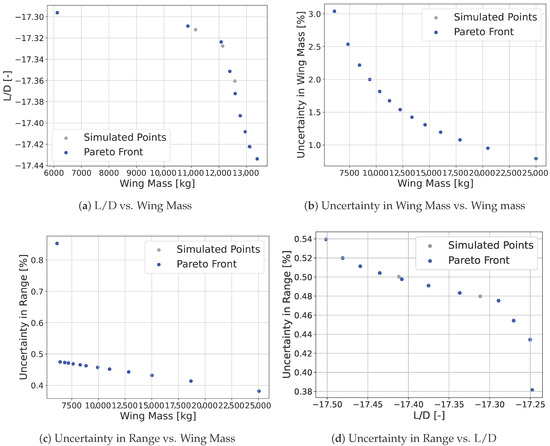
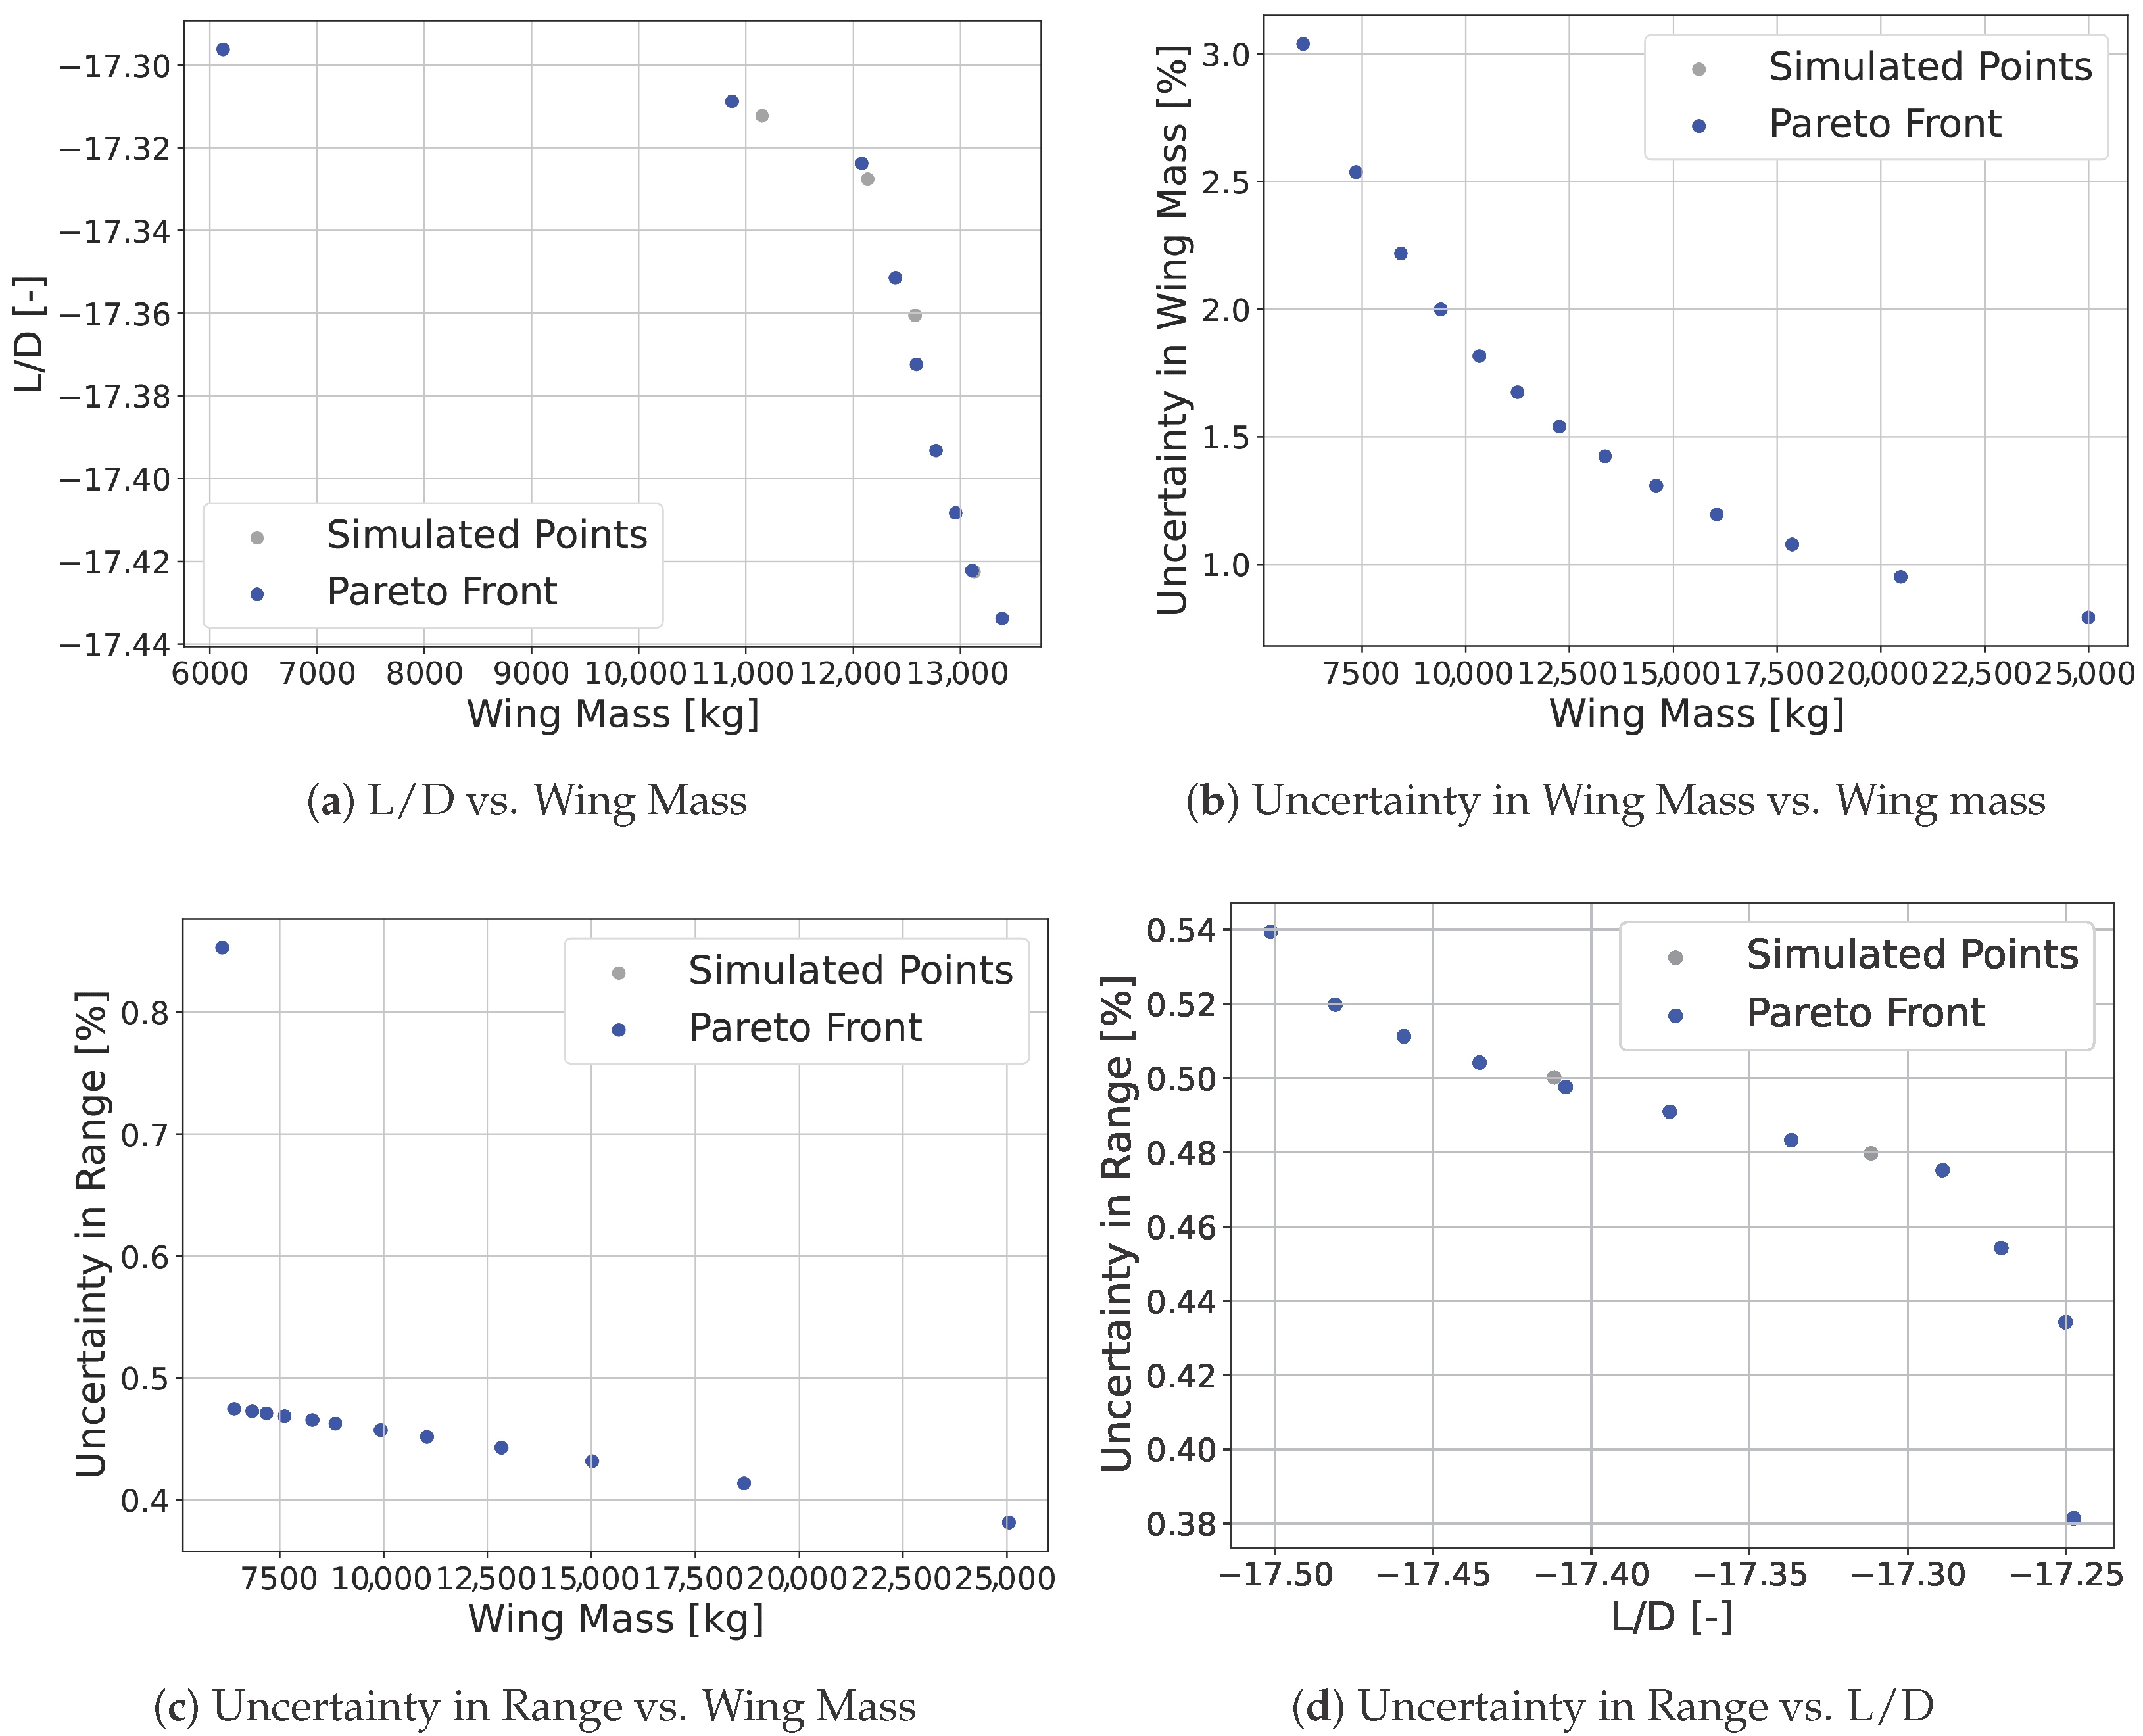
Figure 6 shows Pareto fronts generated by the dashboard. In this study, the objectives include three physical metrics (wing mass, lift-to-drag ratio, and range) and their associated uncertainties. For aircraft design, range and should be maximised, wing mass minimised, and uncertainties kept as low as possible. Negative signs for quantities such as or range indicate maximisation in the optimisation setup. Figure 6a shows the trade-off between maximising and minimising wing mass: users may choose a lighter design (e.g., ≈6000 kg) with moderate (≈17.3) or a heavier design (e.g., ≈13,500 kg) with higher (≈17.44), depending on material, geometric, or aerodynamic constraints.
Figure 6.
Results for multi-objective optimisation showing Pareto fronts and design trade-offs for a robust design.
Figure 6b–d follow a similar pattern, pairing a primary objective (wing mass, , or range) with the uncertainty of the same or another objective. For example, in (b), users may select a low-mass design with higher mass uncertainty, or accept greater mass for lower uncertainty. In (d), users may prefer a lower to reduce range uncertainty, or a higher if higher uncertainty is acceptable. These analyses help identify balanced compromises by jointly considering performance and prediction uncertainty, which is essential in engineering design which involves multiple competing criteria under uncertainty.
To quantify the computational benefit of the Kriging surrogate over a traditional simulation-only workflow, we define the Surrogate Speed-Up Index (SSI) as the ratio between the cost of performing all evaluations with the physics-based solvers and the cost of the same study using the surrogate, including its one-off training. In the CRM wing example, a single mid-fidelity evaluation of wing mass, range and takes , while a Kriging prediction requires only and training costs . For a Monte Carlo study with samples this gives versus , so that . Thus, the surrogate reproduces the underlying wing-physics trends while enabling design-space exploration and optimisation roughly three orders of magnitude faster than a traditional simulation-only workflow. This is faster than what is reported by Bornatico et al. [20] (reported an SSI of 150×) and Vardhan et al. [21] (reported an SSI of 102). It is important to note that SSI may decrease as dimensionality grows (increasing sampling and surrogate-training/hyperparameter costs), when data are noisy or inconsistent (requiring more regularisation/retraining and physics-solver validation), when the original solver is already fast (so surrogate overhead is not amortised) and when frequent retraining is needed during optimisation.
5. Conclusions and Discussion
This paper presented an integrated framework combining multi-disciplinary simulation data, Kriging surrogates, NSGA-III-based robust multi-objective optimisation, and a web-based visual analytics dashboard. Aerodynamic and structural data were used to train surrogates, propagate uncertainty via Monte Carlo Simulation with Halton sampling, and enable interactive inspection of Pareto fronts and contour plots. Results showed clear trade-offs (e.g., lift-to-drag ratio vs. wing mass), illustrated cross-disciplinary uncertainty propagation, and demonstrated that interactive “what-if” exploration can accelerate design cycles and improve confidence in selected solutions. Although demonstrated on a simplified wing case, the architecture is general and transferable to applications such as wind turbine blades, turbomachinery, renewable energy systems, and other applications. Future work will incorporate multi-fidelity or experimental datasets to improve surrogate accuracy, extend the dashboard with 3D surrogates and three-objective visualisations, and explore richer interaction (e.g., advanced brushing/linking or immersive interfaces). Overall, coupling robust MOO with intuitive visual analytics offers a scalable route to shorter design cycles, lower risk, and more informed collaborative engineering decisions.
Author Contributions
Conceptualisation, S.S., A.S. and T.K.; software, S.S.; validation, S.S.; investigation, S.S.; resources, S.S. and A.S.; data curation, S.S.; writing—original draft preparation, S.S.; writing—review and editing, A.S. and T.K.; supervision, T.K.; project administration, T.K.; funding acquisition, T.K. All authors have read and agreed to the published version of the manuscript.
Funding
Funding received from Innovate UK under Grant Agreement No 10003388.
Institutional Review Board Statement
Not applicable.
Informed Consent Statement
Not applicable.
Data Availability Statement
Data is available on request.
Conflicts of Interest
The authors declare no conflicts of interest.
References
- Thomas, J.J. Illuminating the Path: [The Research and Development Agenda for Visual Analytics]; IEEE Computer Society: Los Alamitos, CA, USA, 2005. [Google Scholar]
- Vassberg, J.; Dehaan, M.; Rivers, M.; Wahls, R. Development of a common research model for applied CFD validation studies. In 26th AIAA Applied Aerodynamics Conference; American Institute of Aeronautics and Astronautics: Reston, VA, USA, 2008; p. 6919. [Google Scholar]
- Sacha, D. Knowledge Generation in Visual Analytics: Integrating Human and Machine Intelligence for Exploration of Big Data. Ph.D. Thesis, University of Konstanz, Konstanz, Germany, 2018. [Google Scholar]
- Deb, K.; Jain, H. An evolutionary many-objective optimization algorithm using reference-point-based nondominated sorting approach, part I: Solving problems with box constraints. IEEE Trans. Evol. Comput. 2013, 18, 577–601. [Google Scholar] [CrossRef] [Scilit]
- Forrester, A.I.; Keane, A.J.; Bressloff, N.W. Design and analysis of “noisy” computer experiments. AIAA J. 2006, 44, 2331–2339. [Google Scholar] [CrossRef] [Scilit]
- Martins, J.R.; Lambe, A.B. Multidisciplinary design optimization: A survey of architectures. AIAA J. 2013, 51, 2049–2075. [Google Scholar] [CrossRef] [Scilit]
- Keim, D.A.; Mansmann, F.; Schneidewind, J.; Thomas, J.; Ziegler, H. Visual Analytics: Scope and Challenges; Springer: Berlin/Heidelberg, Germany, 2008. [Google Scholar]
- Piotrowski, W.; Kipouros, T.; Clarkson, P.J. Enhanced interactive parallel coordinates using machine learning and uncertainty propagation for engineering design. In 2019 15th International Conference on eScience (eScience); IEEE: Piscataway, NJ, USA, 2019; pp. 339–348. [Google Scholar]
- Kipouros, T.; Inselberg, A.; Parks, G.; Savill, A.M. Parallel coordinates in computational engineering design. In 54th AIAA/ASME/ASCE/AHS/ASC Structures, Structural Dynamics, and Materials Conference; American Institute of Aeronautics and Astronautics: Reston, VA, USA, 2013; p. 1750. [Google Scholar]
- Shubham, S.; Kipouros, T.; Dash, S.; Ianakiev, A. Uncertainty propagation and management of mixed uncertainties for multi-fidelity multi-disciplinary analysis of propeller with different blade sweep. In AIAA SCITECH 2024 Forum; American Institute of Aeronautics and Astronautics: Reston, VA, USA, 2024; p. 1487. [Google Scholar]
- Shubham, S.; Wright, N.; Avallone, F.; Ianakiev, A. Aerodynamic and aeroacoustic investigation of vertical axis wind turbines with different number of blades using mid-fidelity and high-fidelity methods. In AIAA AVIATION 2023 Forum; American Institute of Aeronautics and Astronautics: Reston, VA, USA, 2023; p. 3642. [Google Scholar]
- Shubham, S.; Naik, K.; Sachar, S.; Ianakiev, A. Performance analysis of low Reynolds number vertical axis wind turbines using low-fidelity and mid-fidelity methods and wind conditions in the city of Nottingham. Energy 2023, 279, 127904. [Google Scholar] [CrossRef] [Scilit]
- Tasora, A.; Serban, R.; Mazhar, H.; Pazouki, A.; Melanz, D.; Fleischmann, J.; Taylor, M.; Sugiyama, H.; Negrut, D. Chrono: An open source multi-physics dynamics engine. In High Performance Computing in Science and Engineering: Second International Conference, HPCSE 2015, Soláň, Czech Republic, 25–28 May 2015, Revised Selected Papers 2; Springer: Berlin/Heidelberg, Germany, 2016; pp. 19–49. [Google Scholar]
- Projectchrono.org. Project Chrono—An Open-Source Physics Engine. Available online: https://projectchrono.org/about/ (accessed on 1 December 2019).
- Toal, D.J. Applications of multi-fidelity multi-output Kriging to engineering design optimization. Struct. Multidiscip. Optim. 2023, 66, 125. [Google Scholar] [CrossRef] [Scilit]
- Metropolis, N.; Ulam, S. The Monte Carlo method. J. Am. Stat. Assoc. 1949, 44, 335–341. [Google Scholar] [CrossRef] [PubMed]
- Liu, J.S. Monte Carlo Strategies in Scientific Computing; Springer: Berlin/Heidelberg, Germany, 2001. [Google Scholar]
- Shubham, S.; Sharma, A.; Riaz, A. A Unified Multi-Fidelity Aero-Structural Design Framework for Novel Aircraft Configurations. In AIAA SCITECH 2026 Forum; American Institute of Aeronautics and Astronautics: Reston, VA, USA, 2026; p. 2651. [Google Scholar]
- Breguet Range Equation. Available online: https://web.mit.edu/16.unified/www/FALL/thermodynamics/notes/node98.html (accessed on 30 April 2026).
- Bornatico, R.; Hussy, J.; Witzig, A.; Guzzella, L. Surrogate modeling for the fast optimization of energy systems. Energy 2013, 57, 653–662. [Google Scholar] [CrossRef] [Scilit]
- Vardhan, H.; Hyde, D.; Timalsina, U.; Volgyesi, P.; Sztipanovits, J. Sample-efficient and surrogate-based design optimization of underwater vehicle hulls. Ocean Eng. 2024, 311, 118777. [Google Scholar] [CrossRef] [Scilit]


Disclaimer/Publisher’s Note: The statements, opinions and data contained in all publications are solely those of the individual author(s) and contributor(s) and not of MDPI and/or the editor(s). MDPI and/or the editor(s) disclaim responsibility for any injury to people or property resulting from any ideas, methods, instructions or products referred to in the content. |
© 2026 by the authors. Licensee MDPI, Basel, Switzerland. This article is an open access article distributed under the terms and conditions of the Creative Commons Attribution (CC BY) license.