


Abstract
Today’s cargo bay uses Halon 1301 gas for fire suppression. While effective, this fluid is broadly banned due to its high global warming potential (GWP) of 5700 and its high ozone depletion potential. Hence, alternative agents for cargo fire protection are being sought. In this framework, tests were conducted in the Fraunhofer Flight Test Facility with the goal of evaluating the uniformity of spread of various fire suppression agents, specifically a blend of a Hydrofluoroolefine (HFO) and CO2. The facility’s cargo area, with a volume of 38 m3, features a low-pressure vessel integrating a previously operated aircraft segment. In a series of tests, the alternative extinguishing agent was supplied into the cargo hold demonstrator and concentrations were measured in different locations to understand the uniformity of distribution and the system behaviour under a realistic flight envelope. Test results show several interesting outcomes. In the empty cargo hold with air movement due to leakage, initial bottle filling weight and extinguishing agent initial concentration are consistent. When no flow movement is applied to the cargo hold, a separation between upper and lower cargo hold concentrations is found. The heavy extinguishing agent necessitates a buoyancy correction of the measured pressure differential by air density and elevation.
1. Introduction
Ref. [1] specifies the types of cargo holds encountered in the flying stock. The typical passenger aircraft cargo hold, located below the cabin, is of class C. This implies the necessity to equip the cargo compartment with a smoke or fire detector providing a signal to the pilot and a fire extinguishing and suppression system that can be remotely launched from the cockpit. This requirement rose from the recommendation issued after a fatal accident on 11 May 1996 [2], where a cargo fire led to the loss of an aircraft and human life. The Minimum Performance Standard (MPS, [3]) details the qualification tests a fire suppression agent needs to pass to be suited as a fire suppression agent in the cargo hold. These are:
- Bulkload test: Boxes filled with paper are ignited and fire must be suppressed.
- Containerized load test: Boxes filled with paper are placed in LD3-containers are ignited and must be suppressed.
- Surface-burning test: Jet A fuel ignited in a surface burning pan must be suppressed.
- Aerosol can explosion test: An exploding aerosol can is simulated by introducing a hydrocarbon mixture into a bulkloaded cargo. An explosion must not occur when the suppression system is active.
The major phases of fire suppression in the cargo hold are described in [4]. Throughout these three phases, the amount of suppression agent must be sufficient to extinguish flames and to avoid their reignition:
- Knockdown: Quick buildup of the required fire suppression agent concentration.
- Holding: Maintaining of fire suppression agent concentration over flight (compensation of fresh air ingress by leakages).
- Descent: Due to the repressurization, a large amount of fresh air enters the cargo hold when increasing cabin pressure from flight pressure to ground level.
The most important sizing parameters for the fire suppression system are on the one hand the cargo volume, as this determines the amount of agent required for the initial concentration buildup during knockdown, and on the other hand, the ETOPS requirement (distance to next airport) and cargo bay air tightness, which determine the size of the sustaining system, as longer flight time and/or higher leakage necessitate additional agent to be supplied in a flow-metered manner. For today’s aircraft, Halon 1301 is used as the fire suppression agent. However, due to its high GWP of 5700, this substance has been broadly banned and the aircraft industry needs to find other agents. Hence, alternative solutions are sought. Ref. [5] presents a zonal modelling simulation approach validated against test data. In this work, nitrogen was used as a suppression agent and its spread and uniformity throughout the Flight Test Facility cargo hold was investigated. The principal suitability of nitrogen injection to starve fire by oxygen deprivation is reported in [6].
Several other development activities have been performed for halon replacement as well, including solutions using water mist, inert gases and solid-propellant gas-generator suppression systems [7,8,9,10]. These models include CFD simulations and single- or two-zone models.
Within the WAKOS project, the validation of substances’ concentration distribution in the cargo hold was pursued with the target of finding an optimal replacement solution for Halon 1301. Optimal in this sense obviously means that it fulfils the MPS requirements while adding low additional weight and volume to the agent storage and distribution system. In this frame, the use of a blend of HFO/CO2 was considered. In an investigation [11], the HFO/CO2 blend was found to be a suitable Halon-replacement agent. This paper shows a test conducted with the HFO/CO2 blend and highlights some interesting insights from the test data evaluation.
2. Materials and Methods
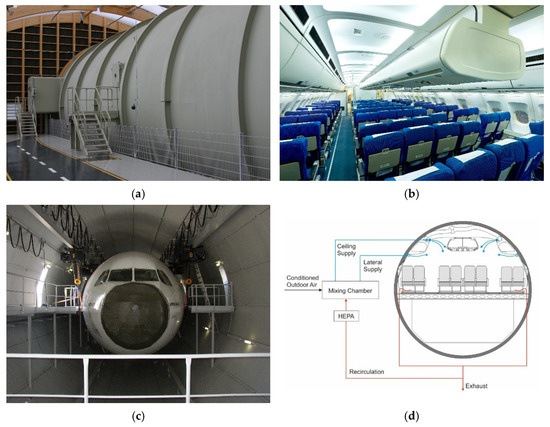
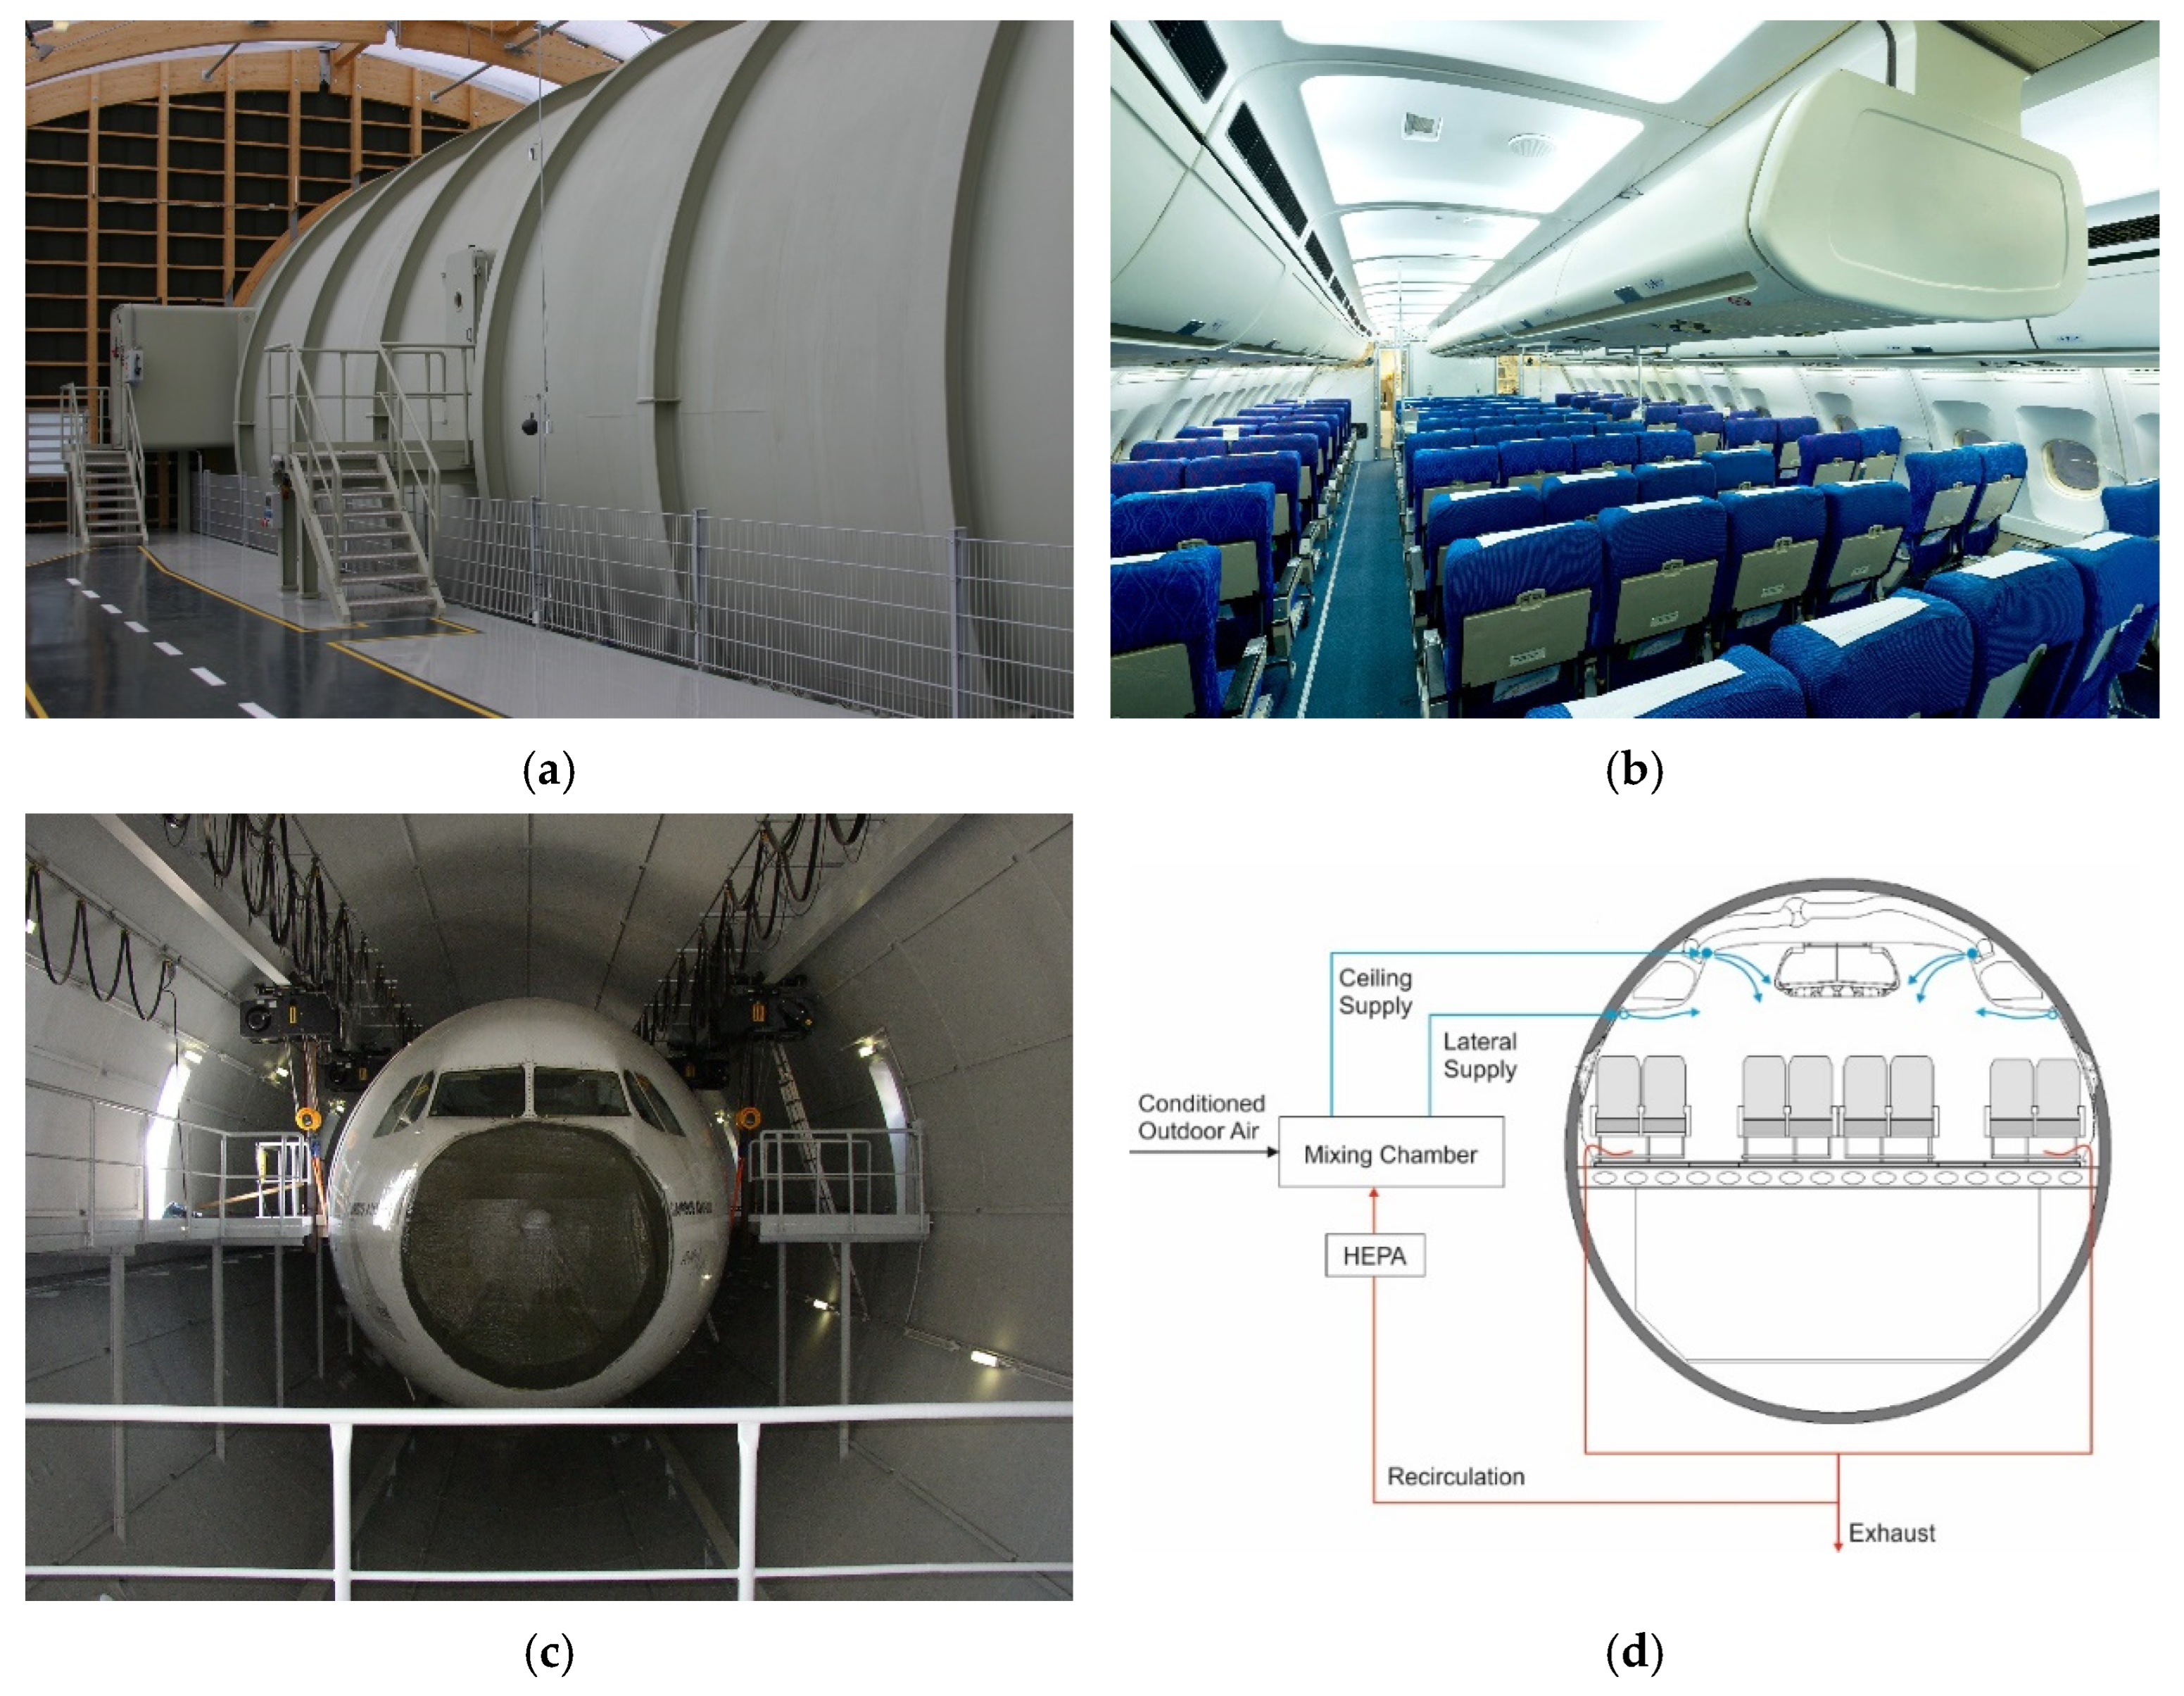
The tests were performed in the Fraunhofer Flight Test Facility (Figure 1a). The core of this facility is a former in-service wide-body aircraft (Figure 1b) that has been integrated into a low-pressure vessel (Figure 1c). Through this unique test bench, the pressure envelope of an entire flight can be emulated to generate a realistic take-off, cruise and descent cabin pressure profile. The admissible cabin pressure of 750 hPa (equivalent to a pressure altitude of 8000 ft) as specified in ASHRAE 161 [12] can be met. The mock-up has a realistic ventilation pattern supplying air at ceiling level into the cabin. The exhaust air overflows to the triangle (cheek) areas where recirculation air is aspirated. The remaining air overflows into the bilge and is exhausted.
Figure 1.
(a) Low pressure vessel of FTF, (b) aircraft cabin mock-up, (c) aircraft mock-up in the low-pressure vessel, (d) schematic ventilation pattern.
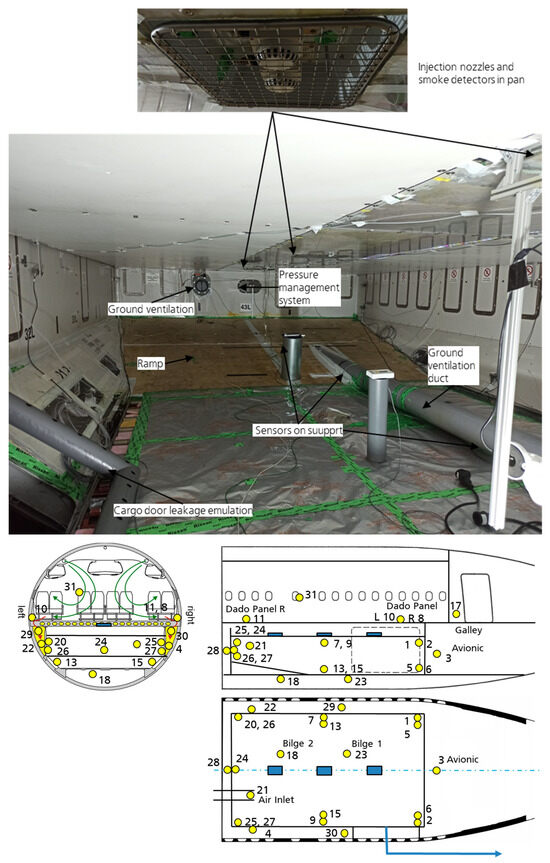
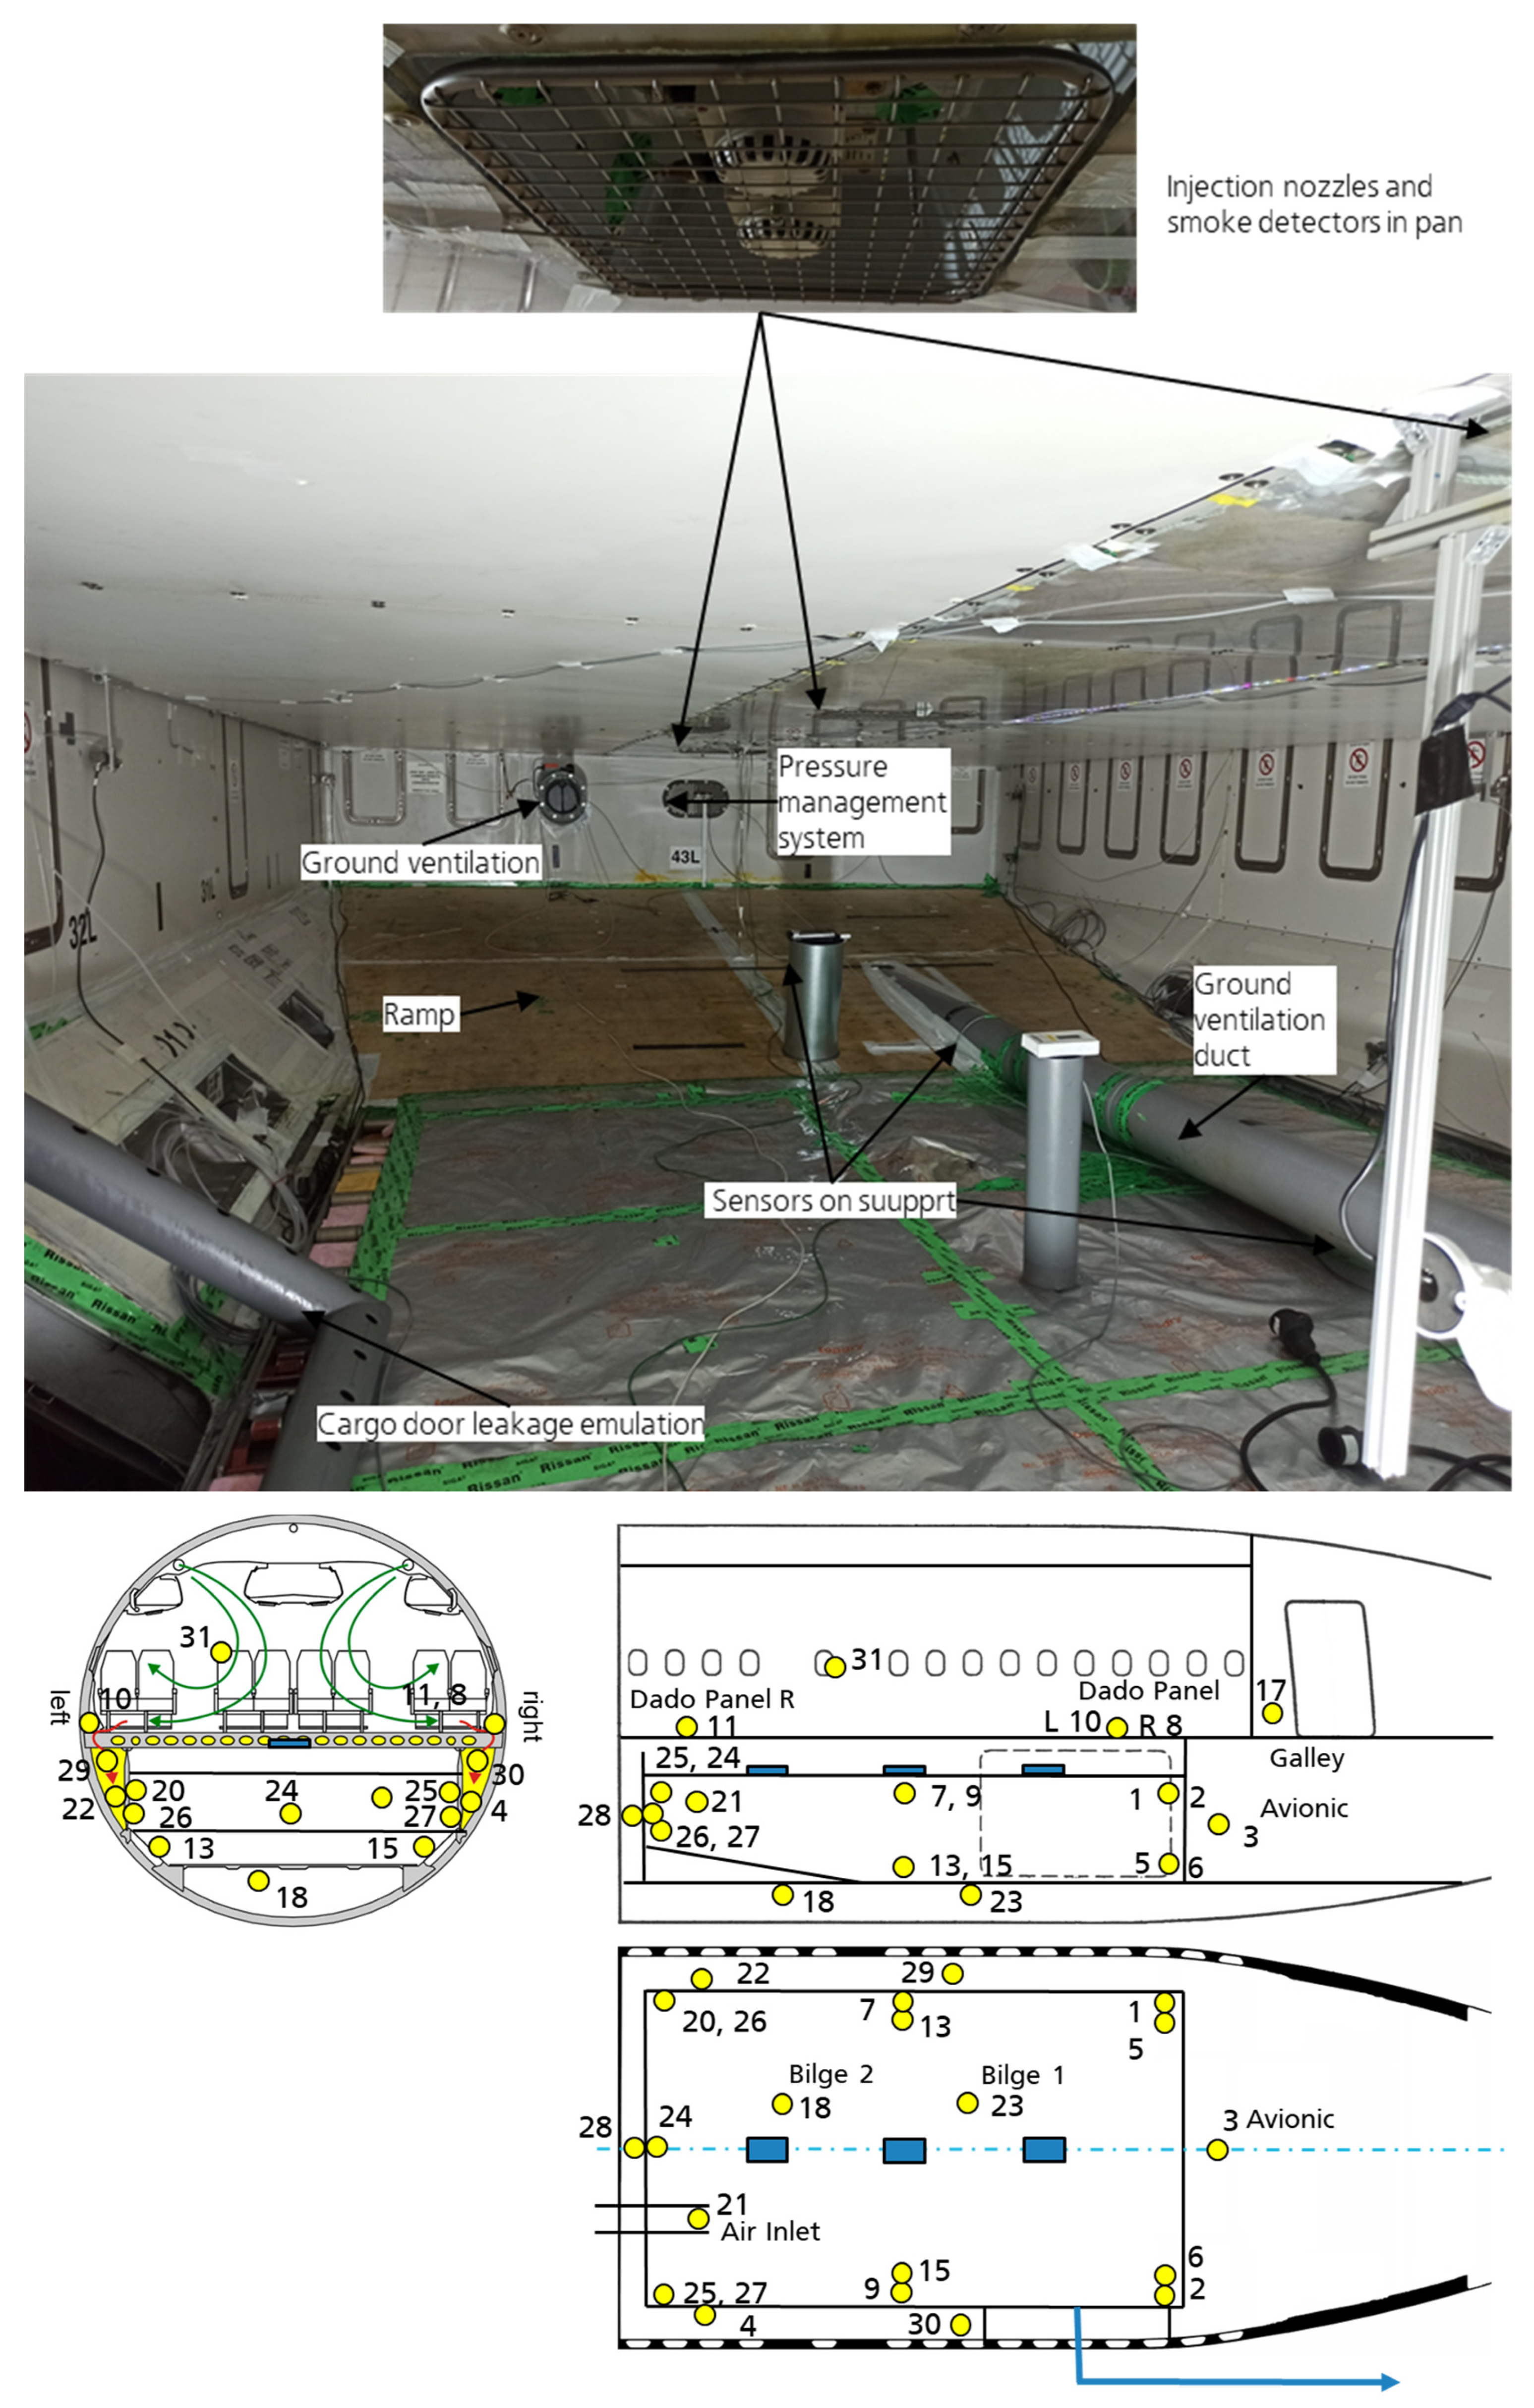
The cargo bay is shown in Figure 2 (top). Compared to the mock-up’s original one, the ceiling has been lowered, and a ramp has been installed to make it more similar to a AFT single-aisle aircraft cargo hold in terms of shape and volume. The total cargo volume is 38 m3. Joints and edges as well as the floor were thoroughly sealed to avoid unwanted air ingress into the cargo hold. The test setup consists of the following major items:
Figure 2.
Cargo hold test setup. (Top): Image. (Bottom): Sensor plan for agent concentration measurement, yellow dots represent the location of the sensor.
- Three cavities with smoke detector (dummy bodies) and agent injection nozzles spread along the ceiling centerline.
- Ramp to emulate the rear cargo hold of a single-aisle aircraft.
- Pressure management system (two-way valve) to prevent excess pressure in the cargo hold during knockdown (rapid injection of gas into the hold) and ascent/descent (pressure variation).
- Cargo door leakage emulation: Piccolo ducts along the cargo hatch connected to an extraction fan to emulate the in-flight air leakage through the cargo door seals to ambient conditions.
- Ground ventilation inlet and outlet at opposite corners of the cargo hold to empty the test setup of suppression agent after a test.
- Sampling tubes.
- Sensors.
For the HFO/CO2 tests, a device named a “Halonyzer” was used to measure the agent concentration in the cargo hold and in adjacent compartments. This is a gas analyser measuring the air properties from air samples. Through calibration of the device with a defined calibration gas, the concentration of target substances in the air can be determined. In the presented tests, calibration was performed at ground pressure and at cruise pressure. Because there is no steady pressure in the descent phase, there is no Halonyzer reading available for this phase. Figure 2 (bottom) shows the sampling locations in and around the cargo hold.
3. Results
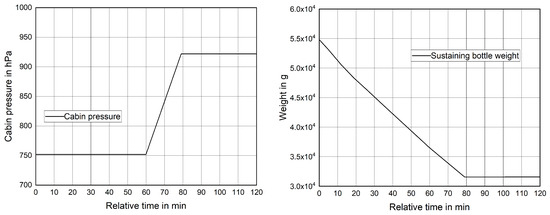
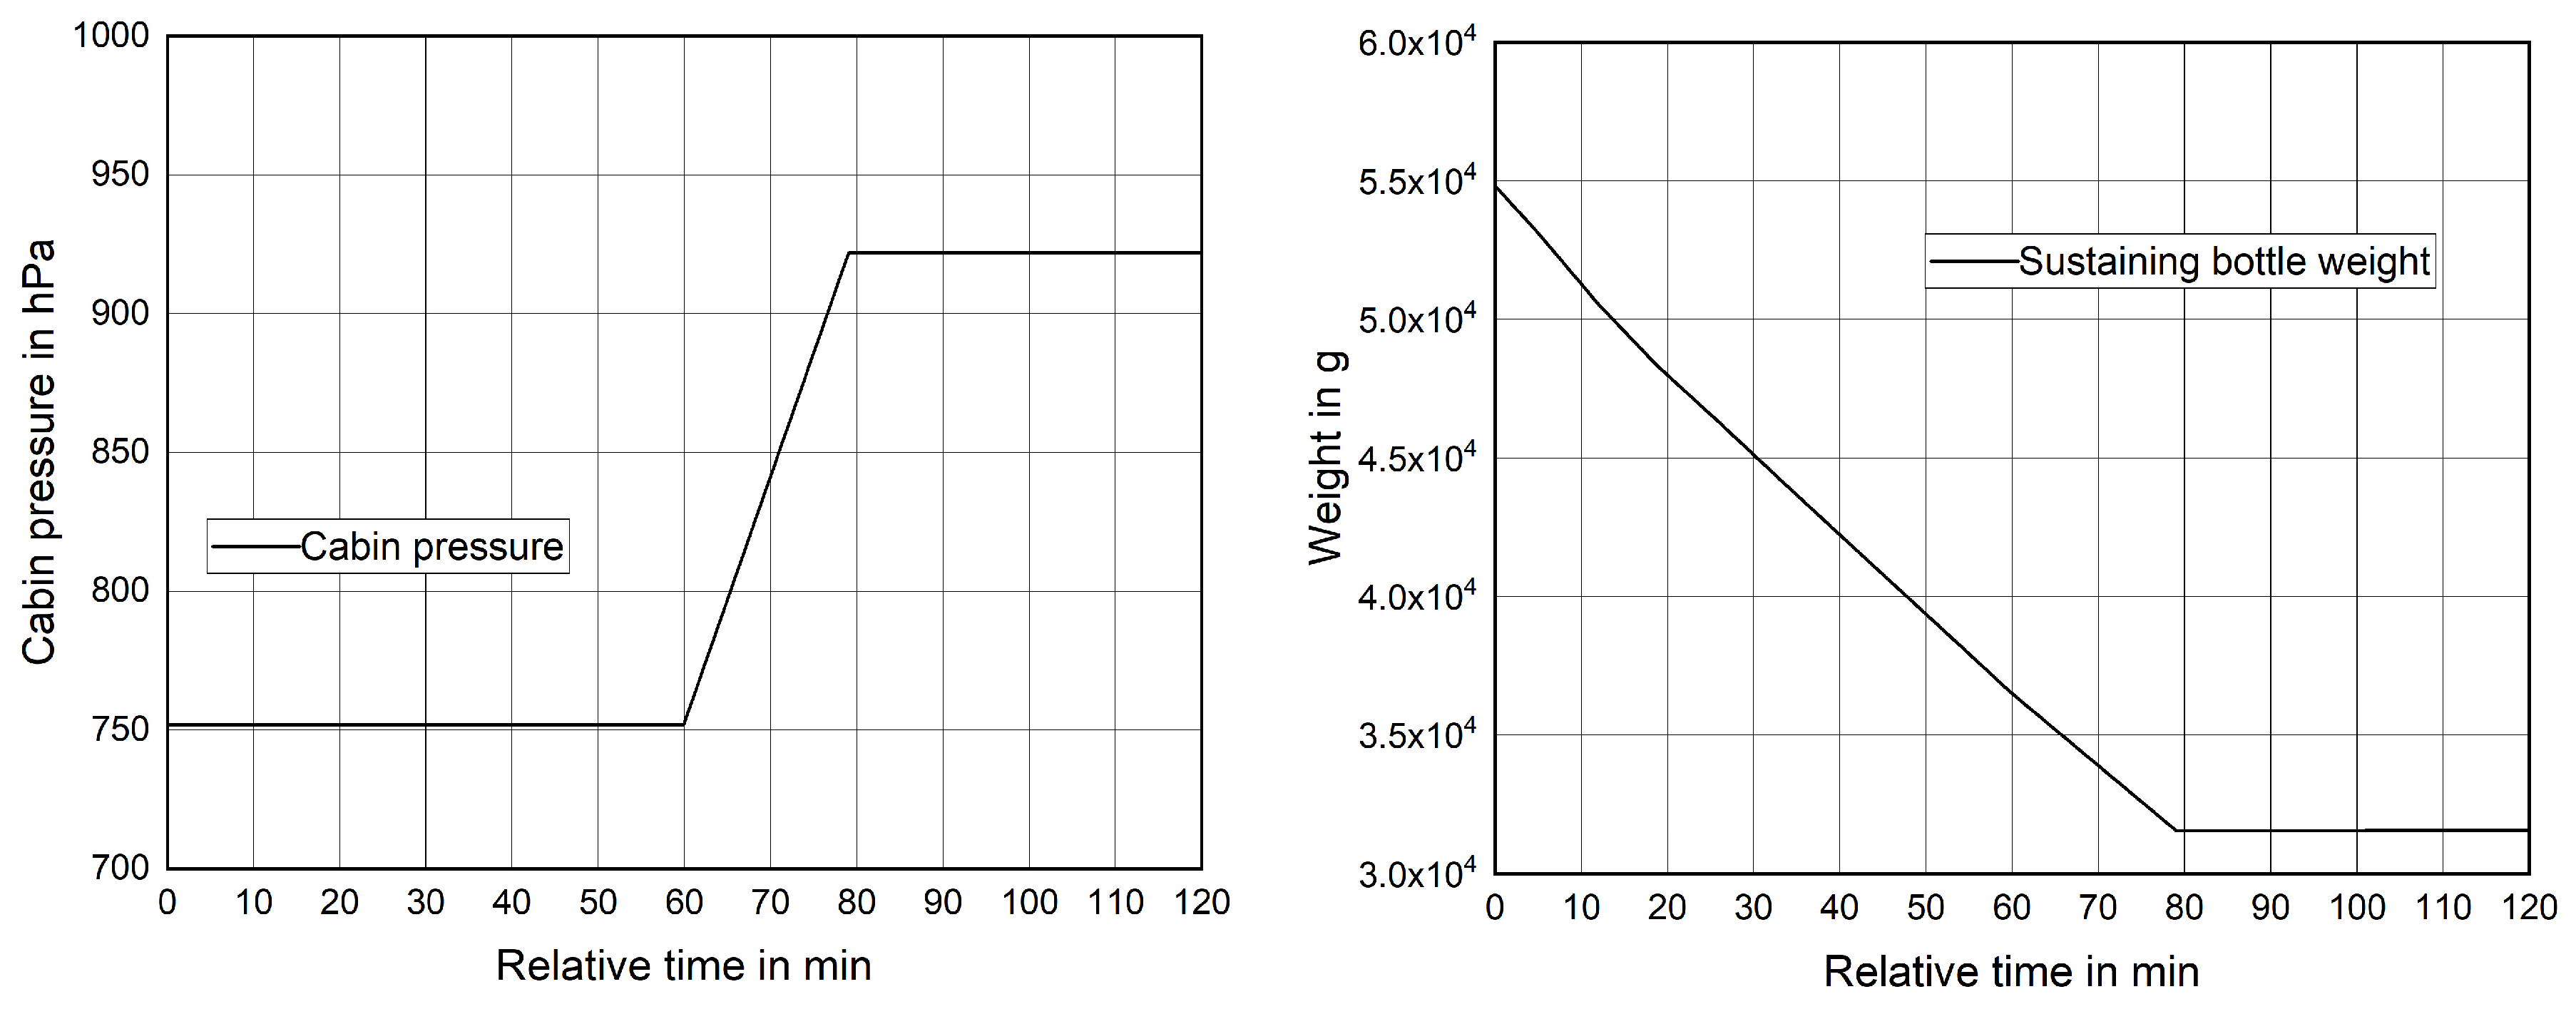
Figure 3 (left) shows the pressure evolution in the cargo hold. As the laboratory is located at close to 700 m elevation, the test starts at a ground condition of approx. 920 hPa. During the emulated take-off, the pressure is reduced to 750 hPa. Once cruise cabin pressure is reached, the test starts (time 0) by injecting the suppression agent. For this, a bottle initially filled with 24 kg of HFO/CO2 is quickly emptied into the cargo hold. After this initial concentration buildup, additional agent is supplied over 1 h in a flow-metered way during cruising, followed by a continued flow-metered supply during the 20 min descent duration (Figure 3, right). The average flow rate of suppression agent from the sustaining system is computed to be 5.3 g/s. Descent is emulated by restoring ambient pressure in the mock-up again.
Figure 3.
(Left): Pressure evolution during test in mock-up. (Right): Weight decrease of the sustaining bottle.
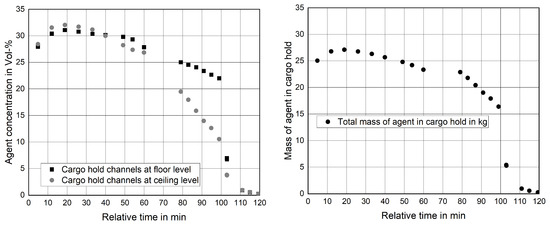
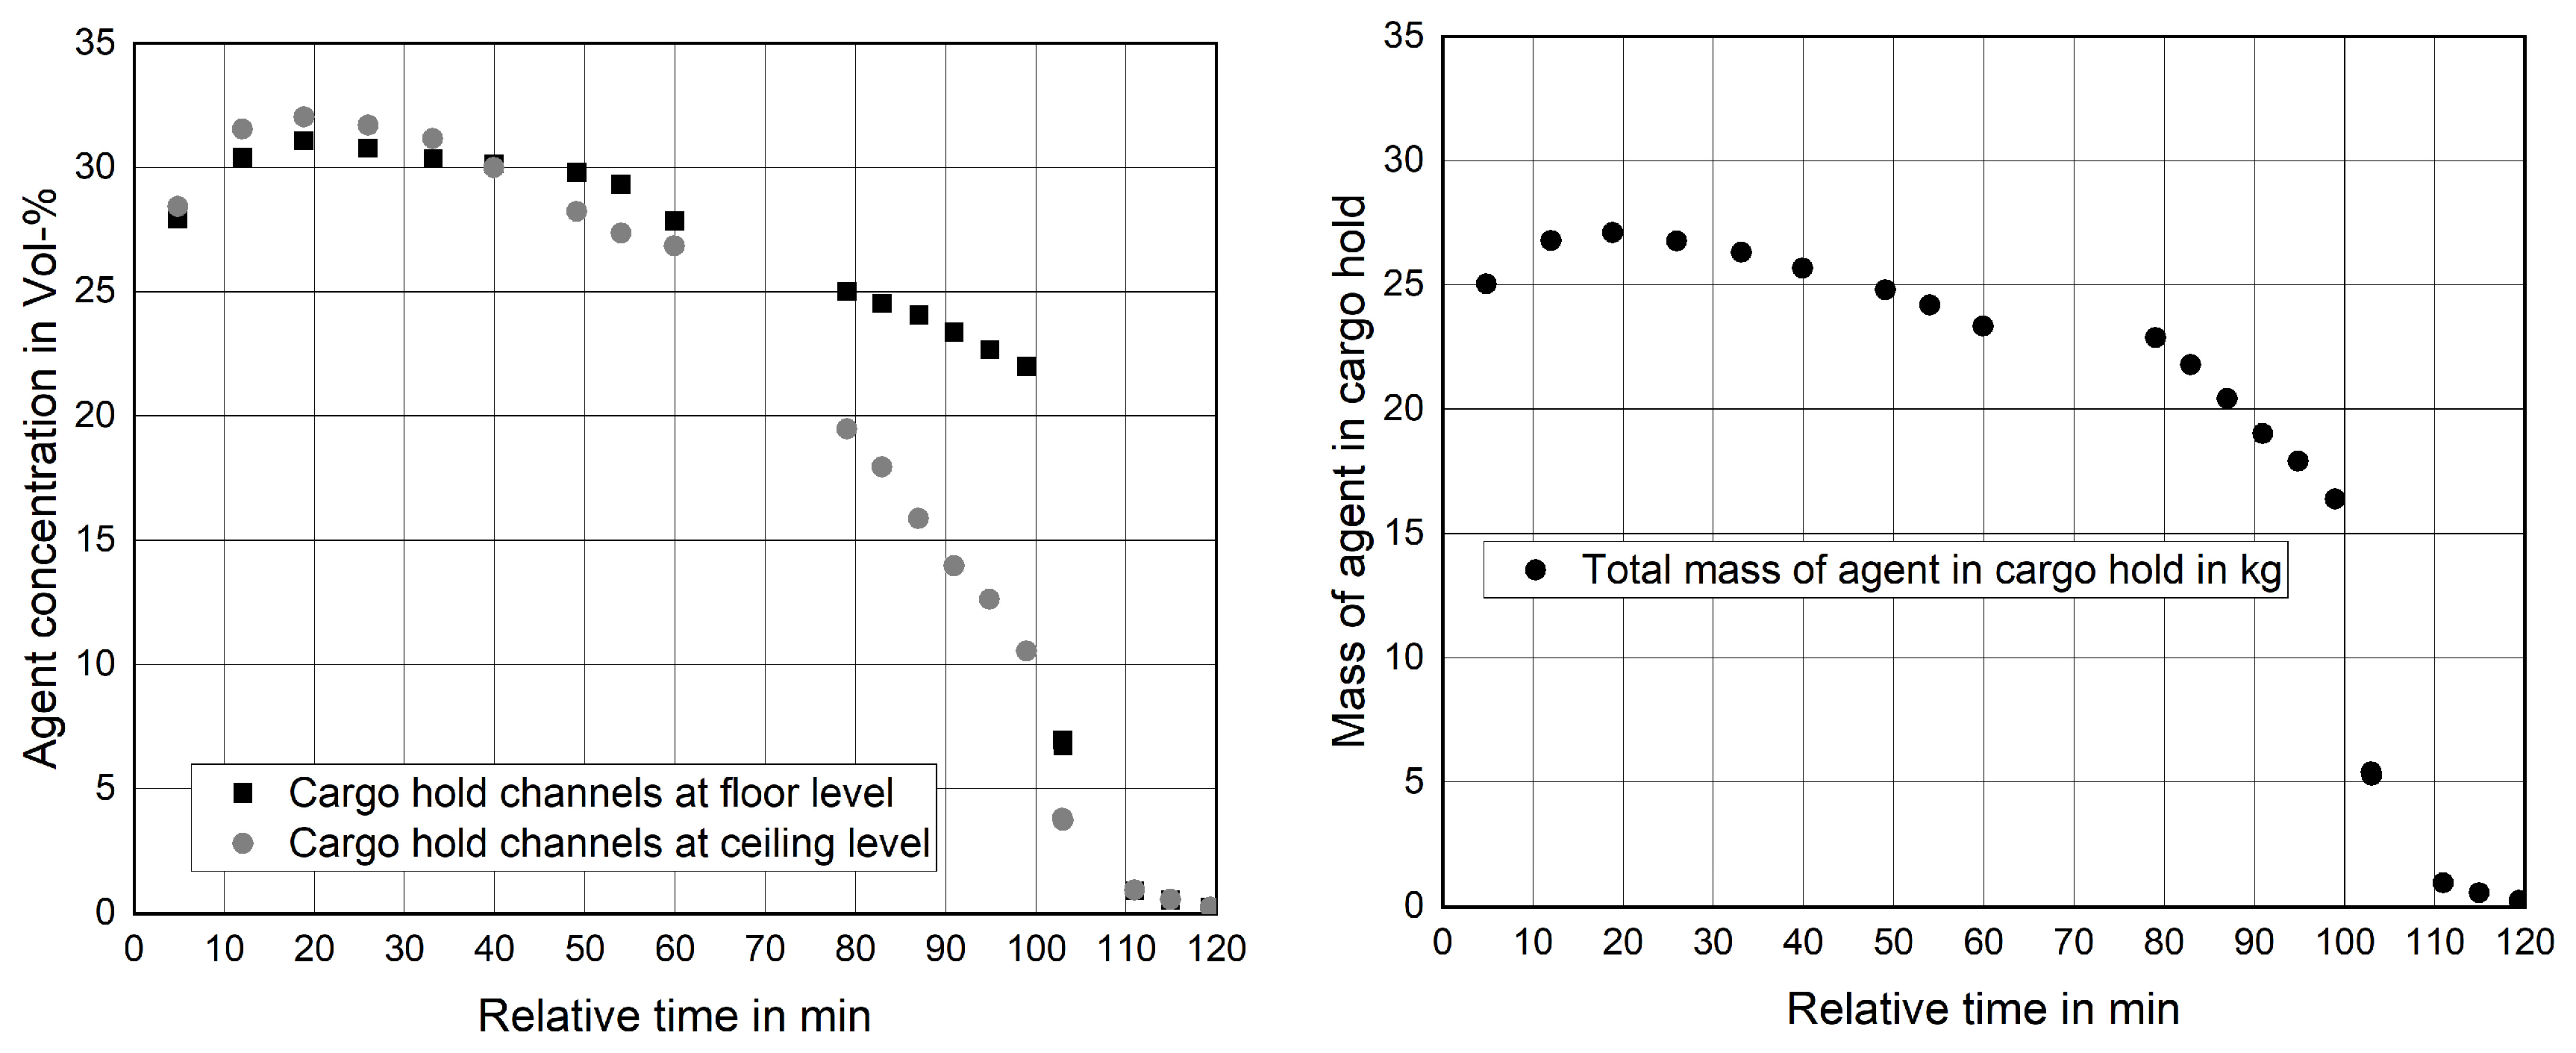
Figure 4 (left) shows the concentration evolution of the HFO/CO2 blend in the cargo hold. Analysis of data revealed that the sensors close to the floor and those close to the ceiling in the cargo hold can be averaged with a variation of approx. ±2 Vol-%; therefore, for the ease of result communication, this averaging was applied. Figure 4 (right) shows the computed mass of agent in the cargo hold. The computation was performed by multiplying agent density with concentration and cargo hold volume. Through this computation, 25 kg was found in the first measurement of agent after knockdown, compared to the 24 kg initially injected. Hence, the estimation of total mass of agent from the concentration measurement is considered accurate to a level of 4.3% of weight. It should be noted that sustaining system was already active during this first measurement.
Figure 4.
(Left): Concentration evolution of HFO/CO2 blend in cargo hold. (Right): Total mass of HFO/CO2 blend in cargo hold.
During flight time (0–60 min) both the concentration and amount of agent decay in the cargo hold due to leakages. Such leakages can be present in the cargo liners or the hatch seal. Hence, fresh air ingress dilutes the agent concentration. During descent, leakage was noticeably lower as air mainly ingresses the cargo hold and restores ground pressure. Hence, the concentration in Vol-% gets diluted while the total amount remains similar. Using a simplistic differential equation approach, the air ingress into the cargo hold can be estimated:
with Vcargo = 38 m3, Δc and Δt being the measured difference in concentration between two measurement times, c being the agent concentration, Vagent being the flow rate (determined by bottle’s weight decrease measurement) and Vleakage being the unknown ingress of fresh air into (egress of air with agent from) the cargo hold.
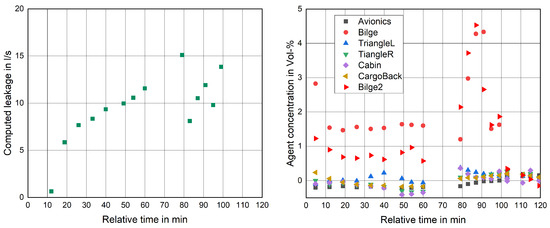
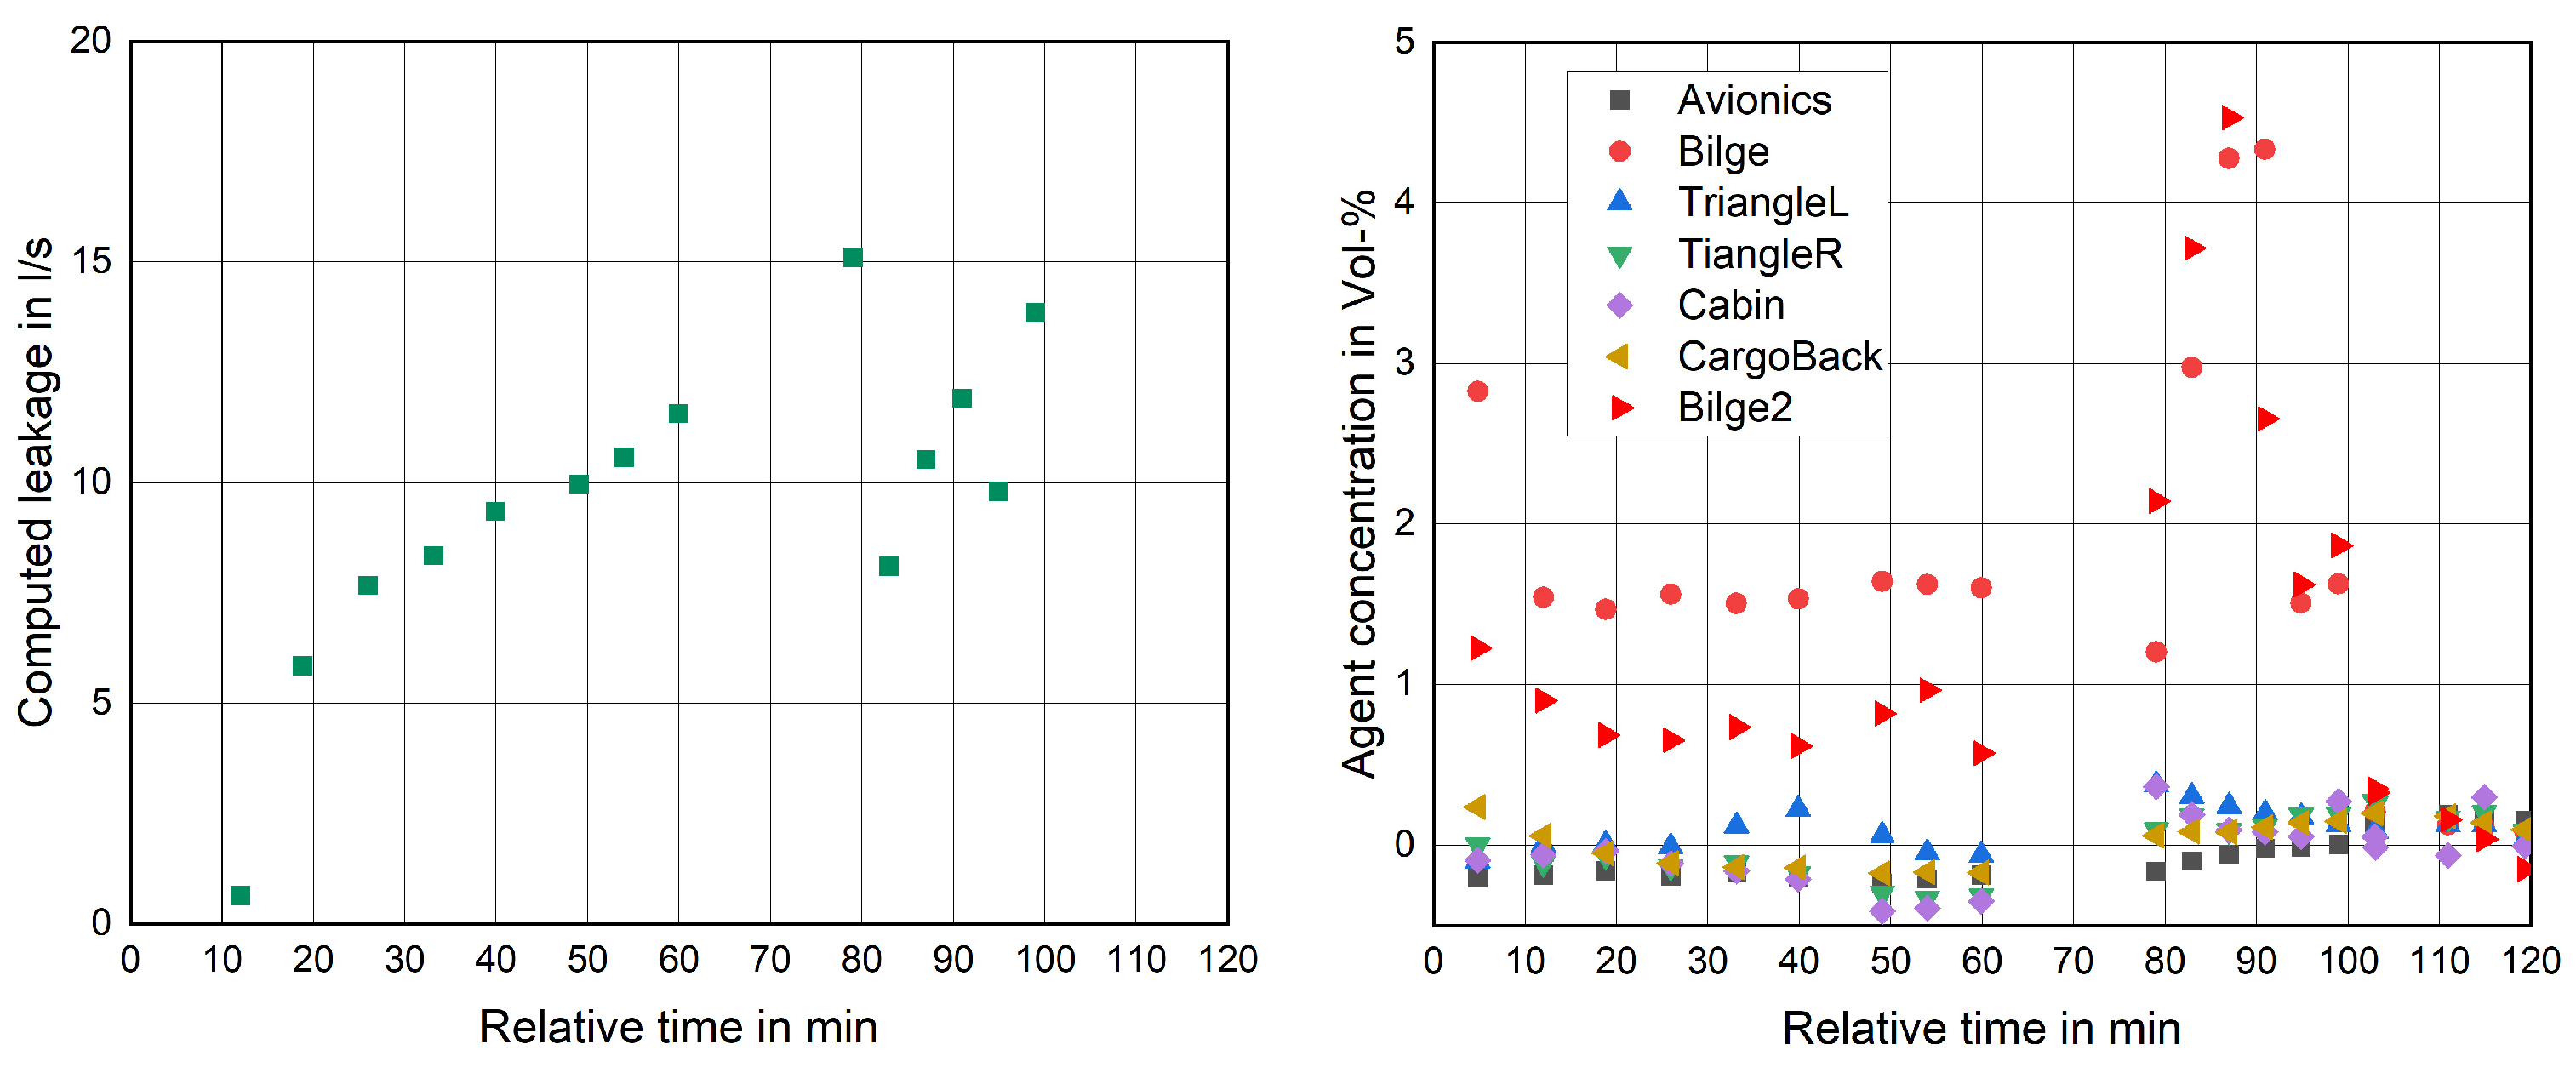
From this computation, the leakage rates shown in Figure 5 (left) were determined. The time-averaged leakage rate is 9.5 L/s. Agent concentration measurements in adjacent compartments show that the cargo air must leak into the bilge, whereas the agent was hardly found in other compartments such as triangle, avionics, cabin or behind the cargo bay wall.
Figure 5.
(Left): Computed cargo hold leakage rate. (Right): Concentration measurements in adjacent compartments.
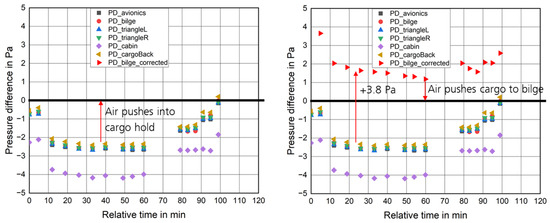
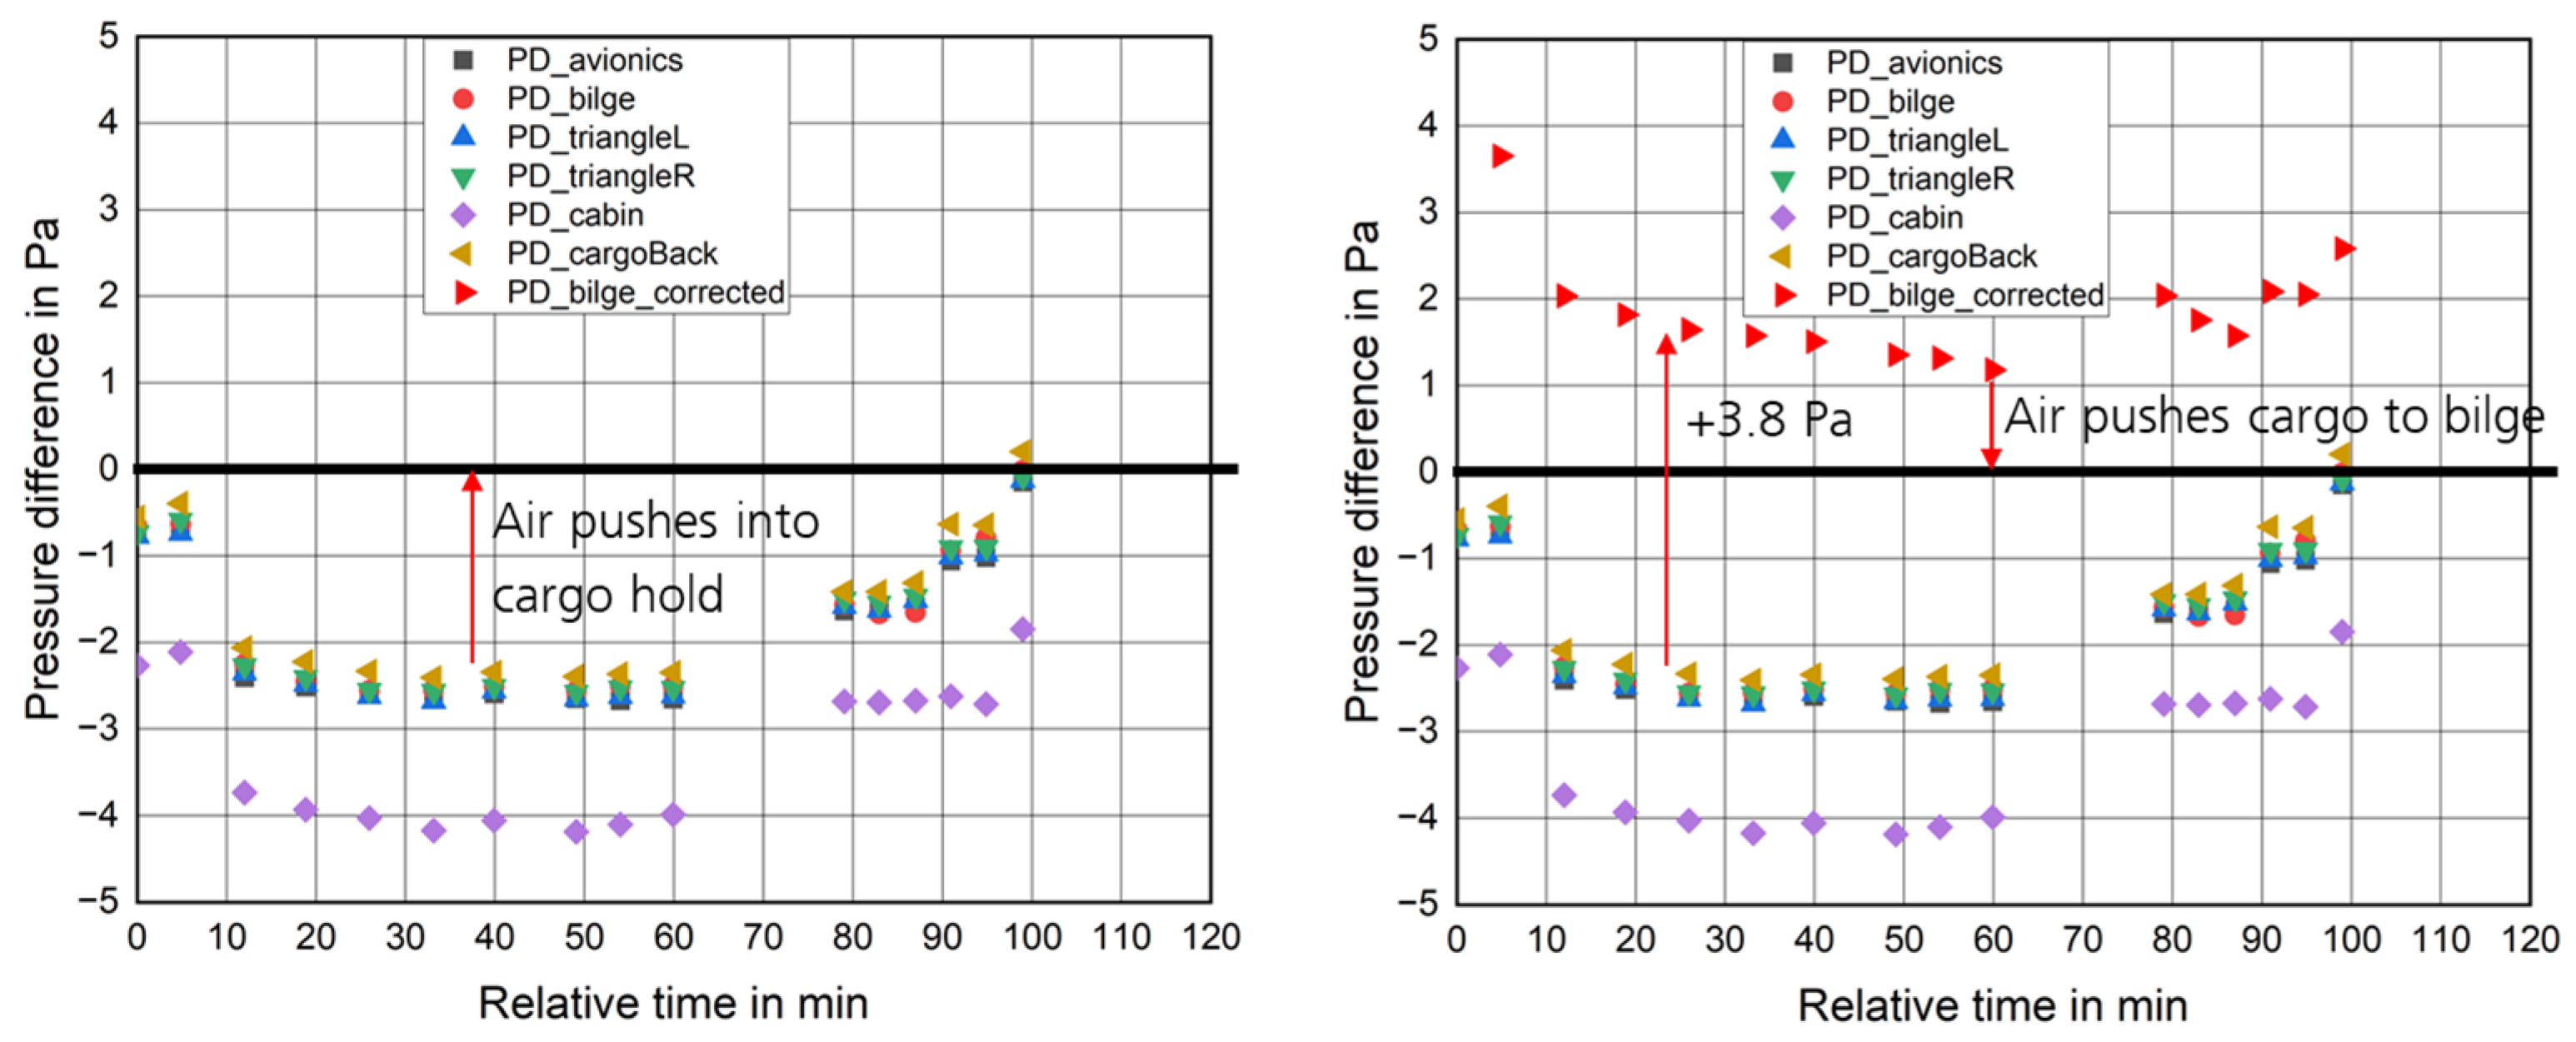
Within the mock-up, pressure differences were measured. In a first attempt, it was sought to verify the detected leakage into the bilge with the pressure differentials. For air to overflow into the bilge, there needs to be a higher pressure in the cargo hold. However, raw pressure difference measurements between the cargo hold and adjacent compartments shows that pressure is consistently lower in the cargo hold (Figure 6, left). An overflow into the bilge would thus be comparable to a river flowing up the hill. Therefore, additional analysis was performed. The pressure difference is measured by tubes connected to a differential pressure sensor. In the cargo hold, this tube ends at an elevation of 0.97 m above the floor, whereas the other pole ends in the bilge, below the cargo floor. Hence, there is a height difference between the two measurement locations. Therefore, the pressure difference needs to be buoyancy-adjusted considering the density of the cargo air/agent mixture and that of ambient compartments with air only. At 750 hPa, the density of cargo air is estimated to be 1.3 kg/m3, whereas the density of air in the other compartments is estimated to be 0.9 kg/m3. Hence, a height-dependent pressure difference will form that can be computed by
Figure 6.
(Left): Raw pressure differences to cargo hold. (Right): Buoyancy corrected pressure difference to the bilge.
Hence, at floor level, the pressure difference will be 3.8 Pa higher than measured at 0.97 m elevation. With this correction, it is found that the pressure difference is in the direction of the bilge (Figure 6, right) and thus the concentration measurements can be explained. A similar effect may occur for the other compartments as well; however, the elevation difference is lower (respectively for the cabin, the direction is inversed) and thus the buoyancy effect can be considered of lesser importance.
4. Discussion
This paper presents an exemplary result from a test campaign with alternative agents for cargo fire suppression that shall replace Halon 1301. The paper highlights how, despite measurement inaccuracies (e.g., timing of sample taking varies, slight inter-location gradients in air samples, inability to measure test bench leakages, etc.) and technical limitations of measurements such as the elevation dependency of differential pressure, test results can be made plausible and explainable. Thus, the method described in this paper may give guidance for upcoming similar test campaigns of tests conducted for the certification of novel fire suppression systems in the cargo hold.
5. Conclusions
From an initially planned verification test for a novel fire suppression agent in the cargo hold, the test results showed potential for further evaluation that enhances system comprehension. The following analysis were successfully conducted:
- Verification of initial agent concentration compared to bottle filling weight;
- Computation of cargo hold leakage rate;
- Correction of pressure differences considering noticeably heavier air/agent mixture;
- Explanation of detected leakage flow direction with corrected pressure measurements.
Author Contributions
Conceptualization, A.P. and M.P.; methodology, V.N.; validation, V.N., formal analysis, V.N.; investigation, A.P. and M.P.; data curation, M.P.; writing—original draft preparation, V.N.; project administration, V.N.; funding acquisition, V.N. All authors have read and agreed to the published version of the manuscript.
Funding
Funded by Bundesministerium für Wirtschaft und Klimaschutz, FKZ: 20M2106G.
Institutional Review Board Statement
Not applicable.
Informed Consent Statement
Not applicable.
Data Availability Statement
Data can be made available upon request.
Acknowledgments
We would like to thank Pablo Jimenez from Airbus for the operation of the Halonyzer system and Maximilian Kienberger from Fraunhofer IBP for the setting up of the test ducting.
Conflicts of Interest
The authors have no conflicts of interest.
References
- Code of Federal Regulations 14 CFR § 25.855 Cargo or Baggage Compartments. Available online: https://www.ecfr.gov/current/title-14/section-25.855 (accessed on 24 April 2026).
- National Transportation Safety Board (NTSB). In-Flight Fire and Impact with Terrain: ValuJet Airlines Flight 592, DC-9-32, N904VJ, Everglades near Miami, Florida, May 11, 1996; NTSB/AAR-97/06; National Transportation Safety Board: Washington, DC, USA, 1997. [Google Scholar]
- Reinhardt, J.W. Minimum Performance Standard for Aircraft Cargo Compartment Halon Replacement Fire Suppression Systems (2012 Update); DOT/FAA/TC-TN12/11; Federal Aviation Administration: Atlantic, NJ, USA, 2012. [Google Scholar]
- Pathak, A.; Norrefeldt, V.; Pschirer, M. Validation of a Simulation Tool for an Environmentally Friendly Aircraft Cargo Fire Protection System. Aerospace 2021, 8, 35. [Google Scholar] [CrossRef] [Scilit]
- Pathak, A.; Norrefeldt, V. Validation of the simulation tool for environmentally friendly aircraft cargo fire protection system. IOP Conf. Ser. Mater. Sci. Eng. 2021, 1024, 12091. [Google Scholar] [CrossRef] [Scilit]
- Dinesh, A.; Benson, C.M.; Holborn, P.G.; Sampath, S.; Xiong, Y. Performance evaluation of nitrogen for fire safety application in aircraft. Reliab. Eng. Syst. Saf. 2020, 202, 107044. [Google Scholar] [CrossRef] [Scilit]
- Hetrick, T.M.; Rivers, P.E. Investigation of Hold Time Calculation Methodologies for Total Flooding Clean Extinguishing Agents. Available online: https://www.scribd.com/document/513653309/investigationofholdtimecalculationmethodologiesthe (accessed on 24 April 2026).
- Li, Y.F.; Chow, W.K. A zone model in simulating water mist suppression on obstructed fire. Heat Transf. Eng. 2006, 27, 99–115. [Google Scholar] [CrossRef] [Scilit]
- Vaari, J. A transient one-zone computer model for total flooding water mist fire suppression in ventilated enclosures. Fire Saf. J. 2002, 37, 229–257. [Google Scholar] [CrossRef] [Scilit]
- Yoon, S.S.; Kim, H.Y.; Hewson, J.C.; Suo-Anttila, J.M.; Glaze, D.J.; DesJardin, P.E. A modeling investigation of suppressant distribution from a prototype solid-propellant gas-generator suppression system into a simulated aircraft cargo bay. Dry. Technol. 2007, 25, 1011–1023. [Google Scholar] [CrossRef] [Scilit]
- Dadia, D. Evaluation of VERDAGENT® Against the FAA Minimum Performance Standard for Aircraft Cargo Compartment Halon Replacement Fire Suppression Systems; DOT/FAA/TC-22/5; Federal Aviation Administration: Washington, DC, USA, 2002. [Google Scholar]
- ASHRAE. Air Quality Within Commercial Aircraft; No. 161; ASHRAE: Atlanta, GA, USA, 2007. [Google Scholar]
Disclaimer/Publisher’s Note: The statements, opinions and data contained in all publications are solely those of the individual author(s) and contributor(s) and not of MDPI and/or the editor(s). MDPI and/or the editor(s) disclaim responsibility for any injury to people or property resulting from any ideas, methods, instructions or products referred to in the content. |
© 2026 by the authors. Licensee MDPI, Basel, Switzerland. This article is an open access article distributed under the terms and conditions of the Creative Commons Attribution (CC BY) license.