


Abstract
Enhancing the long-term reliability and durability of solid oxide fuel cells is crucial to ensure the high-performance standards required in modern applications. For this purpose, high-resolution modelling that accurately captures the critical phenomena affecting cell operation is needed. The cells’ long-term performance can be significantly impacted by degradation processes arising from intense stress fields induced by high operating temperatures, creep deformation and oxide growth on interconnects. This study introduces a predictive tool to enhance the cells’ long-term reliability and durability. A finite element thermo-mechanical model accounting for the operating temperature distribution, mechanical stresses and creep was developed to assess cell structural integrity. A predictive model for the evaluation of oxide growth on the solid interconnects was integrated in the model via subroutine. The whole cell efficiency estimation as a function of the oxide thickness was assessed by introducing a dedicated local degradation function. This research contributes to advancing SOFC design and operational stability, thereby enhancing their long-term viability in energy applications.
1. Introduction
Solid oxide fuel cells (SOFCs) are electrochemical energy conversion devices enabling the direct transformation of chemical energy from fuels such as hydrogen, natural gas, and other hydrocarbons into electrical energy [1]. Distinguished by their high operating temperatures, typically in the range of 600 °C–1000 °C, SOFCs offer several advantages, including high electrical efficiency, fuel flexibility, and low pollutant emissions [2]. The ceramic electrolyte, which conducts oxygen ions, facilitates electrochemical reactions without the requirement for noble metal catalysts, thereby reducing material costs and enhancing fuel adaptability. Due to their modular architecture and scalability, SOFCs are considered highly suitable for a wide spectrum of applications, ranging from distributed stationary power generation to large-scale energy systems. Nevertheless, widespread deployment is hindered by challenges related to thermo-mechanical degradation, material stability, and long-term durability, which remain critical areas of ongoing research [3]. Metallic interconnects are critical components in SOFCs, serving as both electrical conductors and physical separators between individual cells in a stack [4]. The metallic substrates, typically ferritic stainless steels, are selected for their thermal expansion compatibility with ceramic cell components and for their ability to be micro-machined or stamped into flow-field structures [5]. The channels embedded in the interconnect plates are specifically designed to direct fuel and oxidant streams uniformly across the electrodes, thereby ensuring effective mass transport and maintaining homogeneous electrochemical reactions. The geometry of these flow channels—such as width, depth, and pattern (e.g., serpentine, parallel, or interdigitated)—directly influences gas distribution, pressure drop, and thermal gradients within the cell. Proper channel design is essential for minimizing concentration polarization while avoiding excessive pumping losses, which would otherwise reduce system efficiency [6]. However, long-term exposure to high operating temperatures promotes oxide-scale formation within the channel surfaces, which not only increases electrical resistance, but also reduces the whole cell efficiency [7]. To address these issues, recent studies emphasized integrated modelling of interconnect channels, capturing coupled thermo-fluid, electrochemical, and mechanical processes. Peng et al. [8] demonstrated that predictive simulations can guide optimization of channel geometry to improve gas distribution uniformity while mitigating thermal stresses and degradation. Additionally, protective coatings, such as manganese–cobalt spinel, are increasingly applied to channel surfaces to suppress chromium volatilization and stabilize interconnect conductivity during long-term operation. Esposito et al. [9] investigates the creep behavior of interconnect materials used in metal-supported SOFCs (MS-SOFCs) at operating temperatures, modeling the secondary creep stage using a continuum damage mechanics (CDM) approach.
Thus, metallic interconnect channels are not merely structural features, but multifunctional elements whose design and stability directly determine the efficiency, durability, and cost-effectiveness of SOFC systems. Their optimization remains a central focus in advancing SOFC technology toward reliable commercial deployment. Considering a planar SOFC with linear interconnect channel, Recknagle et al. [10] validated a calculation method to predict the distribution of fuel and oxidant fluid flow and the related temperature gradient. The results refer to the full efficiency conditions and do not account for the cell’s long-term reliability.
In the present work, the same SOFC configuration investigated in [10] was adopted as a reference case to implement an original coupled degradation model for the prediction of long-term cell efficiency. For this purpose, a numerical Finite Element (FE) model reproducing the considered case-study configuration was proposed. Taking into account operating temperature, material structural response, and long-term creep, the proposed model was implemented through subroutines to predict oxide growth on the interconnect and its impact on local and global cell efficiency losses.
2. Materials and Methods
2.1. FE Model Geometry and Mesh
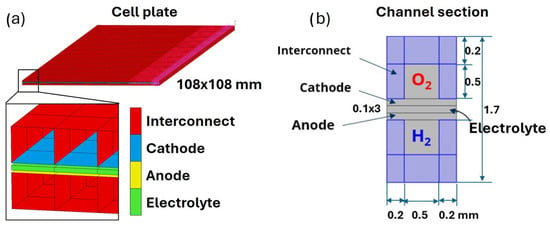
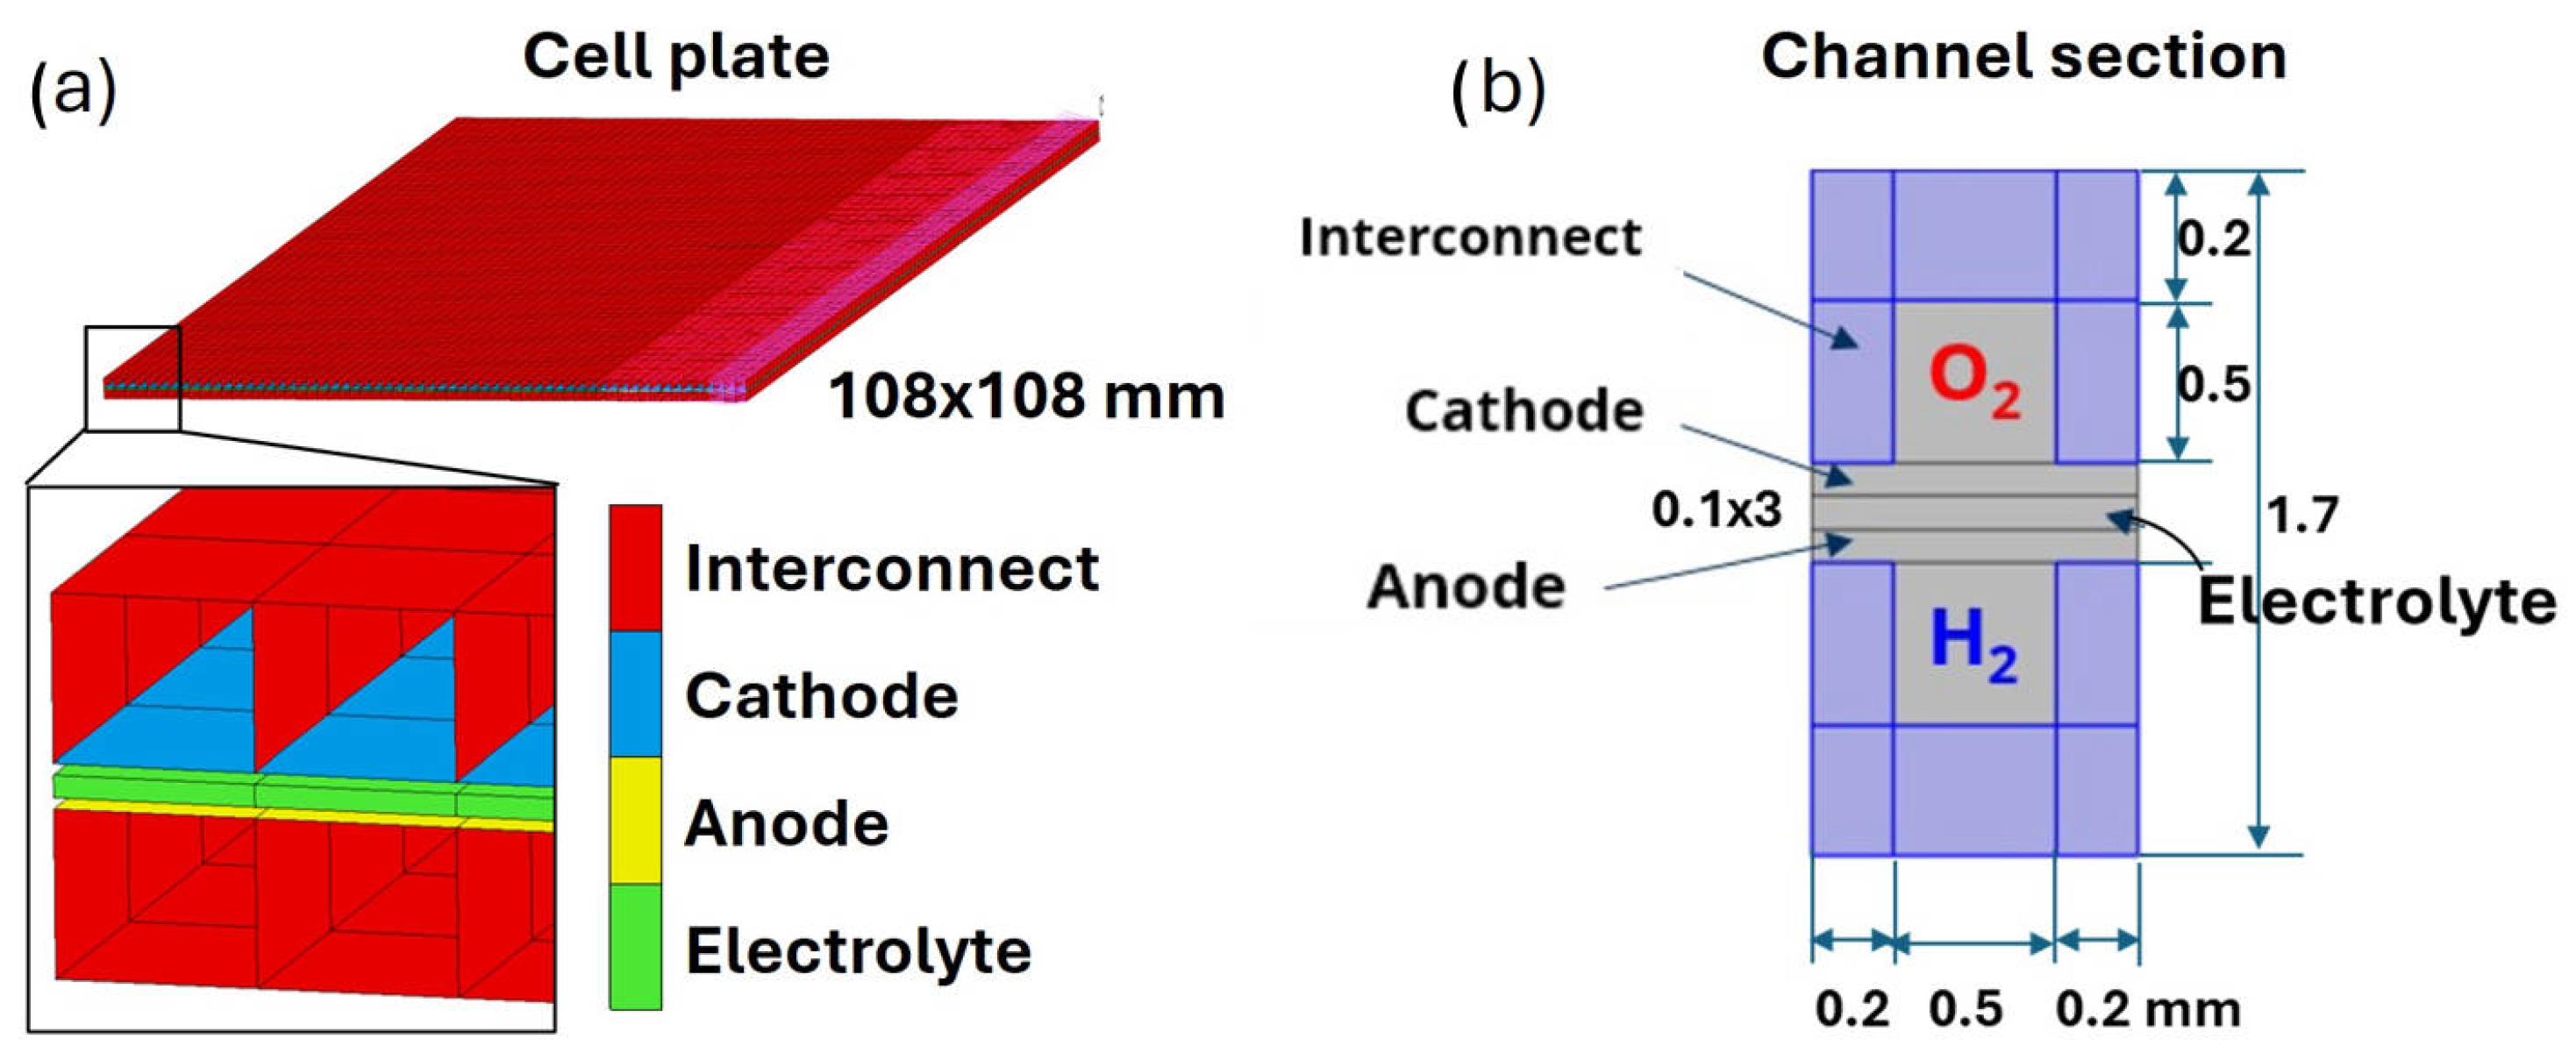
The SOFC unit considered in this work was a generic plane configuration. The repeating unit consists of a stacked positive electrode–electrolyte–negative electrode (PEN) and a metallic interconnect plate. The PEN cathodes and anodes were respectively made of lithium manganese orthosilicate (LMS) and nickel/yttria stabilized zirconia (Ni-YSZ), while the electrolyte was a yttria stabilized zirconia (YZS). The interconnect plate was made of Crofer 22APU, where linear channels were derived for the fuel and oxidant flow. A representation of the cell plate FE model is reported in Figure 1a for a counterflow configuration, with the constituent materials and the mesh elements highlighted. A schematic of the channel section structure is instead reported in Figure 1b, together with the channel and plate dimensions. The cell unit reproduces the configuration investigated by Recknagle et al. [10] from the electrochemical point of view. Their resulting steady-state temperature fields were digitized and adopted as primary input for thermal stress and oxidation process calculations. Both counterflow and crossflow stack designs were taken as a reference for the present modelling.
Figure 1.
Cell plate FE model with highlighted constituent materials and mesh (a), and schematic of channel section structure (b).
The thermo-mechanical FE model was developed adopting the commercial software Marc Mentat 2023.3 [11]. The repeating unit geometry was reproduced in a three-dimensional model adopting four-node shell-type elements for the interconnect and anode, cathode, and solid-shell eight-node brick elements for the electrolyte. A total number of 75,960 elements resulted from a global element size assignment equal to 0.5 mm. The cell was constrained by suppressing rigid body motion, plus the off-plane displacement of the entire bottom surface. No constraints were applied to the cell side faces. A clamping pressure of 0.5 MPa was applied to both the top and bottom surfaces of the cell to reproduce the stacking force. The retrieved temperature distribution was applied as an external initial load to the entire cell volume, neglecting any gradient along the cell’s normal direction. From the starting point, the temperature was updated at each calculation increment according to the proposed degradation model.
2.2. Original Coupled Degradation Procedure and Cell Global Efficiency
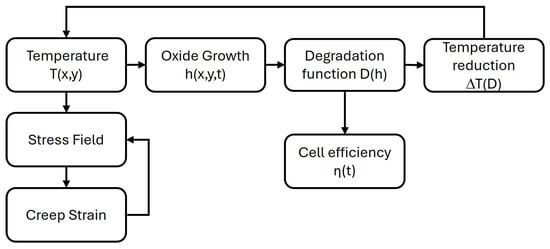
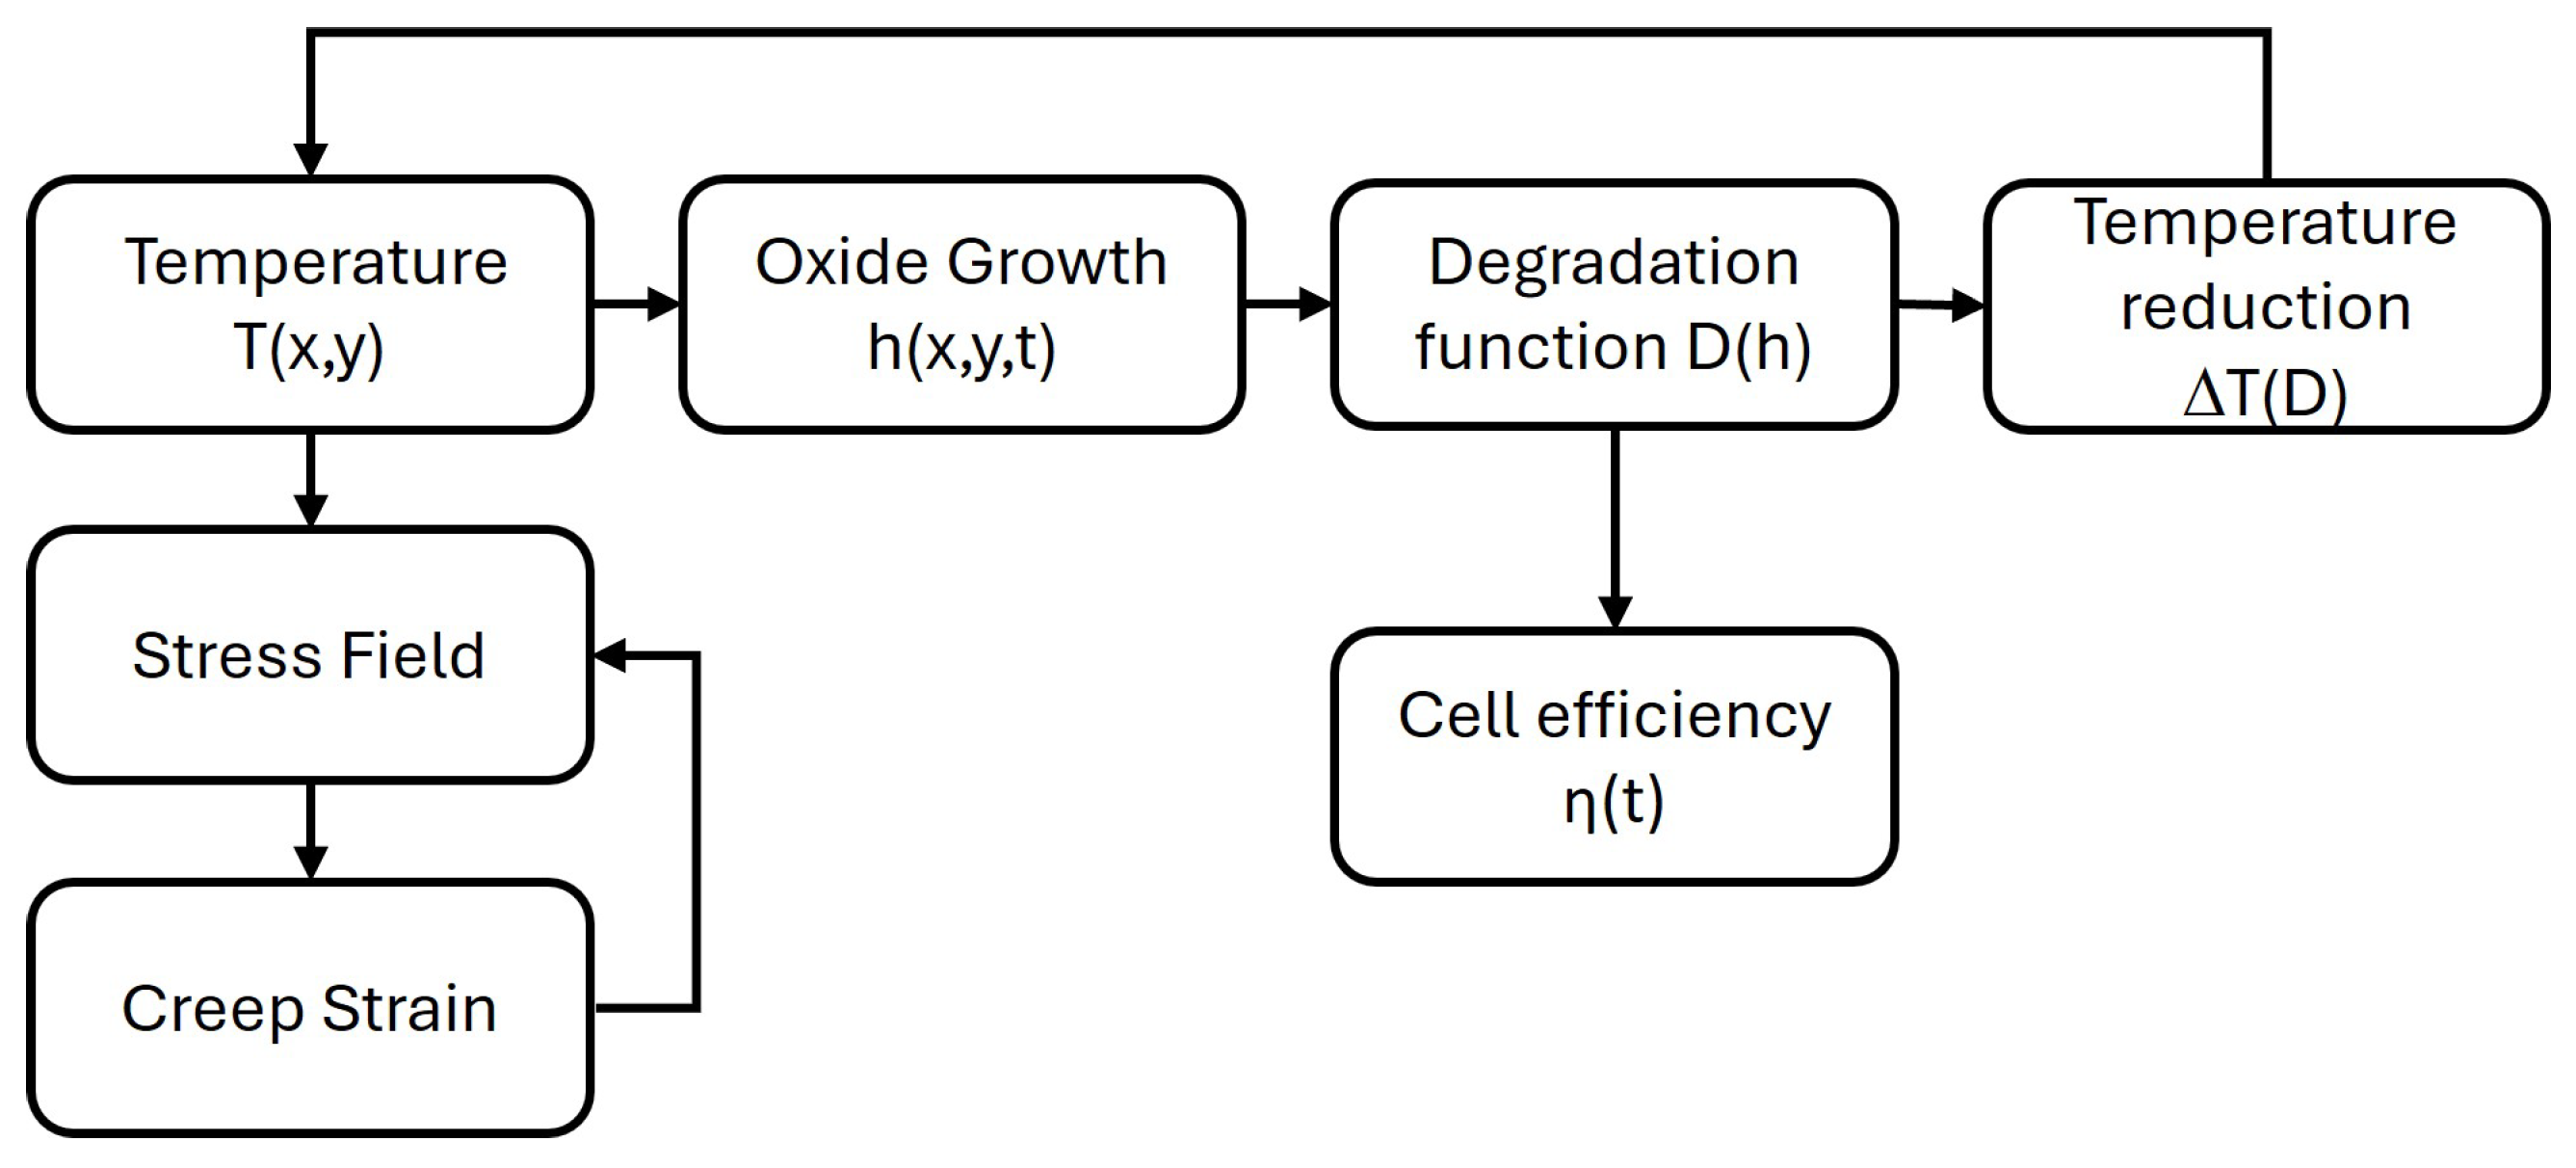
As highlighted in the literature, the formation of oxide on the interconnect channel can affect the cell electrochemical reactivity, reducing efficiency over operating time. These phenomena were implemented in the model via subroutines in the form of a coupled degradation model. A flow chart collecting the proposed calculation procedure was reported in Figure 2. At the beginning of each increment, temperature and oxide thickness were assumed from the previous one and adopted for thermal stress and oxide growth prediction at the current increment time. The calculated stress level and temperature enable the estimation of creep strain. The current oxide thickness influences the degradation function, allowing for the calculation of the average cell efficiency while updating the local temperature for the subsequent increment.
Figure 2.
Coupled degradation procedure flow chart.
The evolution of oxide thickness (h), initially set to zero, was modeled according to Wagner’s parabolic law [12] reported in Equation (1) and as also adopted in other SOFC studies [13,14]. It depends on the simulation time t, the temperature T, the oxide activation energy , and the gas constant . The remaining coefficient is a model parameter to be calibrated.
As a consequence of oxide growth, a reduction in electrochemical reactivity was represented through the local variable referred to as degradation function (D), reported in Equation (2). Depending on the current oxide thickness and on two calibration parameters, and m, D is zero for a null oxide thickness and assumes the maximum value, (D = 1), for an oxide thickness corresponding to the complete suppression of the reactivity of the electrochemical processes of the cell.
The degradation function, as described thus far, is treated as a local variable evaluated at the integration points of each element. The parameter denotes the oxide thickness corresponding to a degradation level of 63.2%. The global cell performance over time can be obtained by considering its integral mean value () on the cell surface, allowing us to define the global efficiency () (3). The quantity expresses the level of global performance of the entire cell with respect to the initial conditions. Depending on the degradation function, and therefore indirectly on the oxide thickness, it is also updated at each increment.
The model feedback scheme is concluded by updating the cell temperature field as a function of the local degradation. In Equation (4), the local temperature change (), related to the generic time increment (), is reported. It depends on the degradation function change in the current increment, and it is proportional to the maximum permitted temperature range, defined as the difference between the maximum absolute temperature at the cell full efficiency and the minimum temperature under fully degradated conditions. The described values were respectively taken from the reference literature temperature maps ( °C) and are equal to the inlet temperature of the working fluids ( °C).
The resulting temperature drop is superimposed on the current temperature and supplied to the software as input for the subsequent calculation step. The cell operating temperature, as well as the extent of the resulting stress field, fall within the range of interest for the creep phenomena of the considered materials. Thus, a Norton law model (5) was implemented for each. Neglecting the primary stage, it describes the creep strain rate in the steady state stage, depending on the creep activation energy , the gas constant R, the temperature T, and the applied stress . The model needs to calibrate two parameters characteristic of each material. The pre-exponent and the exponent n were assumed from the literature and from the author’s previous studies.
2.3. Material Properties and Investigated Case-Studies
In Table 1, the main elastic response (i.e., Young’s modulus (E), Poisson’s coefficient (), and thermal expansion coefficient ()), together with the creep parameters, are reported for the interconnect, anode, cathode, and electrolyte materials.
Table 1.
Main elastic and creep properties adopted for the cell constituent materials.
The remaining parameters, considered for oxide growth [16] and degradation function laws related to the Crofer 22APU interconnect, are reported in Table 2.
Table 2.
Oxide growth and degradation function law parameters for the Crofer 22APU interconnect.
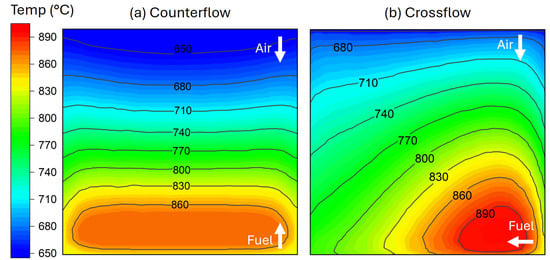
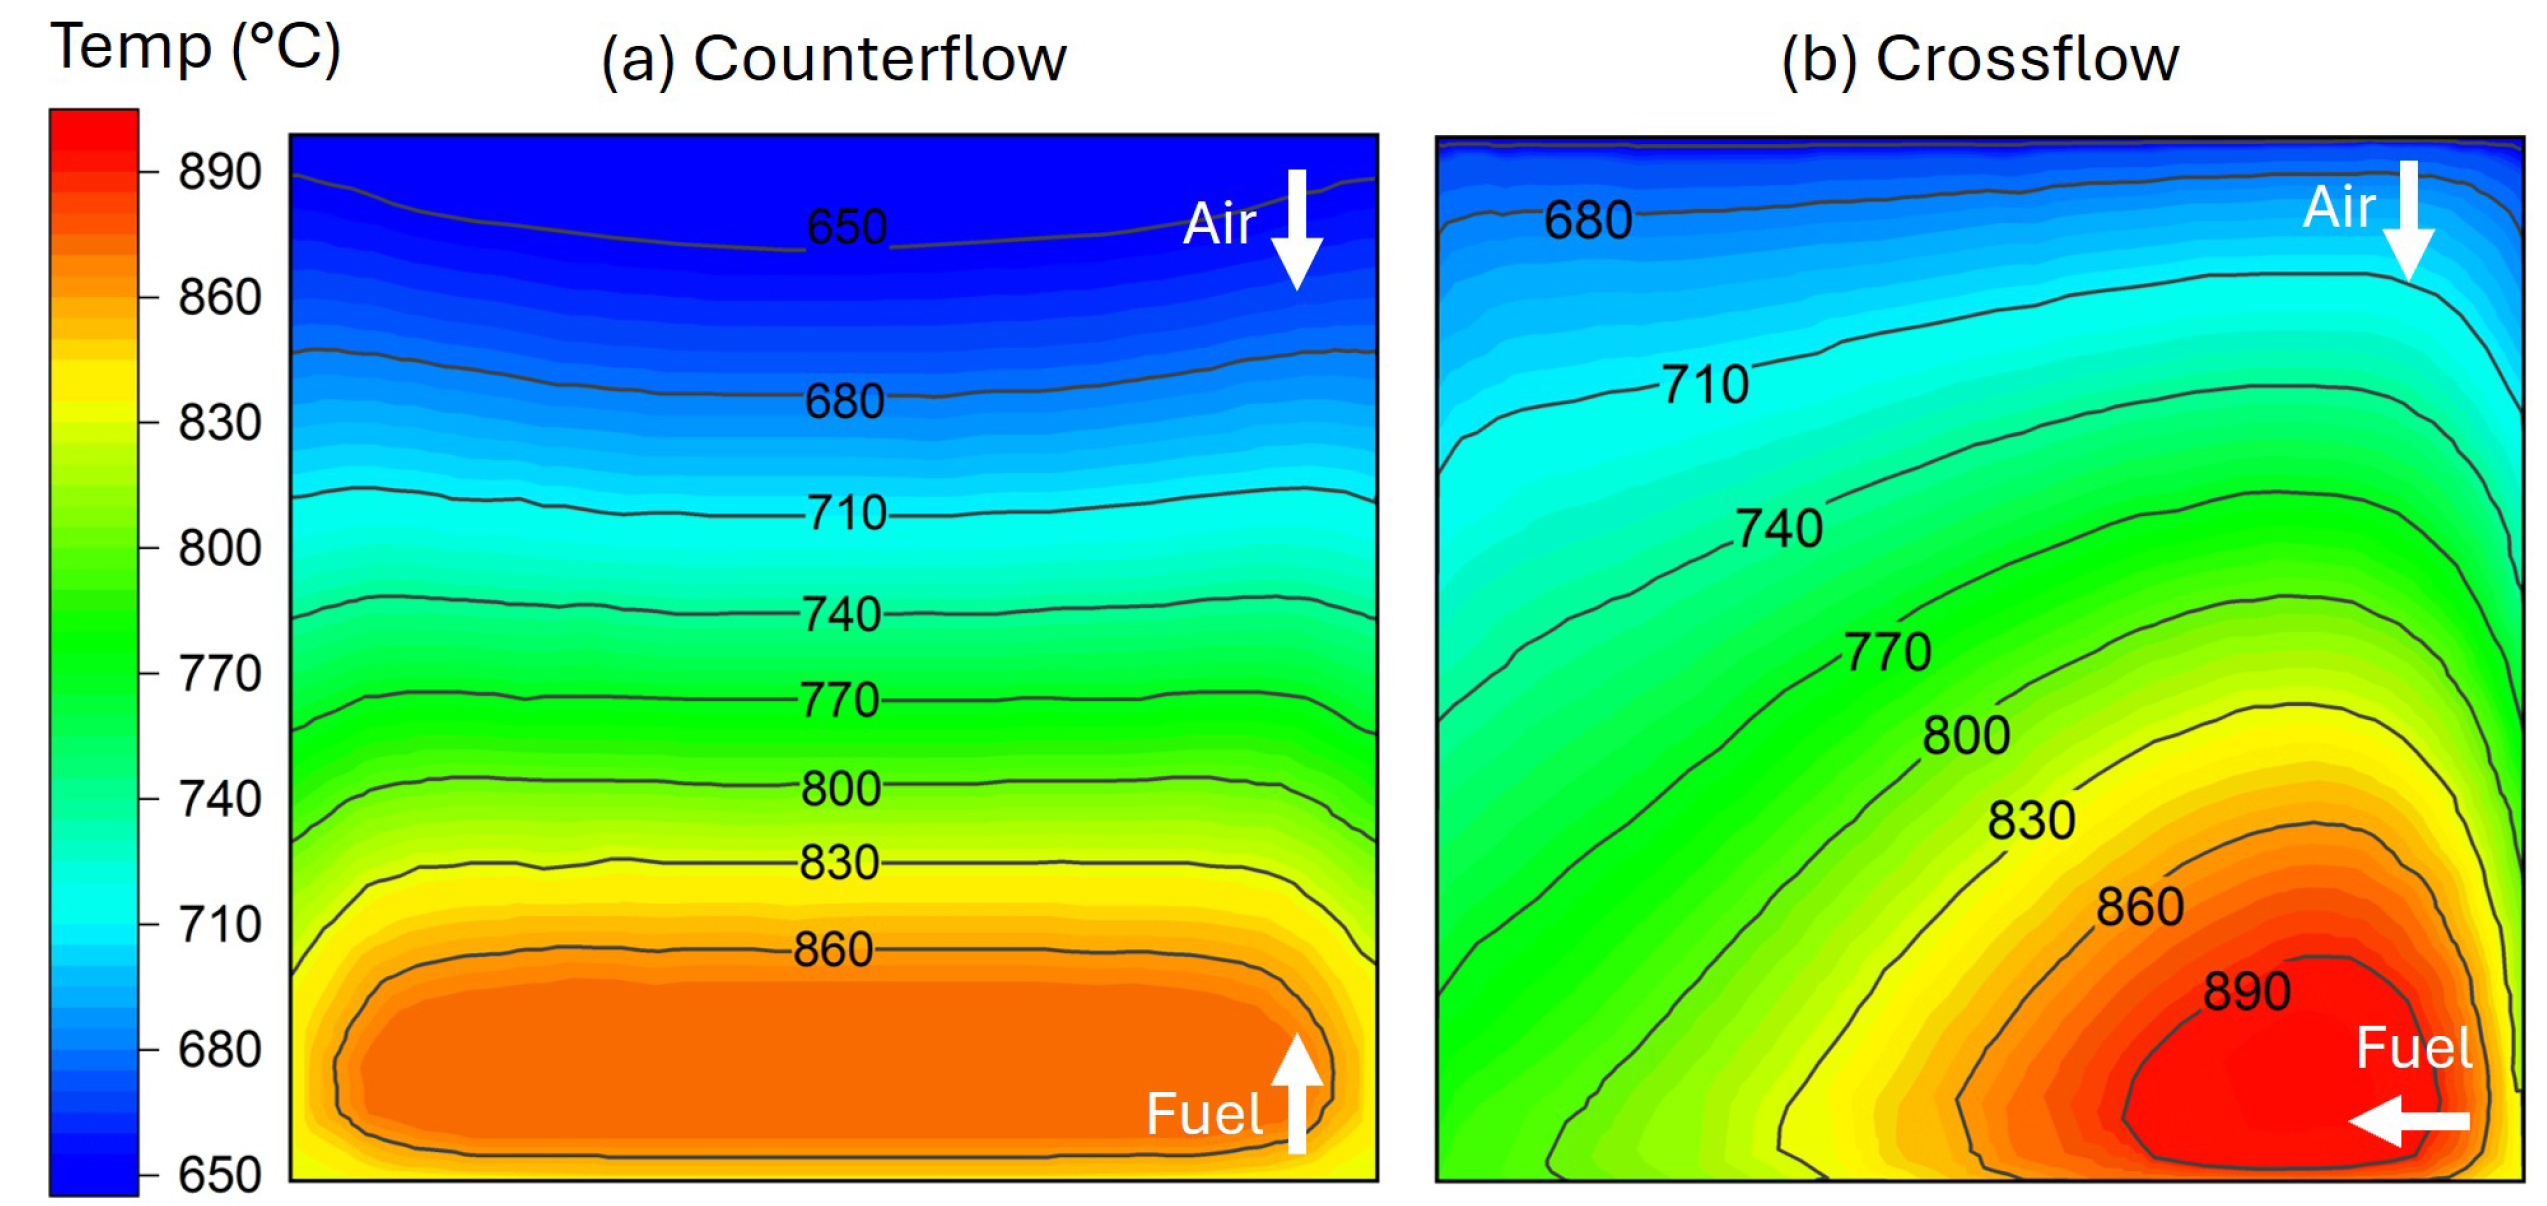
The coupled degradation procedure was tested on two different cell configurations: a counterflow functioning, consisting of parallel interconnect channels and opposite directions of the oxidant and fuel flows, and a crossflow with orthogonal channels. The initial distributions of temperature, retrieved from the literature [10], are reported respectively for the counterflow and crossflow case in Figure 3a,b. The cell functioning was simulated for both configurations over an operating time equal to h.
Figure 3.
Distributions of temperature field for the counterflow (a) and crossflow (b) configuration, assigned as the initial simulation condition.
The trend of oxide thickness and temperature were analyzed, and the global cell efficiency was estimated at h of functioning for both the considered configurations.
3. Results and Discussion
3.1. Cell Degradation
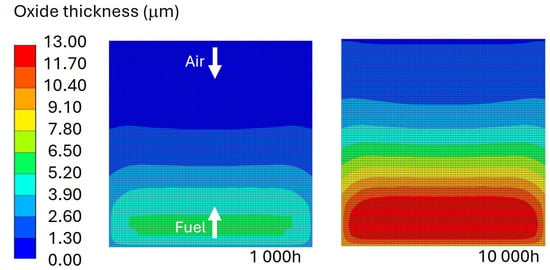
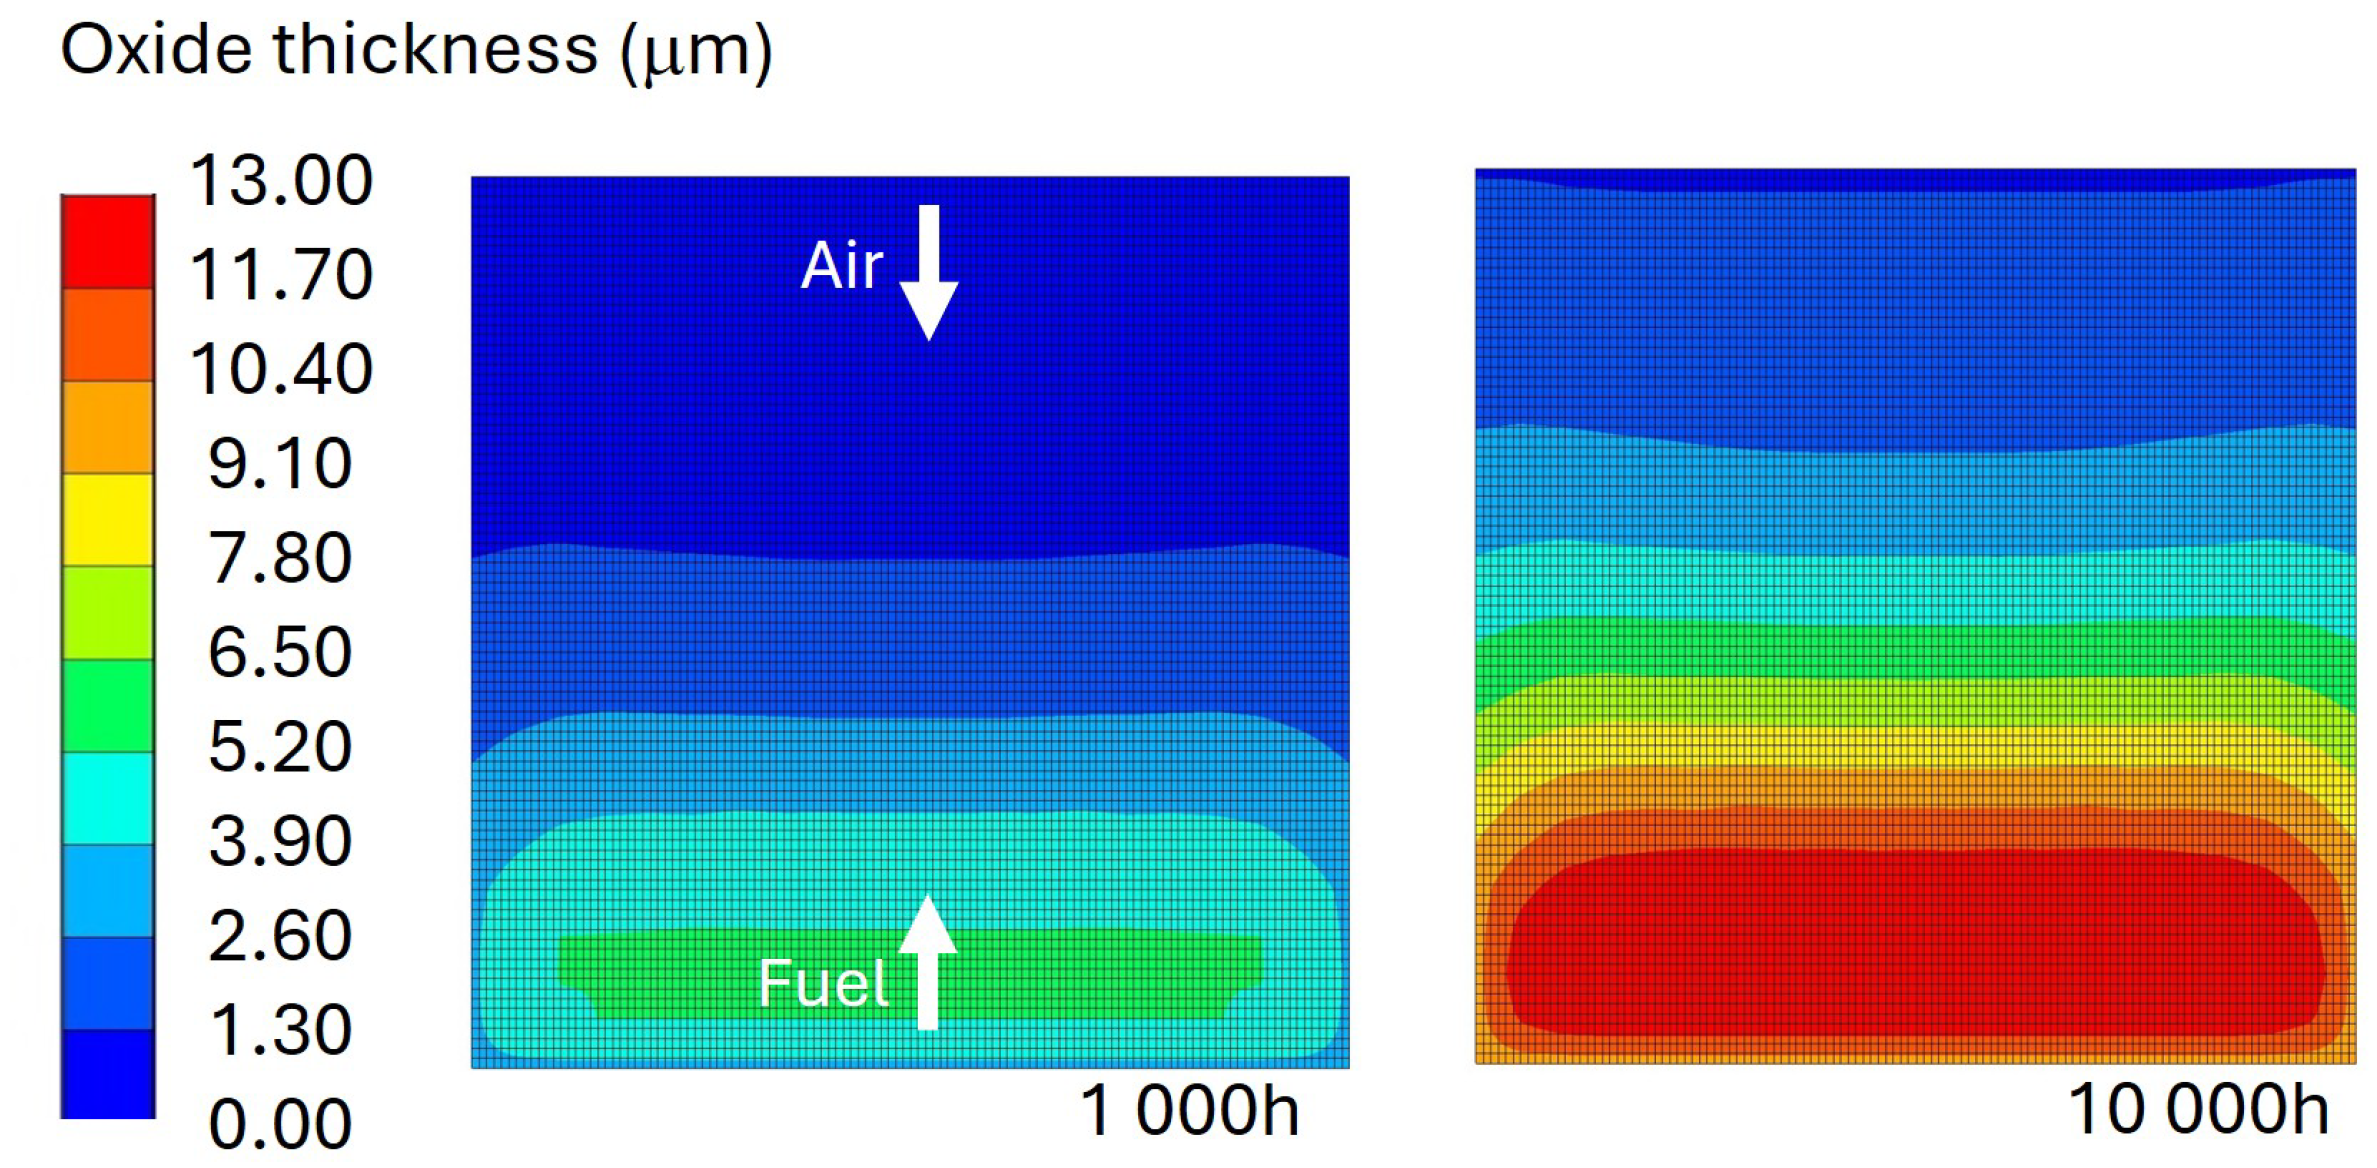
As a result of simulations, the software provided the local value of the oxide thickness variable. In Figure 4, the contour plot reporting the cumulated oxide on the cell plate surface, for the counterflow configuration, is shown at a functioning time of and h. It can be observed the initial higher temperature induced the faster oxide formation, according to Equation (1). The fuel inlet side exhibits the thickest oxide layer, underscoring the higher electrochemical cell reactivity in that region, while the air inlet resulted the coldest side of the cell for all the considered operating time horizon.
Figure 4.
Distribution of oxide thickness variable on cell plate surface at functioning time of and h.
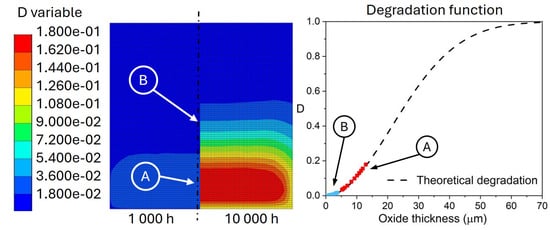
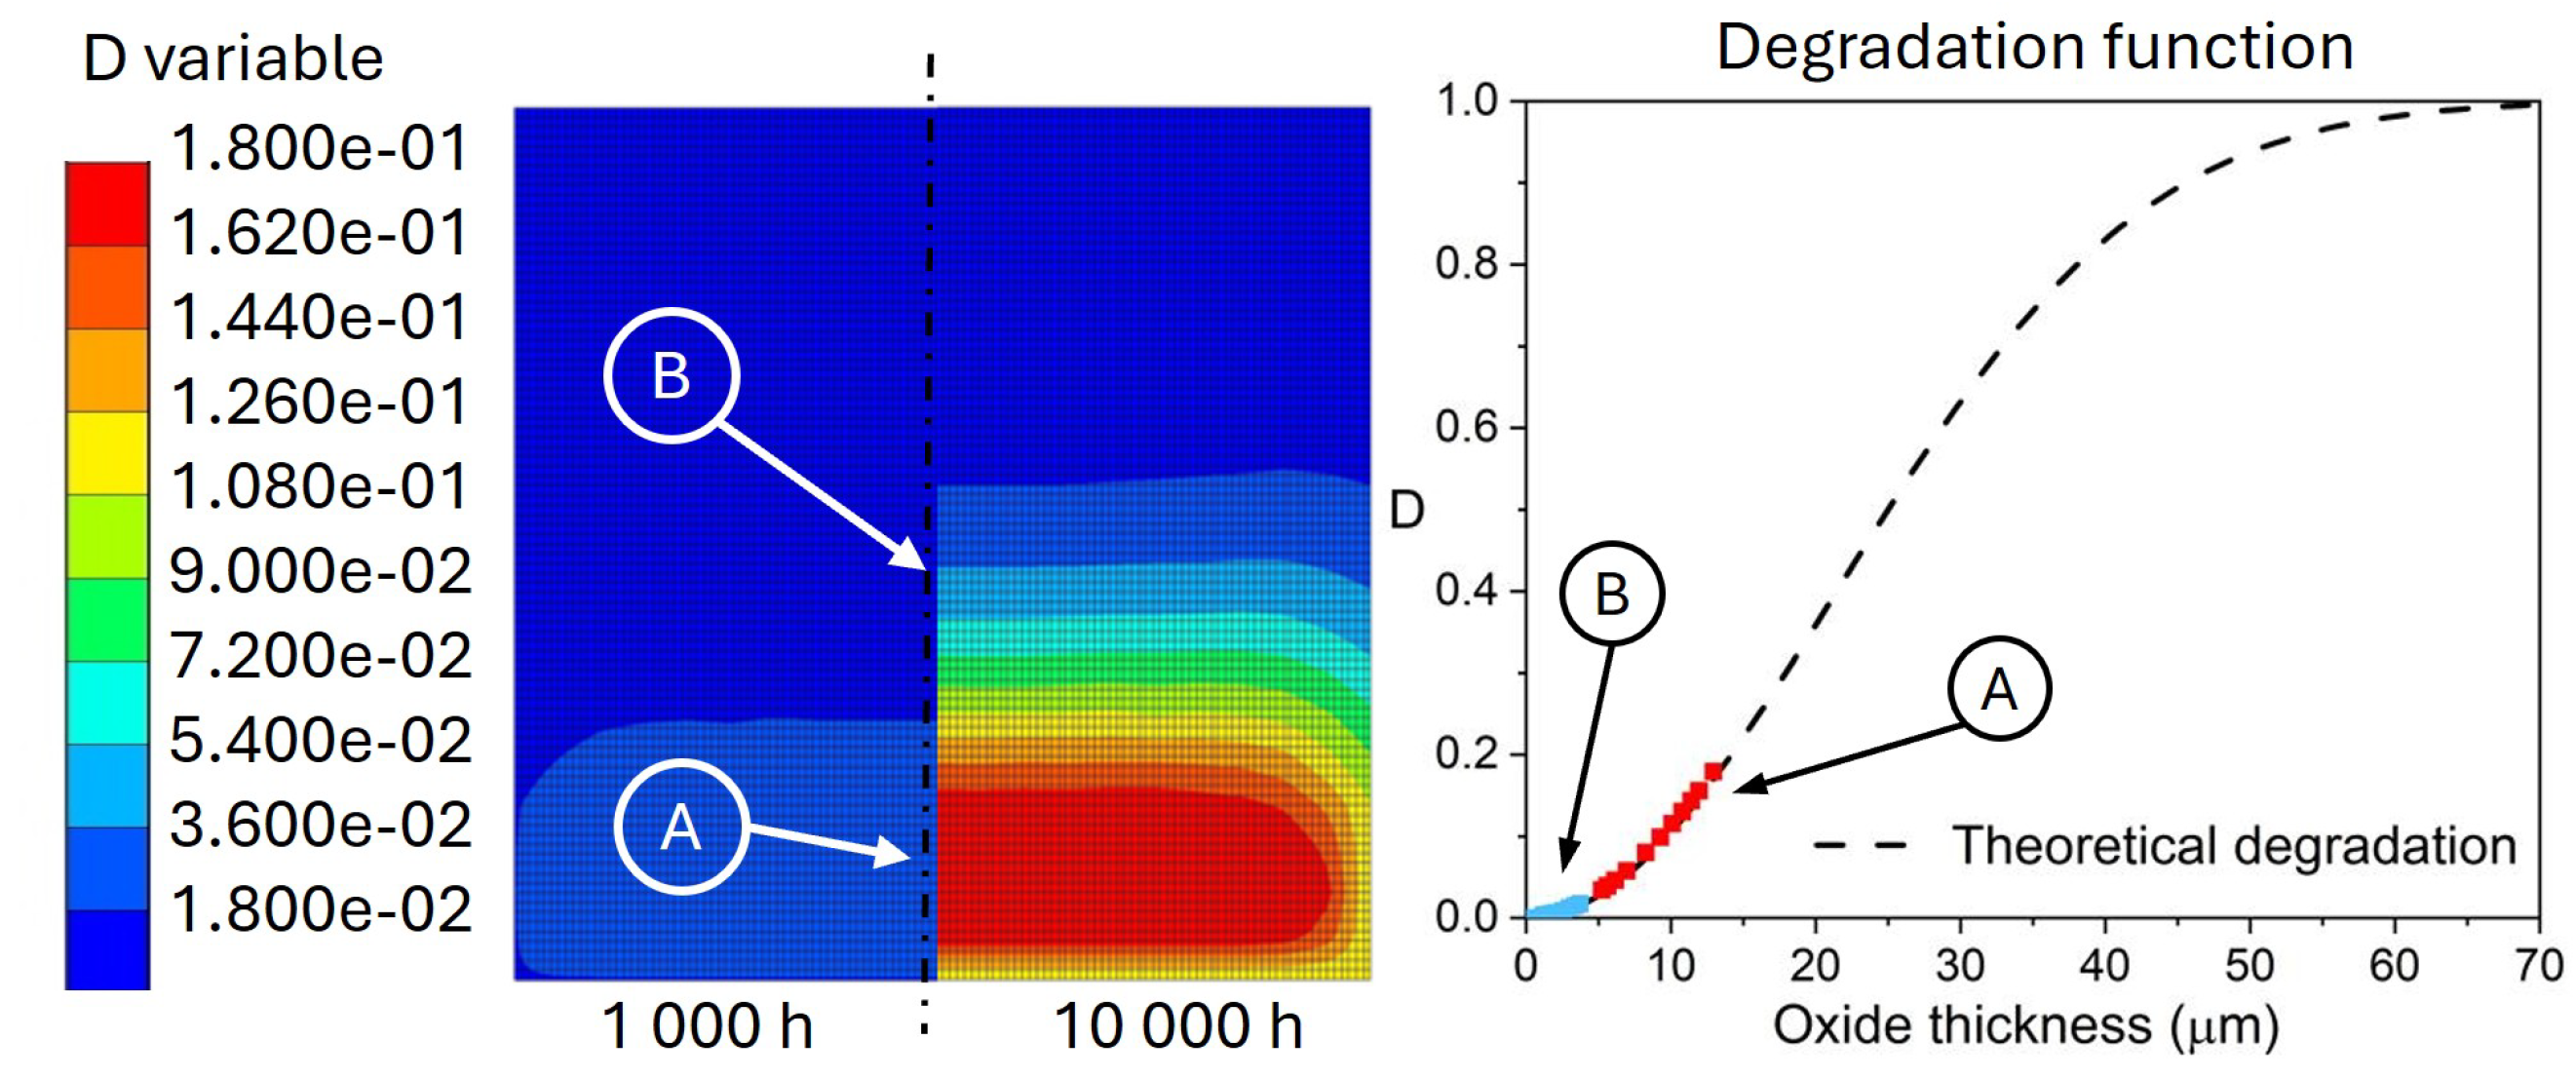
The oxide thickness gradient affects the distribution of the degradation function, as reported in Figure 5, for a functioning time of and h. After h, the most degraded areas result to be those experiencing the highest temperature close to the fuel inlet, with a maximum degradation close to 18% of the initial reactivity. On the other hand, the coldest region reported the lowest reactivity drop with a minimum value in the area of the air inlet one order of magnitude lower (1.8%). In Figure 5, the local evolution of the D variable, as a function of the oxide thickness, is reported as an example for two monitoring points, A and B, respectively, selected at the maximum oxide thickness and close to 4 m of thickness.
Figure 5.
Distribution of degradation variable at functioning time of and h, and plot of degradation evolution over theoretical degradation law for points A and B.
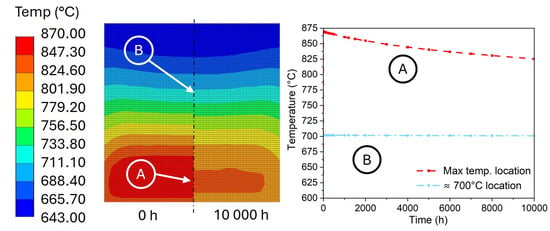
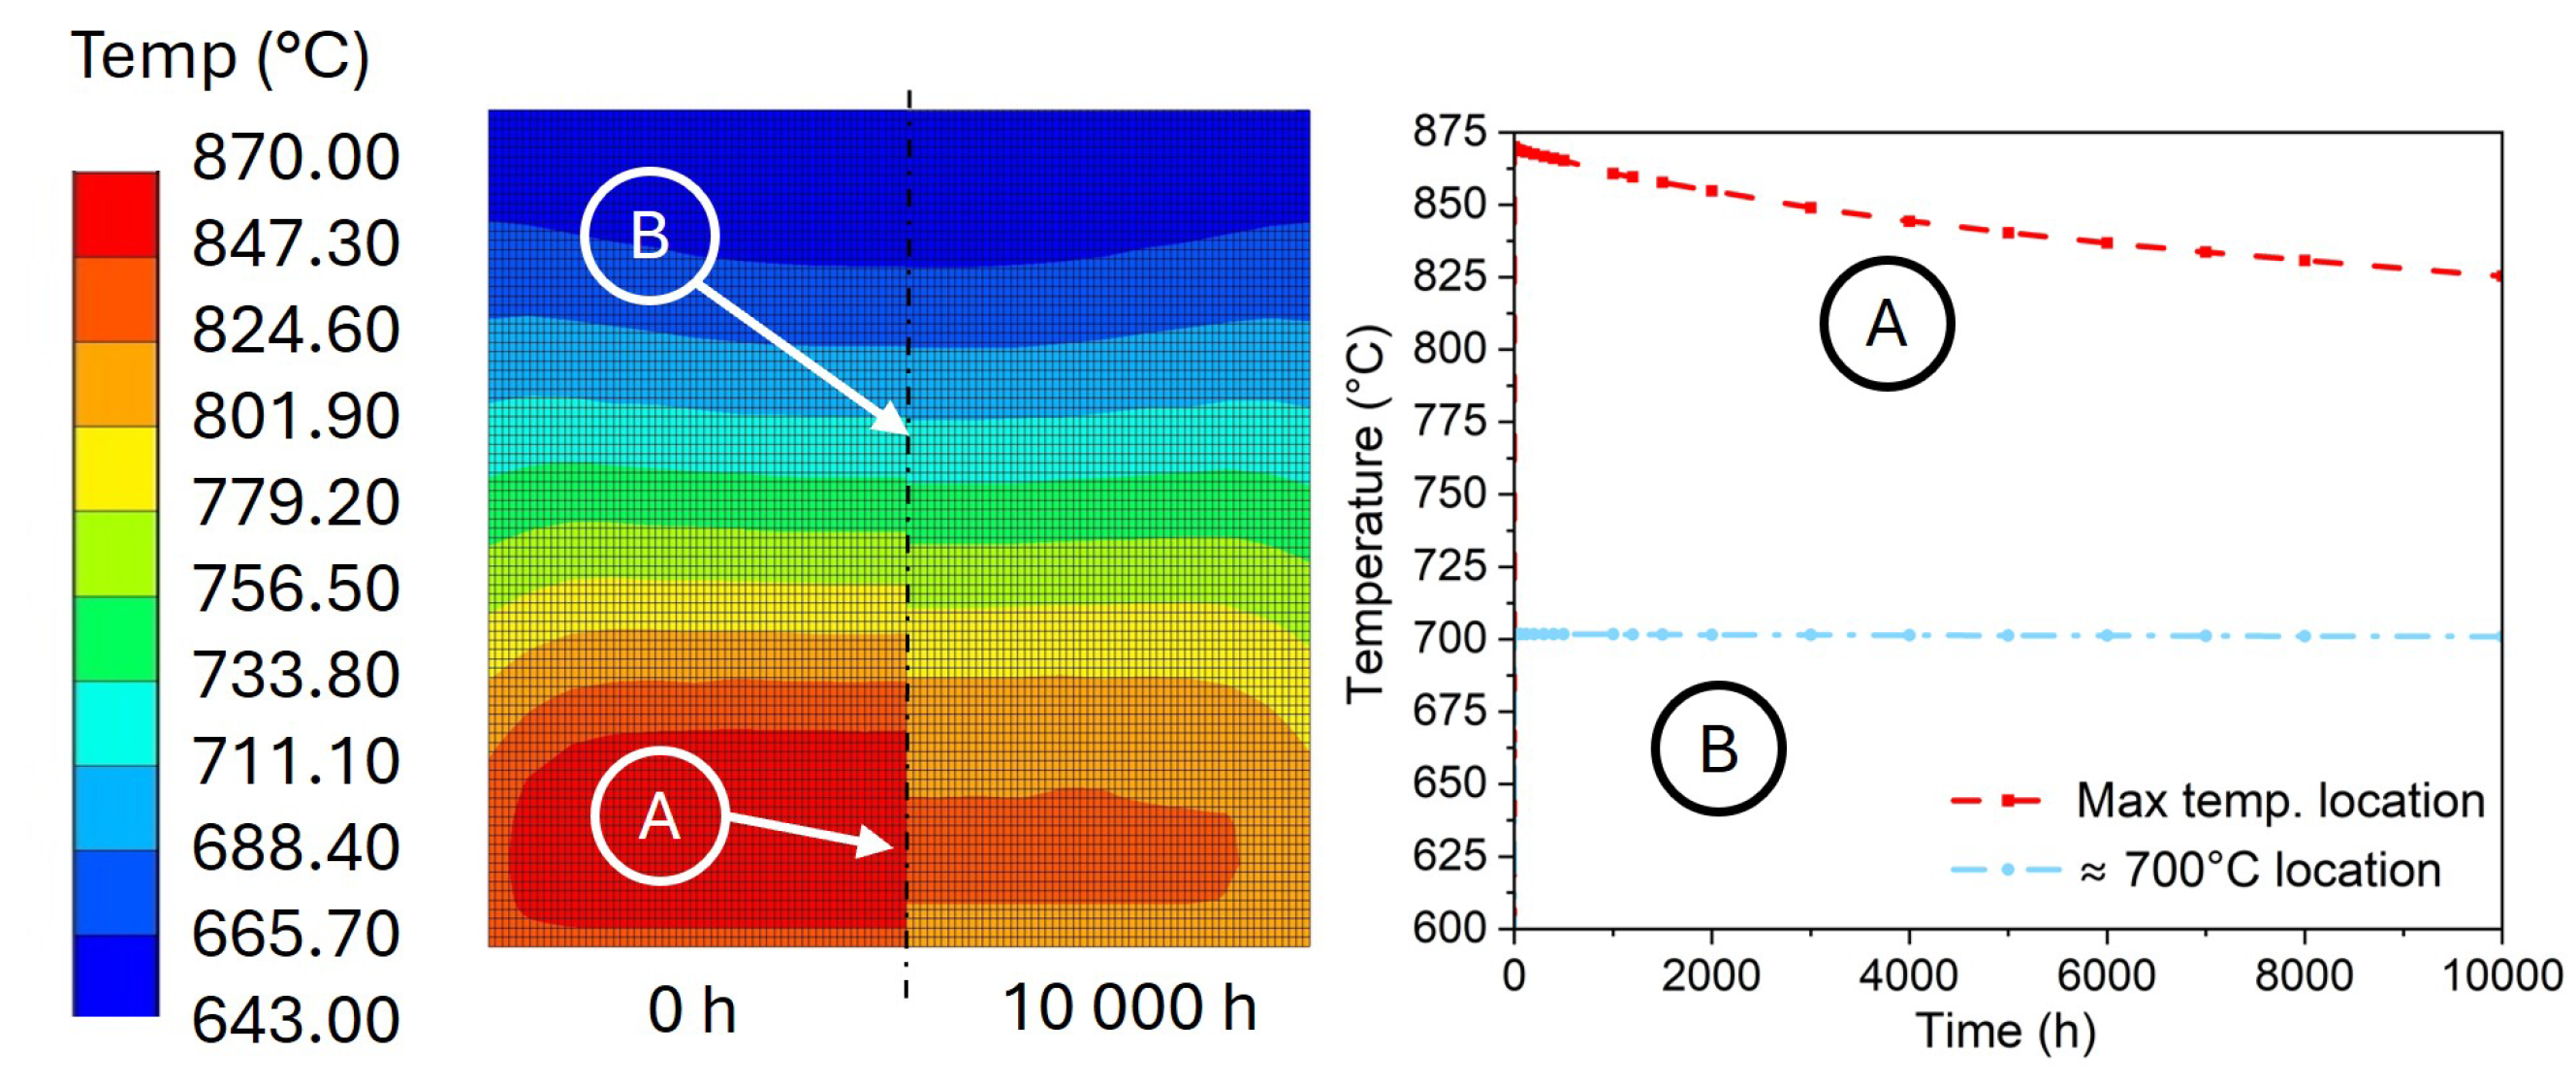
According to Equation (4), the gradient of the degradation function directly influences the temperature during simulation, increment by increment. This leads to progressive cooling until the electrochemical reactivity of the cell is completely exhausted. A comparison between the temperature distribution at the beginning of the simulation and at h is reported in Figure 6. The trend of local cooling for the initial highest temperature point (A) and a point initially at 700 °C (B) is reported in the plot as a function of simulation time. It can be observed that the higher the temperature, the faster the cooling, since point A, initially at 875 °C, cools down at about 45 °C, while point B has a quite negligible cooling (4 °C).
Figure 6.
Distribution of the temperature variable on cell plate surface at the initial time and a functioning time of h.
3.2. Materials Creep Response
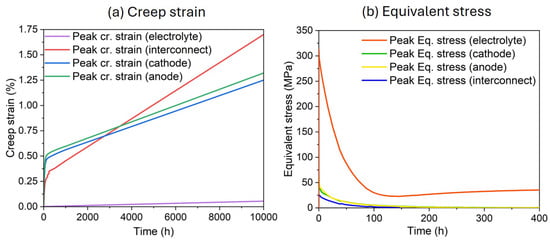
From a structural perspective, the effect of creep and stress field on the cell components was assessed. The evolution of the equivalent creep strain was reported in Figure 7a for the most loaded point of each material over h. According to the different creep properties, different levels of creep strain were reached. It should be emphasized that, regardless of the material considered, since only the steady-state phase of creep has been modeled, the rapid deformation transients observed in the first hours of operation are attributable solely to the stress relaxation effect. The trend of equivalent stress is reported in Figure 7b over the first 400 h. A generalized stress relaxation can be observed for each material. The most severe relaxation interested the electrolyte, with a drop of stress of about 250 MPa, while the remaining materials showed a similar trend, with a drop of about 50 MPa. However, a rapid decay of relaxation results in the stabilization of the stress level within the first 200 h. During this time interval, the anode and cathode accumulate approximately 0.5% strain, followed by the interconnect with about 0.3%, and finally the electrolyte, which exhibits a negligible strain accumulation. After this initial stage, the strain rate stabilizes. The anode and cathode exhibit comparable rates, both lower than that of the interconnect, while the electrolyte shows the lowest rate. Consequently, the strain accumulation of the interconnect reaches that of the anode and cathode within 3000 h, and at h, results in the largest, attaining 1.70% compared to 1.20% for both the anode and cathode. The electrolyte exhibits minimal evolution, not exceeding 0.1%. In any case, the maximum accumulated creep strain in the materials is on the order of only a few percent, and is therefore not of concern with respect to the structural integrity over the time horizon considered. It should also be emphasized that, for longer time horizons, the extent of creep phenomena will tend to decrease due to the progressive cooling of the cell toward temperatures outside the range relevant for creep.
Figure 7.
Evolution of creep strain (a) and equivalent stress (b) for the most loaded point of the considered materials.
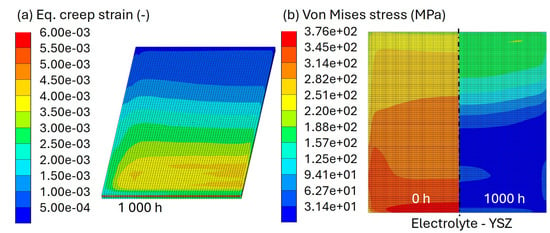
In Figure 8a, the contour plot of the equivalent creep strain after h is reported in half cell volume. For each material, the higher strains are located in the higher-temperature region. The result of interest emerged by considering the equivalent Von Mises stress distribution on the electrolyte reported in Figure 8b. At the initial simulation time, the equivalent stress reaches the higher values on the fuel inlet cell side, progressively decreasing toward the opposite air inlet side. Notably, the predicted evolution of the stress field is qualitatively similar to trends reported in an independent study under comparable operating conditions [17], further corroborating the validity of the present model. At the beginning, the equivalent stress for the electrolyte ranges from 350 MPa to 250 MPa. As a result of stress relaxation phenomena, after h the stress peak is approximately halved, while the minimum is reduced by an order of magnitude to 31 MPa. However, the location of the maximum and minimum equivalent stress results reversed, with the air inlet side experiencing the more severe stress and the minimum value located at the fuel inlet, where the initial conditions lead to more severe relaxation.
Figure 8.
(a) Distribution of equivalent creep strain in half cell volume after h; (b) Von Mises equivalent stress distribution on the electrolyte at initial time and at h.
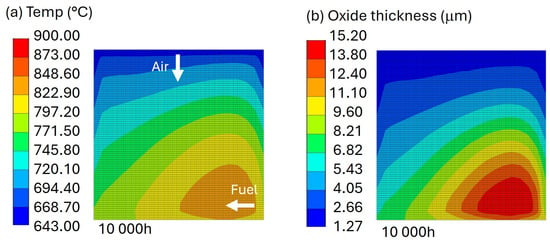
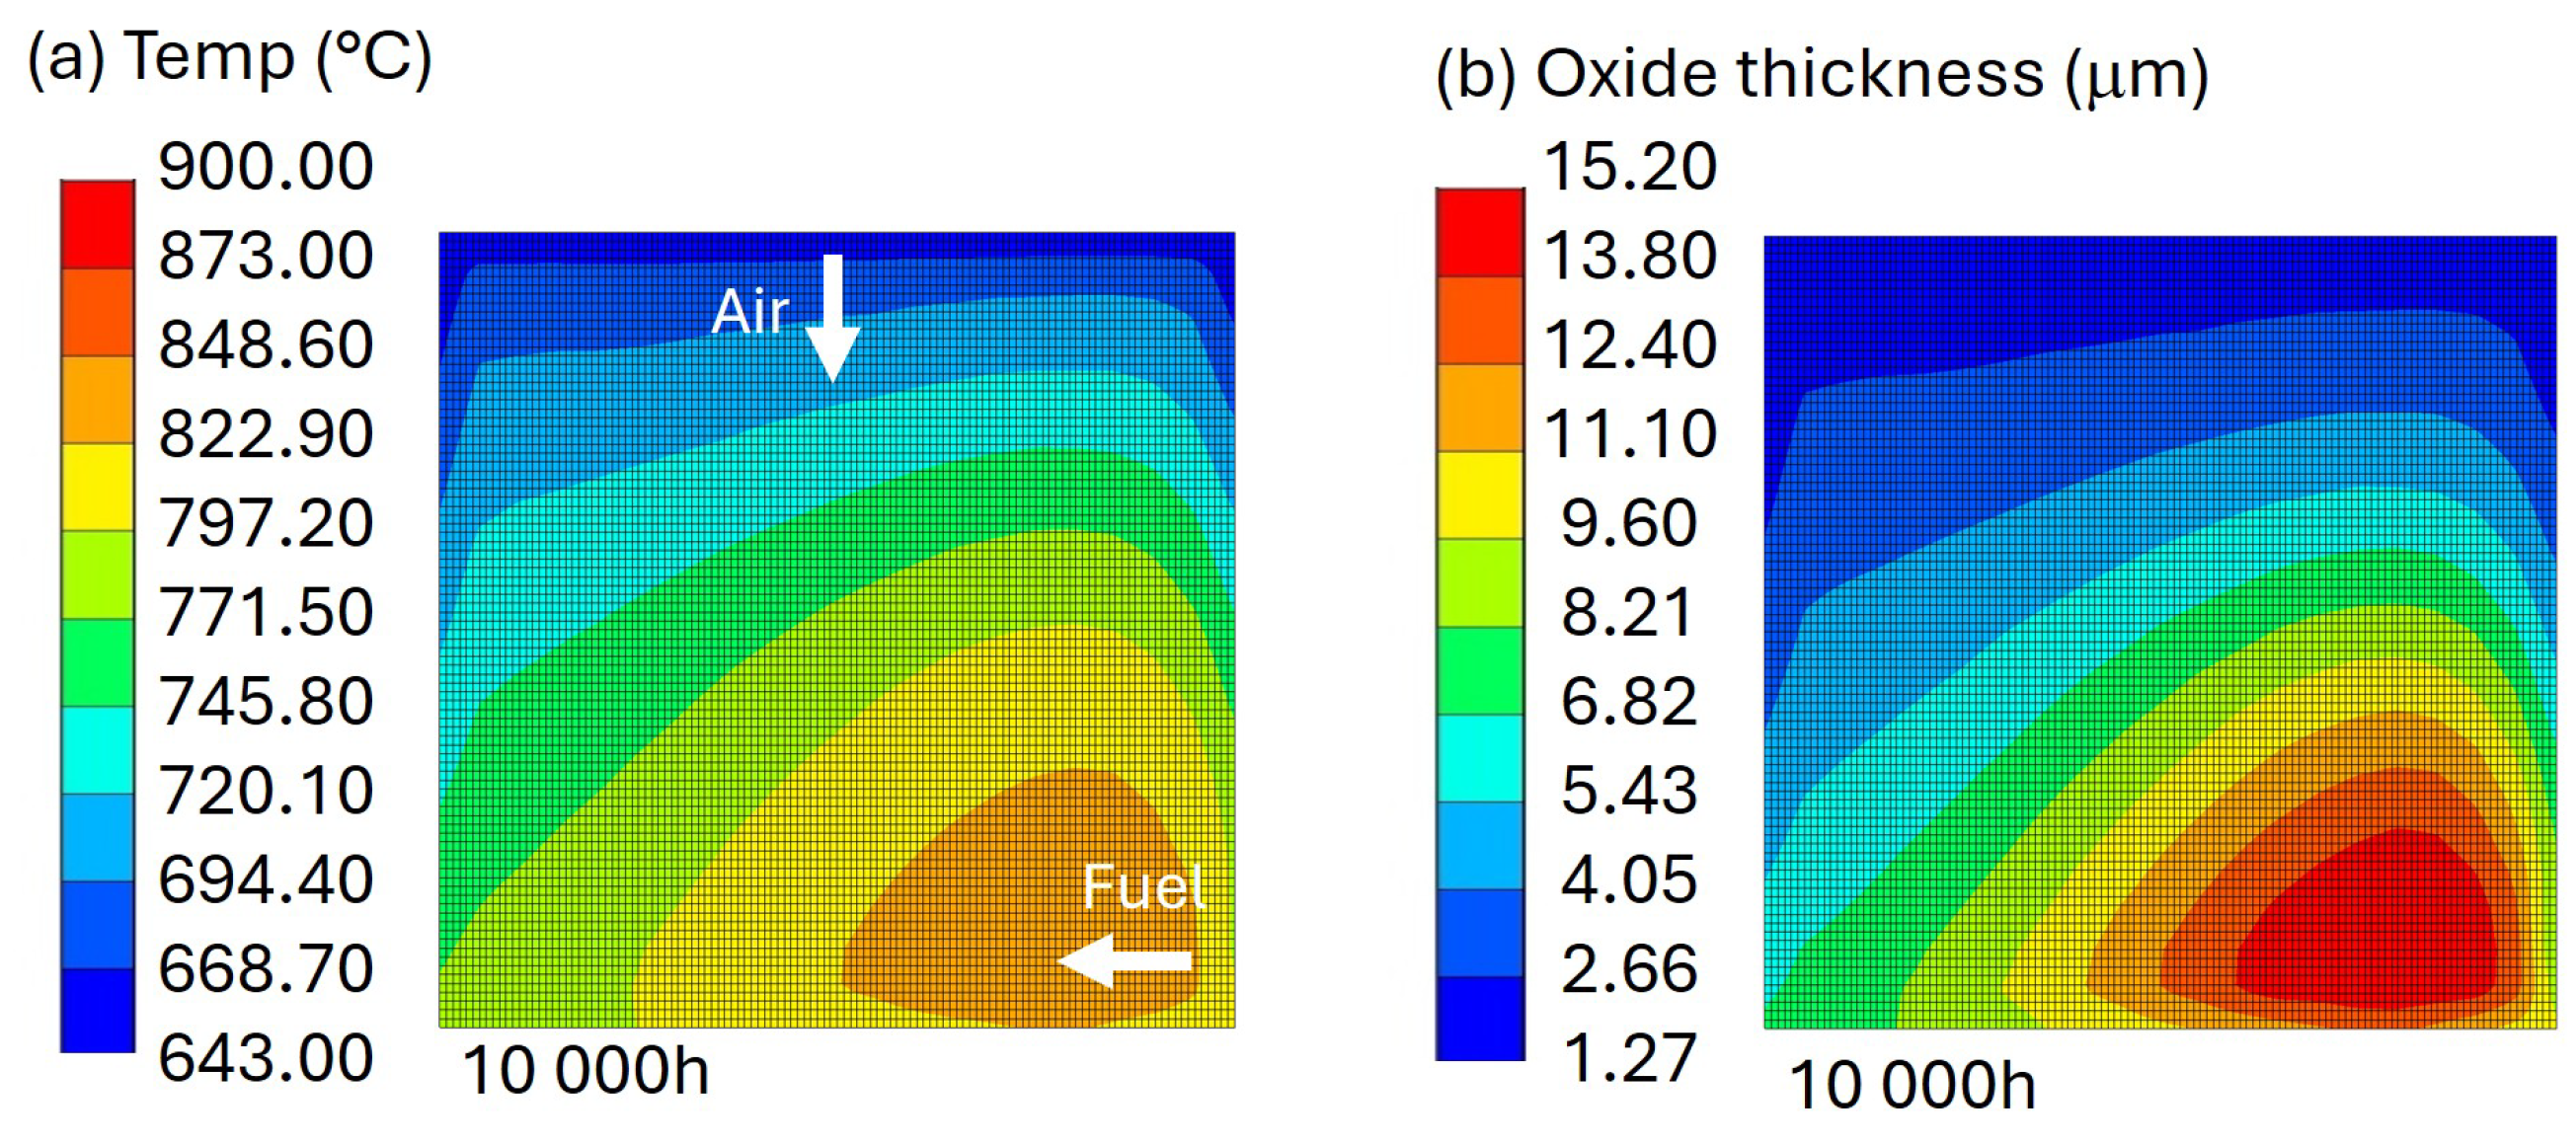
The proposed degradation model was also tested on a crossflow configuration cell. For the sake of brevity, only the most relevant findings at the end of the simulation were reported. After h of functioning, the distribution of temperature (Figure 9a) shows a significantly lower maximum value in the face of a comparable initial one. The contour plot shows that the high temperature is localized at the edge between the inlet fuel and air outlet sides and progressively decreases in all directions, reaching the minimum on the air inlet side. The corresponding distribution of oxide reproduces the described trend, as shown in Figure 9b, by reaching a maximum thickness comparable to those resulting for the counterflow configuration. However, the minimum oxide thickness (1.27 m) at the air inlet side always resulted in higher values with respect to the null minimum for the counterflow configuration.
Figure 9.
Distribution of temperature and oxide thickness for the crossflow configuration after h.
In order to compare the performance level of the cell over its service life while accounting for the degradation phenomena described in this work, an estimation of the overall efficiency for the two flow configurations was conducted and is reported in Table 3. After operation hours, an efficiency loss of about 7.1% occurred in the counterflow configuration cell, while the crossflow exhibited a higher efficiency loss (8.6%).
Table 3.
Global cell efficiency after h for the counterflow and crossflow cell configuration.
4. Conclusions
In this work, an original coupled thermo-mechanical degradation model was developed and implemented within a finite element framework for the long-term reliability assessment of SOFCs. The model accounts for oxide growth on metallic interconnects, its coupling with local thermal fields, and the consequent loss of electrochemical reactivity over time.
The proposed formulation introduces a new local degradation variable directly linked to the evolving oxide thickness that enables the quantitative evaluation of performance decay at the cell level. This approach allows for the local degradation state to dynamically affect both the temperature distribution and the overall efficiency prediction throughout operation. The modeling framework was applied to two planar flow configurations (i.e., counterflow and crossflow), showing that the oxide growth rate and resulting degradation strongly depend on the local temperature distribution. After h of simulated operation, the counterflow configuration exhibited a lower global efficiency loss (7.1%) compared to the crossflow one (8.6%), due to the more homogeneous temperature field. Creep modeling was fully coupled with oxide growth by thermal feedback, influencing local stress redistribution. Creep effects, modeled through Norton’s law, remained limited within a few percent of strain, indicating that structural integrity is preserved over the investigated time horizon.
Overall, the integrated modeling approach provides a predictive tool capable of linking microstructural degradation mechanisms with global SOFC performance. Future developments will focus on model calibration against experimental data and on extending the framework to include other degradation phenomena, aiming toward a comprehensive lifetime prediction of SOFC stacks.
Author Contributions
L.E. was the principal investigator and contributed to writing and proofreading. M.B. performed data analysis and assisted in conceptualization, drafting, and revising the manuscript. P.P. oversaw data collection and supervision. E.A. contributed to corrections and supervision. G.P.P. assisted with analysis and draft revisions. L.M. contributed to supervision and proofreading. All authors have read and agreed to the published version of the manuscript.
Funding
This research was funded by the Italian Ministry of University and Research (MUR) through its Research Projects of Significant National Interest—grant number: P2022MBTEZ—PRIN 2022 PNRR.
Institutional Review Board Statement
Not applicable.
Informed Consent Statement
Not applicable.
Data Availability Statement
Data available on request from the authors.
Conflicts of Interest
The authors declare no conflicts of interest. The funders had no role in the design of the study; in the collection, analyses, or interpretation of data; in the writing of the manuscript; or in the decision to publish the results.
Abbreviations
The following abbreviations are used in this manuscript:
| SOFCs | Solid Oxide Fuel Cells |
| FE | Finite Element |
| LMS | Lithium Manganese orthosilicate |
| YZS | Yttria Stabilized Zirconia |
| Ni-YSZ | Nickel/Yttria Stabilized Zirconia |
References
- Golkhatmi, S.Z.; Asghar, M.I.; Lund, P.D. A review on solid oxide fuel cell durability: Latest progress, mechanisms, and study tools. Renew. Sustain. Energy Rev. 2022, 161, 1–34. [Google Scholar] [CrossRef] [Scilit]
- Mehran, M.T.; Khan, M.Z.; Song, R.H.; Lim, T.H.; Naqvi, M.; Raza, R.; Zhu, B.; Hanif, M.B. A comprehensive review on durability improvement of solid oxide fuel cells for commercial stationary power generation systems. Appl. Energy 2023, 352, 121864. [Google Scholar] [CrossRef] [Scilit]
- Wu, Z.; Zhu, P.; Huang, Y.; Yao, J.; Yang, F.; Zhang, Z.; Ni, M. A comprehensive review of modeling of solid oxide fuel cells: From large systems to fine electrodes. Chem. Rev. 2025, 125, 2184–2268. [Google Scholar] [CrossRef] [Scilit] [PubMed]
- Froitzheim, J. Ferritic Steel Interconnectors and Their Interactions with Ni Base Anodes in Solid Oxide Fuel Cells (SOFC); Forschungszentrum Jülich GmbH: Jülich, Germany, 2008. [Google Scholar]
- Jiang, S.P.; Li, Q. Solid Oxide Fuel Cells: Principles and Materials. In Introduction to Fuel Cells: Electrochemistry and Materials; Springer: Berlin/Heidelberg, Germany, 2021; pp. 357–424. [Google Scholar]
- Spotorno, R.; Bianchi, F.R.; Paravidino, D.; Bosio, B.; Piccardo, P. Test and modelling of solid oxide fuel cell durability: A focus on interconnect role on global degradation. Energies 2022, 15, 2762. [Google Scholar] [CrossRef] [Scilit]
- Bianco, M.; Ouweltjes, J.P.; Van herle, J. Degradation analysis of commercial interconnect materials for solid oxide fuel cells in stacks operated up to 18000 h. Int. J. Hydrogen Energy 2019, 44, 31406–31422. [Google Scholar] [CrossRef] [Scilit]
- Peng, J.; Zhao, D.; Xu, Y.; Wu, X.; Li, X. Comprehensive analysis of solid oxide fuel cell performance degradation mechanism, prediction, and optimization studies. Energies 2023, 16, 788. [Google Scholar] [CrossRef] [Scilit]
- Esposito, L.; Boccaccini, D.; Pucillo, G.P.; Frandsen, H. Secondary creep of porous metal supports for solid oxide fuel cells by a CDM approach. Mater. Sci. Eng. A 2017, 691, 155–161. [Google Scholar] [CrossRef] [Scilit]
- Recknagle, K.P.; Williford, R.E.; Chick, L.A.; Rector, D.R.; Khaleel, M.A. Three-dimensional thermo-fluid electrochemical modeling of planar SOFC stacks. J. Power Sources 2003, 113, 109–114. [Google Scholar] [CrossRef] [Scilit]
- MSC Software Corporation. Marc 2023.3 User’s Guide; Hexagon AB: Stockholm, Sweden, 2023. [Google Scholar]
- Cabrera, N.; Mott, N.F. Theory of the oxidation of metals. Rep. Prog. Phys. 1949, 12, 163. [Google Scholar] [CrossRef] [Scilit]
- Fergus, J.W. Metallic interconnects for solid oxide fuel cells. Mater. Sci. Eng. A 2005, 397, 271–283. [Google Scholar] [CrossRef] [Scilit]
- Aznam, I.; Mah, J.C.W.; Muchtar, A.; Somalu, M.R.; Ghazali, M.J. Review on oxidation behavior and chromium volatilization of Fe-Cr-based interconnects at high operation temperatures of solid oxide fuel cells. J. Adv. Res. Fluid Mech. Therm. Sci. 2019, 59, 148–155. [Google Scholar]
- Chiu, Y.T.; Lin, C.K.; Wu, J.C. High-temperature tensile and creep properties of a ferritic stainless steel for interconnect in solid oxide fuel cell. J. Power Sources 2011, 196, 2005–2012. [Google Scholar] [CrossRef] [Scilit]
- Brylewski, T.; Molin, S.; Stygar, M.; Bik, M.; Jeleń, P.; Sitarz, M.; Gil, A.; Chen, M.; Hendriksen, P.V. Oxidation kinetics and electrical properties of oxide scales formed under exposure to air and Ar–H2-H2O atmospheres on the Crofer 22H ferritic steel for high-temperature applications such as interconnects in solid oxide cell stacks. Int. J. Hydrogen Energy 2024, 94, 209–222. [Google Scholar] [CrossRef] [Scilit]
- Semenov, A.; Langner, E.; Hachemi, M.E.; Belouettar, S.; Wallmersperger, T. Modelling and simulation of the electro-chemo-thermo-mechanical behaviour of solid oxide fuel cells considering creep. Acta Mech. 2025. [Google Scholar] [CrossRef] [Scilit]

Disclaimer/Publisher’s Note: The statements, opinions and data contained in all publications are solely those of the individual author(s) and contributor(s) and not of MDPI and/or the editor(s). MDPI and/or the editor(s) disclaim responsibility for any injury to people or property resulting from any ideas, methods, instructions or products referred to in the content. |
© 2026 by the authors. Licensee MDPI, Basel, Switzerland. This article is an open access article distributed under the terms and conditions of the Creative Commons Attribution (CC BY) license.