1. Introduction
Accurate tracking of electricity consumption is essential for effective energy management and billing [
1]. In Indonesia, many commercial buildings, including shopping malls, rely on manual methods to record electricity usage using analog electricity meters. Although widely used, this conventional method is vulnerable to human error. Technicians may misread the meter due to inconsistent lighting, fatigue, or visual limitations, resulting in inaccurate records [
2]. With growing demands for operational efficiency and precise data, automated solutions driven by computer vision technology are becoming increasingly necessary [
3].
Recent developments in AI have made this transition possible. Algorithms, such as You Only Look Once (YOLO), have demonstrated strong capabilities in real-time object detection with high accuracy [
4]. This opens an opportunity to apply AI to automate reading electricity meters from images, minimizing the need for human interpretation. Advances in deep learning have significantly improved the performance of computer vision systems, enabling robust object detection and visual recognition in complex environments [
5].
Several previous studies have explored machine learning and computer vision for this purpose. Laroca et al. proposed a convolutional neural network–based approach for digit detection and recognition on utility meters using deep learning techniques [
6]. Similarly, Zhang et al. developed a computer vision framework for automatic reading of analog meters, demonstrating that deep learning models can achieve high accuracy under various environmental conditions [
7]. Other studies have examined how electricity consumption patterns and appliance usage can be detected using smart meter time-series data [
8].
Despite these advancements, several limitations remain in existing approaches. Many earlier systems rely on traditional image-processing techniques or earlier deep learning models that may not fully exploit recent improvements in real-time object detection algorithms. Recent developments, such as YOLOv9, introduce programmable gradient information that improves detection accuracy and efficiency [
9]. However, system performance under real-world conditions, including lighting variations and device diversity, has not been extensively evaluated [
10]. Previous studies on image-based meter reading under unconstrained conditions have also highlighted challenges related to lighting variations, camera angles, and environmental noise [
11].
Therefore, to address these challenges, we developed a system that detects and reads data from analog electricity meters using YOLOv9 combined with EasyOCR. EasyOCR is an open-source optical character recognition framework that combines convolutional neural networks and recurrent neural networks for text recognition [
12]. The system is evaluated in a real commercial building, Plaza XYZ, to examine its accuracy and feasibility in daily operations. The developed system presents a YOLOv9 digit detection model trained on field data with high accuracy. Second, it demonstrated an efficient, practical end-to-end approach by integrating YOLOv9 with EasyOCR to enable automatic recording of electricity usage. Third, the system benefits commercial building management in Indonesia by reducing human error, improving efficiency, and supporting reliable energy monitoring practices.
The results of this study support the application of AI for energy informatics and serve as a reference for future research and system development.
2. Materials and Methods
2.1. Dataset
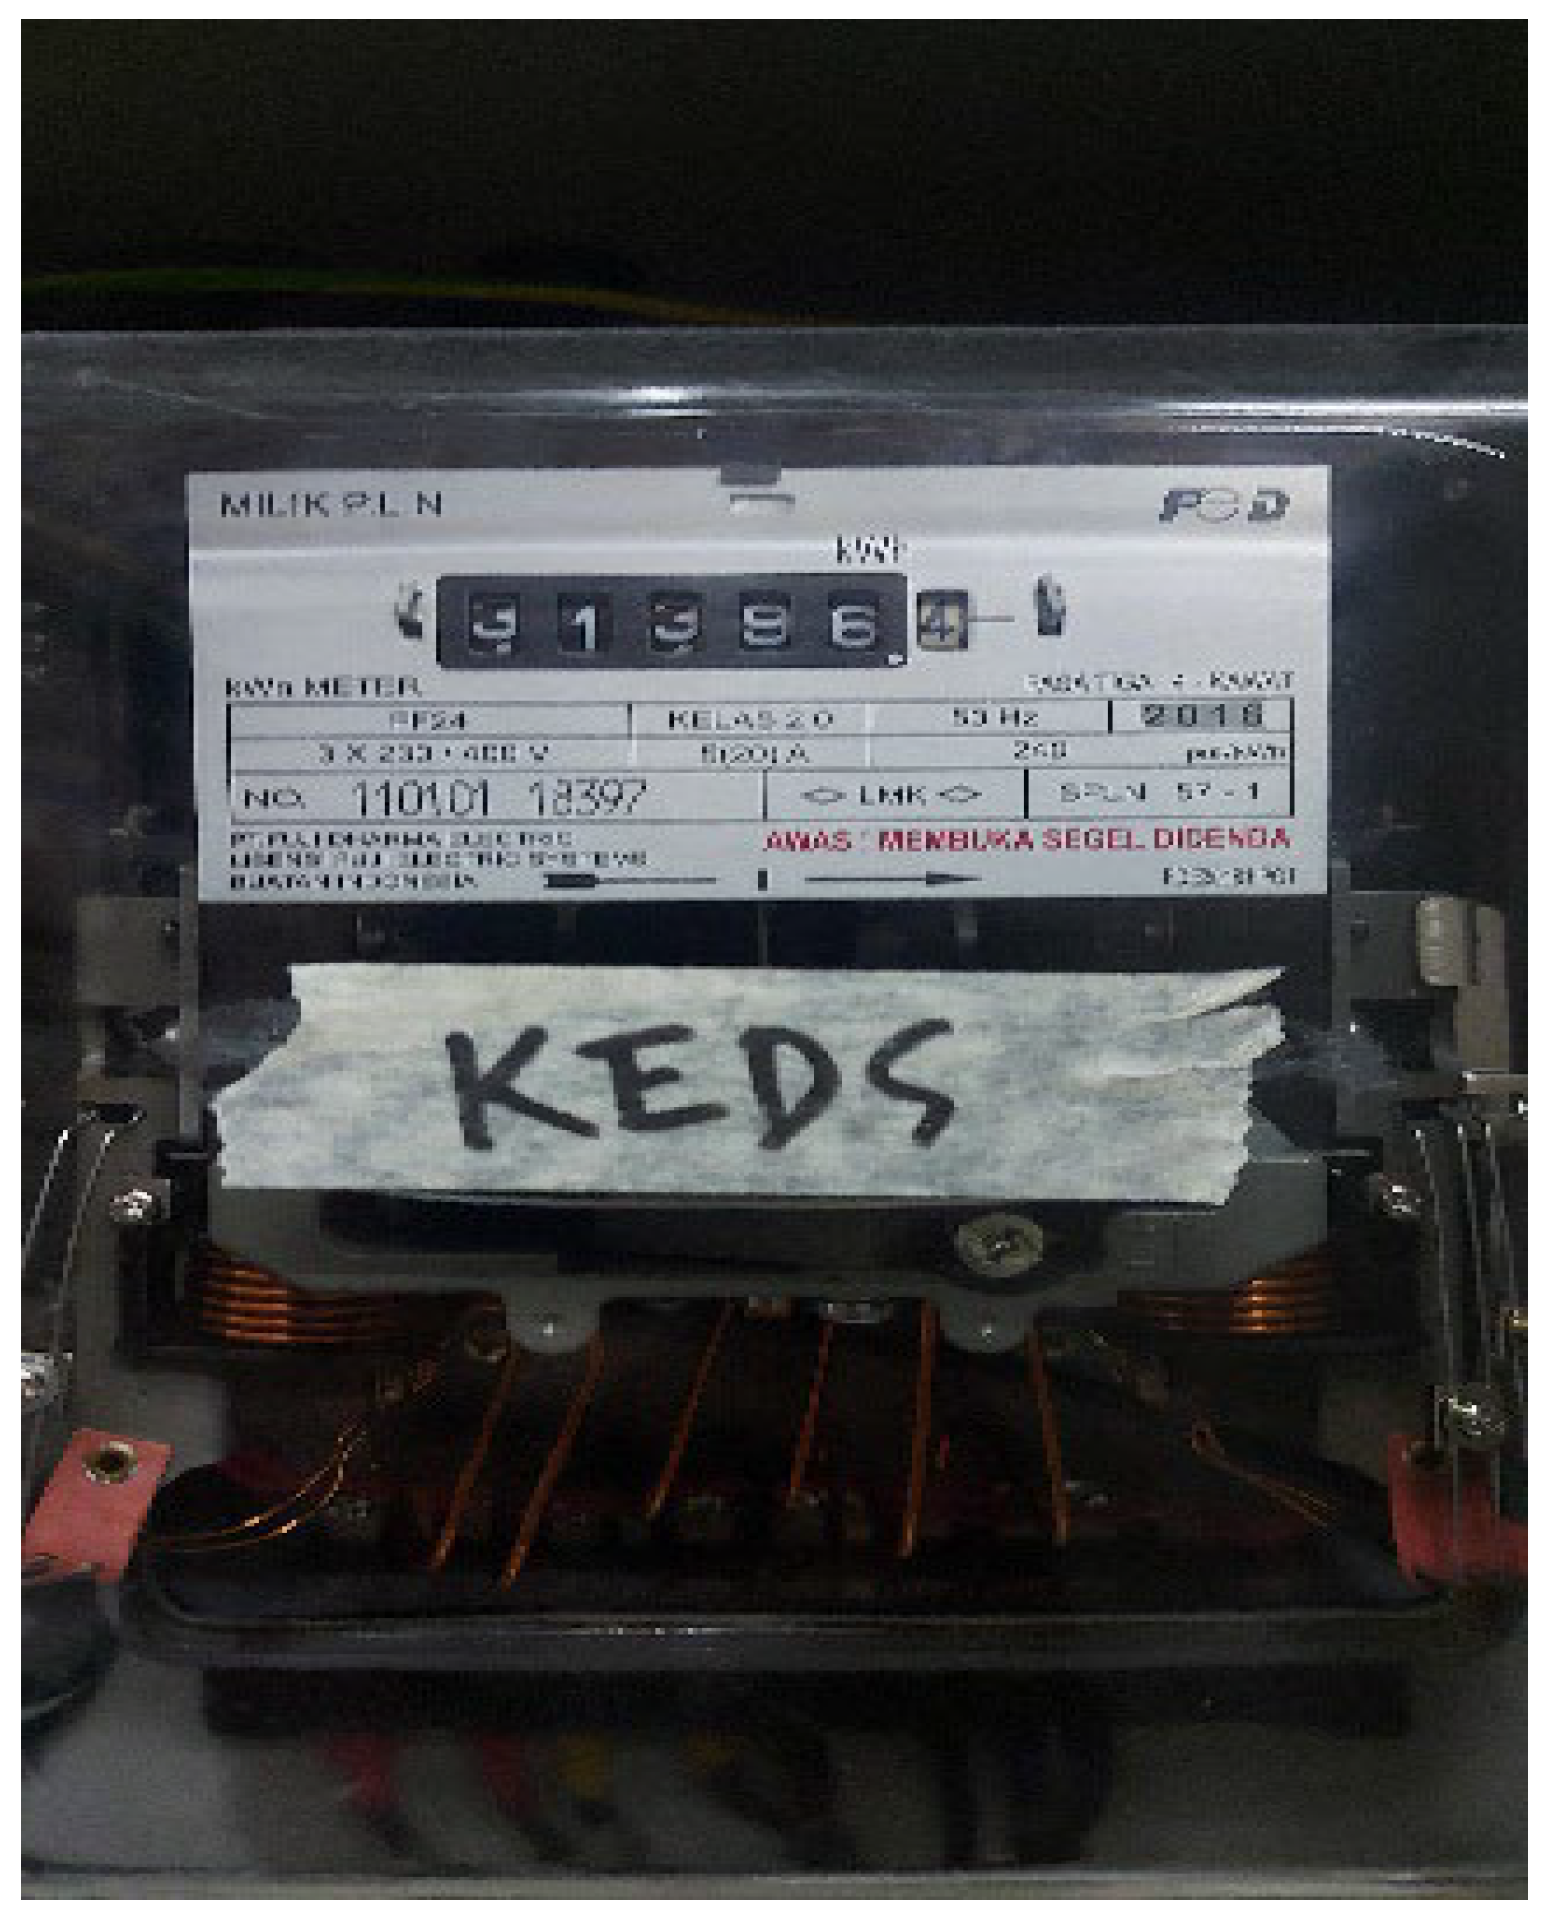
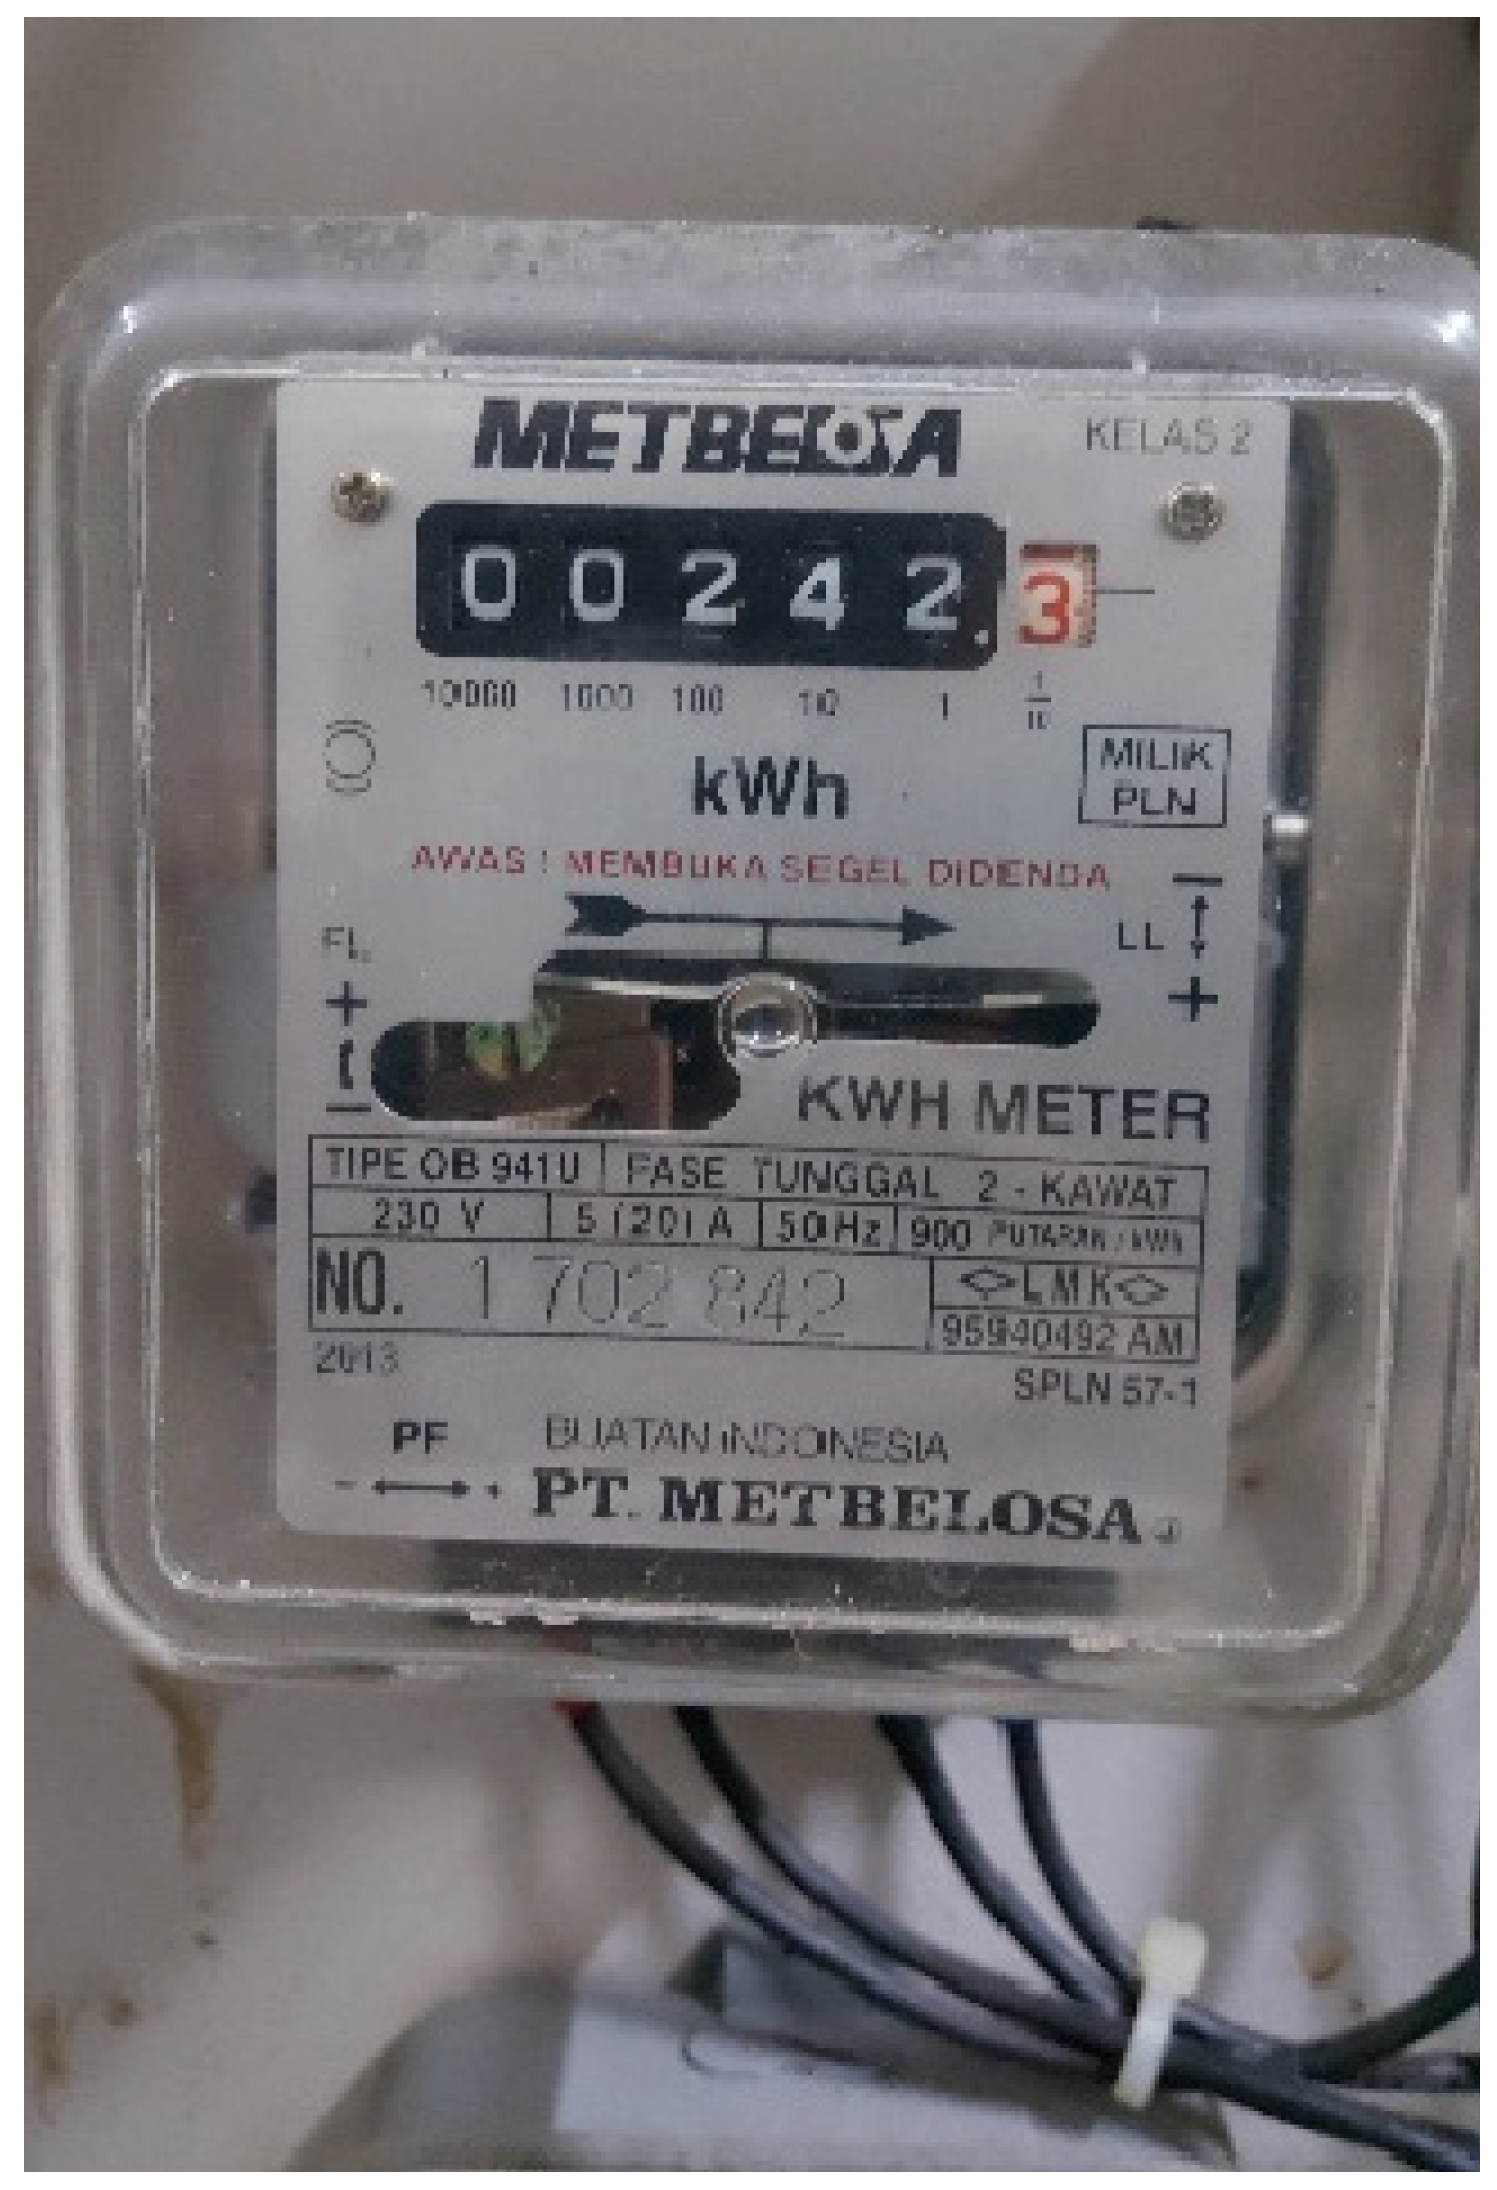
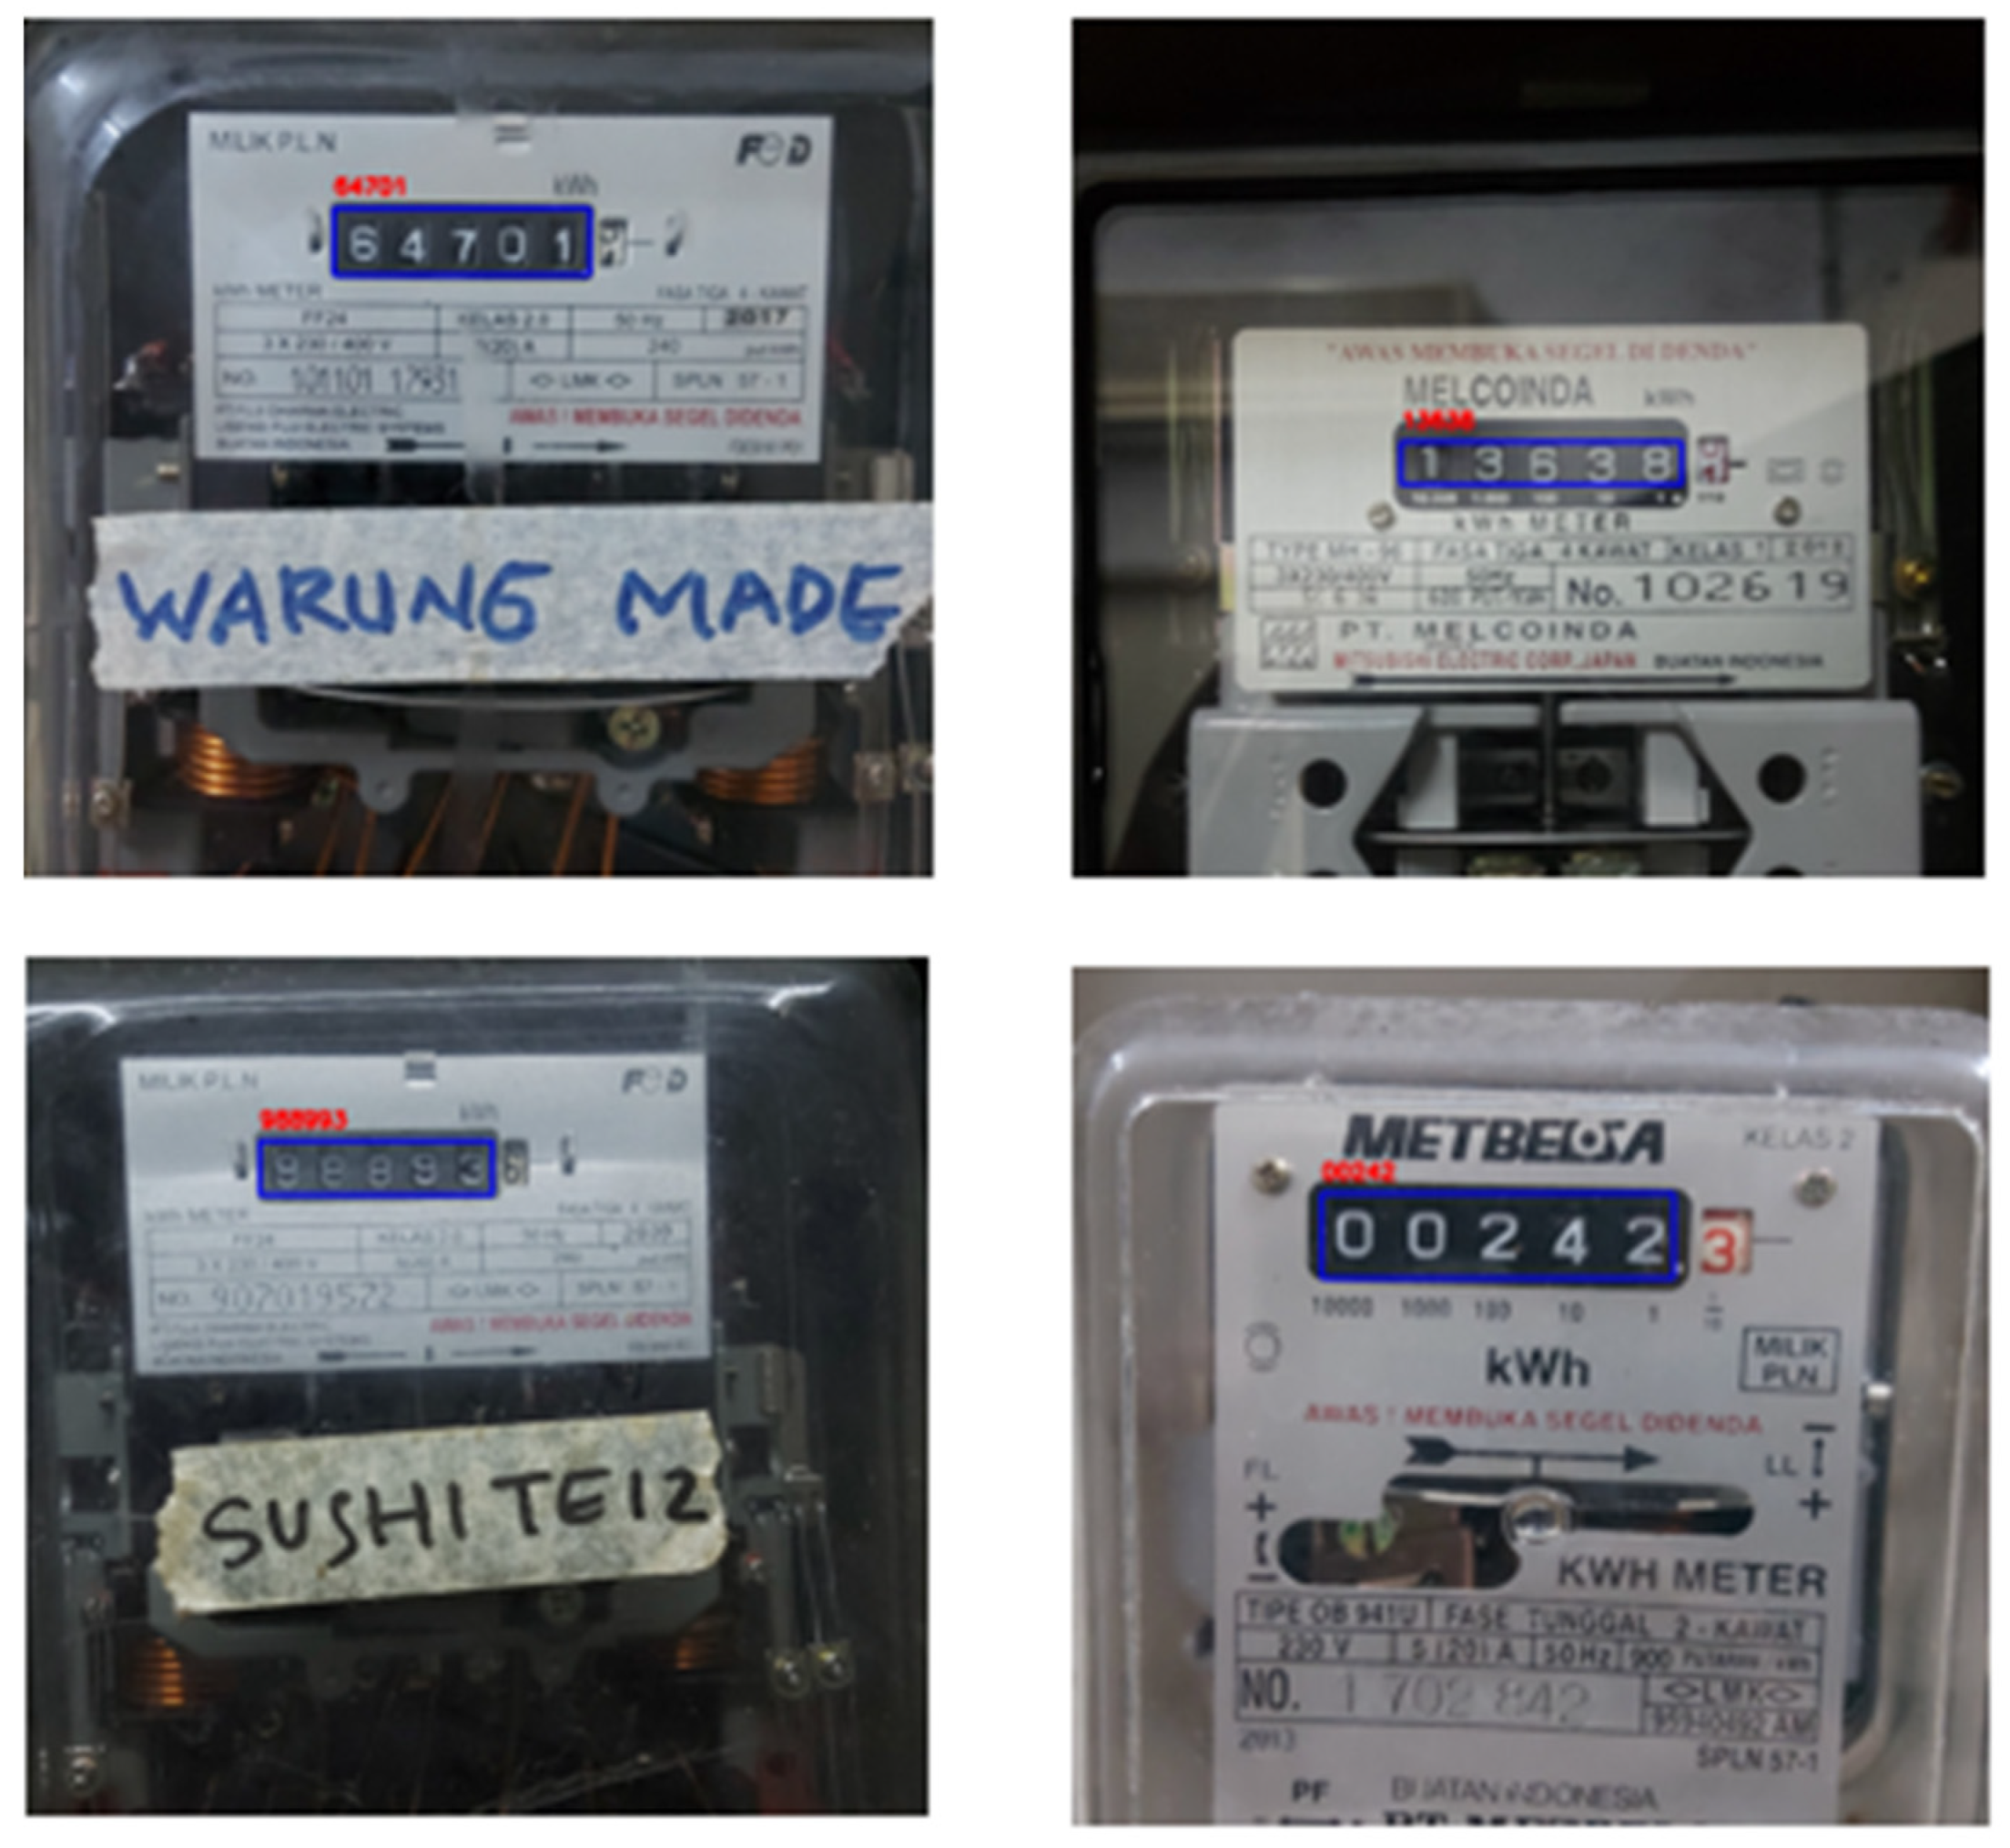
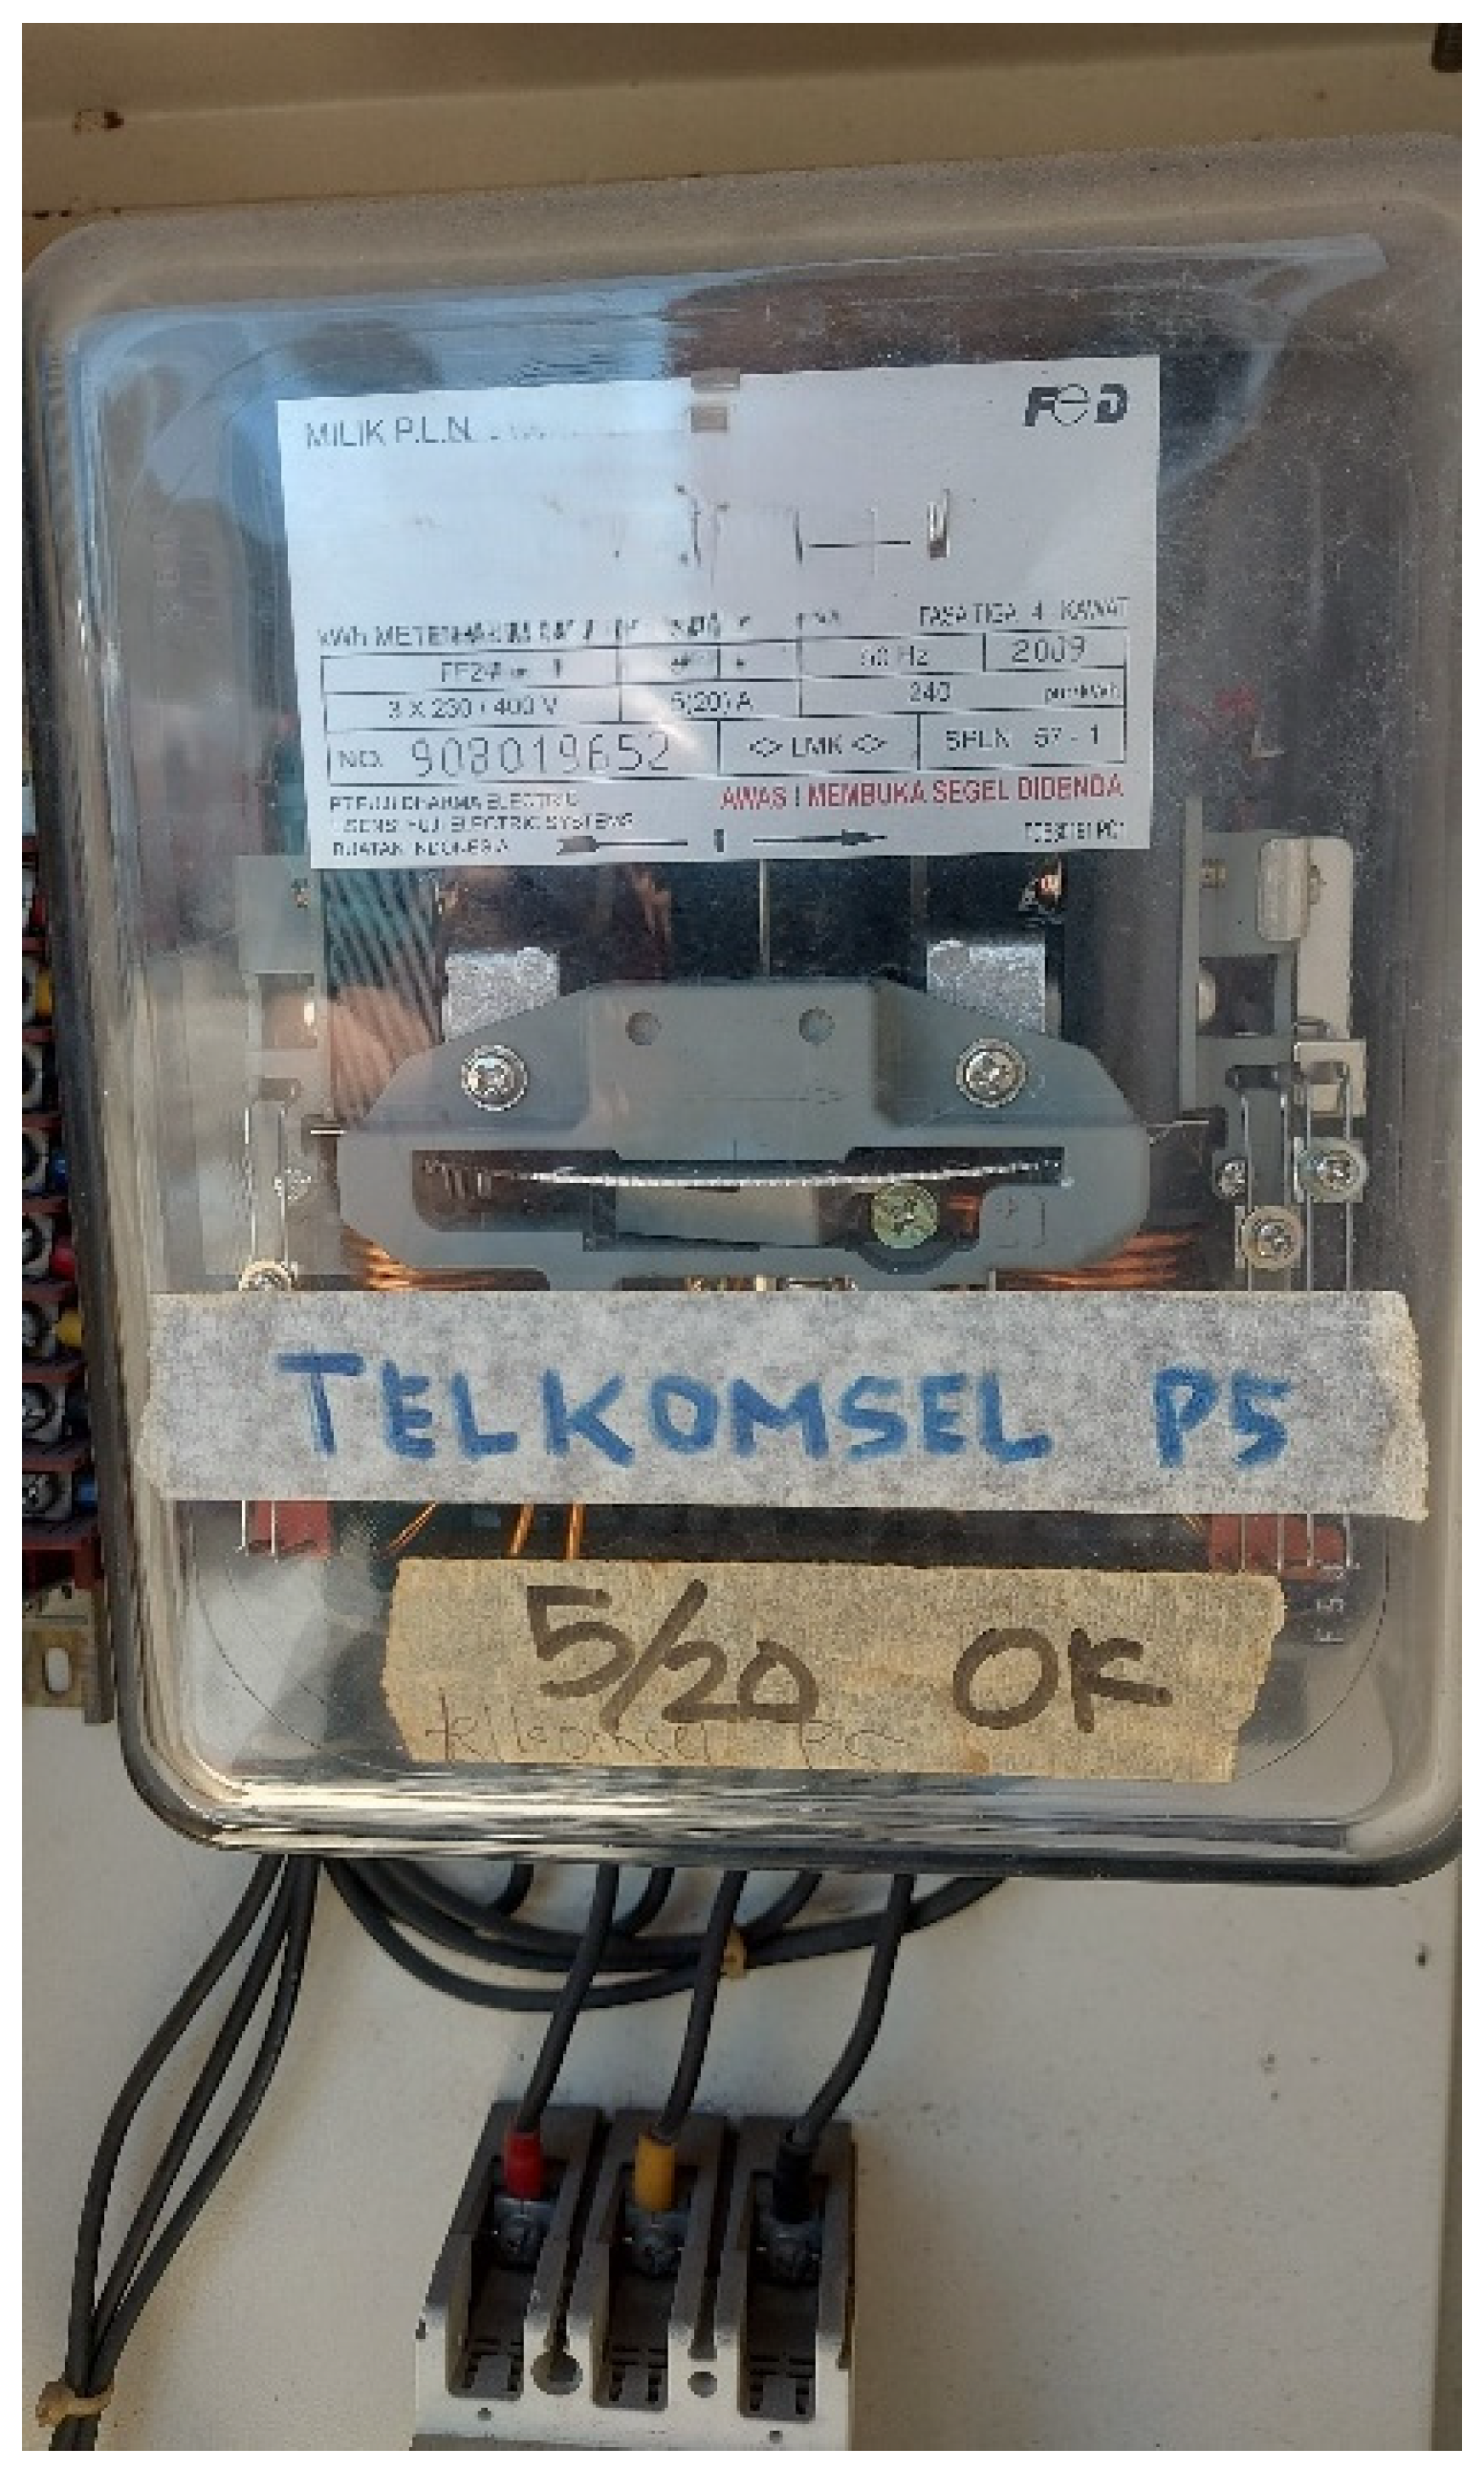
The dataset used in this study consisted of 80 images of analogue electricity meters collected from tenant units in Plaza XYZ. These images were obtained from meters manufactured by Fuji Dharma and Metbelosa (
Figure 1 and
Figure 2). All images were captured using a smartphone camera (Samsung Electronics Co., Ltd., Suwon, Republic of Korea) with a resolution of 2604 by 4624 pixels, under varying lighting conditions and camera angles to reflect real-world scenarios. Image augmentation techniques were applied to enhance dataset diversity and size, resulting in a total of 137 images. The augmented dataset was then divided into two subsets, with 88 percent allocated for training and 12 percent for testing.
2.2. Data Preprocessing
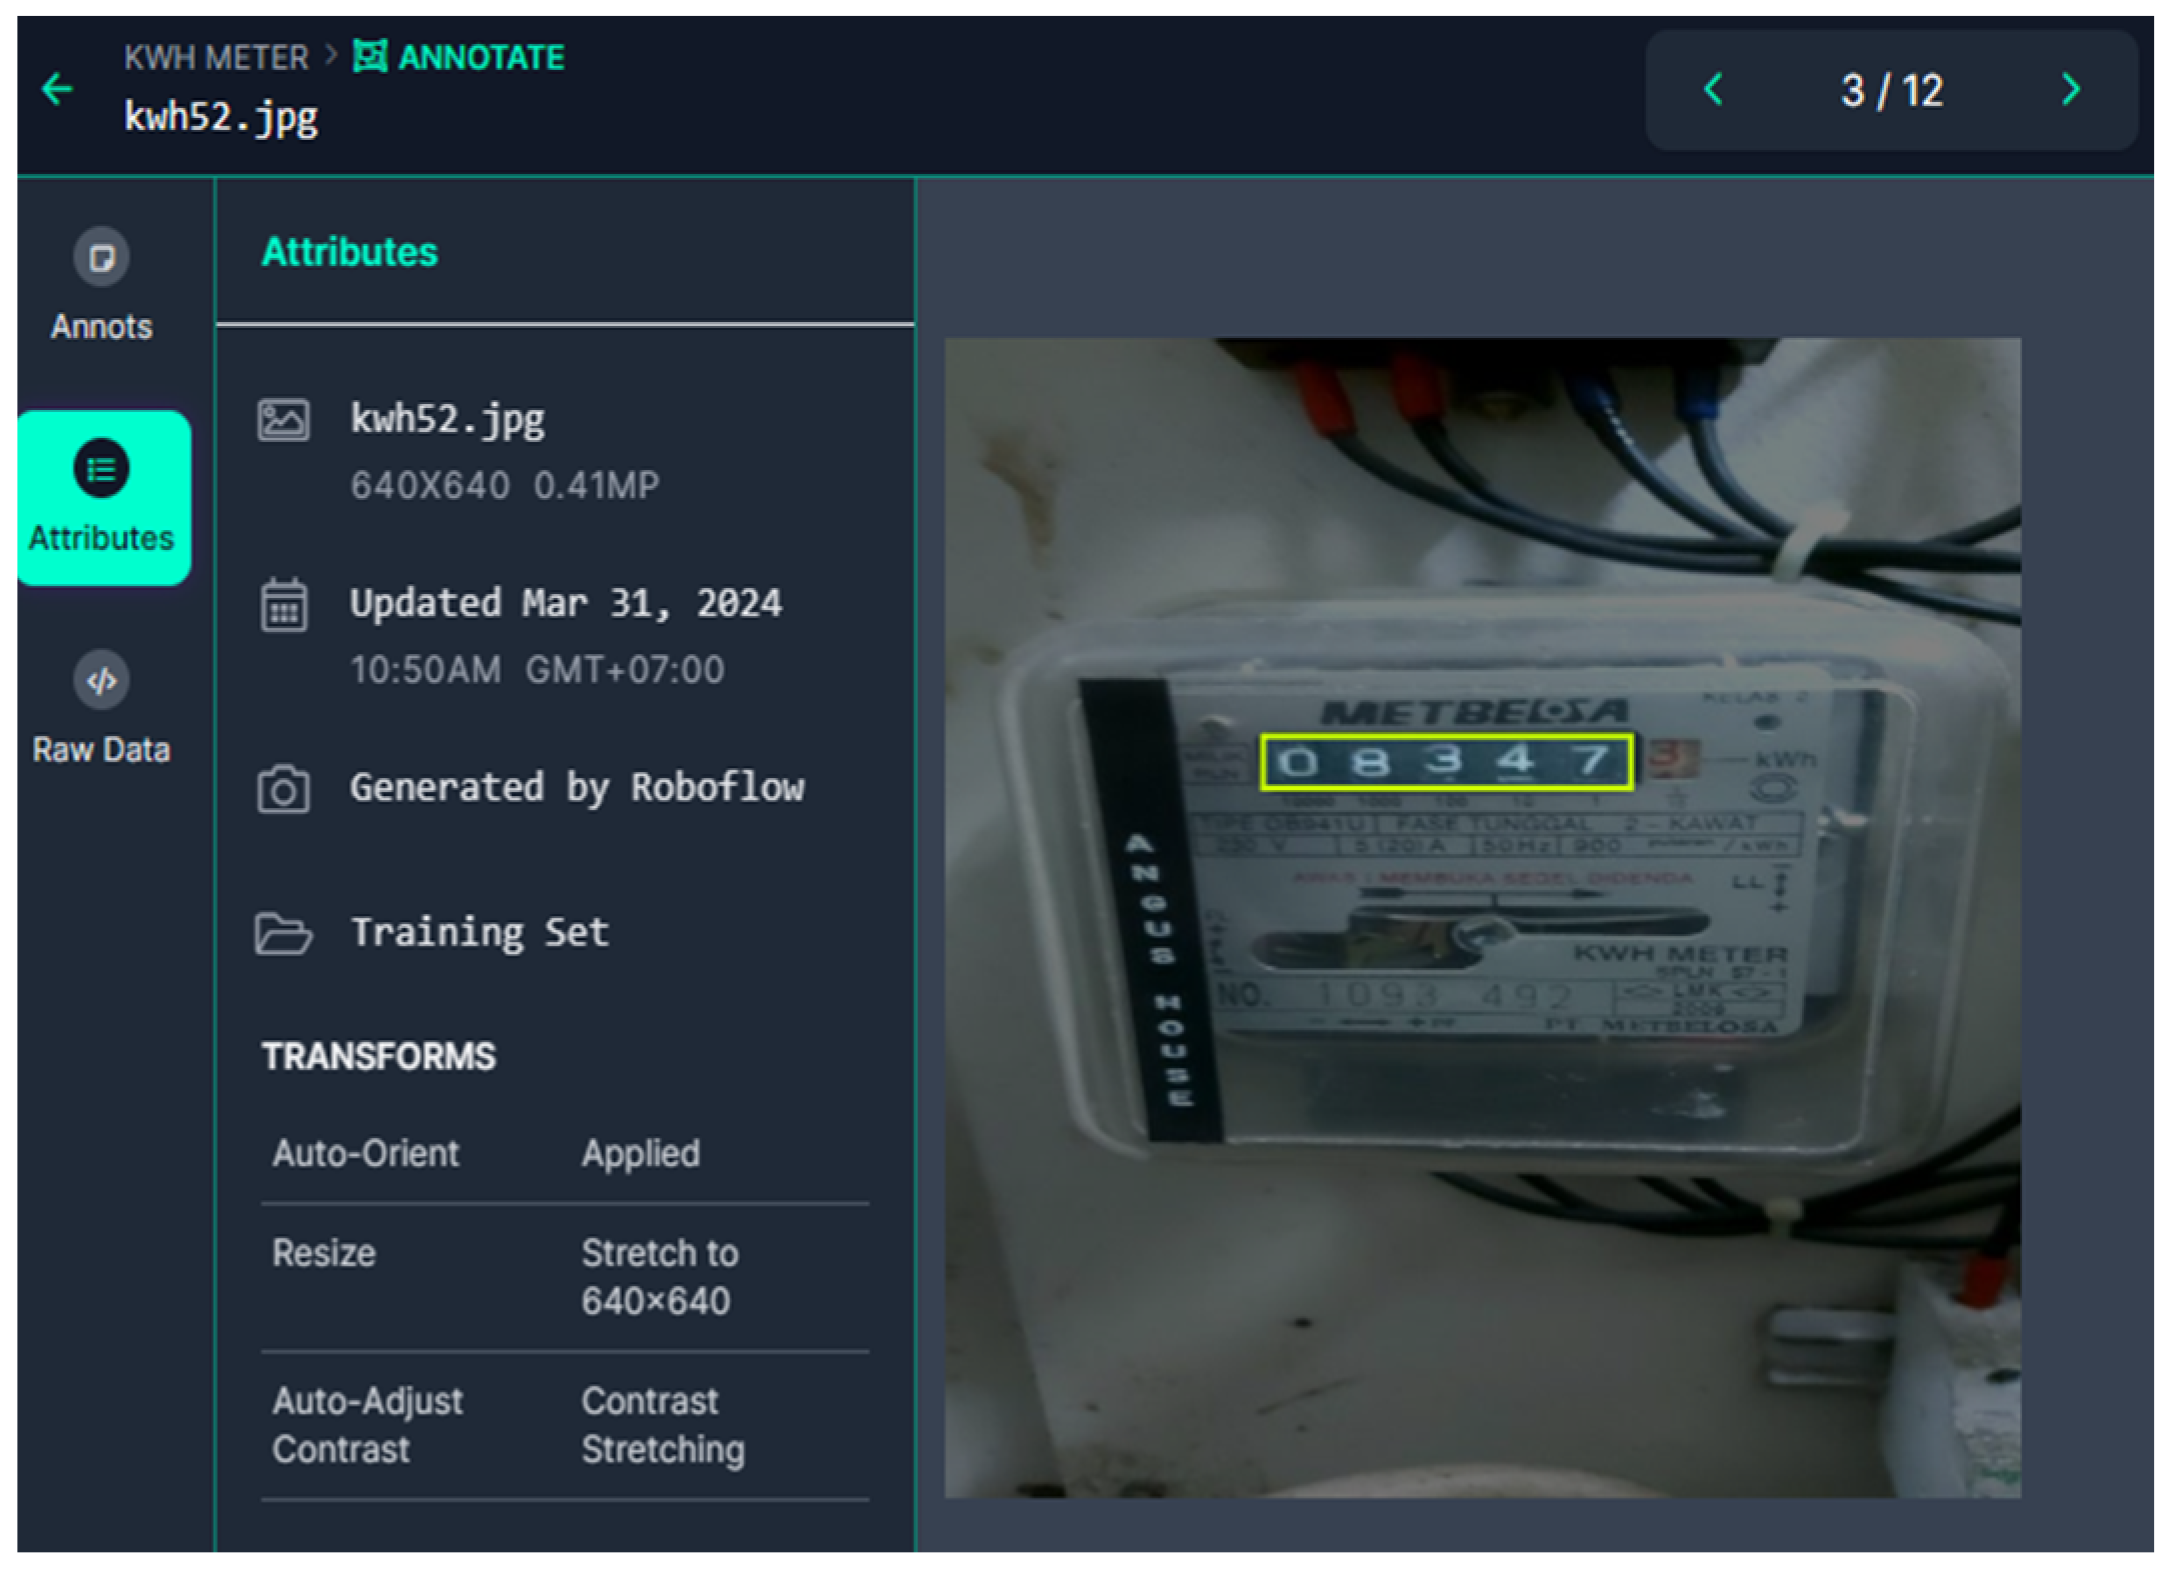
Data preprocessing involved reorientation, resizing to 640 by 640 pixels, autocontrast enhancement, and image augmentation via flipping, rotation, shearing, and exposure adjustment. All preprocessing was conducted using the Roboflow platform (Roboflow Inc., Des Moines, IA, USA). The electricity meter digits were annotated with the label “Digit-kWh” in accordance with the YOLO annotation format (
Figure 3).
2.3. Model Architecture
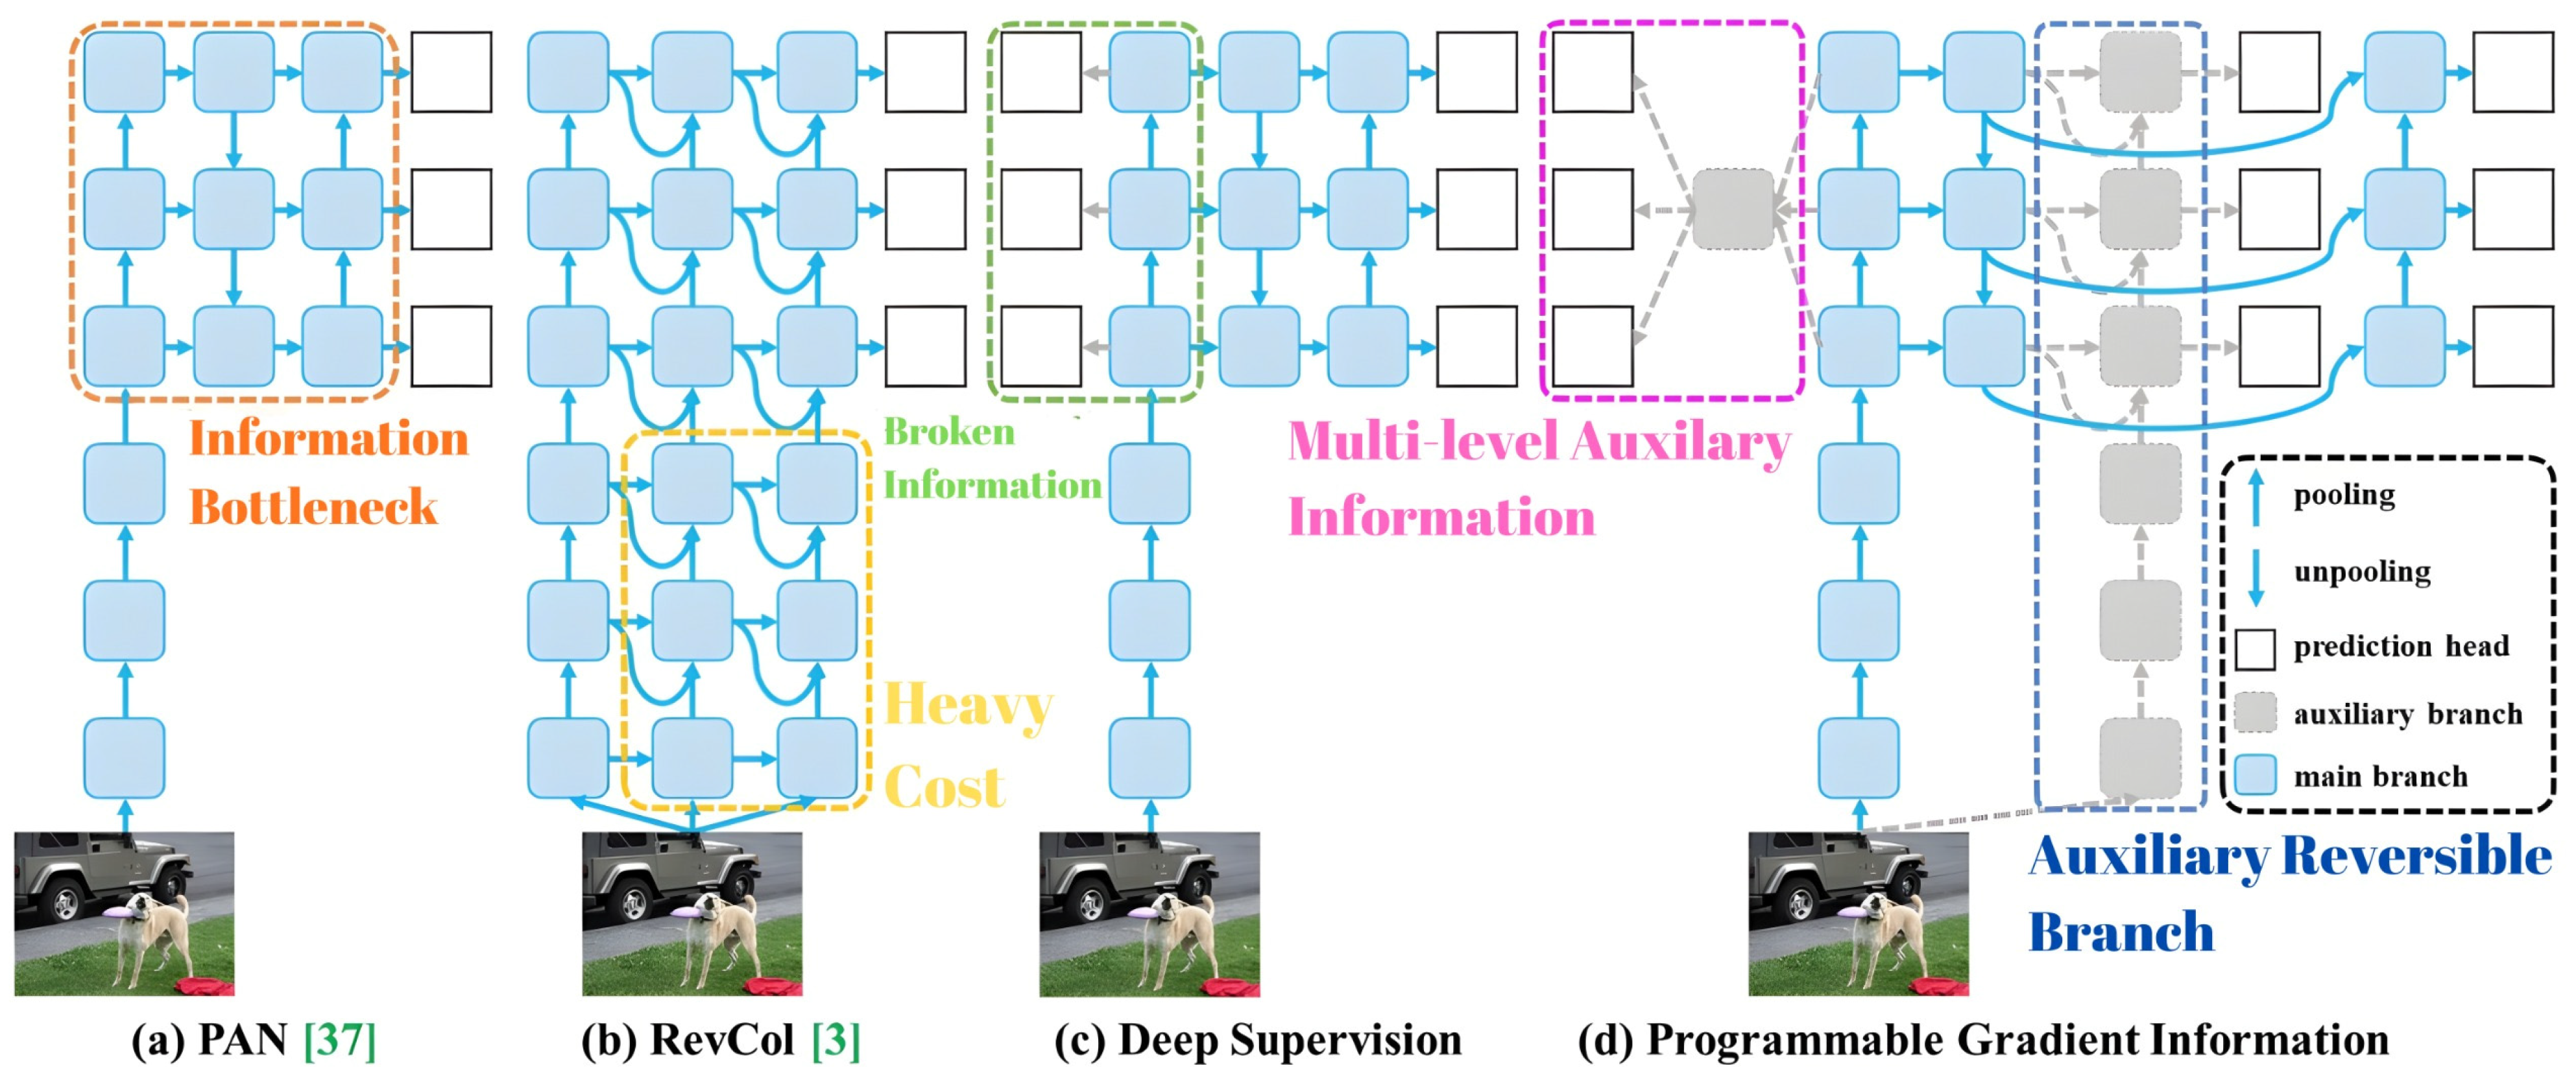
The model used in this study was developed based on YOLOv9, which incorporates essential components to enhance multi-scale object detection (
Figure 4). These include the path aggregation network (PAN) for improved feature fusion, reversible columns (RevCol) for computational efficiency and accuracy, and programmable gradient information (PGI) to refine gradient flow during training. The bounding boxes generated by YOLOv9 are processed by EasyOCR, which integrates character-region-aware text detection and a convolutional recurrent neural network (CRNN) for character recognition.
2.4. Training Configuration
Model training was conducted on Google Colaboratory (Google LLC, Mountain View, CA, USA) utilizing a Tesla T4 graphics processing unit (GPU) (NVIDIA Corporation, Santa Clara, CA, USA). The model was trained for 100 epochs with a learning rate of 0.001 and a batch size of 16, using the stochastic gradient descent (SGD) optimizer. The loss function combined localization loss and classification loss to optimize object detection performance.
2.5. Evaluation Metrics
The model’s performance was evaluated using a confusion matrix, with accuracy, precision, and recall as the primary metrics. These metrics were used to assess the balance between correct predictions and errors in digit detection, providing insight into the system’s reliability [
11].
2.6. Experiment
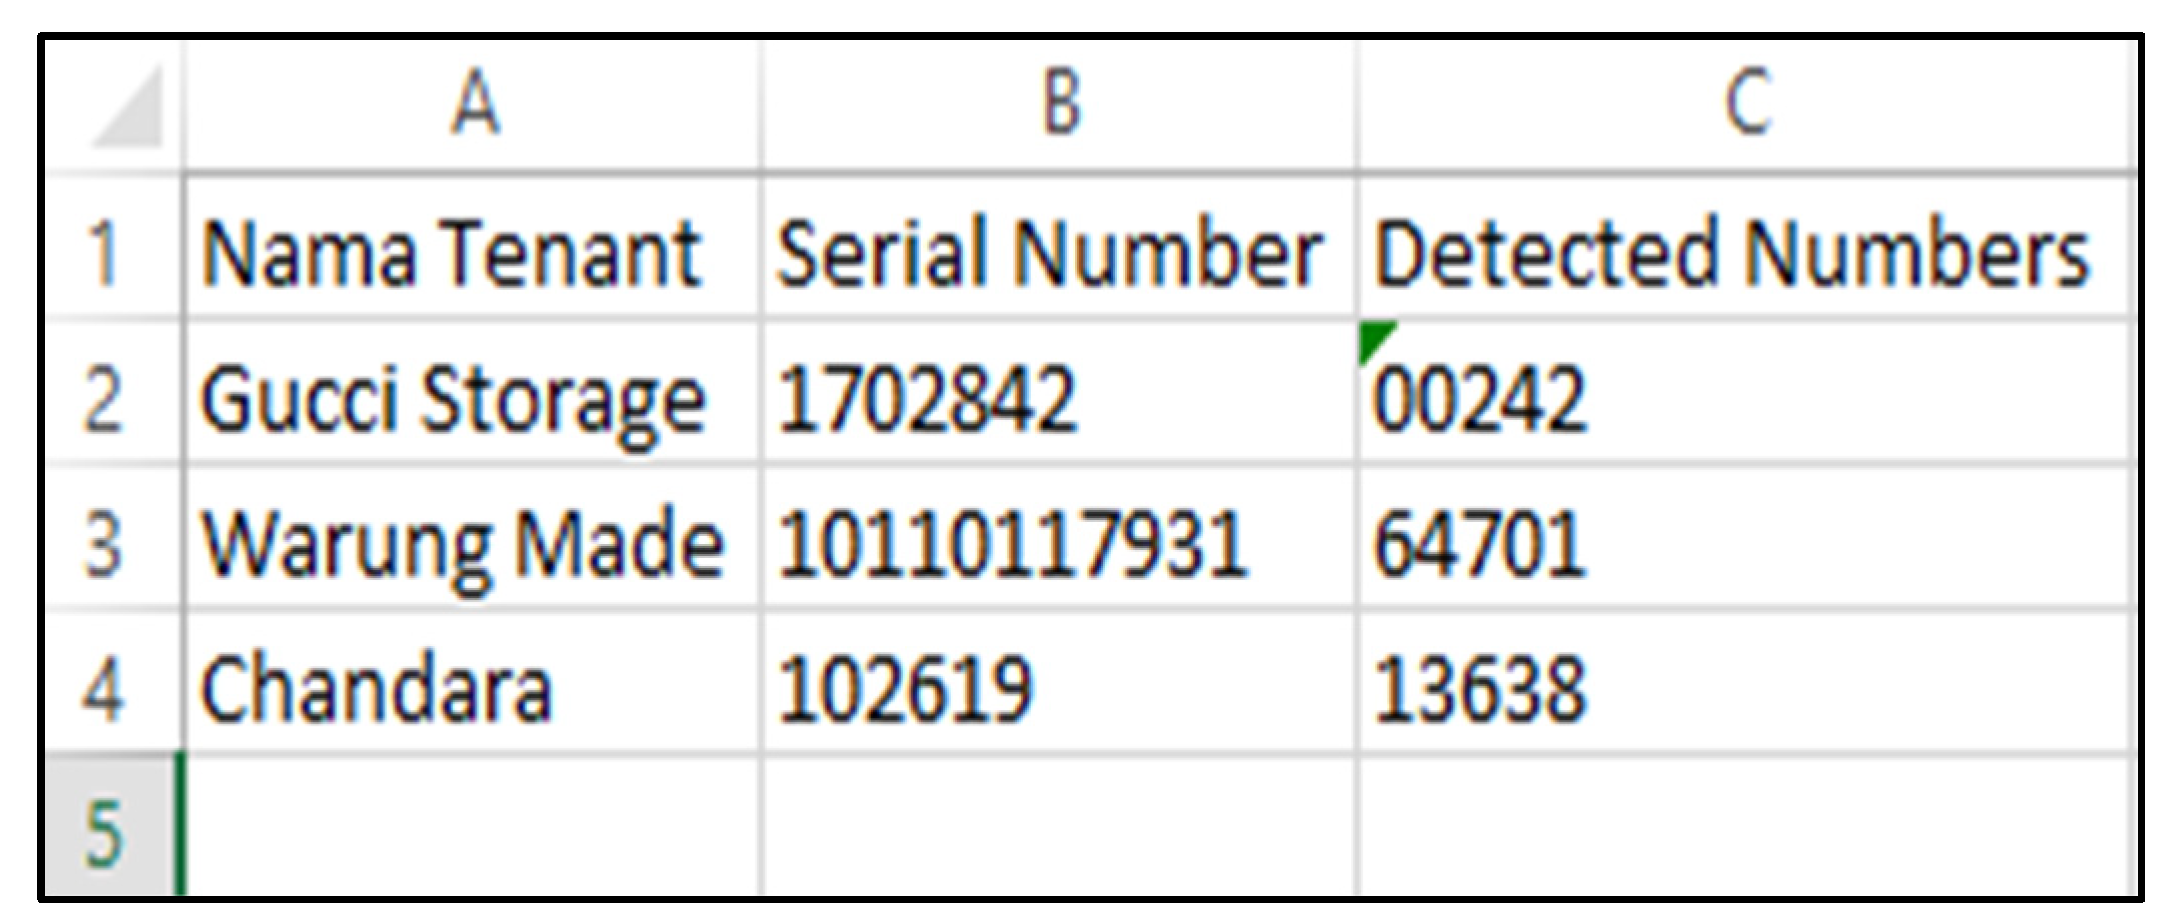
Experiments were performed on a Windows 11 system with an Intel i5 processor, 8 gigabytes (GBs) of random-access memory, and a 512 GB solid-state drive. Python 3.10 (Python Software Foundation, Wilmington, DE, USA) was used together with the OpenCV library (OpenCV Foundation, Mountain View, CA, USA), PyTorch 2.10.0 (Meta AI, Menlo Park, CA, USA), and EasyOCR (Jaided AI, Bangkok, Thailand). The user interface was developed using Visual Studio Code 1.64.2 (Microsoft Corporation, Redmond, WA, USA), enabling image upload, digit detection, and data export to CSV or Excel format for further analysis.
3. Results
We implemented a digit-detection application for analogue electricity meters by combining the YOLOv9 object detector with EasyOCR for text recognition. The application allows users to upload meter images, automatically detect and extract the digit regions in real time, and export the results in CSV or Excel for easier storage and analysis. The system accurately detected digits and yielded results consistent with the original image. The results were visualized at each stage.
Figure 5 shows the bounding box output identifying the digit regions in the electricity meter image.
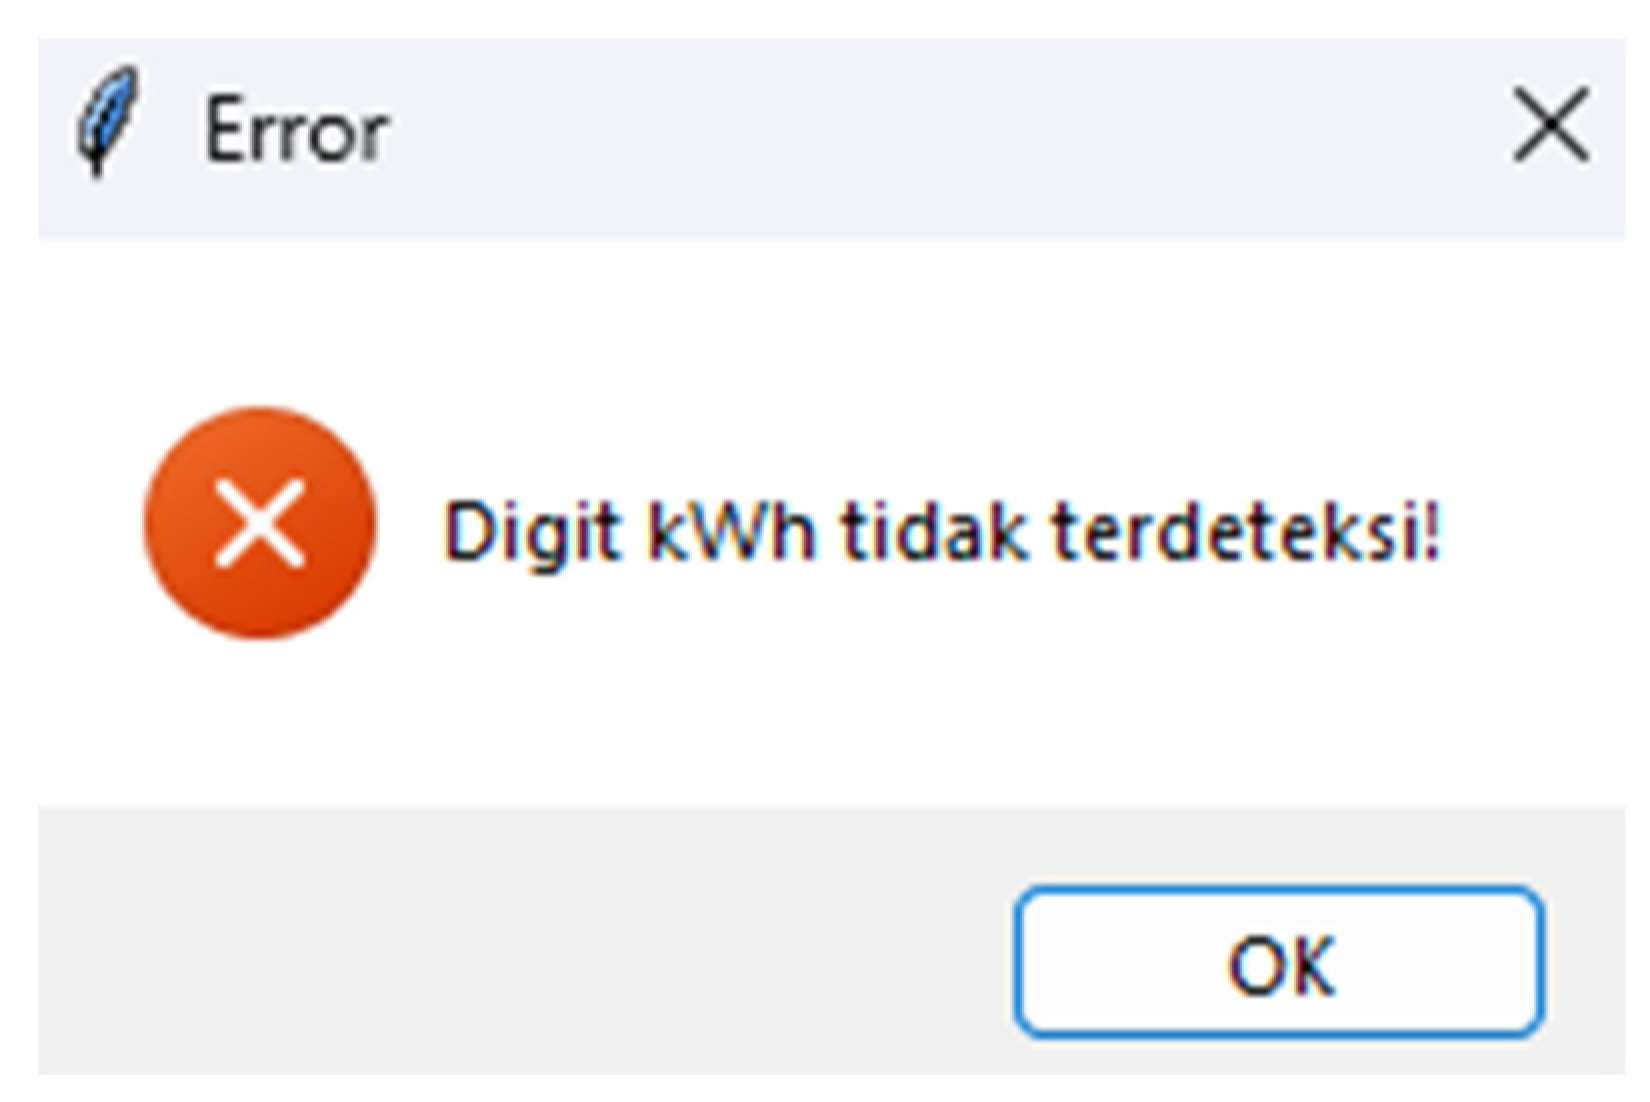
Figure 6 shows a modified image for the negative test scenario in which the digits were intentionally removed to evaluate the system’s robustness. When the system fails to detect any digits,
Figure 7 displays a warning pop-up with the message “Digit kWh not detected,” demonstrating the system’s ability to provide informative user feedback.
Based on the YOLOv9 algorithm integrated with EasyOCR, the digit detection model for analogue electricity meters was tested using 80 images collected from tenant meters at Plaza XYZ (
Figure 8). After preprocessing and data augmentation, the dataset was expanded to 137 images, with 88% used for training and 12% for testing. The training was conducted over 100 epochs using a Google Colaboratory environment equipped with a Tesla T4 GPU. The evaluation results show a detection accuracy of 89.8%, indicating that the model can effectively recognize and read electricity meter digits despite variations in lighting conditions, image distortion, and camera angles.
System performance was evaluated using a confusion matrix to calculate accuracy, precision, and recall, as
Table 1. The results demonstrate high levels of both precision and recall, indicating the model’s strong ability to make accurate predictions while capturing most of the actual digits. Most prediction errors occurred in cases with low contrast or tilted images due to suboptimal camera positioning.
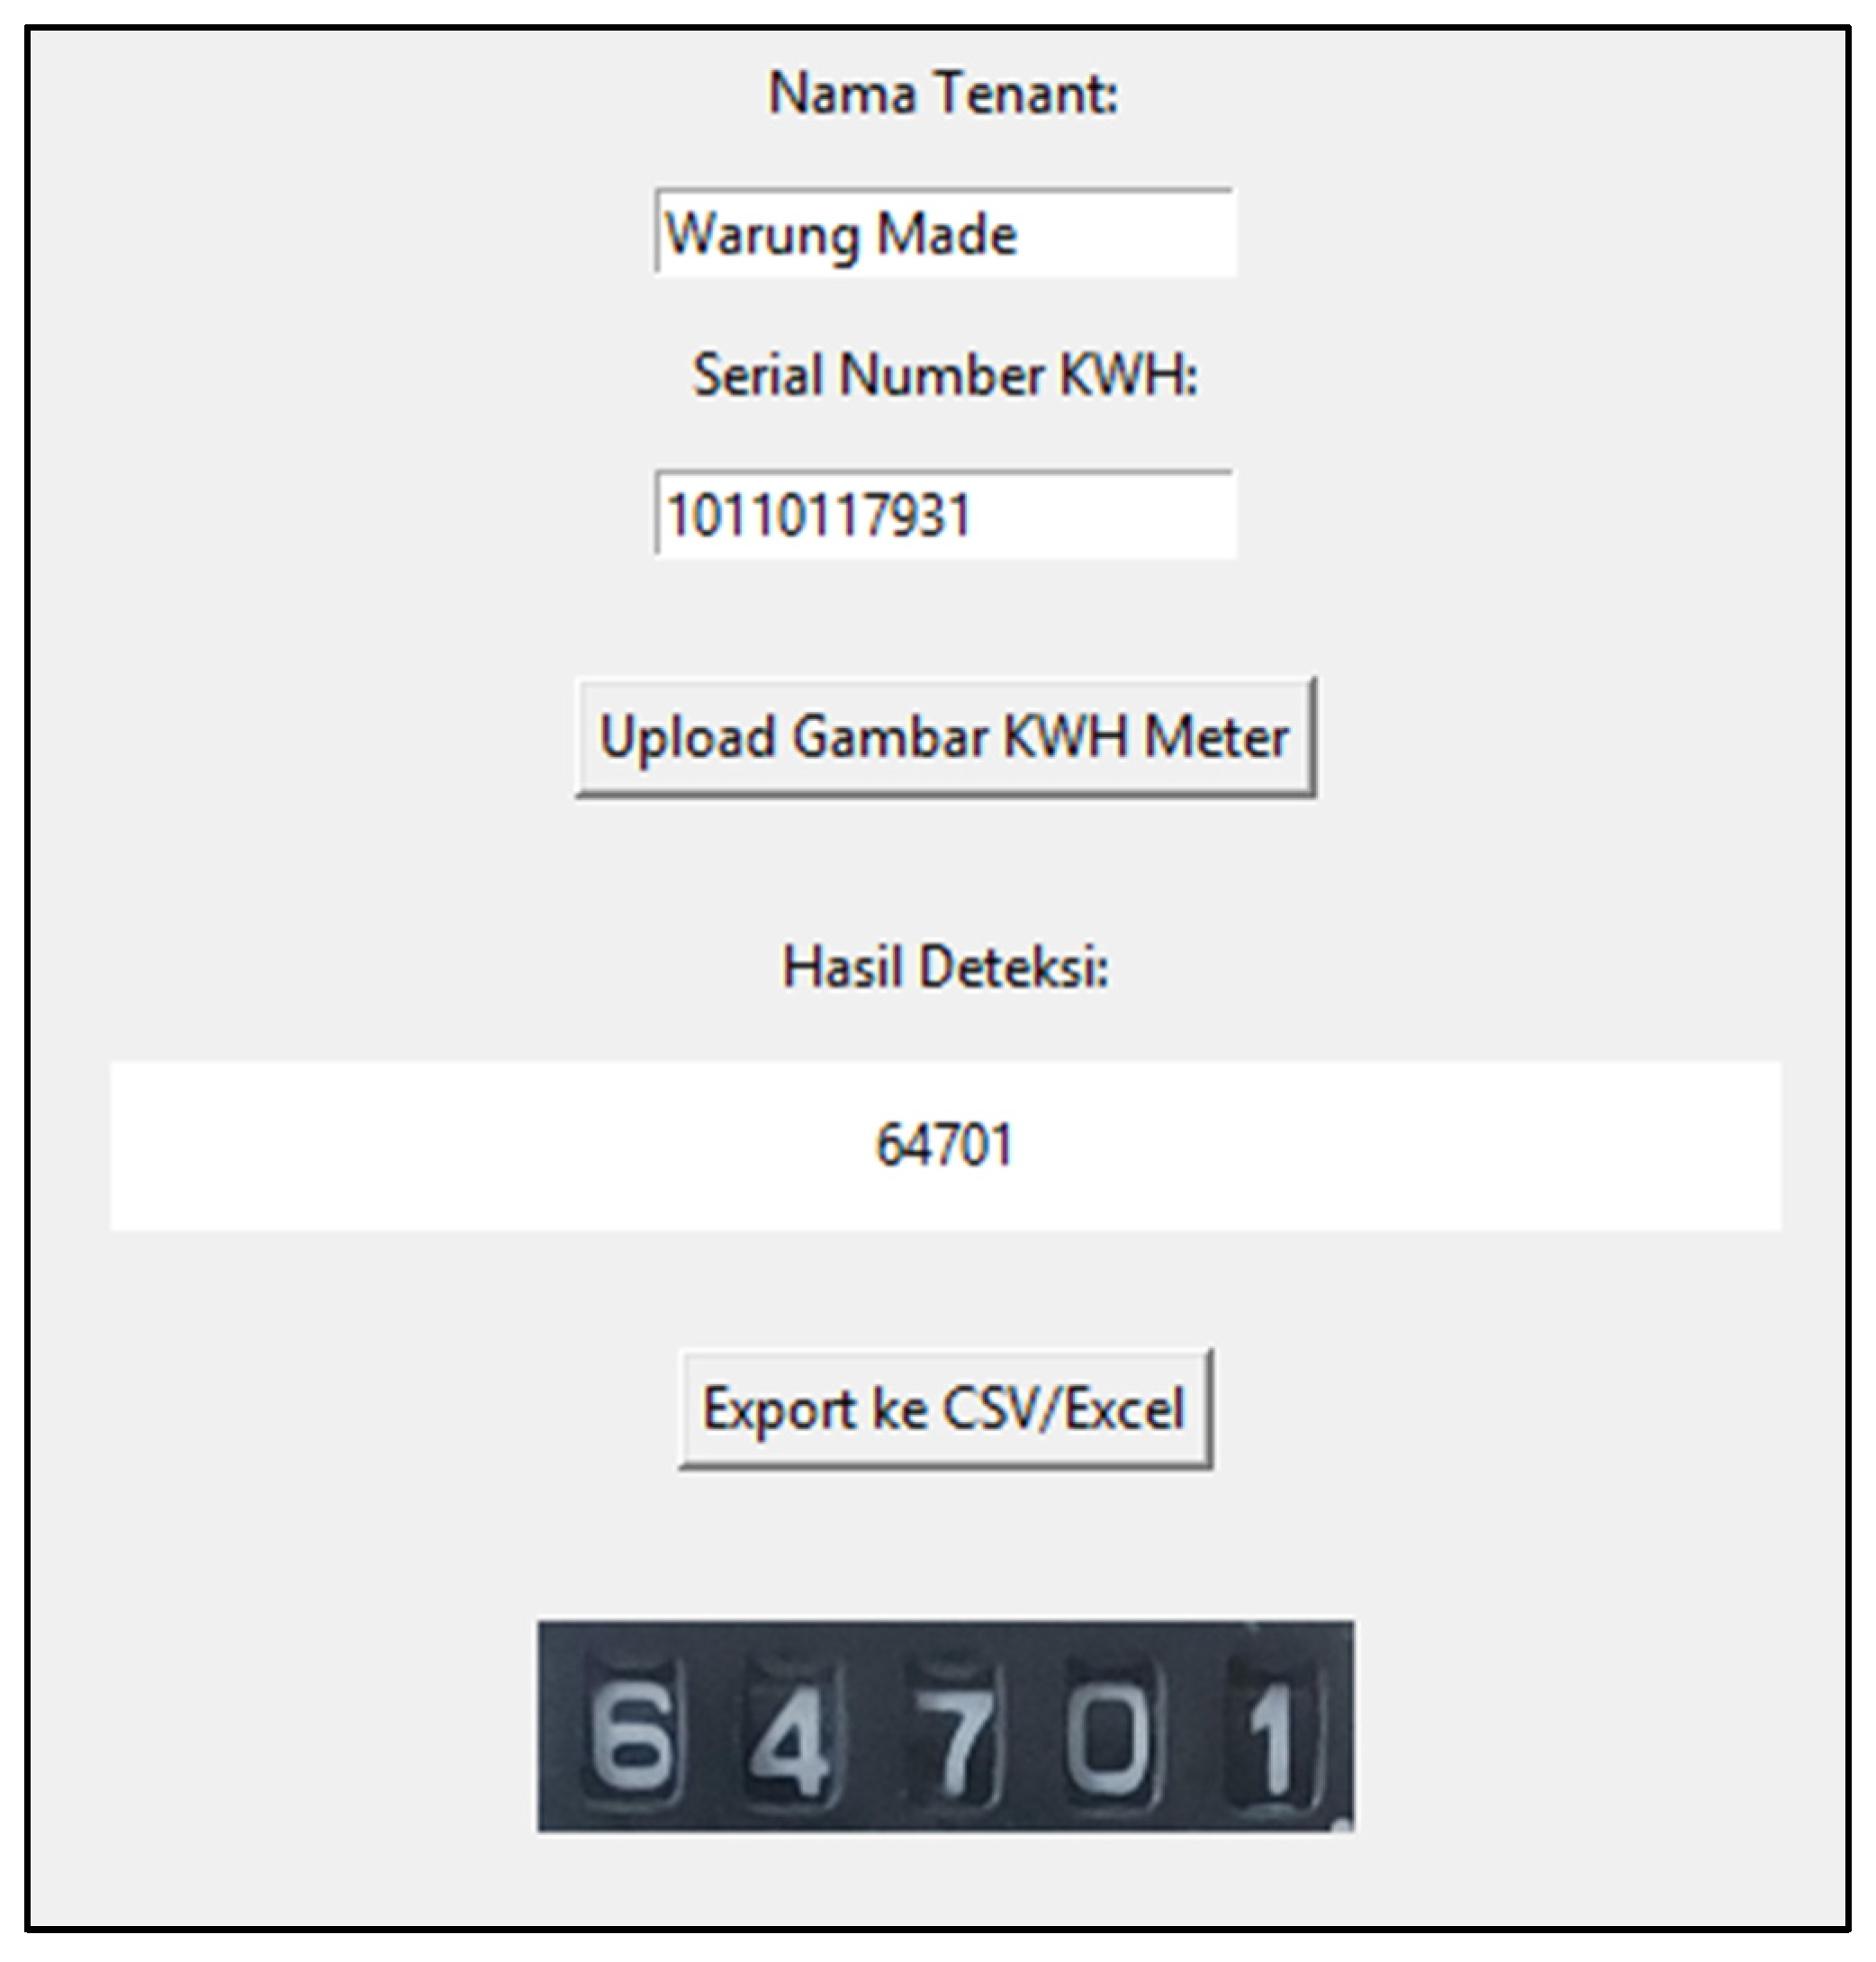
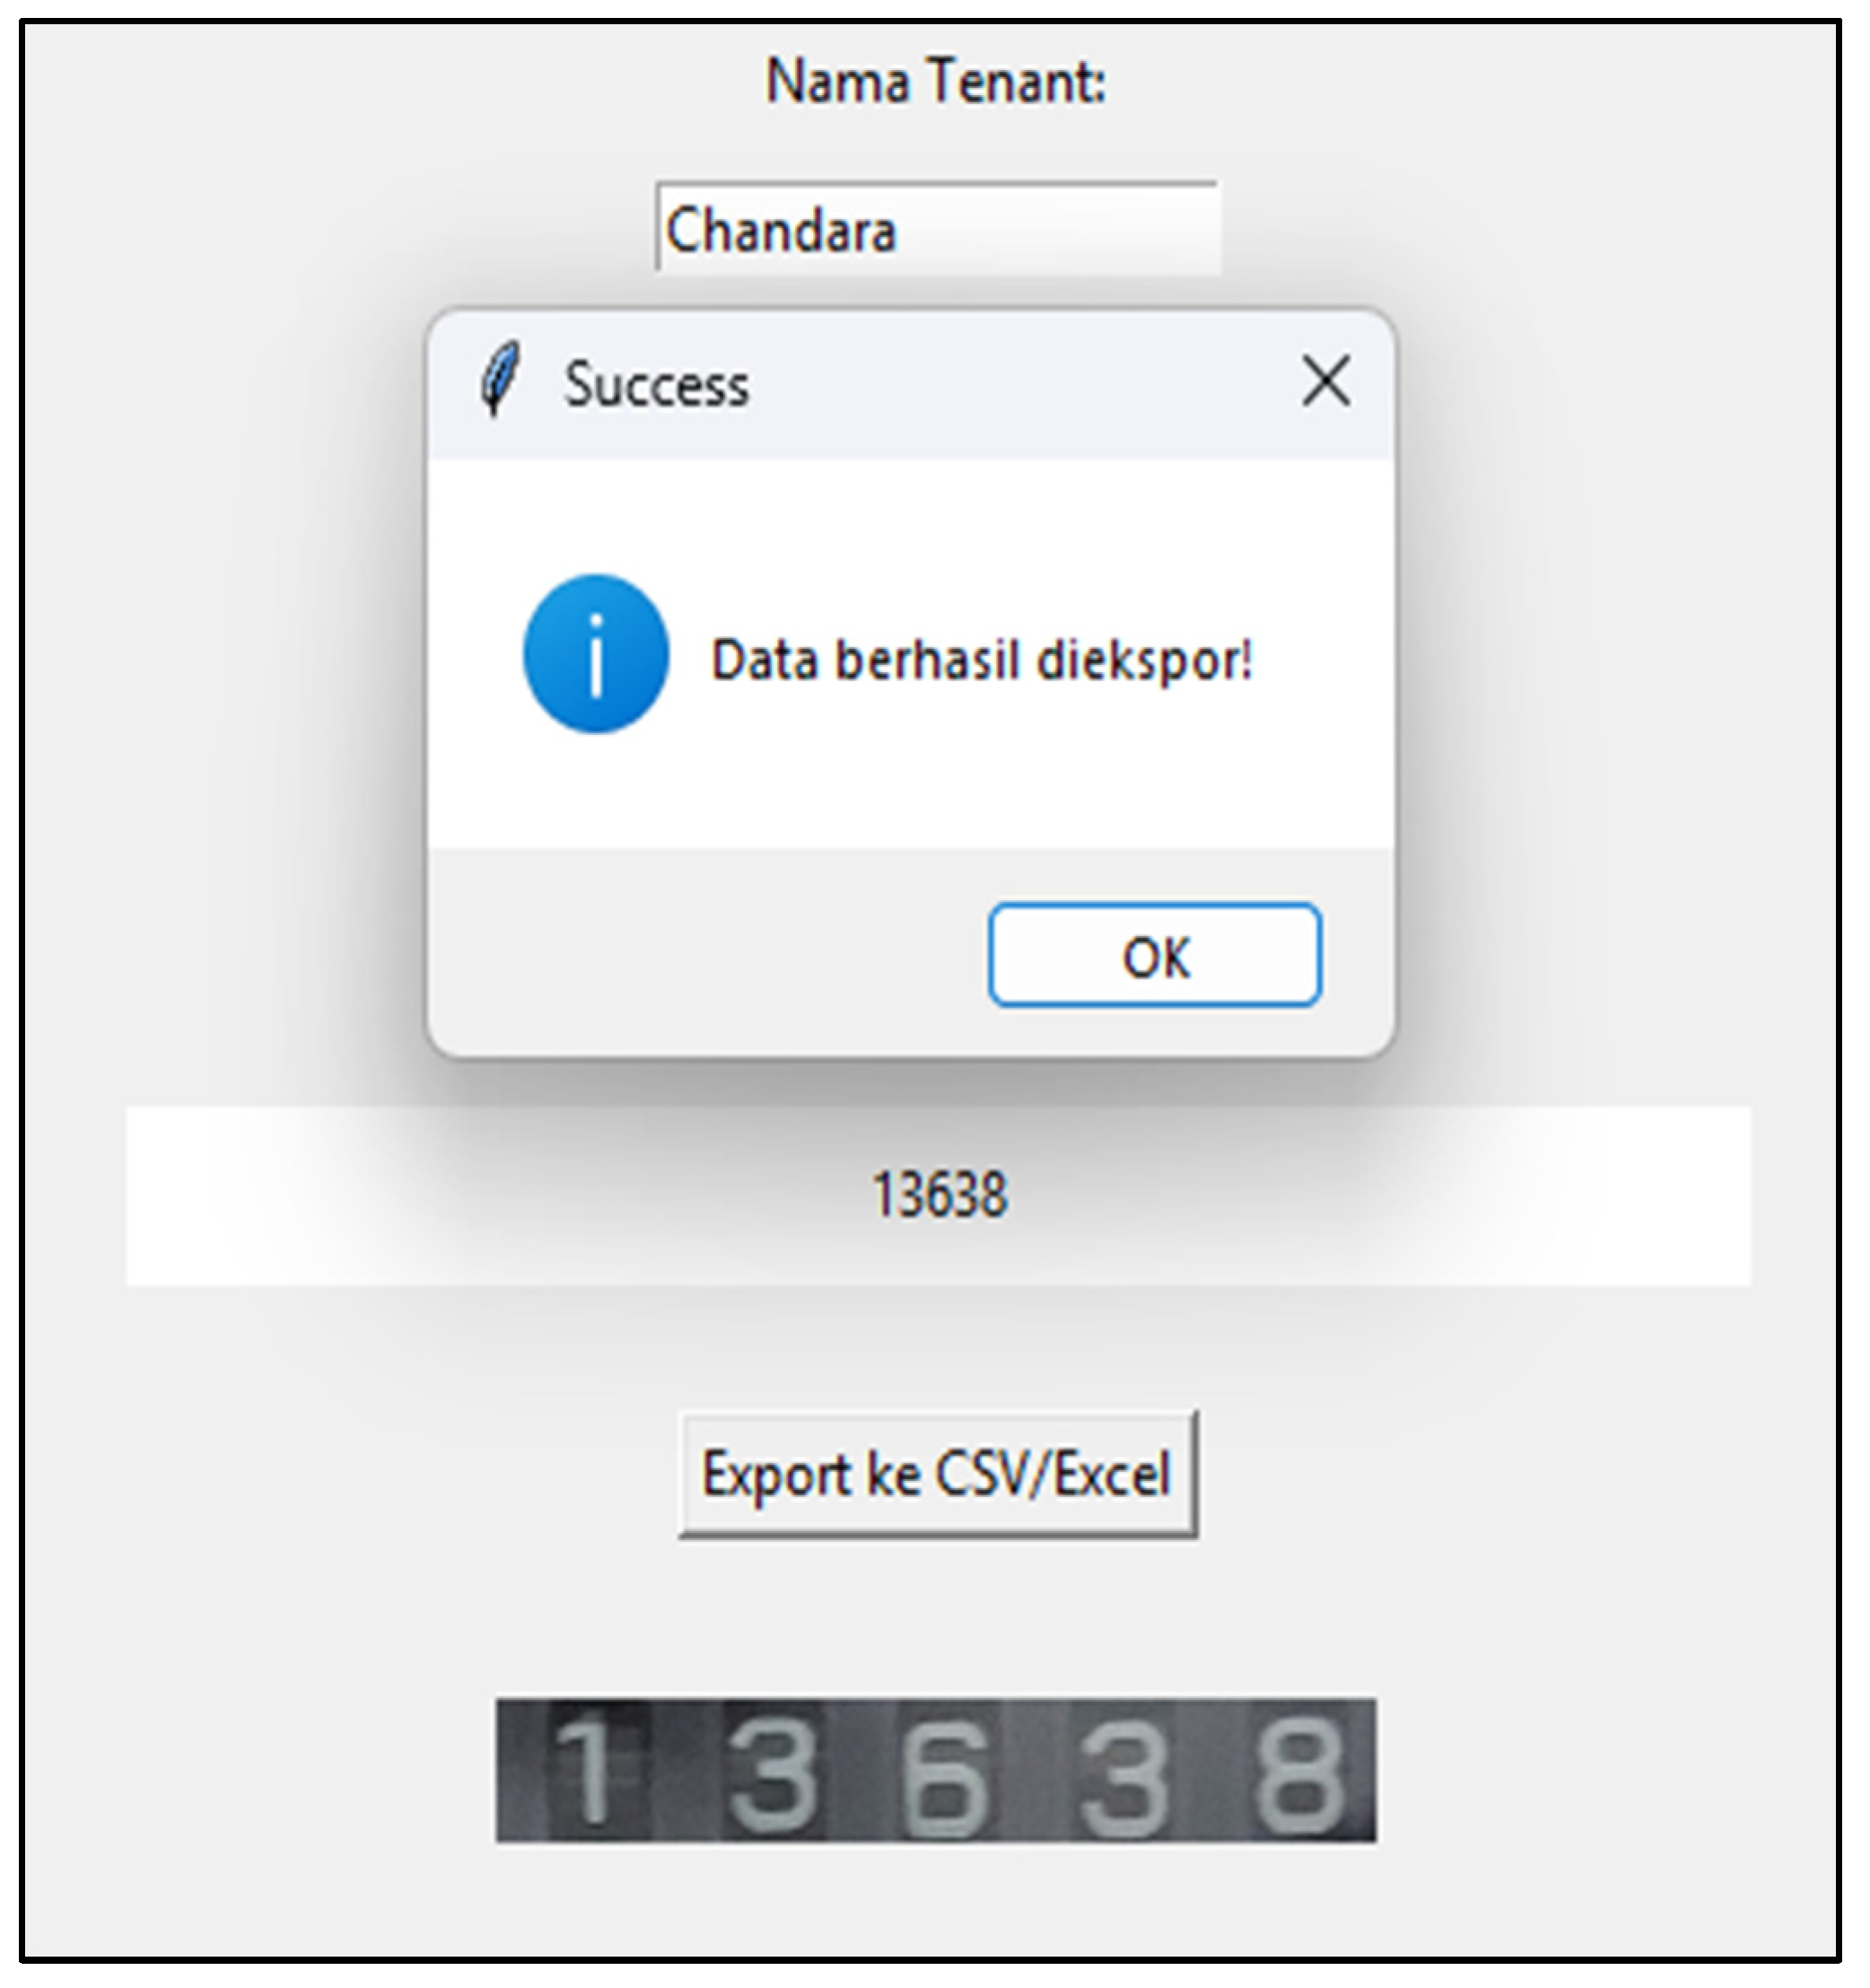
In addition to quantitative evaluation, qualitative results were visualized through a user interface designed to assist technicians in recording. The interface allows users to upload electricity meter images, run the digit detection process, and export the results to CSV or Microsoft Excel formats (
Figure 9 and
Figure 10). When detection was successful, the system displayed coloured bounding boxes around the electricity meter digits and converted them into numeric values. Conversely, if the system fails to detect digits, a pop-up notification alerts the user to retake the image.
Comparison with manual recording methods shows that the computer vision-based system significantly reduces the potential for human error and improves time efficiency. Test results demonstrated reduced recording time per meter unit and increased consistency in the results, even under varying lighting conditions. The results of this study confirm that the application of YOLOv9 improves digit detection accuracy compared with traditional methods and offers operational efficiency and readiness for adoption in other commercial buildings with minimal dataset adjustments.
4. Discussion
The model demonstrated the effectiveness of a digit detection system for analogue electricity meters using YOLOv9 integrated with EasyOCR, achieving an accuracy of 89.8% under real-world conditions at Plaza XYZ. The results highlight the advantages of YOLOv9’s architecture, particularly features such as the PAN and reversible columns, which enhance the detection of multi-digit objects under varying scales and lighting conditions. Similar computer vision–based recognition approaches have also been successfully applied in other domains such as automatic license plate recognition [
13]. Integration with EasyOCR further strengthened system performance by enabling direct conversion of detected digits into numerical values for recording and billing. The results of this study showed that YOLOv9 is applicable in analogue meter digit detection in energy management using computer vision. Practically, the model reduces human error, improves technician efficiency, and accelerates billing processes. It also offers a deployable solution for commercial and industrial facilities that continue to rely on analogue meters, supporting Indonesia’s transition toward digital energy management.
Despite these contributions, several limitations must be acknowledged. The dataset size was relatively small (80 images augmented to 137), potentially limiting generalizability. Testing was restricted to two analogue meter brands, Fuji Dharma and Metbelosa, and conducted in a controlled environment, which may not fully reflect field conditions such as extreme lighting, damaged meters, or non-standard installations. Therefore, it is required to expand the dataset to include diverse meter brands and environmental conditions, explore AI-based image enhancement or adaptive preprocessing to improve accuracy in challenging settings, and validate the system across larger industrial environments. Integrating predictive modules for energy consumption could further advance the transition toward smart energy management systems.
5. Conclusions
We developed and evaluated a digit detection system for analogue electricity meters using YOLOv9 integrated with EasyOCR, achieving an accuracy of 89.8% under real-world conditions at Plaza XYZ. The results demonstrate that the computer vision-based approach improves the accuracy and efficiency of electricity consumption recording, replacing manual methods prone to error. In a deployable model for the commercial sector in Indonesia, the latest YOLO model was applied. The system accelerates digital energy management and reduces operational costs through automated recording. Future studies are necessary to expand the dataset, validate the model in larger industrial environments, and integrate energy consumption prediction modules to support the transition toward smart energy management systems.
Author Contributions
Conceptualization, I.N. and E.P.; methodology, I.N.; software, M.M.F.; validation, I.N. and M.M.F.; formal analysis, I.N. and E.P.; investigation, M.M.F.; resources, E.P.; data curation, M.M.F.; writing—original draft preparation, M.M.F.; writing—review and editing, I.N. and E.P.; visualization, M.M.F.; supervision, I.N.; project administration, I.N.; funding acquisition, I.N. and E.P. All authors have read and agreed to the published version of the manuscript.
Funding
The Article Processing Charge (APC) was funded by the Center for Research and Community Service (LPPM), Universitas Pembangunan Jaya, Indonesia.
Institutional Review Board Statement
Not applicable.
Informed Consent Statement
Not applicable.
Data Availability Statement
The data presented in this study are available from the corresponding author upon reasonable request. The data is not publicly available due to institutional and private considerations related to the data collection site.
Conflicts of Interest
The authors declare no conflict of interest.
References
- Naimah, K.; Arirohman, I.D.; Zen, M.R.; Wicaksono, R.M.; Soelami, F.X.N.; Rahmatullah, A.; Purba, L.D.; Gaol, J.E.L. Analysis of Electrical Energy Consumption in Office Buildings of the Institute Technology of Sumatra in Energy Conservation and Efficiency Efforts. J. Edukasi Elektro 2023, 7, 181–194. [Google Scholar] [CrossRef]
- Thomas, B.; Babu, B.K.; Sunny, F.; Mathew, J.K.; Chandran, E.J. Automatic Meter Reading Using Power Line Communication. Int. J. Sci. Technol. Eng. 2016, 2, 815–818. [Google Scholar]
- Spichkova, M.; van Zyl, J. Application of Computer Vision Technologies for Automated Utility Meters Reading. In Proceedings of the 15th International Conference on Software Technologies ICSOFT, Online, 7–9 July 2020; 2020; Volume 1, pp. 521–528. [Google Scholar] [CrossRef]
- Redmon, J.; Divvala, S.; Girshick, R.; Farhadi, A. You Only Look Once: Unified, Real-Time Object Detection. In Proceedings of the IEEE Conference on Computer Vision and Pattern Recognition (CVPR); IEEE: Piscataway, NJ, USA, 2016; pp. 779–788. [Google Scholar]
- Khan, S.; Naseer, M.; Hayat, M.; Zamir, S.W.; Khan, F.S.; Shah, M. Transformers in Vision: A Survey. ACM Comput. Surv. 2022, 54, 1–41. [Google Scholar] [CrossRef]
- Chen, L.; Liu, Y.; Zhao, Y.; Zhang, H. Mining Automatic Meter Reading System Based on Deep Learning and Computer Vision. Appl. Sci. 2024, 14, 10949. [Google Scholar] [CrossRef]
- Zhang, Z.; Wang, F.; Liu, H.; Li, Z. Automatic Reading of Analog Meters Using Computer Vision and Deep Learning. IEEE Access 2019, 7, 169916–169928. [Google Scholar]
- Petralia, A.; Charpentier, P.; Boniol, P.; Palpanas, T. Appliance Detection Using Very Low-Frequency Smart Meter Time Series. In Proceedings of the 14th ACM International Conference on Future Energy Systems (e-Energy ‘23); Association for Computing Machinery: New York, NY, USA, 2023; pp. 214–225. [Google Scholar] [CrossRef]
- Wang, C.Y.; Yeh, I.H.; Mark Liao, H.Y. YOLOv9: Learning What You Want to Learn Using Programmable Gradient Information. In Computer Vision–ECCV 2024; Lecture Notes in Computer Science; Springer: Cham, Switzerland, 2025; pp. 1–21. [Google Scholar] [CrossRef]
- Salomon, G.; Laroca, R.; Menotti, D. Image-Based Automatic Dial Meter Reading in Unconstrained Scenarios. Meas. J. Int. Meas. Confed. 2022, 204, 112025. [Google Scholar] [CrossRef]
- Rahayu, W.I.; Prianto, C.; Novia, E.A. Perbandingan Algoritma K-Means dan Naive Bayes untuk Memprediksi Prioritas Pembayaran Tagihan Rumah Sakit Berdasarkan Tingkat Kepentingan pada PT. Pertamina (Persero) [Comparison of K-Means and Naïve Bayes Algorithms to Predict Hospital Bill Payment Priorities]. J. Tek. Inform. 2021, 13, 1–8. [Google Scholar]
- Hossain, M.A.; Afrin, S. Optical Character Recognition Based on Template Matching. Glob. J. Comput. Sci. Technol. 2019, 19, 31–35. [Google Scholar] [CrossRef]
- Du, S.; Ibrahim, M.; Shehata, M.; Badawy, W. Automatic License Plate Recognition: A State-of-the-Art Review. IEEE Trans. Circuits Syst. Video Technol. 2013, 23, 311–325. [Google Scholar] [CrossRef]
| Disclaimer/Publisher’s Note: The statements, opinions and data contained in all publications are solely those of the individual author(s) and contributor(s) and not of MDPI and/or the editor(s). MDPI and/or the editor(s) disclaim responsibility for any injury to people or property resulting from any ideas, methods, instructions or products referred to in the content. |