


Abstract
We enhance the operational performance of a textile factory by optimizing its production layout. The optimized layout improves operational time and increases overall productivity through strategic layout planning and workflow adjustments. The systematic layout planning method, combined with the analytical hierarchy process and technique for order of preference by similarity to an ideal solution from the multi-criteria decision-making process, is used to develop and select the optimal layout solution. The results show that the implementation of the improved layout design in alternative 1 led to a 45% reduction in average travel time and a 34% reduction in travel distance. This proposed solution optimizes production space while improving flexibility, safety, and competitiveness.
1. Introduction
An inefficient arrangement of factory premises leads to challenges in production. Key issues include excessive travel time, wasted floor space, and reduced personnel and equipment efficiency, all of which raise costs and lower productivity. Layout optimization is essential to improve throughput, streamline material flow, and enhance overall efficiency [1]. Applying systematic layout planning (SLP) to a steel processing layout improved material flow, reduced waste, and increased efficiency, demonstrating its value for industrial layout optimization [2]. Selecting the optimal solution requires balancing factors like cost, efficiency, safety, and space, making multi-criteria decision-making (MCDM) a common tool in complex decisions such as layout planning and resource allocation [3,4]. This study aims to optimize a textile factory’s layout to improve efficiency, reduce waiting time, and increase productivity. The SLP method is used to design alternatives, while MCDM techniques evaluate and select the best layout based on multiple criteria.
2. Materials and Methods
2.1. Application of SLP
SLP is a structured, data-based method for designing plant layouts aimed at improving operational efficiency and flexibility in manufacturing environments [5]. Its structured nature also supports flexibility across different factory scales and production systems, following a sequence of steps to optimize facility layout [6]. It begins with gathering input data relevant to processes, equipment, and operations. Next, material flow is analyzed using “From–To” diagrams, which track product volume, movement frequency, and distances between machines. This is followed by defining activity relationships through a relationship chart that captures qualitative closeness needs using the following categories: absolutely necessary (A), especially important (E), important (I), ordinary closeness (O), unimportant (U), and undesirable (X). Based on these priorities, a relationship diagram is created. The layout is evaluated and adjusted based on site constraints to ensure feasibility and compliance.
2.2. MCDM
MCDM is a systematic method for comparing and choosing the most appropriate option from a set of alternatives, where each option is evaluated based on several criteria. The techniques include the analytical hierarchy process (AHP), analytical network process, ÉLimination Et Choix Traduisant la REalité (ELECTRE), the Preference Ranking Organization Method for Enrichment Evaluation (PROMETHEE), technique for order preference by similarity to ideal solution (TOPSIS), and VIšeKriterijumska Optimizacija I Kompromisno Rešenje (VIKOR). Each method provides a distinct framework for ranking or selecting alternatives by assigning weights to multiple criteria [3,7].
2.2.1. AHP
The AHP, developed by Thomas L. Saaty, is a popular MCDM method that structures complex decisions into a hierarchy and supports rational choices using both qualitative and quantitative inputs. This process begins by defining the problem and goal, where the decision objective is clearly stated to guide the analysis. Once the hierarchy is established, pairwise comparisons use a standardized scale from 1 to 9, where 1 indicates equal importance and 9 indicates extreme importance of one element over another. The next step is to calculate the priority weights, which represent the relative weight of each element based on the preferences or assessments provided by the decision-maker [8,9,10].
2.2.2. TOPSIS
TOPSIS is used to rank and select alternatives based on their proximity to an ideal solution. It requires numerical data and predefined weights for each criterion, which can be determined by expert opinion [11]. The process involves creating a decision matrix, normalizing, and applying weights based on criterion importance. Each alternative’s distance to the ideal and negative-ideal solutions is calculated, and a relative closeness score is used to rank them [12,13].
- Normalize the decision matrix to become the normalized matrix R.
- rij: normalized value of the element in row i and column j;
- xij: initial value of the element in row i and column j;
- m: number of alternatives.
- Calculate the weighted normalized matrix V: Multiply each column in R by its corresponding criterion weight from the AHP stage.
- Determine the ideal and negative-ideal solutions.
V+ = {v1+, v2+, v3+…vn+}, vj+ = max(vij), V− = {v1−, v2−, v3−…vn−}, vj− = min(vij),
- vij: weighted normalized value of alternative i for criterion j in matrix (V);
- vj+: value of criterion j in the ideal solution V+;
- vj−: value of criterion j in the non-ideal solution V−.
- Calculate the distance to ideal (Si+) and negative-ideal solutions (Si−).
- Calculate the relative closeness (Pi).
- Rank the alternatives: The alternative with the highest Pi is the best alternative.
2.3. Textile Factory Layout
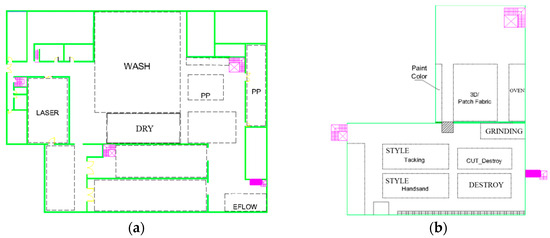
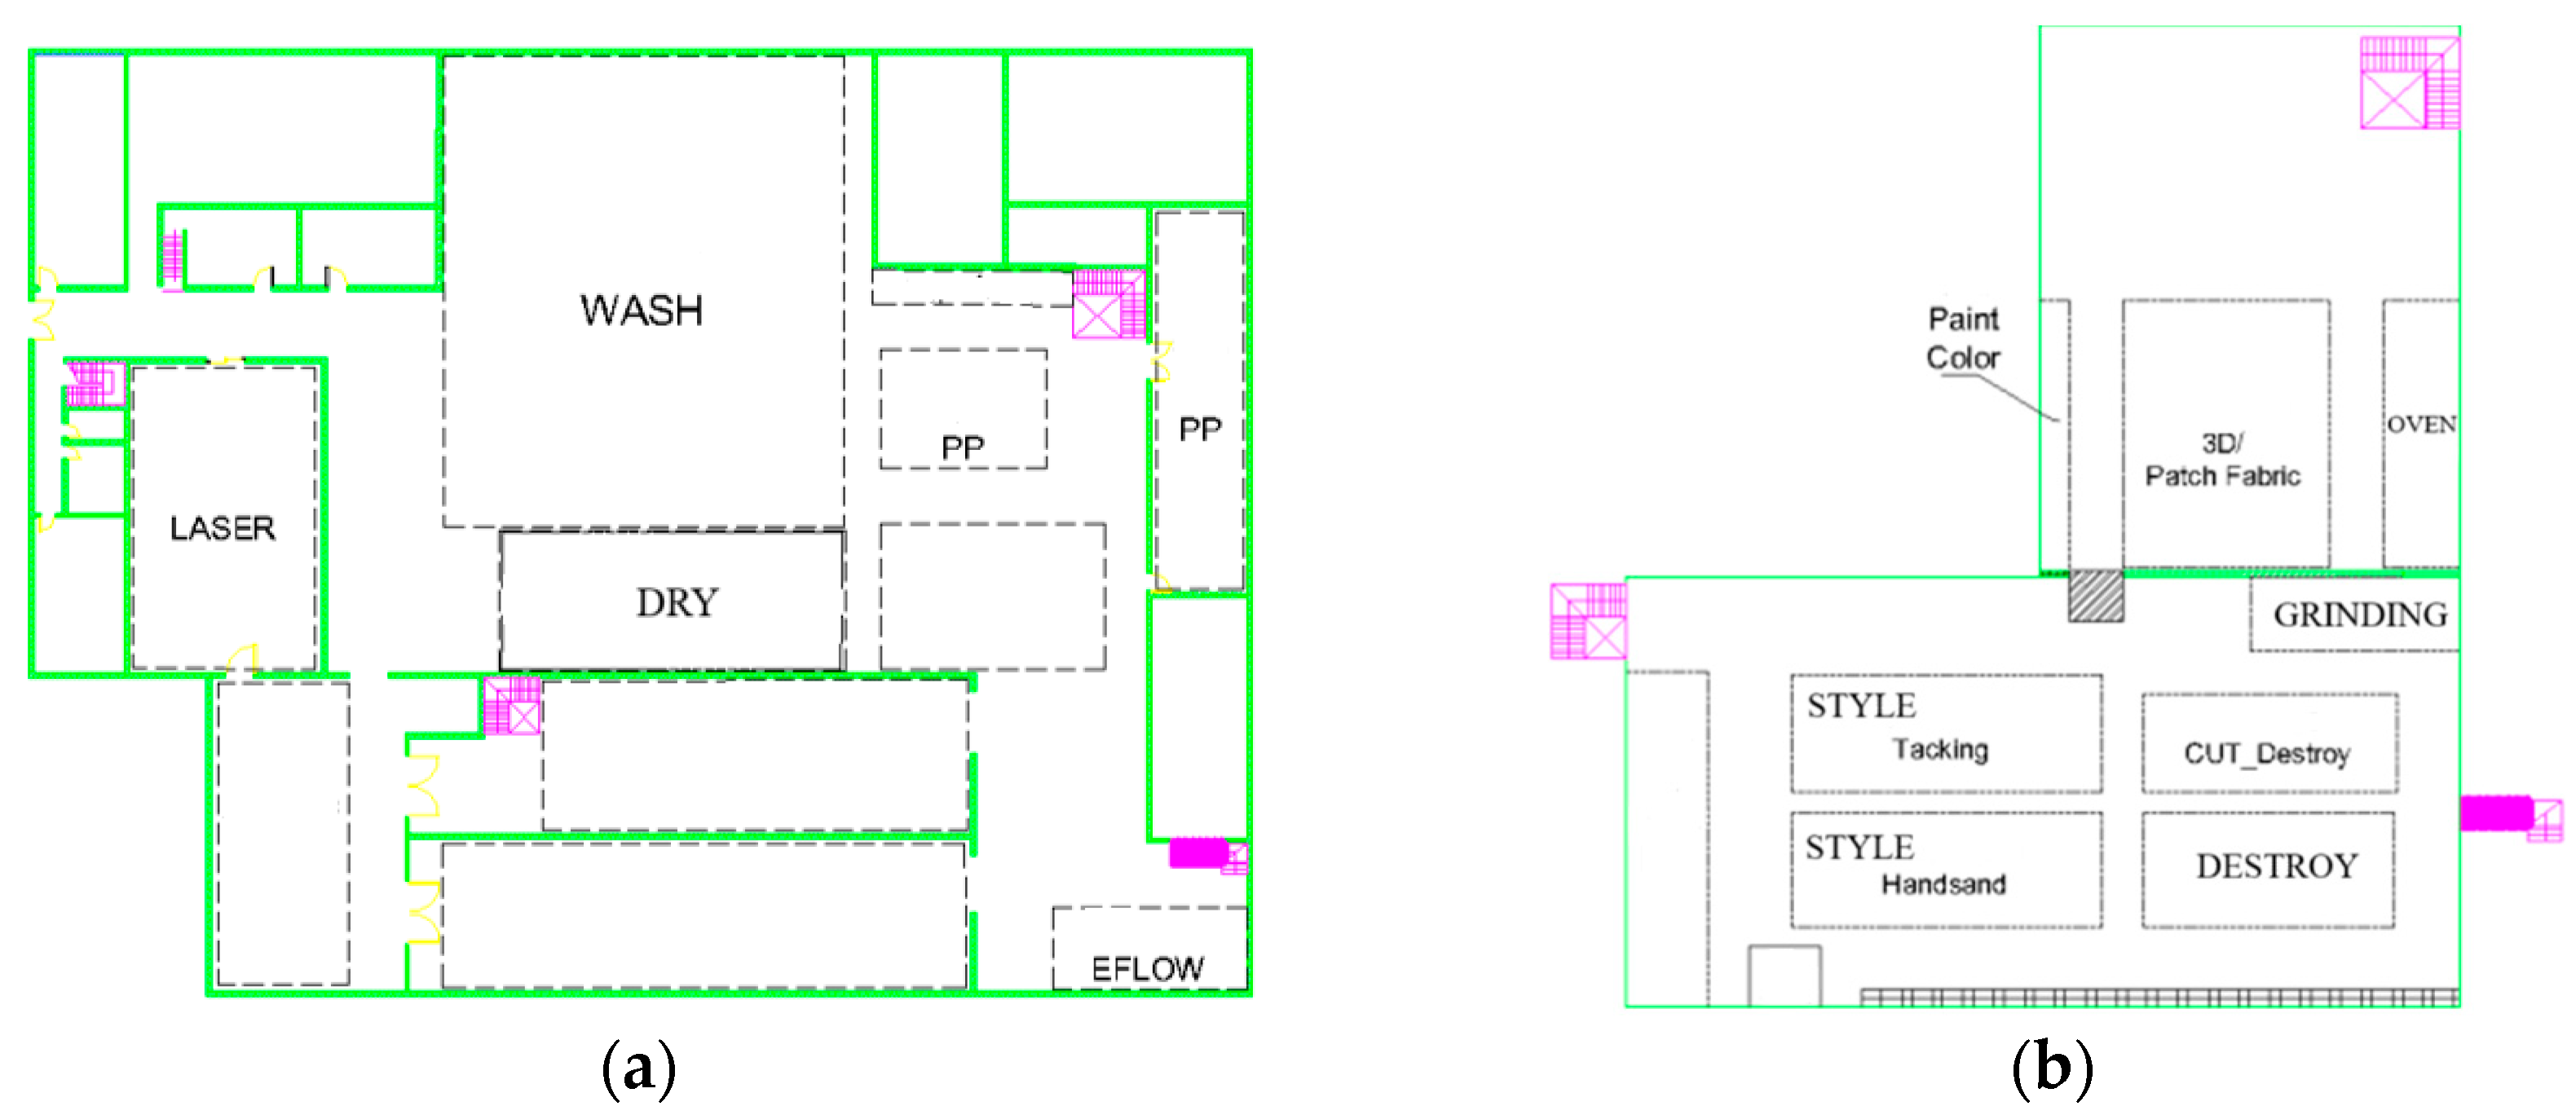
The original layout of the textile factory is illustrated in Figure 1. In the layout, gray indicates working areas, green indicates boundaries, and magenta indicates auxiliary utility. Table 1 presents the employee travel time in each workstation.
Figure 1.
Layout of textile factory: (a) first floor; (b) second floor.
Table 1.
Employee travel time in workstation.
3. Results
3.1. Layout Design Based on SLP
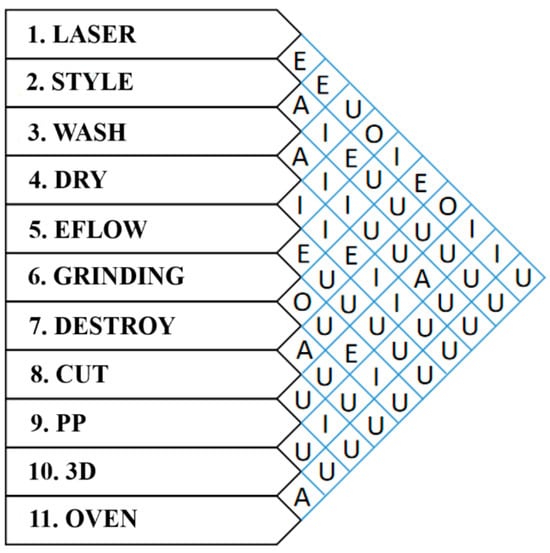
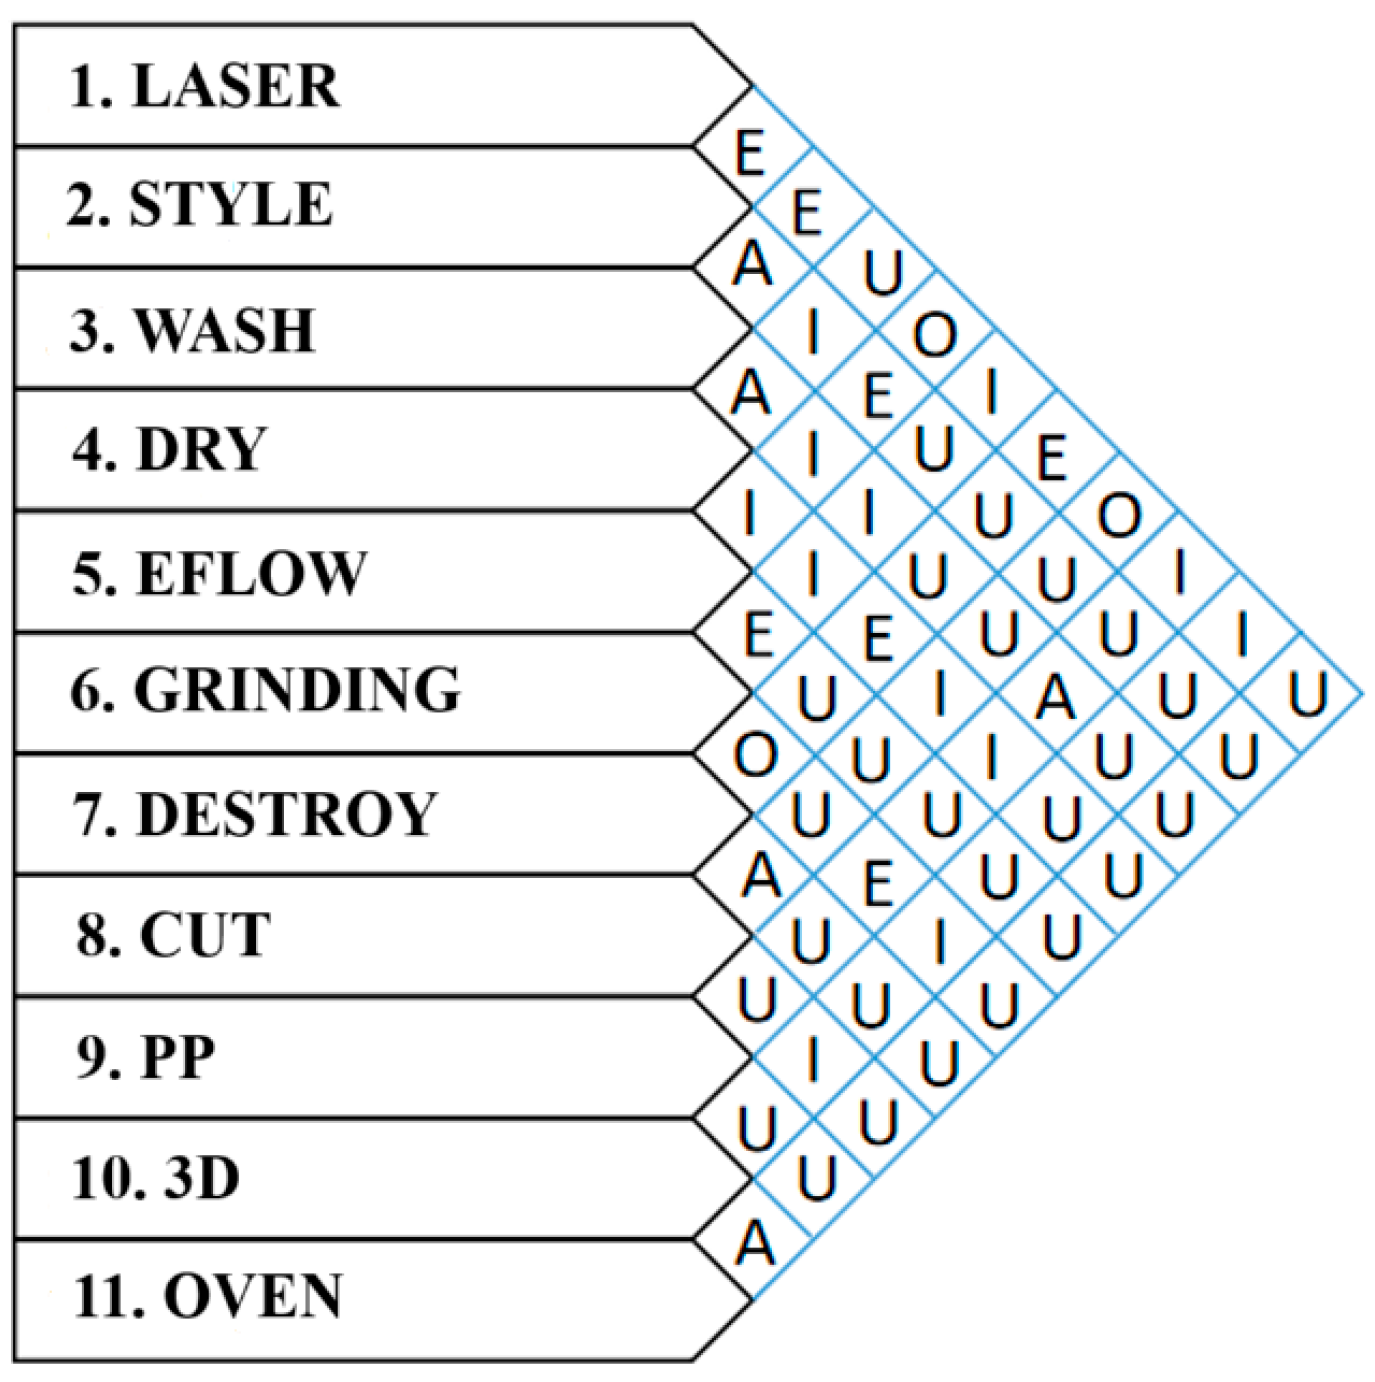
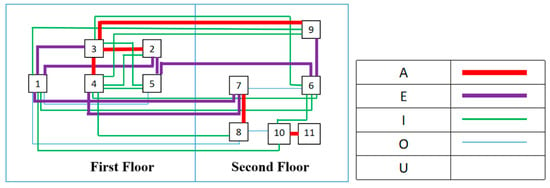
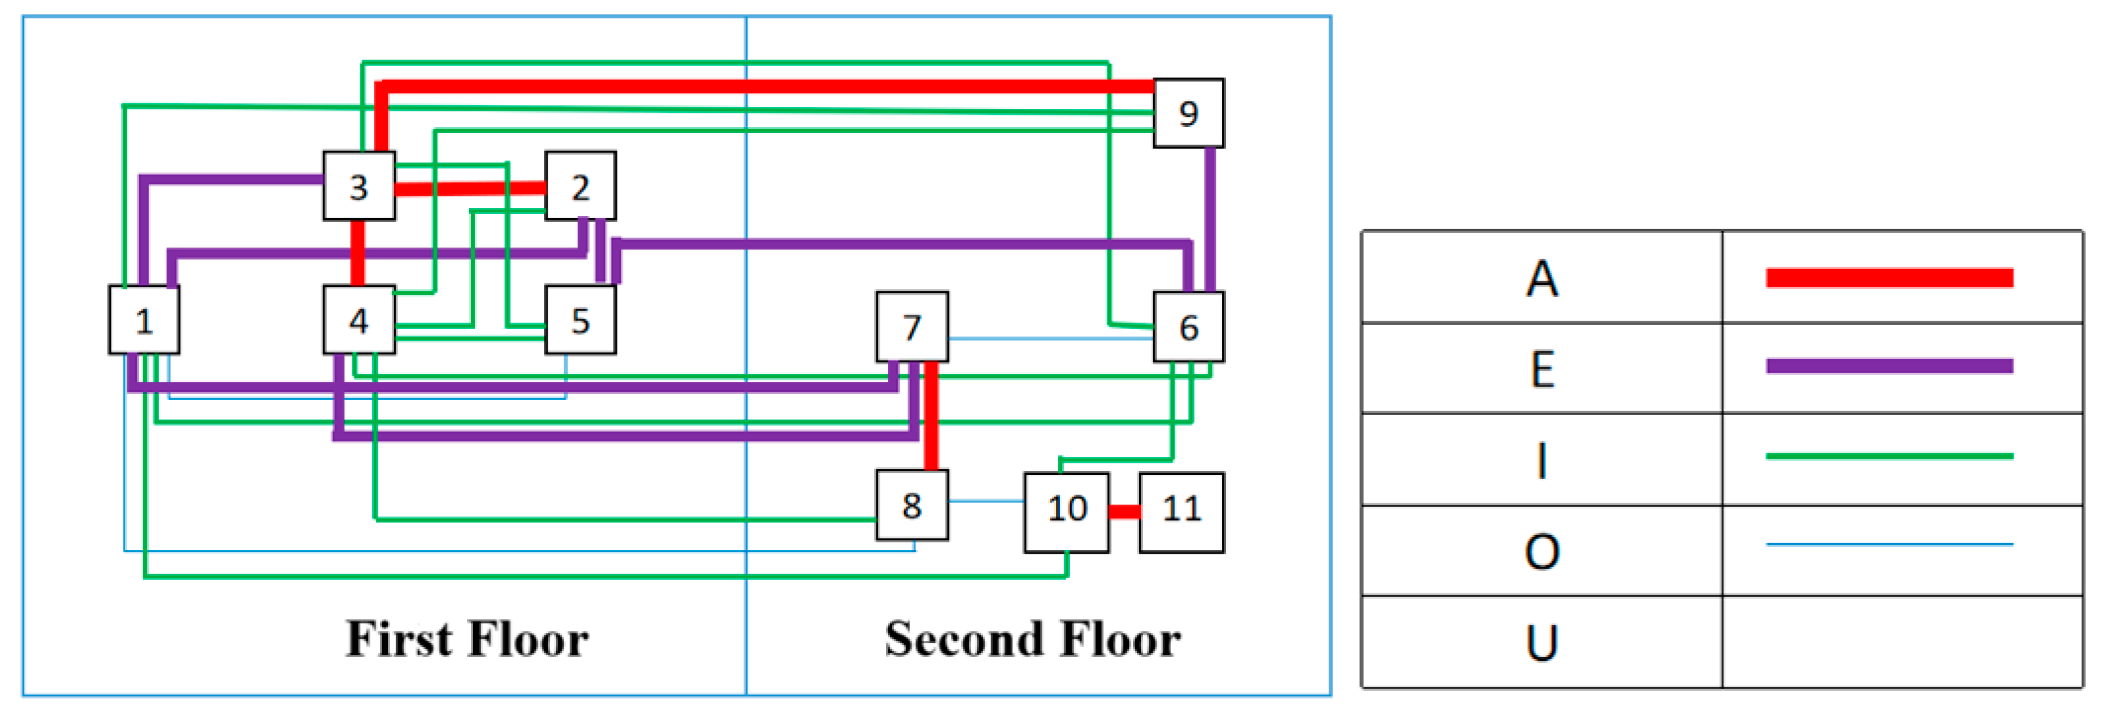
The level of relationship between the two areas was determined based on the analysis of the production process and minimizing material transport during production (Figure 2).
Figure 2.
The relationship chart between areas.
From the relationship chart, the arrangement order is as follows: (3) → (2), (4), (9) → (1) → (7) → (8) → (6) → (5) → (10) → (11).
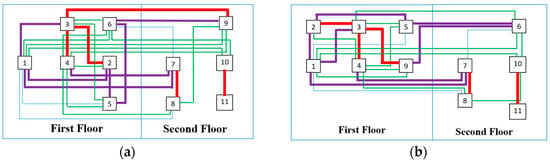
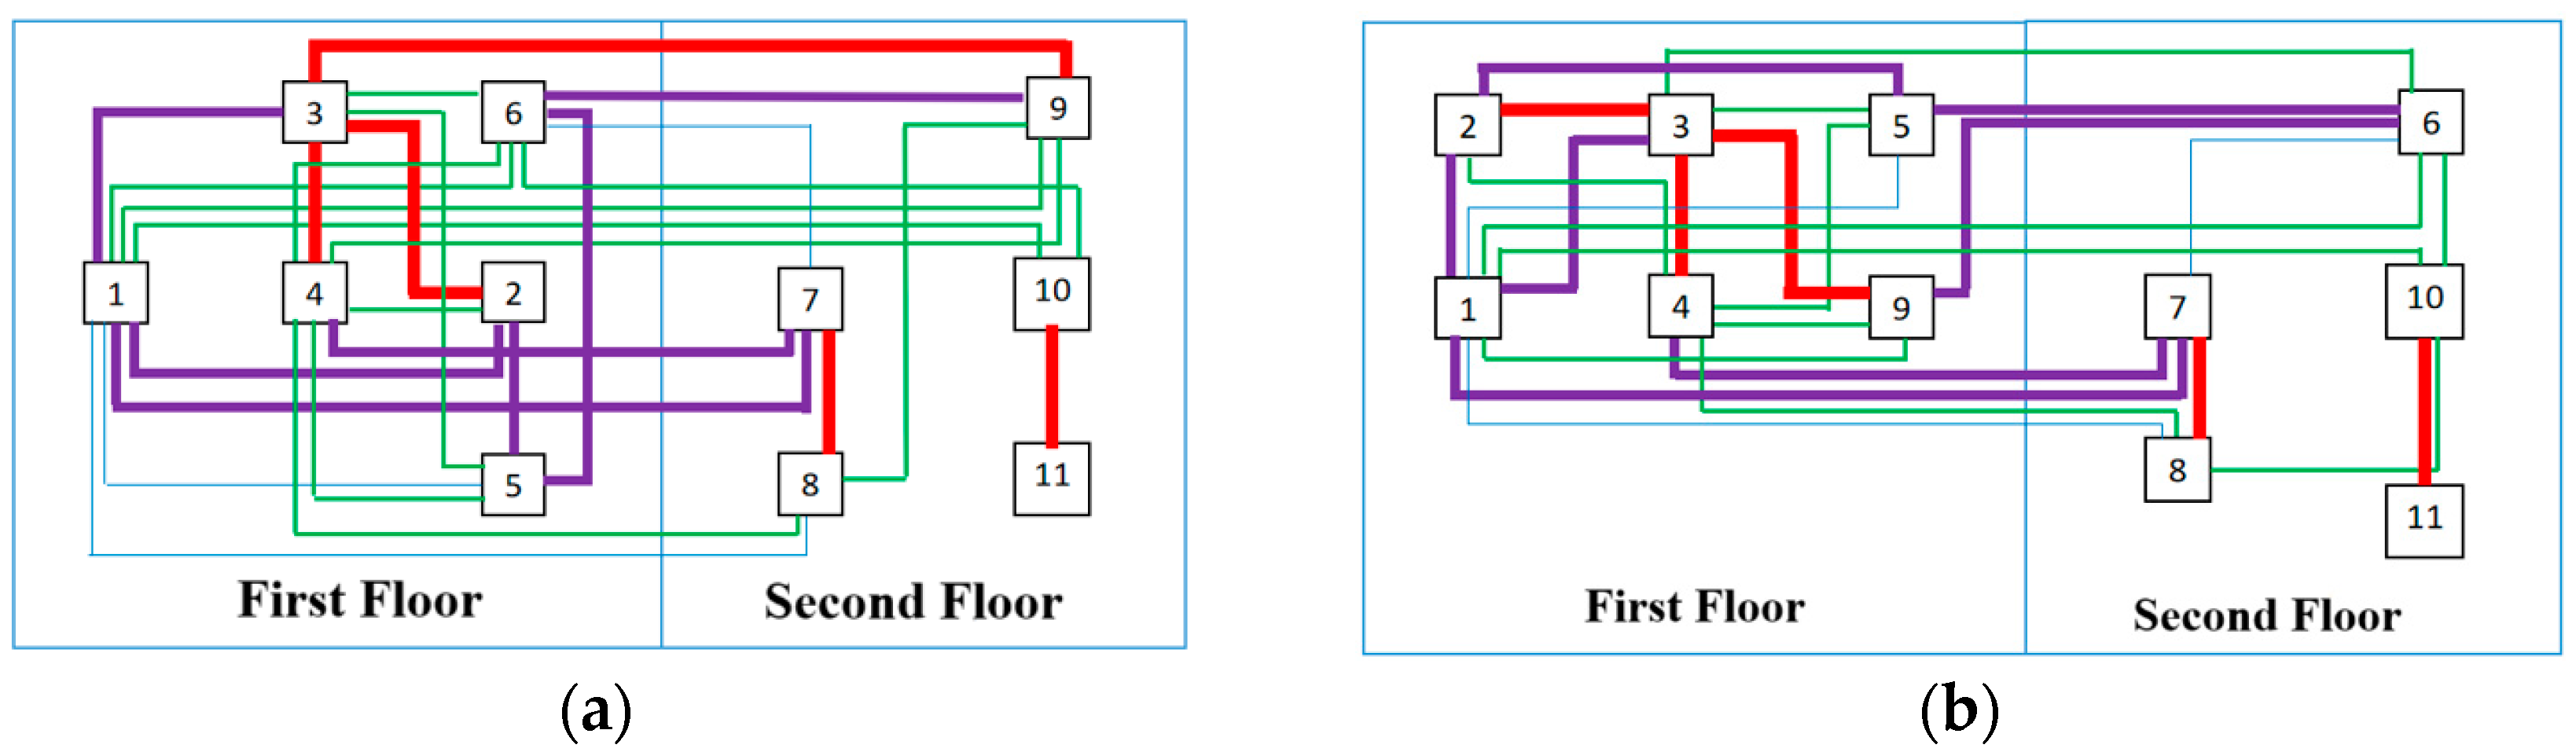
Figure 3 and Figure 4 show the relationships for the proposed layout in three alternatives. Areas 1–11 are distributed across two floors, with colored lines representing the intensity of interactions. Stronger relationships are highlighted in red, aiding in evaluating the efficiency of the spatial arrangement.
Figure 3.
Relationship diagram for alternative 1.
Figure 4.
Relationship diagram for the alternatives: (a) alternative 2; (b) alternative 3.
3.2. FlexSim Results
The layout simulation results (Table 2) for the original configuration and the proposed alternative layouts were obtained using FlexSim, version 2019.
Table 2.
Simulation results for the original layout and three alternatives.
3.3. MCDM (AHP and TOPSIS)
The selection criteria for evaluating layout alternatives are categorized into quantitative (output, travel distance, and travel time) and qualitative factors (safety and work environment, and inter-area flexibility). The initial step in applying the AHP method involves developing a structured questionnaire for expert evaluation aimed at performing pairwise comparisons between criteria and alternatives (Table 3).
Table 3.
Pairwise comparison matrix of criteria importance.
The matrix is normalized by first calculating the sum of each column, then dividing each element by its respective column total. The average of each resulting row is then computed to determine the corresponding weight for each criterion (Table 4).
Table 4.
Normalized matrix and criteria weight.
The MCDM problem is addressed through the TOPSIS method. The simulation results in Table 2 are normalized using Equation (1), yielding the matrix in Table 5.
Table 5.
Vector-normalized matrix.
The weighted vector-normalized matrix (Table 6) is obtained by multiplying each element of the vector-normalized matrix by the corresponding criterion weight presented in Table 5. Next, the ideal and negative-ideal solutions for each criterion are identified based on Equation (2), corresponding to the best and worst values in the weighted normalized matrix, respectively.
Table 6.
Weighted vector-normalized matrix.
The distances of each alternative from the ideal solution (Si+) and the negative-ideal solution (Si−) are calculated using Equation (3). Following the computation of these separation measures, the relative closeness coefficient (Pi) for each alternative is determined by Equation (4). Table 7 presents the resulting values, confirming alternative 1 as the optimal choice.
Table 7.
Dispersion and relative closeness of alternatives.
4. Conclusions
Following the implementation of the SLP approach, the most suitable layout, alternative 1, was determined using the AHP and TOPSIS, both of which are well-established methods under the MCDM framework. Operational performance showed measurable gains based on the simulation outcomes. Specifically, the completed output increased slightly from 145 to 146 pallets, indicating enhanced throughput. Moreover, there was a 34% reduction in total travel distance (from 263,763.2 to 174,274.1 m) and a 45% decrease in average travel time (from 13,358.24 to 7271.94 s). These outcomes confirm the effectiveness of the proposed layout in optimizing material flow and improving overall efficiency.
Author Contributions
Conceptualization, N.T.B.T. and T.N.M.D.; methodology, T.N.M.D.; software, L.D.T.; validation, Y.-T.J. and N.T.B.T.; formal analysis, N.T.B.T., L.N.H. and L.D.T.; investigation, L.D.T. and T.N.M.D.; resources, T.N.M.D.; data curation, L.N.H. and N.T.B.T.; writing—original draft preparation, N.T.B.T. and L.D.T.; writing—review and editing, Y.-T.J. and N.T.B.T.; visualization, L.N.H. and L.D.T.; supervision, Y.-T.J.; project administration, T.N.M.D.; funding acquisition, Y.-T.J. All authors have read and agreed to the published version of the manuscript.
Funding
This research received no external funding.
Institutional Review Board Statement
Not applicable.
Informed Consent Statement
Not applicable.
Data Availability Statement
Data are available in this manuscript.
Conflicts of Interest
The authors declare no conflict of interest.
References
- Jasrotia, M.S.; Sengottaiyan, K. SLP (Systematic Layout Planning) for Enhanced Plant Layout Efficiency. Int. J. Sci. Res. 2024, 13, 820–827. [Google Scholar]
- Salins, S.S.; Zaidi, S.A.R.; Deepak, D.; Sachidananda, H.K. Design of an improved layout for a steel processing facility using SLP and lean Manufacturing techniques. Int. J. Interact. Des. Manuf. 2024, 18, 3827–3848. [Google Scholar] [CrossRef] [Scilit]
- Azhar, N.A.; Radzi, N.A.; Wan Ahmad, W.S.H.M. Multi-criteria decision making: A systematic review. Recent Adv. Electr. Electron. Eng. 2021, 14, 779–801. [Google Scholar] [CrossRef] [Scilit]
- Li, J.; Dai, J.; Issakhov, A.; Almojil, S.F.; Souri, A. Towards decision support systems for energy management in the smart industry and Internet of Things. Comput. Ind. Eng. 2021, 161, 107671. [Google Scholar] [CrossRef] [Scilit]
- Rodriguez, L.; Loyo, J.; Silva, U. Layout evaluation with the Industry 4.0 approach for a manufacturing laboratory. Int. J. Simul. Model. 2023, 22, 551–561. [Google Scholar] [CrossRef] [Scilit]
- Zhu, L.; Wang, R.; Zhao, Z. Factory layout optimization based on Systematic Layout Planning and genetic algorithm. In International Conference on Algorithms, Microchips and Network Applications; SPIE: Bellingham, WA, USA, 2022; Volume 12176, pp. 106–114. [Google Scholar]
- Shao, M.; Han, Z.; Sun, J.; Xiao, C.; Zhang, S.; Zhao, Y. A review of multi-criteria decision making applications for renewable energy site selection. Renew. Energy 2020, 157, 377–403. [Google Scholar] [CrossRef] [Scilit]
- Sitorus, F.; Cilliers, J.J.; Brito-Parada, P.R. Multi-criteria decision making for the choice problem in mining and mineral processing: Applications and trends. Expert Syst. Appl. 2019, 121, 393–417. [Google Scholar] [CrossRef] [Scilit]
- Tavana, M.; Soltanifar, M.; Santos-Arteaga, F.J. Analytical hierarchy process: Revolution and evolution. Ann. Oper. Res. 2023, 326, 879–907. [Google Scholar] [CrossRef] [Scilit]
- Ozsahin, D.U.; Gökcekus, H.; Uzun, B.; LaMoreaux, J.W. Application of Multi-Criteria Decision Analysis in Environmental and Civil Engineering; Springer: Cham, Switzerland, 2021; pp. 37–41. [Google Scholar]
- Uzun, B.; Taiwo, M.; Syidanova, A.; Uzun Ozsahin, D. The technique for order of preference by similarity to ideal solution (TOPSIS). In Application of Multi-Criteria Decision Analysis in Environmental and Civil Engineering; Springer International Publishing: Cham, Switzerland, 2021; pp. 25–30. [Google Scholar]
- Trivedi, P.; Shah, J.; Čep, R.; Abualigah, L.; Kalita, K. A hybrid best-worst method (BWM)—Technique for order of preference by similarity to ideal solution (TOPSIS) approach for prioritizing road safety improvements. IEEE Access 2024, 12, 30054–30065. [Google Scholar] [CrossRef] [Scilit]
- Muchlis, L.S.; Lizar, Y.; Aini, U.M.; Guci, A. Technique for Order of Preference by Similarity to Ideal Solution (TOPSIS) Untuk Penentuan Dosen Pembimbing Praktik Terbaik. J. Sci. Technol. 2023, 3, 165–176. [Google Scholar] [CrossRef] [Scilit]

Disclaimer/Publisher’s Note: The statements, opinions and data contained in all publications are solely those of the individual author(s) and contributor(s) and not of MDPI and/or the editor(s). MDPI and/or the editor(s) disclaim responsibility for any injury to people or property resulting from any ideas, methods, instructions or products referred to in the content. |
© 2026 by the authors. Licensee MDPI, Basel, Switzerland. This article is an open access article distributed under the terms and conditions of the Creative Commons Attribution (CC BY) license.