


Abstract
Background: Type 2 diabetes mellitus (T2DM) is associated with altered gut microbiota and reduced short-chain fatty acid production, which may contribute to insulin resistance. However, evidence on fecal Short Chain Fatty Acid (SCFA) profiles in African populations remains limited. This study quantified fecal SCFAs in individuals with and without T2DM using Gas Chromatography–Mass Spectrophotometry (GC-MS) with N,O-bis(trimethylsilyl)trifluoroacetamide (BSTFA) derivatization. Methods: A cross-sectional study included 140 adults (92 non-diabetic and 48 T2DM). Fecal SCFAs were extracted, derivatized using BSTFA, and analysed by GC–MS. Associations between SCFAs, diabetes status, and HbA1c were evaluated using non-parametric statistics. Results: The GC–MS method demonstrated strong linearity (R2 = 0.9917–0.9978), acceptable recovery, and reproducibility. Acetic, propionic, butyric, pentanoic, hexanoic, and heptanoic acids were detected, with acetic acid being most abundant in both groups. T2DM participants had higher median SCFA levels, although only butyric acid differed significantly (p = 0.027). HbA1c was significantly higher in the T2DM group (p < 0.001). No significant associations were observed between SCFAs and HbA1c in either group. Age differed significantly between groups, with T2DM participants older than non-diabetic controls. Conclusions: Most fecal SCFA profiles were comparable between individuals with T2DM and healthy controls. However, butyric acid was significantly elevated in the T2DM group, indicating that not all SCFAs exhibited similar patterns between the study groups. These findings suggest that fecal SCFAs alone may not serve as reliable biomarkers of T2DM in this population and highlight the influence of complex host–microbiome–environment interactions suggesting that dietary and microbial factors may outweigh disease status in determining SCFA variability in this cohort setting.
1. Introduction
Type 2 diabetes mellitus (T2DM) is a chronic metabolic disorder characterized by insulin resistance in which the pancreatic β-cells become less responsive to insulin, and by persistent hyperglycemia [1]. Globally, the prevalence of T2DM has been rising at an alarming rate, driven largely by rapid urbanization, sedentary lifestyles, unhealthy dietary patterns, and increasing obesity [1]. According to estimates from the 2017 International Diabetes Federation (IDF) Diabetes Atlas, diabetes affected roughly 425 million individuals globally, and this number is expected to increase to 700 million by 2045 [2]. Sub-Saharan Africa currently reports one of the lowest regional T2DM prevalence rates at 4.7%; however, this estimate varies considerably across countries and is projected to increase as the region undergoes epidemiological transitions [3]. Within Sub-Saharan Africa, South Africa faces a particularly substantial burden, where diabetes ranks among the leading causes of death in women and men, highlighting its significant impact on the population [4]. Therefore, effective preventive strategies are needed to reduce the incidence of T2DM. These strategies include promoting healthy lifestyles through proper nutrition, regular physical activity, and maintaining a healthy weight. In addition, early detection through routine screening can identify individuals at risk or in the pre-diabetic stage, enabling timely interventions to prevent disease progression [5].
Several studies have shown that the decreased production of short-chain fatty acids (SCFAs) in individuals with T2DM is associated with pathogenic bacteria that lack SCFA-producing capacity [6]. This decline in SCFA levels may contribute to insulin resistance, inflammation, and metabolic dysfunction observed in diabetic patients [6]. As a result, there is growing interest in understanding how gut microbiota and their metabolites, particularly SCFAs, influence the development and progression of T2DM, as well as their potential as therapeutic targets [6]. However, research on SCFAs in the context of diabetes remains limited, especially regarding specific microbial species responsible for SCFA production and their physiological significance to the host, which complicates efforts to understand the relationship between SCFAs and gut microbiota [7]. Addressing these limitations is essential for drawing meaningful conclusions and advancing current knowledge in the field.
Accurate quantification of SCFAs, which are typically present at very low concentrations in biological samples, is a critical first step for understanding their physiological significance [7]. According to the literature, gas chromatography–mass spectrometry (GC–MS) remains one of the most widely used techniques for SCFA analysis, typically requiring derivatization to improve detection sensitivity and specificity [8,9]. Several derivatizing agents are available, including pentafluorobenzyl bromide (PFBBr), chloroformates, and trimethylsilyl (TMS) reagents such as N,O-bis(trimethylsilyl)trifluoroacetamide (BSTFA) and N-Methyl-N-(trimethylsilyl)trifluoroacetamide (MSTFA). Notably, N,O-bis(trimethylsilyl)trifluoroacetamide (BSTFA) has shown particular promise in enhancing SCFA volatility and detection accuracy compared with other agents [10].The true value of this study lies in its unique geographical and ethnic context, mapping fecal SCFA profiles within South African population that is currently underrepresented in metabolic research. Therefore, this study aimed to quantitatively profile fecal SCFAs in individuals with T2DM and non-diabetic controls within a South African population using BSTFA derivatization coupled with GC–MS, and to evaluate their associations with glycaemic control (HbA1c) as well as demographic and clinical characteristics.
2. Materials and Methods
2.1. Study Design
This study employed an analytical cross-sectional comparative design to quantify and compare SCFA’s concentrations between adults with T2DM and non-diabetic individuals.
2.2. Study Population
The study included a total cohort of 140 South African urban patients (≥18 years), comprising 48 patients with T2DM recruited from the Dr George Mukhari Academic Hospital (DGMAH) diabetes clinic and 92 non-diabetic controls recruited from nearby townships (Ga-Rankuwa, Soshanguve, and Mabopane) between April 2023 and September 2023. Before sample collection, participants completed a structured questionnaire to obtain demographic and clinical information relevant to the study objectives. The questionnaire collected demographic data (age, sex, and residential location) and clinical information, including current medication use. For participants with T2DM, antidiabetic medications, including metformin, were documented. However, Body Mass Index (BMI) and dietary factors, including daily fiber intake, were not assessed.
Written informed consent was obtained from all participants before enrolment. To minimize selection bias and confounding, both groups were recruited from the same geographic catchment area and were subject to identical eligibility criteria, except for diabetes status. Participants were eligible if they were ≥18 years of age, had confirmed T2DM (for the diabetes group), and resided in one of the selected townships. Individuals with conditions or treatments known to influence gut microbiota composition and SCFA production, such as recent antibiotic use (within the preceding three months) or gastrointestinal disorders, were excluded.
Although recruiting patients with T2DM from a hospital clinic and non-diabetic controls from the surrounding community may have introduced residual confounding related to lifestyle, dietary habits, and socioeconomic factors, recruiting participants from the same geographic catchment area was intended to improve group comparability. However, because of the cross-sectional study design and the absence of BMI and dietary fiber intake data, residual confounding cannot be completely excluded and is acknowledged as a study limitation. The study was approved by the Ethics Committee of Sefako Makgatho Health Sciences University (Reference: SMUREC/M/321/2022: PG).
2.3. Materials, Apparatus and Instrumentation
The volatile fatty acid standards, including acetic acid (purity ≥ 99.90%), propionic acid (purity ≥ 99.90%), butyric acid (purity ≥ 99.80%), isobutyric acid (purity ≥ 99.9%), valeric acid (purity ≥ 99.6%), isovaleric acid (purity ≥ 99.90%), formic acid (purity ≥ 99.8%), 4-methylvaleric acid (purity ≥ 99.07%), caproic acid (purity ≥ 99.8%), hexanoic acid (purity ≥ 99.8%), heptanoic acid (purity ≥ 99.61%), and N, O-bis(trimethylsilyl)trifluoroacetamide (BSTFA) were purchased from Separations (Johannesburg, South Africa).
The reagents, including analytical grade hydrochloric acid (HCl), anhydrous diethyl ether (DE), anhydrous sodium sulfate (Na2SO4) were purchased from Sigma Aldrich (Johannesburg, South Africa). Deionised water was collected from the water purifying system. An Agilent Technologies 7890B GC-MS system (Agilent Technologies, Santa Clara, CA, USA) was employed with helium 5.0 as carrier gas. A HP-5MS capillary column (30 m × 0.25 mm, 0.25 µm film thickness; Agilent Technologies) was also used, a Heidolph Reax 2000 vortexer (Heidolph Instruments, Schwabach, Germany) was used. The model shaker Roller Mixer (Taipai, Taiwan) was manufactured by the Gemmy Industrial Corp and the CS-A5R Centrifuge (Centurion, South Africa) was purchased from Beckman.
2.4. Laboratory Procedure
2.4.1. Sample Collection and Preparation
Samples from participants with T2DM were collected at the diabetic clinic of Dr George Mukhari Academic Hospital, while samples from non-diabetic participants were collected at the Chemical Pathology Department of Sefako Makgatho Health Sciences University. All participants were instructed to provide fecal samples immediately after defecation to minimize environmental contamination. Samples were placed in closed specimen containers, transported in a cooler box to the Chemical Pathology Laboratory, and stored at −70 °C until analysis. Participants with T2DM who were unable to provide samples during their clinic visit were issued fecal collection kits and given instructions for home collection. All non-diabetic participants provided samples during their visit to the department.
2.4.2. Extraction of Short-Chain Fatty Acids from Fecal Samples
Thirty mg of each fecal sample was weighed off, mixed with 300 µL of deionized water and homogenized for 20 s at 6500 rpm (repeated three times) using a 2000 vortexer. The fecal homogenates were placed on a model shaker (Roller Mixer,) and incubated at 4 °C while shaking for 30 min. This was followed by centrifugation in a CS-A5R Centrifuge at 13,000× g for 30 min. Aliquot (100 µL) of the supernatant was transferred into a 0.6 mL microtube containing 10 µL of 5 M HCl to adjust the pH to approximately 2. Acidified fecal homogenates were extracted with 100 µL of anhydrous diethyl ether (DE) (1:1, v/v), vortexed, and incubated on ice for 5 min, followed by centrifugation at 10,000× g for 5 min. The DE layer containing the extracted SCFAs was transferred into a new microtube containing anhydrous Na2SO4 to remove residual water. The remaining aqueous phase was re-extracted twice with DE, and the combined DE layers were pooled and mixed for subsequent derivatization.
2.4.3. Derivatization of the DE Extract
An aliquot of 100 µL of the pooled DE extract was transferred into a glass insert into a GC vial, followed by the addition of 5 µL of N,O-bis(trimethylsilyl)trifluoroacetamide (BSTFA). The mixture was vortexed for 5 s, tightly capped, and incubated at 70 °C for 20–40 min, at 37 °C for 2 h, or at room temperature (22 °C) overnight (≥8 h). The derivatized extracts were thereafter analyzed using GC–MS.
2.5. GC–MS Analysis of Short-Chain Fatty Acids
Quantitative analysis of SCFAs was performed using a gas chromatograph coupled to a single quadrupole mass spectrometer. The system was equipped with an Agilent 7890B GC, Agilent 7890B MS and an Agilent 7693A autosampler. The injector, ion source, quadrupole, and interface temperatures were maintained at 260, 230, 150, and 280 °C, respectively. Exactly 1 µL aliquot of the derivatized extract was injected in split mode (10:1) with a solvent delay of 3 min. Chromatographic separation was achieved on an HP-5MS capillary column (30 m × 0.25 mm i.d., 0.25 µm film thickness. Helium was used as the carrier gas at a constant flow rate of 1.0 mL/min. The oven temperature was programmed as follows: initial temperature of 40 °C (held for 2 min), increased to 150 °C at 15 °C/min and held for 1 min, then ramped to 300 °C at 30 °C/min and maintained for 5 min. Ionization was performed in electron impact (EI) mode at 70 eV. For SCFA detection, mass spectra were acquired in full scan mode (m/z 40–400) at an acquisition rate of 12.8 scans/s. Data acquisition and processing were performed using Agilent MSD ChemStation E.02.00.493 software. Importantly, a blank sample consisting of deionized water processed identically to the fecal samples was included to correct for background noise and potential contamination. Direct GC–MS analysis may result in low analyte recovery and potential contamination of the GC column due to the presence of impurities. To address these limitations, derivatization using BSTFA was employed to enhance analytical sensitivity and reduce the impact of contaminants. Potential carry-over from previous injections was minimized by introducing a solvent blank (methanol) immediately following high-concentration samples to monitor for residual peaks. In addition, multiple pre- and post-injection syringe washes were performed, with increased wash volumes and wash cycles, to further reduce the risk of carry-over contamination.
2.6. Calibration of Short-Chain Fatty Acids
Working solutions were prepared from the stock solutions (10,000 µg/mL) at the following concentrations: acetic acid [10, 50, 100, 200, 300 and 500 µg/mL], propionic acid [2, 20, 40, 60, 80, and 100 µg/mL], butyric acid [4, 40, 100, 104, 140, and 200 µg/mL], pentanoic/valeric acid [0.4, 4, 8, 12, 16, and 20 µg/mL], hexanoic acid and heptanoic acid [0.01, 0.1, 0.2, 0.3, 0.4, and 0.5 µg/mL] guided by literature [11,12]. Each calibration level was prepared in triplicate by spiking 50 µL of the corresponding working solution. Calibration curves were constructed by plotting the peak areas of the six SCFAs against their respective concentrations. Linearity was assessed across the selected concentration ranges.
3. Statistical Analysis
Data was captured in Microsoft Excel® (Windows version 17, Microsoft Corporation, Redmond, WA, USA) and analysed using Stata version 19.0 (StataCorp LLC, College Station, TX, USA) as well as GraphPad Prism 5 (GraphPad Software, Inc., San Diego, CA, USA). The normality of continuous variables, including SCFA concentrations (propionic, butyric, pentanoic, hexanoic, heptanoic, and acetic acids) and HbA1c levels was assessed using the Shapiro–Wilk test. All variables were non-normally distributed (p < 0.001), consistent with skewed biological distributions; therefore, non-parametric statistical methods were applied.
Between-group comparisons (diabetic vs. non-diabetic participants) were performed using the Mann–Whitney U test, with results presented as medians and interquartile ranges (IQR). Associations between HbA1c and SCFA concentrations were evaluated using Spearman’s rank correlation. Furthermore, multivariable linear regression analyses were conducted to evaluate the independent association between diabetes status and SCFA concentrations while adjusting for potential confounding variables, including age and sex. A p-value of < 0.05 was considered statistically significant.
4. Results
4.1. Demographic and Clinical Characteristics of Participants Stratified by Diabetes Status
Table 1 summarizes the demographic and baseline clinical characteristics of the 140 participants, comprising n = 92 non-diabetic and n = 48 with T2DM. When the study population was stratified by diabetes status, the diabetic group was found to be significantly older than the non-diabetic group (54.6 vs. 36.9 years, p < 0.001). There was a slightly higher representation of females in both groups, with 62.5% (n = 30) in the diabetic group and 59.8% (n = 55) in the non-diabetic group. However, no significant difference in gender distribution was observed between the groups (p = 0.732). The geographical distribution of participants showed that the majority of both diabetic and non-diabetic individuals were recruited from Ga-Rankuwa. In the diabetic group, 50% (n = 24) of participants were from Ga-Rankuwa, followed by Soshanguve 31.25% (n = 15) and Mabopane 12.5% (n = 6). Similarly, in the non-diabetic group, most participants were from Ga-Rankuwa (71.71%; n = 66), with fewer from Soshanguve (17.39%; n = 16) and Mabopane (5.43%; n = 5). Among individuals with T2DM, 47.9% (n = 23) were receiving metformin monotherapy, 25% (n = 12) were on insulin, and 14.6% (n = 7) were receiving a combination of metformin and insulin, while 12.5% (n = 6) did not disclose their treatment regimen. The results further showed that the median HbA1c level was significantly higher in diabetic participants (8.3%) than in non-diabetic individuals (5.3%) (p < 0.001).
Table 1.
Demographic and baseline clinical characteristics of the study participants.
4.2. Linearity Assessment of SCFA Calibration Curves and Analytical Performance
The analytical method demonstrated good linearity for all SCFAs across their respective concentration ranges. The calibration curves showed strong coefficients of determination (R2 > 0.99) for all analytes, indicating excellent linear relationships between concentration and detector response. Acetic acid showed linearity over a range of 10–500 µg/mL with an R2 of 0.9917, while propionic acid showed linearity from 2 to 100 µg/mL (R2 = 0.9956). Butyric acid and pentanoic/valeric acid also demonstrated strong linearity (R2 = 0.9975 and 0.9978, respectively). Similarly, hexanoic acid and heptanoic acid showed good linearity within lower concentration ranges (0.01–0.4 µg/mL) with R2 values of 0.9937 for both compounds (Table 2).
Table 2.
Summary of SCFAs identified at different retention times with their quantification ions.
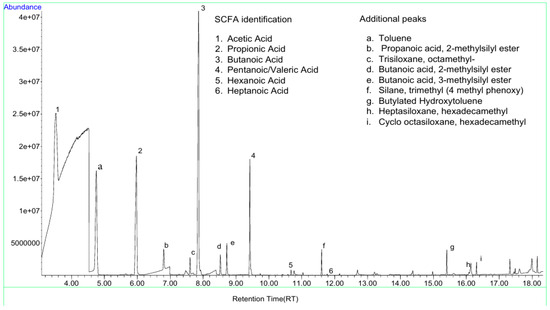
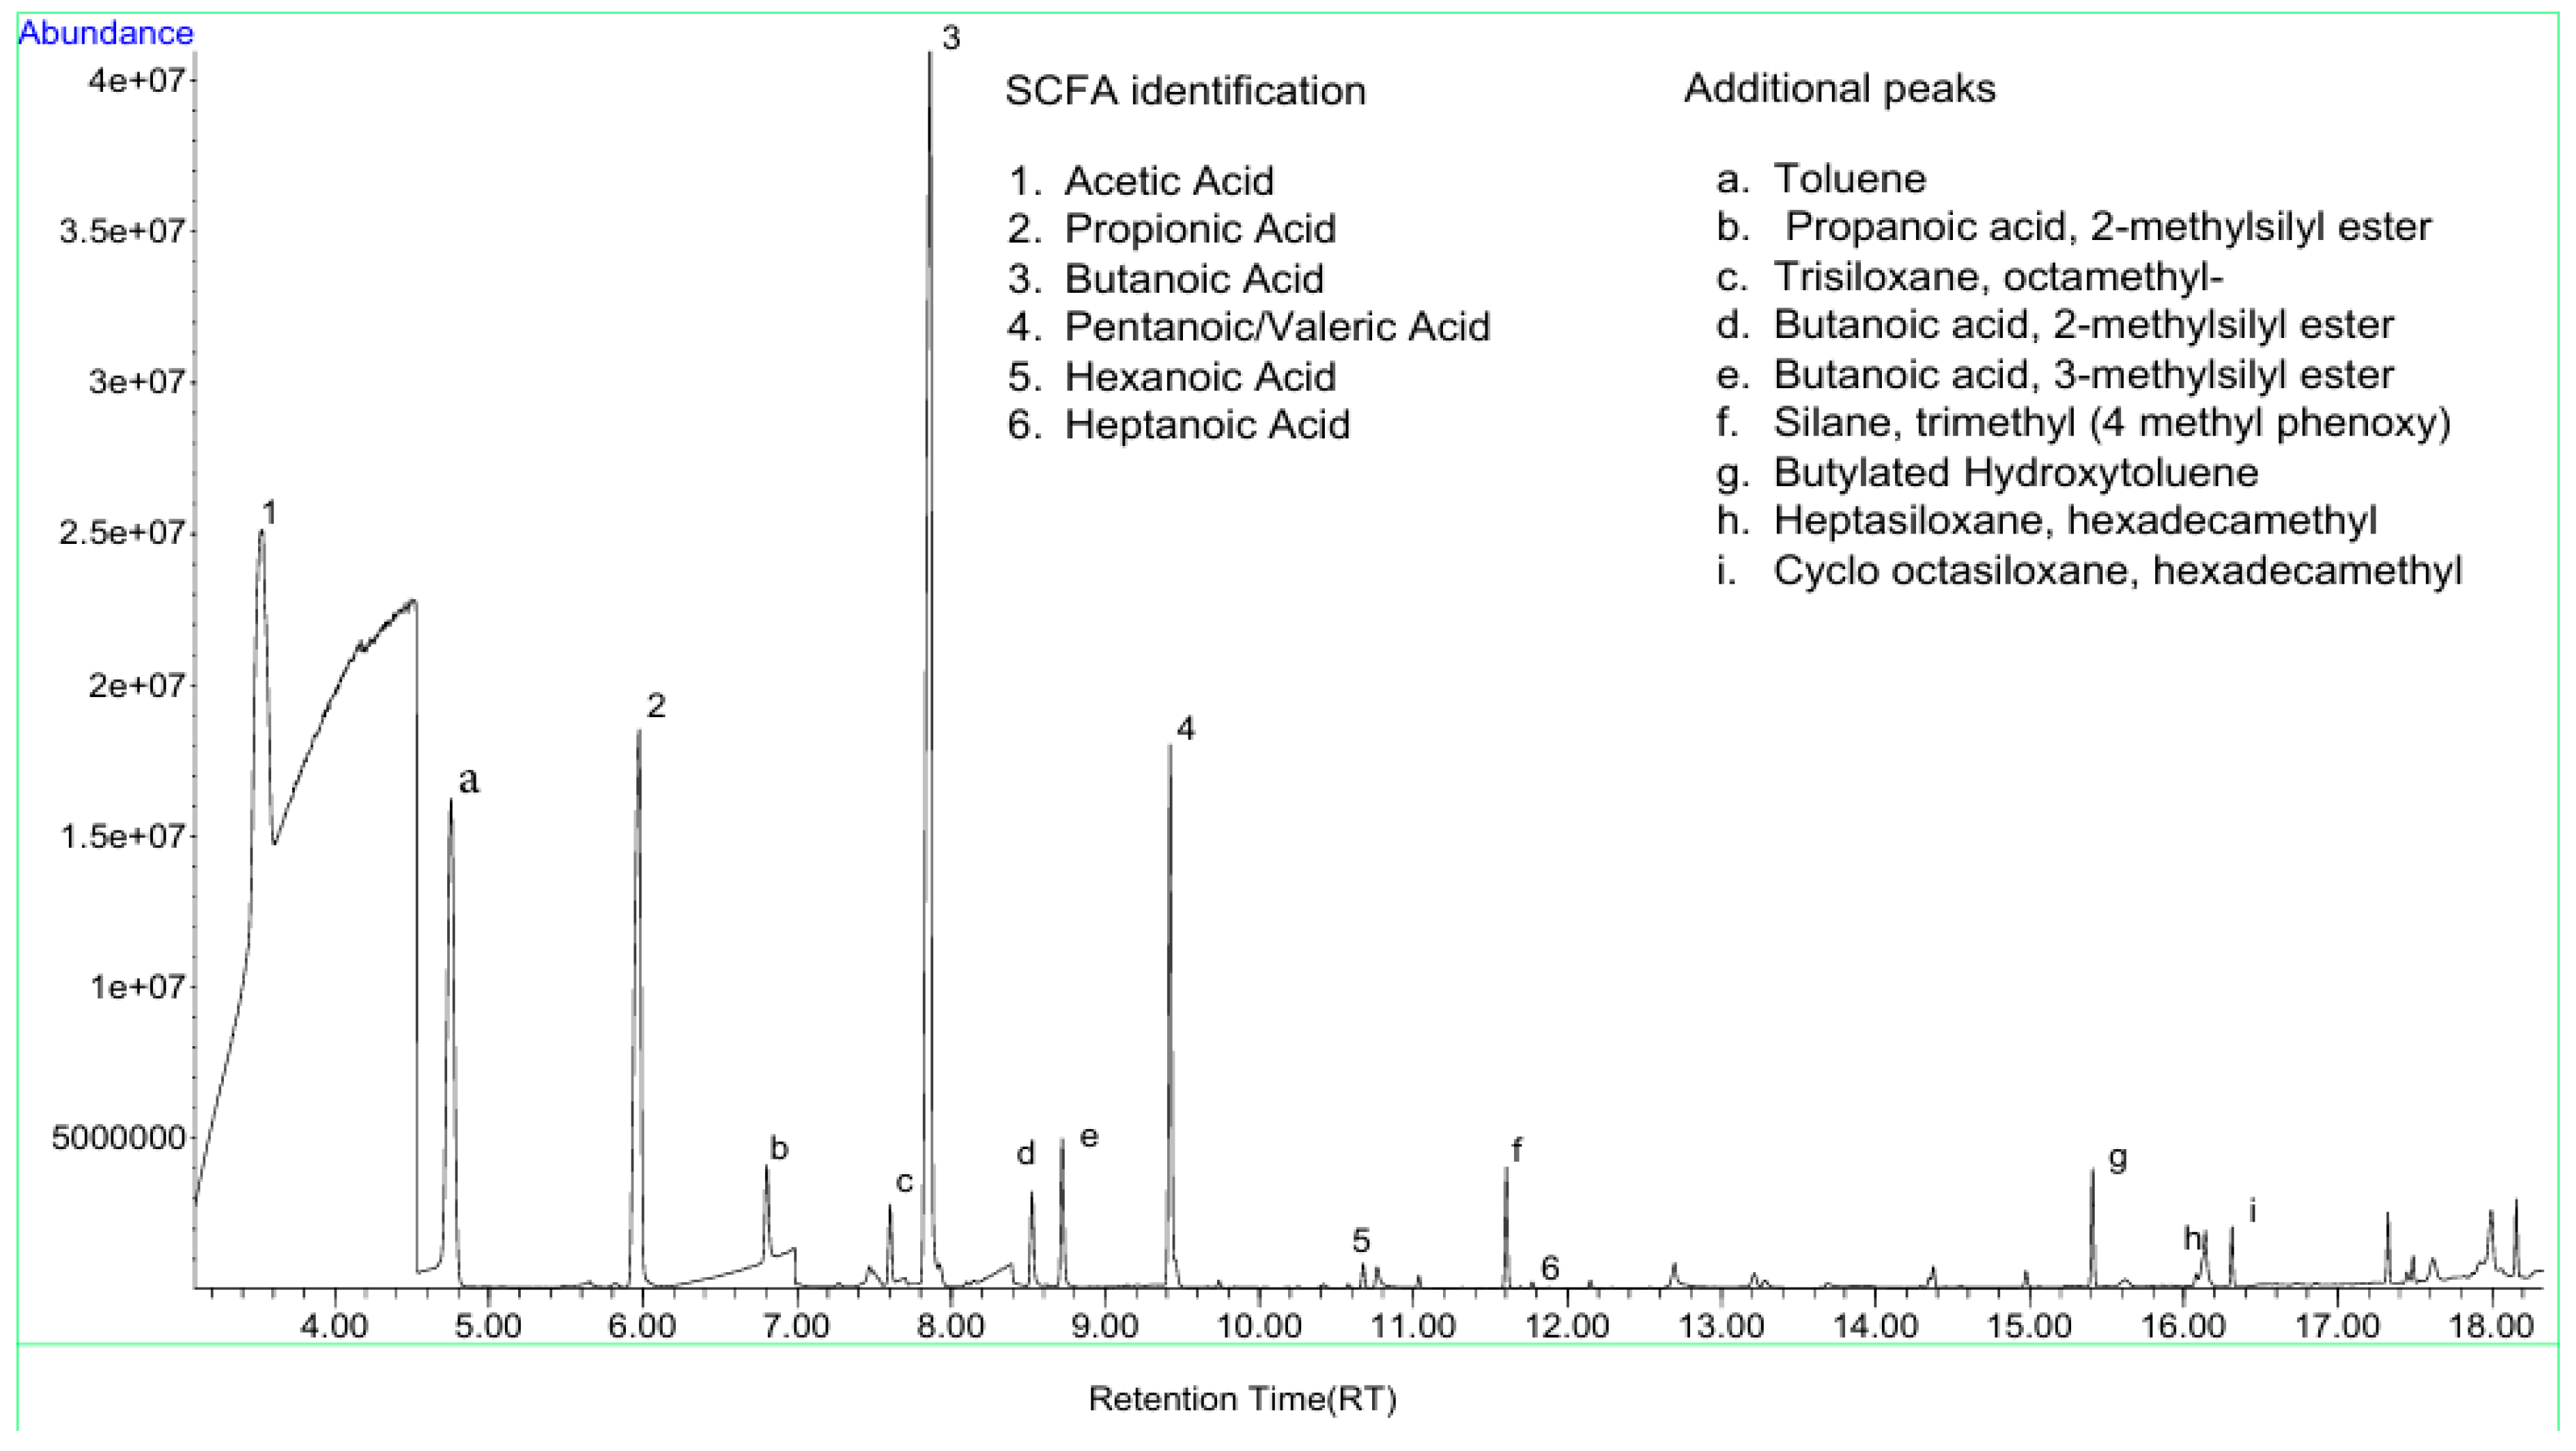
The GC–MS chromatogram demonstrated successful separation and detection of SCFAs within the analysed samples. Six peaks corresponding to SCFAs were identified based on their retention times and mass spectra. The peaks were assigned as follows: acetic acid (RT ≈ 3.6 min), propionic acid (RT ≈ 6.1 min), butyric acid (RT ≈ 7.9 min), pentanoic/valeric acid (RT ≈ 9.5 min), hexanoic acid (RT ≈ 10.7 min), and heptanoic acid (RT ≈ 11.8 min) (Table 2 and Figure 1). Mass-to-charge ratios (m/z) used for identification were 117, 131, 145, 159, 173, and 187 for acetic, propionic, butyric, pentanoic/valeric, hexanoic, and heptanoic acids, respectively (Table 2).
Figure 1.
Chromatographic identification of six SCFAs (1–6), with each compound represented by a distinct peak of interest. Additional peaks (a–i) were also identified on the chromatogram. The chromatographic separation was adequate, with well-resolved peaks and minimal overlap between adjacent compounds, confirming the suitability of the method for SCFA profiling. Butyric acid (3) exhibited the highest peak intensity, indicating a relatively higher abundance compared to other SCFAs. In contrast, hexanoic (5) and heptanoic (6) acids showed lower signal intensities.
Except for heptanoic acid (42%), the recovery values of the analytes ranged from 73% to 123%, indicating generally acceptable extraction efficiency across the analytes. However, acetic acid showed a slightly elevated recovery (123%), exceeding the upper limit, while butyric acid demonstrated a lower recovery (75%), falling at the lower boundary of acceptability. Notably, precision, expressed as the coefficient of variation (CV%), varied among the analytes, ranging from 9.2% to 37.2%. Propionic acid exhibited good reproducibility (CV = 9.2%), whereas butyric acid (22.1%) and particularly pentanoic (valeric) acid (37.2%) showed higher variability, indicating poor precision and less reliable reproducibility. CV’s for hexanoic acid and heptanoic acid could not be determined due to the lack of duplicate results for any of the control levels (Table 2 and Supplementary Table S1).
4.3. SCFAs Concentration Profiles in Diabetic and Non-Diabetic Participants
Fecal short-chain fatty acid concentrations were quantified and compared between non-diabetic (n = 92) and diabetic (n = 48) participants, with results presented as median (IQR). Overall, SCFA levels were consistently higher in the diabetic group compared to the non-diabetic group.
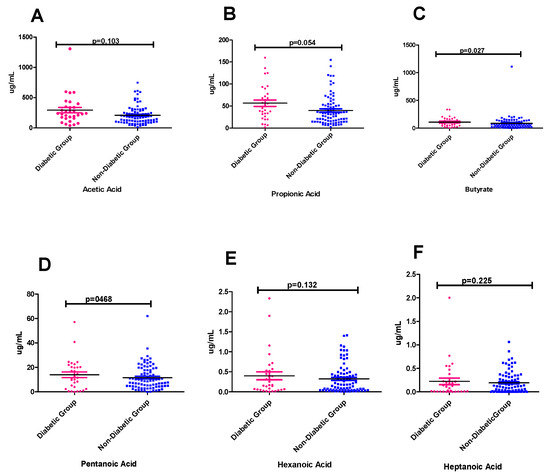
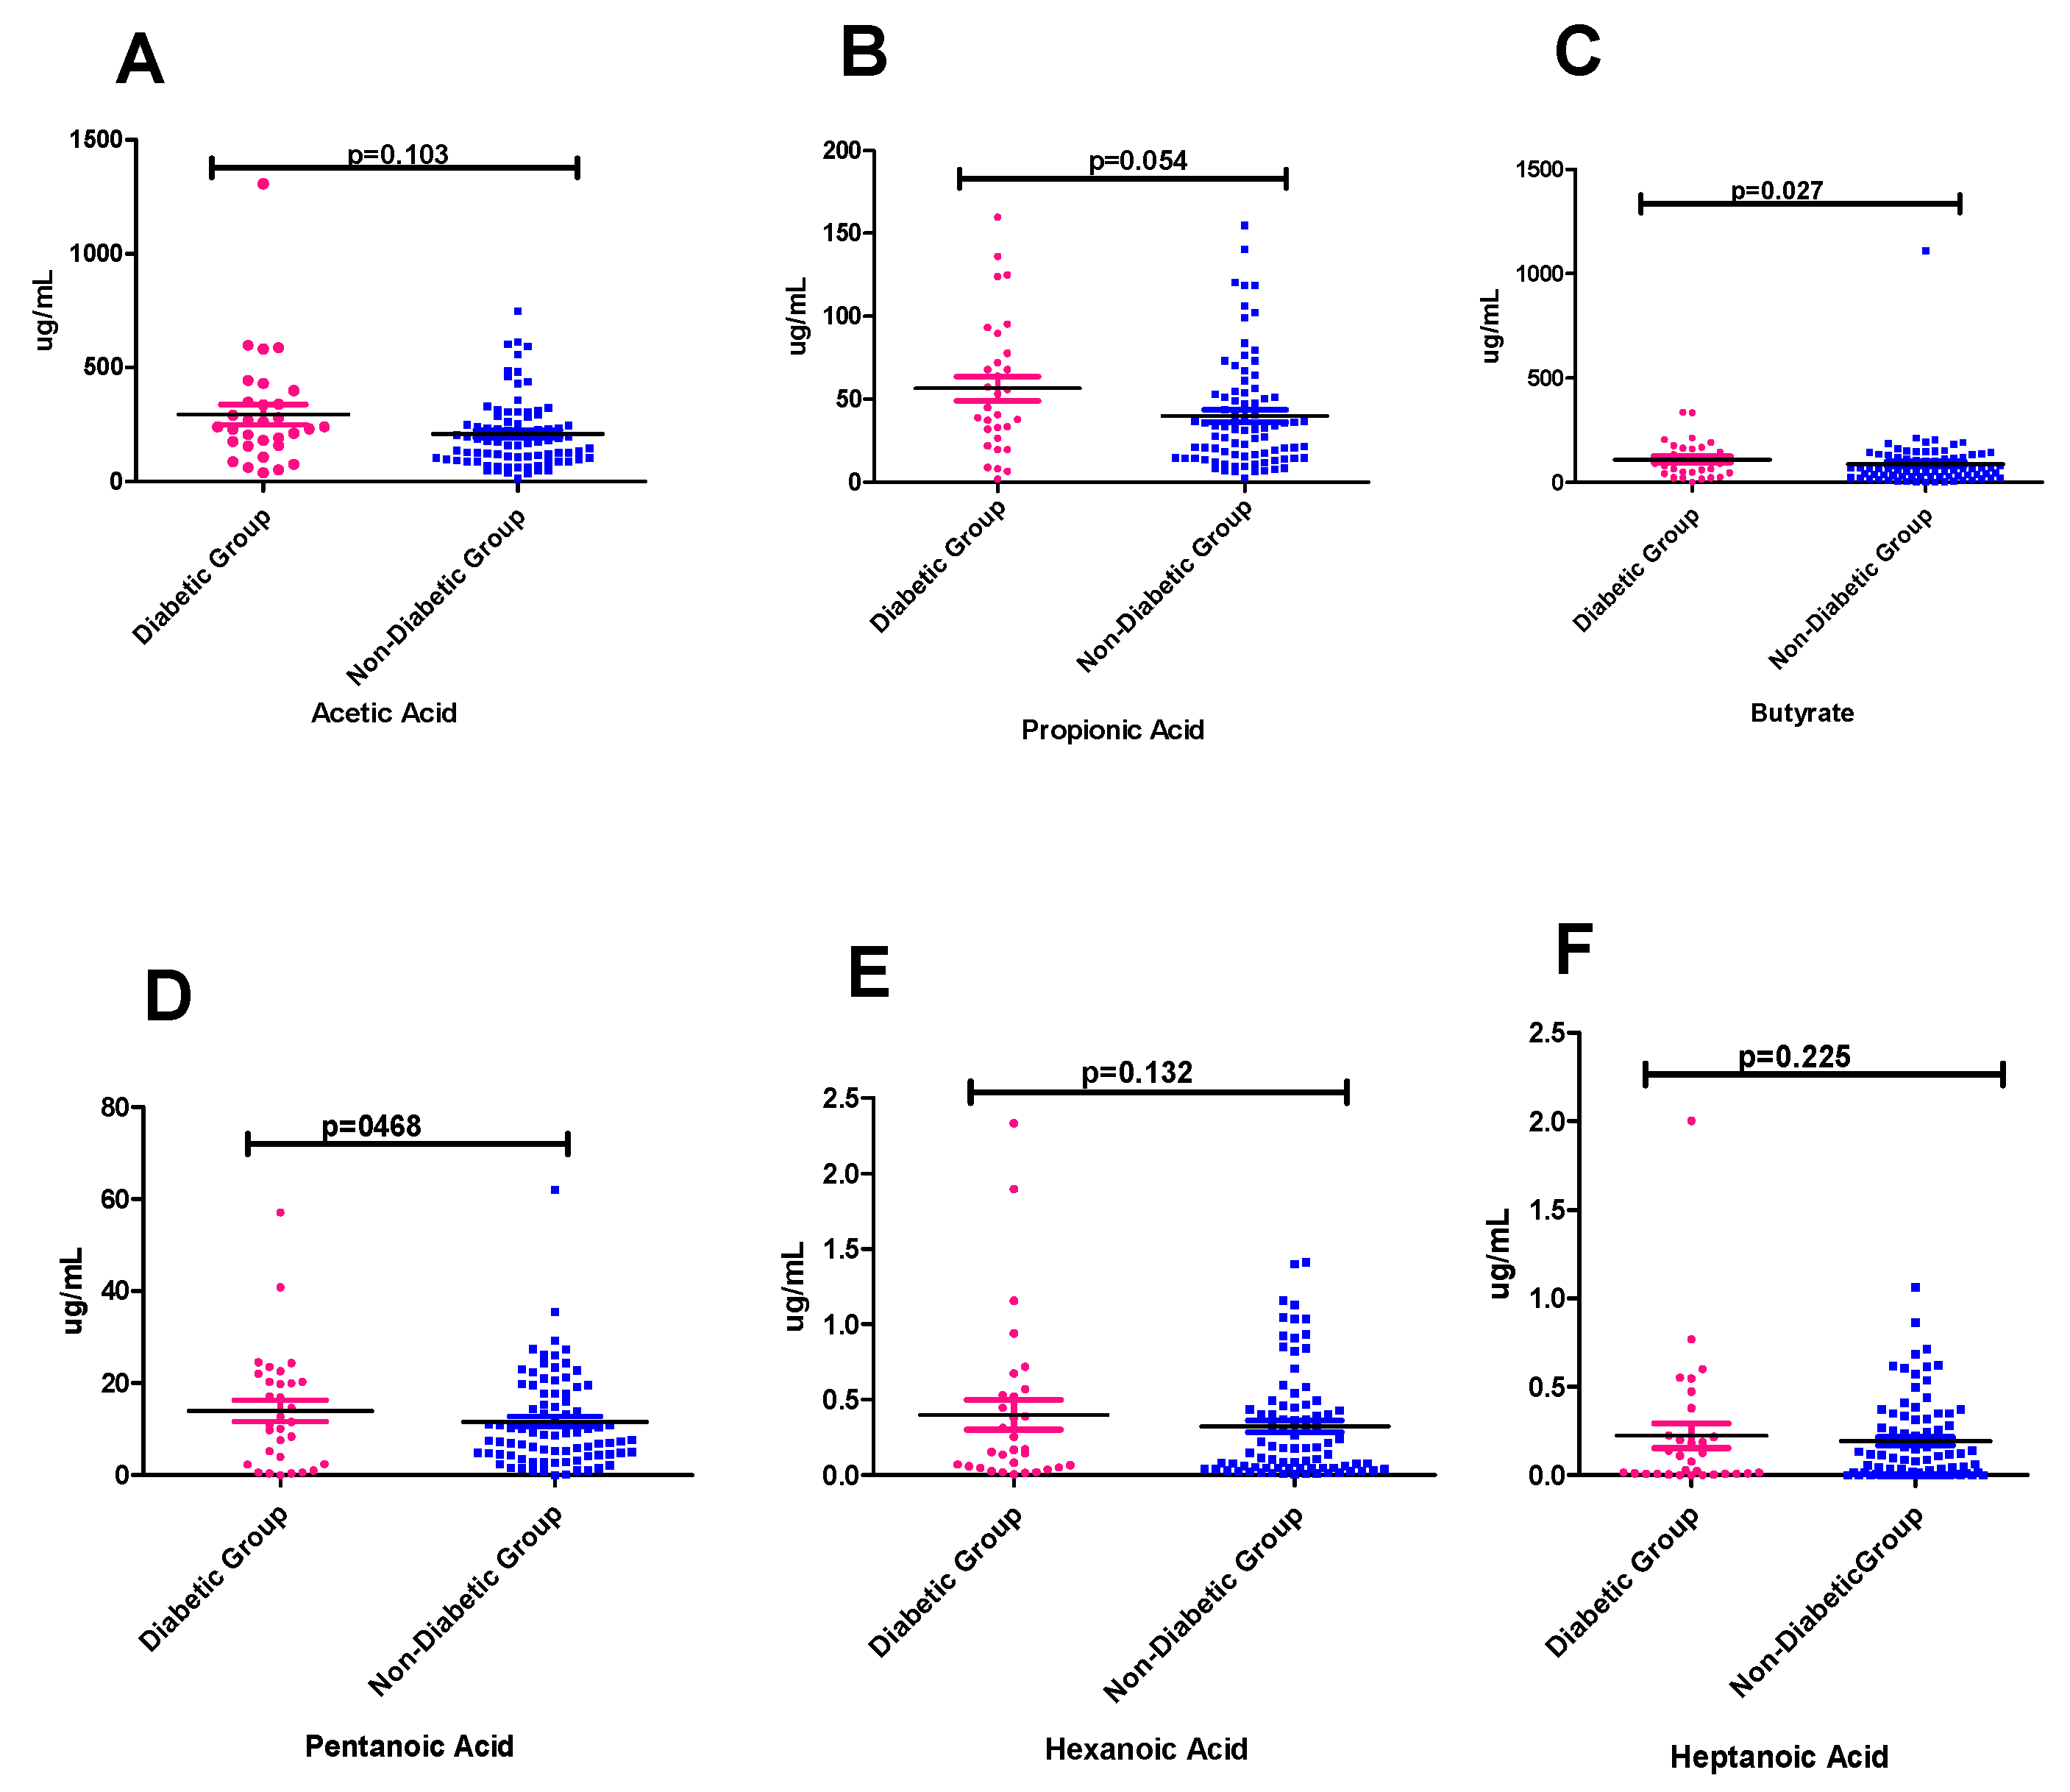
Notably, acetic acid was the predominant SCFA in both groups, with higher median concentrations observed in the diabetic group (229.78 µg/mL) compared to the non-diabetic group (174.17 µg/mL). Butyric acid was the second most abundant SCFA, with higher median concentrations in the diabetic group (83.96 µg/mL) than in the non-diabetic group (62.12 µg/mL). Similarly, propionic acid concentrations were modestly elevated in the diabetic group (41.53 µg/mL) compared to the non-diabetic group (31.85 µg/mL). No statistically significant differences were observed between the two groups for acetic acid (p = 0.103) and propionic acid (p = 0.054). However, butyric acid showed a statistically significant difference between the groups (p = 0.027) (Table 3).
Table 3.
Comparison of fecal SCFA concentrations between Diabetic and Non-Diabetic Groups.
Interestingly, the remaining SCFAs, including pentanoic (valeric), hexanoic, and heptanoic acids, were detected at substantially lower concentrations (<15 µg/mL) in both groups, with no statistically significant differences observed (p > 0.05 for all), despite slightly higher median values in the diabetic group (Table 3). Figure 2 presents scatter plots of individual concentrations (µg/mL) of (A) acetic acid, (B) propionic acid, (C) butyric acid, (D) pentanoic acid, and (E) hexanoic acid in the diabetic and non-diabetic groups.
Figure 2.
The individual concentrations (µg/mL) of acetic (A), propionic (B), butyric (C), pentanoic (D), hexanoic (E), and heptanoic (F) acids. Points are color-coded: pink for the diabetic group and blue for the non-diabetic group. Among all the measured SCFAs, only butyric acid (C) showed a statistically significant difference between the groups (p < 0.05). The black horizontal line represents the mean (average) of all the values in that group.
4.4. Association Between Fecal SCFAs Concentrations and HbA1c Levels
Correlation analysis between HbA1c and fecal SCFAs demonstrated contrasting directional trends between non-diabetic and diabetic groups; however, all associations were weak and not statistically significant (Table 4).
Table 4.
Association between HbA1c and fecal SCFAs by diabetic status.
Among the non-diabetic group, HbA1c showed weak negative correlations with all measured SCFAs, though none of these associations were statistically significant (Table 4). The strongest association was with pentanoic/valeric acid (ρ = −0.17, p = 0.101), followed by hexanoic (ρ = −0.13, p = 0.216), acetic (ρ = −0.12, p = 0.252), heptanoic (ρ = −0.09, p = 0.420), butyric (ρ = −0.06, p = 0.581), and propionic (ρ = −0.04, p = 0.739) acids.
In contrast, the diabetic group showed weak positive correlations between HbA1c and most SCFAs, representing a novel divergence from non-diabetic patterns, with acetic acid as the sole exception, which remained negligible and slightly negative (ρ = −0.03, p = 0.849). Associations included hexanoic (ρ = 0.18, p = 0.236) and heptanoic (ρ = 0.17, p = 0.247) acids, pentanoic/valeric (ρ = 0.10, p = 0.516), butyric (ρ = 0.07, p = 0.652), propionic (ρ = 0.04, p = 0.766). Similarly to the non-diabetic group, none of these associations were statistically significant (Table 4).
4.5. Differential Associations of Age and Gender with SCFA Concentrations
Multivariable linear regression analyses were performed to evaluate the association between diabetes status and fecal SCFA concentrations after adjusting for the potential confounding effects of age and sex. After adjustment, age was a significant predictor of propionic acid concentrations (β = 0.562, p = 0.016), indicating a positive association between increasing age and propionic acid levels. However, no significant associations were observed between age and the remaining SCFAs. Gender was not significantly associated with SCFA concentrations in any of the models (p > 0.05). The overall regression model was statistically significant only for propionic acid (p = 0.0401), whereas all other models were not significant. Notably, the R2 values were low across all SCFAs, suggesting that age and gender explain only a small proportion of the variability in SCFA concentrations (0.002 to 0.046) (Table 5).
Table 5.
Multiple linear regression analysis showing the effects of Age and Gender on SCFA concentrations.
5. Discussion
This study provides a comprehensive characterization of fecal SCFAs profiles in individuals with T2DM and non-diabetic controls using BSTFA derivatization coupled with GC–MS analysis. By integrating analytical validation, metabolic profiling, glycaemic associations and demographic stratification, the current findings contribute novel insight into the complex and context-dependent relationship between SCFAs and diabetes.
In this study, fecal SCFAs were successfully quantified using GC–MS. Three major straight-chain SCFAs, including acetic, propionic, and butyric acids were identified and quantified, together with branched-chain fatty acids, including pentanoic (valeric), hexanoic, and heptanoic acids (Figure 1). The predominant SCFAs (acetic, propionic, and butyric acids) were consistently detected at higher levels, followed by pentanoic/valeric, hexanoic, and heptanoic acids. The findings of the current study are comparable to those reported by Zhang et al., 2019 who employed a similar GC–MS-based analytical approach and observed a comparable SCFA profile [10]. Although the overall chromatographic patterns were consistent with their report, slight differences in retention times were observed across the identified peaks. These variations may be attributed to methodological differences, including sample preparation procedures, the type of derivatization reagent used, chromatographic conditions, or variations in sample processing time. The coefficients of variation (CVs) for butyric acid (22.1%) and pentanoic (valeric) acid (37.2%) in this study indicate comparatively poor precision, particularly for pentanoic acid. Additionally, the recovery for heptanoic acid varied between 34.08% and 42.10%. This increased variability is likely attributable to the relatively low concentrations of these analytes, as measurements near the lower limit of quantification are inherently less stable; small absolute fluctuations in detector response can result in large relative differences, thereby inflating the CV.
In addition, variability in extraction efficiency and sample preparation may have contributed to the observed imprecision. Due to their longer carbon chains, butyric and pentanoic acids may exhibit less consistent recovery, influenced by differences in volatility, solubility, and partitioning behaviour during extraction. These findings are consistent with those reported by Kruger et al. (2024), who observed a CV of 27.8% for butyric acid and values below 30% for valeric acid [13]. Their study also demonstrated substantial variability in fecal SCFA concentrations despite stable pH conditions, with minor acids generally showing the lowest precision. This was further reflected in the high CV of 27.4% reported for total branched-chain fatty acids (including valeric acid derivatives) and an overall SCFA variability of 17.2% [13]. In contrast, Smith et al. (2023) reported improved reproducibility using a validated GC–MS method, with inter-day precision (%RSD) ranging between 3% and 10% [14]. This enhanced precision was attributed to optimized storage conditions and more efficient extraction protocols. However, even in that study, valeric and isovaleric acids occasionally exceeded 20% CV, likely due to their lower concentrations, reinforcing the inherent analytical challenges associated with minor SCFAs [14].
When fecal SCFA profiles were compared between participants with and without T2DM, acetic acid was the most abundant metabolite in both groups, with slightly higher median concentrations (174.17 µg/mL) in the diabetic group. This is consistent with its established role as the principal end-product of gut microbial carbohydrate fermentation, reflecting its central contribution to host energy metabolism and microbial ecosystem output [15]. Butyric acid was the second most abundant SCFA and was present at significantly higher concentrations in the diabetic group (83.96 µg/mL) than in the non-diabetic group (62.12 µg/mL). This finding is noteworthy because butyrate production is primarily attributed to key gut commensals, including Faecalibacterium prausnitzii and Roseburia spp., which are typically depleted in individuals with T2DM. Butyrate plays a critical role in colonic energy metabolism, maintaining intestinal epithelial barrier integrity, and regulating anti-inflammatory signaling. Therefore, the elevated butyrate concentrations observed in the diabetic group may indicate preserved or compensatory butyrogenic activity despite disease-associated alterations in the gut microbiota. Possible explanations include selective preservation of butyrate-producing pathways, enhanced microbial cross-feeding interactions, or modulation by external factors such as dietary intake, glucose-lowering medications (e.g., metformin), and population-specific gut microbiome characteristics [16,17].
The study compared fecal SCFA profiles between individuals with T2DM recruited from a hospital setting and non-diabetic community participants. The recruitment approach reflects the greater accessibility of community-based volunteers relative to eligible hospital-based patients with T2DM. Although this resulted in unequal group sizes, the statistical methods used were appropriate for handling moderate sample size imbalances following assessment of the underlying analytical assumptions. While the smaller T2DM group may have reduced statistical power to detect subtle differences, significant variations in fecal SCFA concentrations were still identified, suggesting that the study was sufficiently powered to detect biologically meaningful effects. Participant recruitment was predominantly concentrated in Ga-Rankuwa (presumably because of the proximity between Ga-Rankuwa and Dr GMAH), accounting for 50% (n = 24) of diabetic and 71.71% (n = 66) of non-diabetic participants, with smaller representation from Soshanguve and Mabopane. This geographic concentration highlights the study’s strong relevance to local, high-burden communities, but may limit the generalizability of the findings to broader or more diverse populations, a common limitation in South African cohort studies.
Furthermore, stratification by diabetes status, age, and gender in this study showed that participants with T2DM were significantly older than non-diabetic individuals (median 57 vs. 37.5 years), reinforcing the well-established role of ageing as a key risk factor for diabetes development. This finding is consistent with regional and international evidence showing higher diabetes prevalence in older populations, driven by progressive insulin resistance, β-cell dysfunction, and cumulative exposure to metabolic risk factors [18,19,20,21]. In contrast, gender distribution was comparable between groups, with a slight female predominance in both groups, likely reflecting higher healthcare engagement and study participation among women [22].
After adjusting for age and sex using multivariable linear regression analysis, age was significantly associated only with propionic acid levels (β = 0.562, p = 0.016), while no significant associations were observed between age and the other SCFAs. This selective association may reflect age-related alterations in propionate-producing microbial taxa or shifts in gut metabolic activity. Notably, the apparent discrepancy between the unadjusted analysis (p = 0.027) and the adjusted regression model (p = 0.8679) for butyric acid is likely attributable to confounding by baseline covariates, particularly age and sex. Although the unadjusted analysis demonstrated significantly higher butyric acid concentrations in participants with T2DM, this association was no longer significant after adjustment for age and sex, indicating that diabetes status was not an independent predictor of butyric acid concentrations. Rather, the crude difference observed between the groups may have been influenced by baseline demographic differences. However, the overall lack of consistent age effects across SCFAs suggests that microbial and environmental factors likely outweigh chronological age in shaping SCFA profiles. Similarly, gender showed no significant association with any SCFA, despite evidence elsewhere of sex-related microbiome differences that may be context-dependent. Importantly, the very low explanatory power of the models (R2 = 0.002–0.046) indicates that age and sex collectively account for only a minimal proportion of SCFA variability. These findings support the notion that SCFA production is primarily driven by gut microbiota composition, dietary fibre intake, medication use (particularly metformin), and overall metabolic status rather than demographic factors alone [23,24].
Based on the clinical profile, including therapeutic stratification of the diabetic cohort and the evaluation of associations between fecal SCFA concentrations and HbA1c in both groups, treatment patterns within the diabetic group indicated that 47.9% of participants were on metformin monotherapy, 25% on insulin, and 14.6% on combined metformin–insulin therapy. This reflects standard clinical guidelines, where metformin is the recommended first-line therapy for T2DM [25]. The treatment pattern is also consistent with typical public healthcare practice in South Africa, where oral medications are widely used due to cost and accessibility [26,27]. However, the relatively high use of insulin suggests that a proportion of patients may have more advanced disease or poorer glycaemic control, possibly linked to late diagnosis in peri-urban communities [28]. Metformin has been widely reported to modify gut microbiota composition by enriching SCFA-producing bacterial taxa and enhancing microbial fermentation, thereby influencing fecal SCFA concentrations independently of diabetes status [25]. Consequently, the relatively high proportion of participants receiving metformin therapy may partly explain the unexpectedly higher fecal SCFA concentrations observed in the T2DM group in the present study. This possibility should therefore be considered when interpreting the observed differences between diabetic and non-diabetic participants. Although medication use was documented, subgroup analyses by treatment category were not performed because the small sample sizes within each treatment group limited the statistical power to detect meaningful differences in fecal SCFA concentrations. In addition, other important determinants of gut microbial metabolism, including body mass index (BMI) and dietary fibre intake, were not systematically collected and could not be included in the statistical analyses. Therefore, future studies with larger sample sizes should conduct treatment-specific subgroup analyses and incorporate comprehensive dietary assessments, BMI, and detailed medication histories to better distinguish the effects of diabetes from those of pharmacological therapy on gut microbiota composition and SCFA production.
Consistent with this clinical profile, glycaemic control was markedly poorer in the diabetic group, as evidenced by significantly elevated HbA1c levels compared to non-diabetic participants (8.3% vs. 5.3%, p < 0.001). Within this framework, the relationship between fecal SCFAs and HbA1c showed divergent, though non-significant, patterns across groups. In the non-diabetic group, SCFAs showed weak inverse correlations with HbA1c, suggesting a trend whereby higher SCFA concentrations may be associated with improved glycaemic regulation. This directionality is biologically plausible, given the established role of SCFAs in enhancing insulin sensitivity, stimulating GLP-1 secretion, and modulating inflammatory pathways. Despite this, none of the observed associations attained statistical significance (p > 0.05), consistent with findings from previous studies, indicating that these trends may reflect subtle physiological variation rather than robust metabolic relationships [29,30]. Among the SCFAs, pentanoic (valeric) acid showed the strongest, although still non-significant, inverse correlation, supporting emerging evidence that less-studied SCFAs may contribute to glucose homeostasis through complementary metabolic pathways.
In contrast, the diabetic group demonstrated a shift toward weak positive correlations between SCFAs and HbA1c, implying that higher SCFA levels may coincide with poorer glycaemic control in this group. Although these associations were also non-significant, this directional reversal is noteworthy and may reflect underlying metabolic dysregulation characteristics of T2DM, including altered gut microbiota composition, impaired SCFA utilisation, or reduced host responsiveness to SCFA signalling. Supporting this interpretation, previous studies have reported positive associations between fecal SCFAs and glycaemic indices in metabolically compromised populations, suggesting that elevated SCFAs in such contexts may represent a compensatory response or a marker of disrupted microbial-host interactions rather than a protective effect [31,32].
Limitations
This study has several limitations. First, samples were not analyzed immediately after derivatization, and complete prevention of diethyl ether (DE) evaporation during extraction could not be ensured. This may have impacted short-chain fatty acid (SCFA) quantification, particularly for low-abundance metabolites (e.g., hexanoic and heptanoic acids), potentially causing underestimation or increased variability. Second, comprehensive dietary and BMI data were not available for all participants, limiting the ability to assess the influence of diet, adiposity, and other lifestyle factors on fecal SCFA concentrations. Furthermore, because participants with T2DM were recruited from a hospital clinic whereas controls were recruited from the surrounding community, unmeasured differences between the groups may have contributed to the observed variations in fecal SCFA concentrations. Therefore, residual confounding cannot be excluded when interpreting the findings. Third, the unequal sample sizes between the non-diabetic and T2DM groups resulted from the availability of eligible participants during recruitment and may have influenced statistical power and variance estimates. Although statistical methods appropriate for unequal group sizes were applied, the findings should be interpreted with caution, and future studies with larger and more balanced cohorts are recommended to validate these observations. Lastly, all participants in this study were black South Africans, limiting the generalizability of the findings to other racial and ethnic groups in South Africa.
6. Conclusions
This study provides a robust analytical and clinical characterization of fecal SCFA profiles in individuals with T2DM and non-diabetic controls within a South African cohort. Using BSTFA derivatization coupled with GC–MS, both major (acetic, propionic, and butyric acids) and minor SCFAs were reliably quantified, confirming the method’s suitability for comprehensive metabolite profiling. While the concentrations of most SCFA remained comparable between the study groups, a significant difference was observed for butyric acid, which was elevated in the T2DM cohort. This finding suggests that, although the overall SCFA profile appeared relatively stable, butyrate metabolism may be altered in individuals with T2DM and warrants further investigation.
Importantly, the lack of significant associations between fecal SCFAs and HbA1c, alongside weak and directionally divergent correlation trends, indicates that fecal SCFA concentrations alone may not serve as reliable biomarkers of glycaemic control. Rather, these metabolites likely reflect a complex interplay between gut microbiota composition, host metabolism, and external modifiers such as diet and pharmacotherapy.
The findings of this study extend beyond describing SCFA concentrations and underscore the potential clinical and public health relevance of gut microbial metabolites in T2DM. Fecal SCFAs may serve as promising non-invasive biomarkers of metabolic health, while interventions designed to modulate SCFA production through diet or microbiota-targeted approaches could represent future strategies for T2DM management. These results also contribute valuable evidence from an underrepresented South African population, supporting the development of locally relevant approaches to diabetes prevention and care.
Building on these findings, future studies should incorporate dietary profiling, microbial compositional analysis, and longitudinal designs to better elucidate the functional role of SCFAs in T2DM pathophysiology, particularly in underrepresented African populations.
Supplementary Materials
The following supporting information can be downloaded at: https://www.mdpi.com/article/10.3390/diabetology7080142/s1, Supplementary Table S1: Summary of percentage recovery per each SCFA.
Author Contributions
S.K., Z.D., L.B., P.M., L.S. and S.M.P. have contributed to the conceptualization, review, and editing of this manuscript in preparation for submission. All authors have read and agreed to the published version of the manuscript.
Funding
This research was funded by the National Research Foundation (NRF) under Grant No. MND200716544246.
Institutional Review Board Statement
The study was conducted in accordance with the principles of the Declaration of Helsinki and was approved by the Sefako Makgatho Health Sciences University Research Ethics Committee (SMUREC) (Reference No. SMUREC/M/321/2022: PG). Ethical approval was initially granted under this reference, and continuation of the study was subsequently approved by SMUREC on 14 March 2024 and 2 October 2025.
Informed Consent Statement
Informed consent was sought from all study participants after an explanation of the purpose of the study, the significance of the study and the rights of the participant using suitable language.
Data Availability Statement
The original contributions presented in this study are included in the article. Additional data supporting the findings of this study are available from the corresponding author upon reasonable request.
Acknowledgments
We would like to acknowledge and thank the National Research Foundation (NRF) for their funding support during the journey towards the Master’s degree. We would also like to acknowledge that the degree from which this manuscript originated was supported by the Sefako Makgatho Health Sciences University, the Chemical Pathology Department. During the preparation of this manuscript/study the author(s) used [Quillbot Paraphrasing tool] for the purposes of [grammar and spell checker, editing and language-improvement, and language translation]. The authors have reviewed and edited the output and take full responsibility for the content of this publication.
Conflicts of Interest
The authors declare no conflicts of interest.
References
- Zheng, Y.; Ley, S.H.; Hu, F.B. Global aetiology and epidemiology of type 2 diabetes mellitus and its complications. Nat. Rev. Endocrinol. 2018, 14, 88–98. [Google Scholar] [PubMed]
- Cho, N.H.; Shaw, J.E.; Karuranga, S.; Huang, Y.; da Rocha Fernandes, J.D.; Ohlrogge, A.W.; Malanda, B.I. IDF Diabetes Atlas: Global estimates of diabetes prevalence for 2017 and projections for 2045. Diabetes Res. Clin. Pract. 2018, 138, 271–281. [Google Scholar] [CrossRef] [Scilit] [PubMed]
- Goedecke, J.H.; Mendham, A.E. Pathophysiology of type 2 diabetes in sub-Saharan Africans. Diabetologia 2022, 65, 1967–1980. [Google Scholar] [CrossRef] [Scilit] [PubMed]
- House, I.; Street, K. Mid-Year Population Estimates; Statistics South Africa: Pretoria, South Africa, 2017. [Google Scholar]
- Mutyambizi, C.; Booysen, F.; Stokes, A.; Pavlova, M.; Groot, W. Lifestyle and socio-economic inequalities in diabetes prevalence in South Africa: A decomposition analysis. PLoS ONE 2019, 14, e0211208. [Google Scholar] [CrossRef] [Scilit] [PubMed]
- Li, M.; Wang, J.; Wang, F.; Strappe, P.; Liu, W.; Zheng, J.; Zhou, Z.; Zhang, Y. Microbiota fermentation characteristics of acylated starches and the regulation mechanism of short-chain fatty acids on hepatic steatosis. Food Funct. 2021, 12, 8659–8668. [Google Scholar] [CrossRef] [Scilit] [PubMed]
- Cong, J.; Zhou, P.; Zhang, R. Intestinal Microbiota-Derived Short Chain Fatty Acids in Host Health and Disease. Nutrients 2022, 14, 1977. [Google Scholar] [CrossRef] [Scilit] [PubMed]
- Primec, M.; Micetic-Turk, D.; Langerholc, T. Analysis of short chain fatty acids in human feces: A scoping review. Anal. Biochem. 2017, 526, 9−21. [Google Scholar] [CrossRef] [Scilit]
- Czarnowski, P.; Mikula, M.; Ostrowski, J.; Żeber-Lubecka, N. Gas chromatography–mass spectrometry-based analyses of fecal short-chain fatty acids (SCFAs): A summary review and own experience. Biomedicines 2024, 12, 1904. [Google Scholar] [CrossRef] [Scilit] [PubMed]
- Zhang, S.; Wang, H.; Zhu, M.J. A sensitive GC/MS detection method for analyzing microbial metabolites short chain fatty acids in fecal and serum samples. Talanta 2019, 196, 249–254. [Google Scholar] [CrossRef] [Scilit] [PubMed]
- Kim, K.S.; Lee, Y.; Chae, W.; Cho, J.Y. An improved method to quantify short-chain fatty acids in biological samples using gas chromatography–mass spectrometry. Metabolites 2022, 12, 525. [Google Scholar] [CrossRef] [Scilit] [PubMed]
- Fu, Z.; Jia, Q.; Zhang, H.; Kang, L.; Sun, X.; Zhang, M.; Wang, Y.; Hu, P. Simultaneous quantification of eleven short-chain fatty acids by derivatization and solid phase microextraction-Gas chromatography tandem mass spectrometry. J. Chromatogr. A 2022, 1661, 462680. [Google Scholar] [CrossRef] [Scilit] [PubMed]
- Kruger, K.; Myeonghyun, Y.; van der Wielen, N.; Kok, D.E.; Hooiveld, G.J.; Keshtkar, S.; Diepeveen-de Bruin, M.; Balvers, M.G.; Grootte-Bromhaar, M.; Mudde, K.; et al. Evaluation of inter-and intra-variability in gut health markers in healthy adults using an optimised faecal sampling and processing method. Sci. Rep. 2024, 14, 24580. [Google Scholar] [CrossRef] [Scilit] [PubMed]
- Smith, M.; Polite, L.; Christy, A.; Edirisinghe, I.; Burton-Freeman, B.; Sandhu, A. An improved validated method for the determination of short-chain fatty acids in human fecal samples by gas chromatography with flame ionization detection (GC-FID). Metabolites 2023, 13, 1106. [Google Scholar] [CrossRef] [Scilit] [PubMed]
- González Hernández, M.A.; Canfora, E.E.; Jocken, J.W.; Blaak, E.E. The short-chain fatty acid acetate in body weight control and insulin sensitivity. Nutrients 2019, 11, 1943. [Google Scholar] [CrossRef] [Scilit]
- Arora, T.; Tremaroli, V. Therapeutic potential of butyrate for treatment of type 2 diabetes. Front. Endocrinol. 2021, 12, 761834. [Google Scholar] [CrossRef] [Scilit]
- Alqahtani, M.S. The gut microbiota–metabolic axis: Emerging insights from human and experimental studies on type 2 diabetes mellitus—A narrative review. Medicina 2025, 61, 2017. [Google Scholar] [CrossRef] [Scilit] [PubMed]
- Chen, M.; Wang, Y.; Feng, P.; Liang, Y.; Liu, Q.; Yang, M.; Lu, C.; Shi, P.; Cheng, J.; Ji, A.; et al. Association Between Age at Type 2 Diabetes Onset and Diabetic Retinopathy: A Double-Center Retrospective Study. J. Diabetes Res. 2023, 2023, 5919468. [Google Scholar] [CrossRef] [Scilit] [PubMed]
- Mokhele, S.; Mokhele, T. Prevalence and determinants of household self-reported diabetes mellitus in Gauteng, South Africa. Int. J. Environ. Res. Public Health 2024, 21, 1537. [Google Scholar] [CrossRef] [Scilit] [PubMed]
- Yan, Z.; Cai, M.; Han, X.; Chen, Q.; Lu, H. The interaction between age and risk factors for diabetes and prediabetes: A community-based cross-sectional study. Diabetes Metab. Syndr. Obes. 2023, 16, 85–93. [Google Scholar] [CrossRef] [Scilit] [PubMed]
- Lu, X.; Xie, Q.; Pan, X.; Zhang, R.; Zhang, X.; Peng, G.; Zhang, Y.; Shen, S.; Tong, N. Type 2 diabetes mellitus in adults: Pathogenesis, prevention and therapy. Signal Transduct. Target. Ther. 2024, 9, 262. [Google Scholar] [CrossRef] [Scilit] [PubMed]
- Ramírez-Morros, A.; Berenguera, A.; Millaruelo, L.; Buil-Cosiales, P.; Gomez Garcia, C.; Cos, X.; Ávila Lachica, L.; Artola, S.; Millaruelo, J.M.; Mauricio, D.; et al. Impact of gender on patient experiences of self-management in type 2 diabetes: A qualitative study. Patient Prefer. Adherence 2024, 18, 1885–1896. [Google Scholar] [CrossRef] [Scilit] [PubMed]
- Agyin-Birikorang, A.; Lennon, S.; Smith, K.S.; Van Der Pol, W.; Smith, M.A.; Sexton, C.L.; Lamb, D.A.; Young, K.C.; Mobley, C.B.; Huggins, K.W.; et al. Fecal microbiota and associated metabolites are minimally affected by ten weeks of resistance training in younger and older adults. Sports 2025, 13, 98. [Google Scholar] [CrossRef] [Scilit] [PubMed]
- Ma, Z.F.; Lee, Y.Y. The role of the gut microbiota in health, diet, and disease with a focus on obesity. Foods 2025, 14, 492. [Google Scholar] [CrossRef] [Scilit] [PubMed]
- Baker, C.; Retzik-Stahr, C.; Singh, V.; Plomondon, R.; Anderson, V.; Rasouli, N. Should metformin remain the first-line therapy for treatment of type 2 diabetes? Ther. Adv. Endocrinol. Metab. 2021, 12, 2042018820980225. [Google Scholar] [CrossRef] [Scilit] [PubMed]
- South African National Department of Health. Standard Treatment Guidelines and Essential Medicines List for South Africa, Hospital Level, Adults; South African National Department of Health: Pretoria, South Africa, 2019. [Google Scholar]
- Kim, J.; De Jesus, O. Medication routes of administration. In StatPearls; StatPearls Publishing: Treasure Island, FL, USA, 2021. Available online: https://www.ncbi.nlm.nih.gov/books/NBK568677/ (accessed on 13 July 2026).
- Coetzee, A. An introduction to insulin use in type 2 diabetes mellitus. S. Afr. Fam. Pract. 2023, 65, 5702. [Google Scholar] [CrossRef] [Scilit]
- Zhang, C.Y.; Liu, S.; Sui, Y.X.; Yang, M. Roles of short-chain fatty acids in metabolic dysfunction-associated steatotic liver disease and metabolic dysfunction-associated steatohepatitis. World J. Hepatol. 2025, 17, 113756. [Google Scholar] [CrossRef] [Scilit] [PubMed]
- Zeggini, E.; Ioannidis, J.P. Meta-analysis in genome-wide association studies. Pharmacogenomics 2009, 10, 191–201. [Google Scholar] [CrossRef] [Scilit] [PubMed]
- Ahmad, S.; Assaf, M.; Thomas, B.; Ibrahim, H.; Muppuri, G.; Chand, P.; Mercy, A.; Kumar, M.; Kumar, R.; Khan, A. Fecal short-chain fatty acids (SCFAs) and their role in metabolic disorders: A systematic review. Cureus 2025, 17, e91579. [Google Scholar] [CrossRef] [Scilit]
- De la Cuesta-Zuluaga, J.; Mueller, N.T.; Álvarez-Quintero, R.; Velásquez-Mejía, E.P.; Sierra, J.A.; Corrales-Agudelo, V.; Carmona, J.A.; Abad, J.M.; Escobar, J.S. Higher fecal short-chain fatty acid levels are associated with gut microbiome dysbiosis, obesity, hypertension and cardiometabolic disease risk factors. Nutrients 2018, 11, 51. [Google Scholar] [CrossRef] [Scilit] [PubMed]

Disclaimer/Publisher’s Note: The statements, opinions and data contained in all publications are solely those of the individual author(s) and contributor(s) and not of MDPI and/or the editor(s). MDPI and/or the editor(s) disclaim responsibility for any injury to people or property resulting from any ideas, methods, instructions or products referred to in the content. |
© 2026 by the authors. Licensee MDPI, Basel, Switzerland. This article is an open access article distributed under the terms and conditions of the Creative Commons Attribution (CC BY) license.