


Abstract
Background: In type 2 diabetes mellitus (T2DM), bone and microvascular complications may be linked. Methods: The University of California Davis (UCD) polygenic T2DM and Sprague Dawley healthy control (CTL) rats (N = 48) were divided equally into diabetic and age-matched groups: (1) pre-diabetes, (2) diabetes onset, (3) early-stage T2DM, and (4) late-stage T2DM. Body mass, HbA1c, fasted blood glucose and femoral and tibial lengths were measured. Bones were scanned (μCT; 15 µm) to assess trabecular microarchitecture and density and mid-shaft cortical thickness (Ct.Th, µm), density and porosity. Ossified vessel volume (OsVV, %) and thickness (OsV.Th, µm) were also analyzed. A GLM determined significance at p < 0.05. Body mass and HbA1c were higher (p < 0.05) in all T2DM groups and blood glucose became elevated (p < 0.05) in early-stage T2DM and late-stage T2DM. Results: Tibiae and femora were longer (p < 0.05) with diabetes. Tibial bone volume was lower (p < 0.05) in pre-diabetes (4 ± 1% vs. CTL, 9 ± 2%) and late-stage T2DM (5 ± 2% vs. CTL, 8 ± 2%), and femoral bone volume was lower (p < 0.05) in pre-diabetes (7 ± 1% vs. 12 ± 4%). Cortical density (tibia) was lower (p < 0.05) in pre-diabetes and early-stage T2DM. Trabecular density in the femur was lower (p < 0.05) in all T2DM groups and cortical density was reduced (p < 0.05) in pre-diabetes, diabetes onset, and late-stage T2DM. OsVV in both bones were lower (p < 0.05) during early-stage T2DM. Tibial OsV.Th was higher (p < 0.05) in pre-diabetes (69 ± 14 µm vs. CTL, 56 ± 13 µm) and late-stage T2DM (80 ± 10 µm vs. CTL, 59 ± 13 µm) and higher (p < 0.05) in the femur at diabetes onset (58 ± 14 µm vs. CTL, 40 ± 10 µm). Conclusions: Trabecular and cortical bone varied as diabetes progressed, and the thicker ossified vessels may represent microangiopathy.
1. Introduction
Considered an endocrine disorder, type 2 diabetes mellitus (T2DM) presents with low or high insulin levels and/or β-cell dysfunction [1,2,3,4]. In addition, it is a metabolic disorder that often coincides with high resting blood glucose and a multitude of systemic problems, principal among them being macro- and microvascular complications. Macrovascular complications include coronary heart disease, sudden death, arrhythmia, and cardiomyopathy, i.e., conditions that affect the heart [5]. It also comprises complications related to the large blood vessels (e.g., cerebrovascular and peripheral artery disease) [5]. Microvascular complications affect various organs and lead to damage over time [6]. For example, neuropathy, nephropathy and retinopathy result from diabetes [7], i.e., microvascular complications within the nervous system, the kidneys, and the eyes. Recent research has brought to light the presence of microvascular complications within the skeletal system, suggesting a potential link between diabetes-induced vascular pathology and skeletal decline. For example, the risk of hip fracture is increased in T2DM [8,9,10], even though these patients often have augmented bone mineral density [11]. Further, delayed healing or non-union of fracture is common in patients with diabetes [12,13]. Thus, given the relation between vascular function and bone health [14,15,16], the bone pathology observed with diabetes may result from microvascular complications within the skeleton [17].
Skeletal microangiopathy was described for the first time in a mouse model of type 1 diabetes mellitus, which was characterized by remodeling of the marrow (i.e., reduced hematopoiesis, augmented adiposity and osteopenia in the tibia and femur) [18]. Specific to blood vessels, microangiopathy represented a loss of marrow endothelial cells and vascular integrity, rarefaction of arterioles, capillaries and sinusoids, and reduced skeletal perfusion [18]. In another investigation, capillary rarefaction (i.e., reduced capillary density) was observed in the femur of female C57BL/6J mice, which coincided with reduced bone volume and trabecular number and thickness [19]. In the Zucker diabetic fatty rat, a model of T2DM [20,21], declines in vasomotor function of the femoral principal nutrient artery (i.e., PNA) occurred during long-term diabetes and manifested as reduced endothelium-dependent and -independent vasodilator responsiveness, augmented vasoconstrictor responsiveness, and diminished passive mechanical distensibility of the PNA [20]. In other words, the artery favored vasoconstriction and had augmented vascular stiffness [20], resulting in reduced marrow and bone blood flow and vascular conductance [20]. Coinciding with this were diminished bone mineral density and a loss of several bone mechanical properties as T2DM progressed [21].
To gain deeper insights into the development of microangiopathy with the onset and progression of diabetes, the University of California Davis (UCD) polygenic rat model of T2DM was chosen for investigation. This innovative polygenic rat model offers a unique opportunity to study the progressive development of this disease observed in humans, i.e., adult-onset obesity and insulin resistance, insufficient compensation by β-cells, and the development of hyperglycemia and diabetes over time [22]. Similar to previous protocols [20,21], we investigated the skeletal phenotype and one aspect of the vascular phenotype during the onset and progression of T2DM in the UCD polygenic rat model. Specifically, the purposes of the investigation were to determine the bone structural properties and the corresponding changes in bone marrow blood vessel ossification in the hindlimb long bones with the onset and progression of the disease. The age range of the animals in this study is reflective of younger individuals diagnosed with T2DM [23]. Understanding the stage-specific skeletal and vascular changes in T2DM is critical for interpreting disease mechanisms in animal models while also identifying potential windows of intervention in human populations, e.g., obese adolescent and young adults with a heightened susceptibility for developing diabetes.
2. Materials and Methods
2.1. Rat Characteristics
All procedures were approved and carried out in accordance with the University of Texas Austin’s Institutional Animal Care and Use Committee (Protocol AUP-2022-0049) and conform to the Guide for the Care and Use of Laboratory Animals published by the National Institutes of Health (NIH, 8th edition, 2011). Sprague Dawley control (CTL, n = 24) and UCD T2DM (T2DM, n = 24) rats were housed in standard cages in a temperature (23 ± 2 °C) and light (12:12 h light/dark) controlled room. Tap water and regular rat chow were provided ab libitum. The T2DM rats were received at ~6 weeks of age and developed diabetes over time. The T2DM rats were sacrificed at the following stages, i.e., pre-diabetes (n = 6), diabetes onset (n = 6), early-stage T2DM (i.e., 4 weeks after onset; n = 6), and late-stage T2DM (i.e., 12 weeks after onset; n = 6). A priori, and based upon previous experience with this rat model, the pre-diabetes group was determined based on age and diabetes onset, early-stage T2DM, and late-stage T2DM were determined based on the diagnosis of the disease. At each stage, an equal number of Sprague Dawley rats served as age-matched healthy controls [24]. No additional animals were included, and none were excluded.
Weekly measures of blood glucose (Stat Strip Xpress®, Nova Biomedical, Waltham, MA, USA) and hemoglobin A1c (HbA1c; A1CNow®+, PTS Diagnostics, Indianapolis, IN, USA) were obtained for the UCD T2DM rats by pricking the tail following a 12 h fast [24]. These measurements commenced at 8 weeks and continued until diabetes onset [24]. The rats received a T2DM diagnosis with a HbA1c ≥ 5.6% [24]. Prior to sacrifice, the animals were anesthetized (2–3% isoflurane to oxygen balance) and body mass was recorded. The rats were subsequently euthanized via injection of saturated potassium chloride (>200 mg/kg), the right tibiae and femora were dissected, cleaned of surrounding soft tissue, placed in 10% formalin for 3 days at 4 °C, and then stored in 70% EtOH at −20 °C until analysis. Femoral and tibial lengths were measured in millimeters (mm) with digital calipers (UltraTECH No. 1433, GENERAL®, New York, NY, USA).
2.2. High-Resolution µCT
Tibiae and femora were brought to room temperature for 1 h prior to scanning. The bones were wrapped in 70% EtOH-soaked gauze, scanned in their entirety at a resolution of 15 µm and acquired at 55 kVp.
2.3. Trabecular Bone Microarchitecture
Trabecular bone microarchitecture (i.e., bone volume-to-total volume ratio [BV/TV, %], trabecular thickness, [Tb.Th, μm], trabecular number [Tb.N, /mm] and trabecular separation [Tb.Sp, μm]) was determined from 75 slices in the secondary spongiosa of the distal metaphysis of the femur and in the proximal metaphysis of the tibia. Trabecular bone density (mg HA/cm3) was also assessed and reported.
2.4. Cortical Mid-Shaft Parameters
Cortical shell thickness (μm) was determined from 60 slices at the femoral midshaft and from 50 slices at the tibial midshaft. Cortical porosity (Ct. Porosity, %) was calculated with the following equation: 1 − cortical midshaft BV/TV. Cortical bone density (Ct. Density, mg HA/cm3) was also assessed and reported.
2.5. Bone Marrow Blood Vessel Ossification
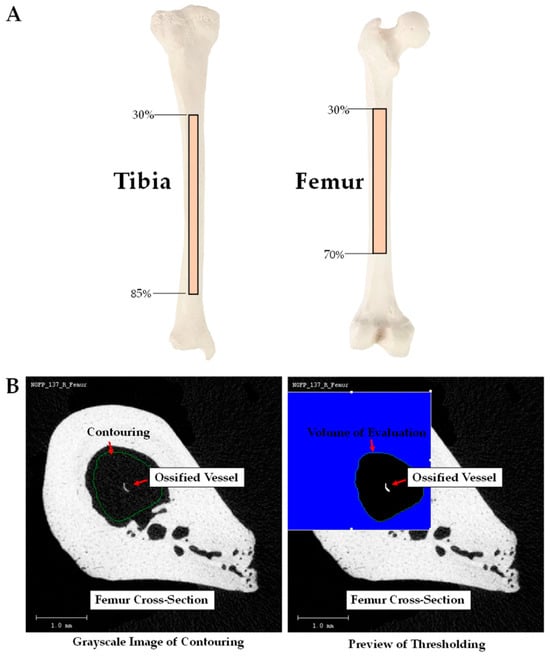
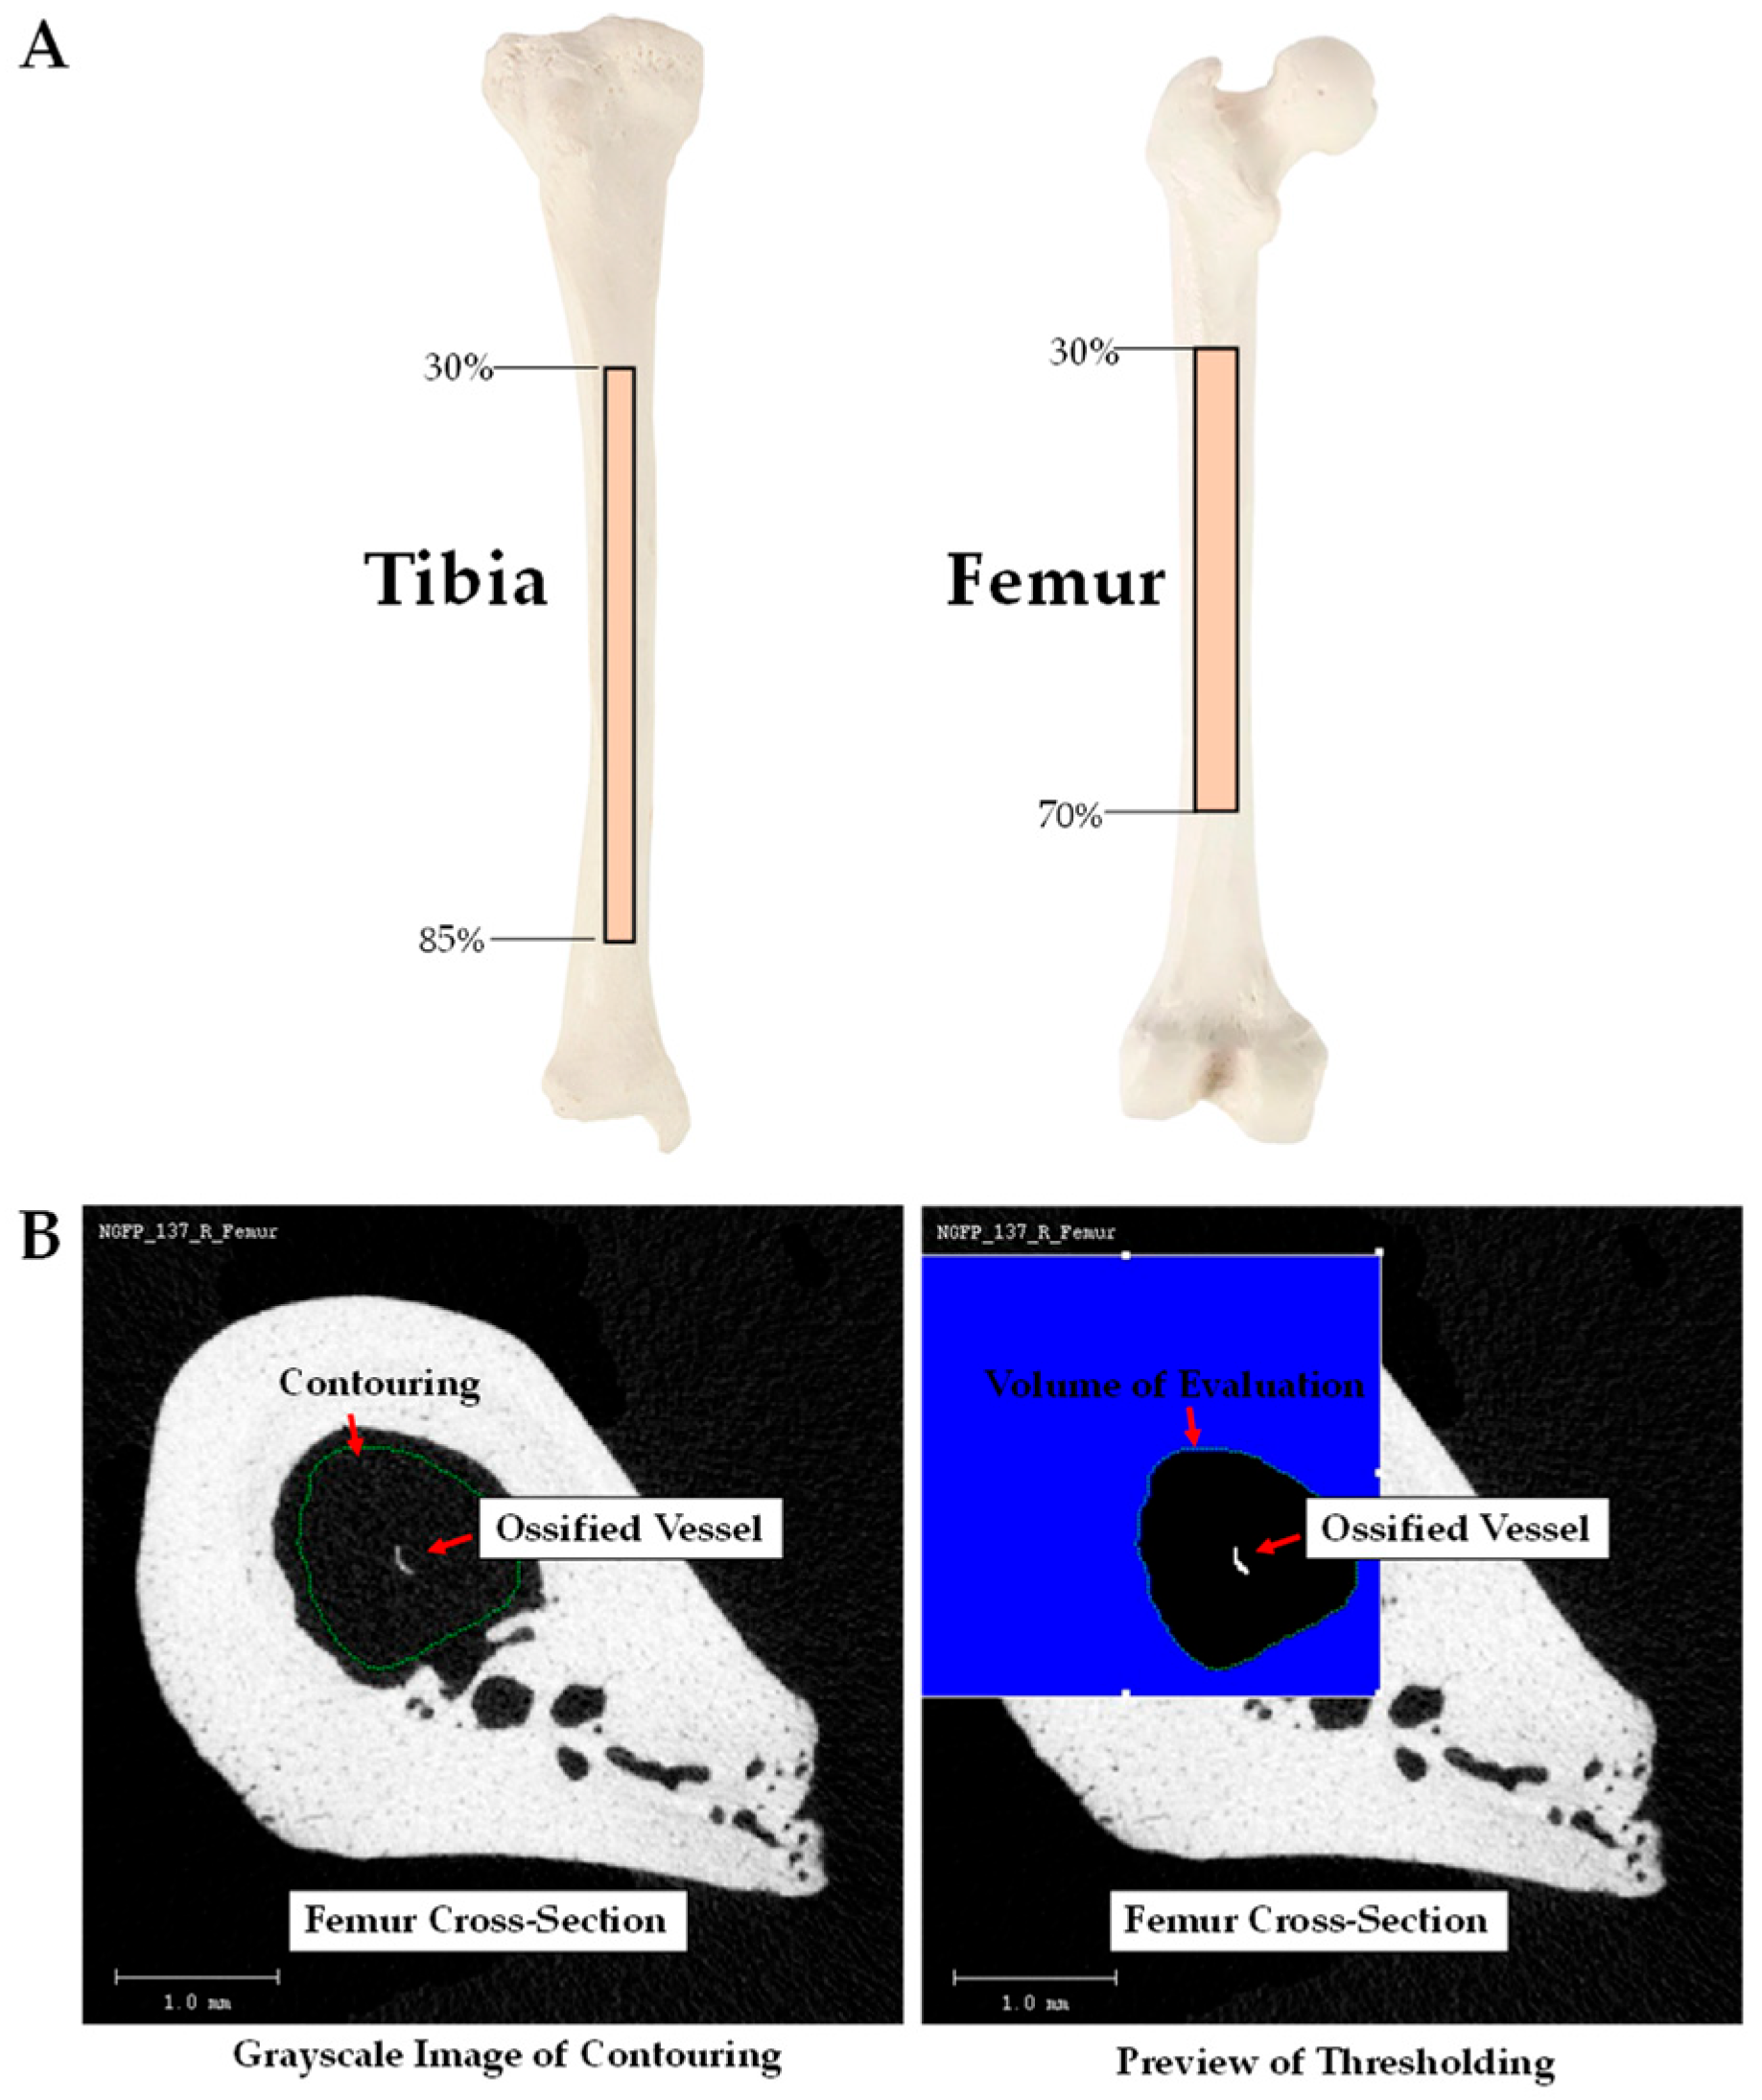
Ossified vessel volume (OsVV [%], the volume of ossified bone marrow blood vessels) was determined by analyzing the marrow space of the tibial and femoral diaphyses. The area of analysis corresponded to the marrow volumes at ranges between 30% and 85% of the tibial length and between 30% and 70% of the femoral length (Figure 1A). Analysis within these regions of the diaphyseal marrow ensured that the secondary spongiosa of the proximal and distal metaphyses were not included. Figure 1B depicts 2D cross-sectional µCT images of a femur and contouring within the marrow cavity. The contouring avoided proximity to the cortical shell to ensure exclusion of cortical bone in the OsVV analysis. Panel B also depicts the grayscale image and preview of the cross-section. The preview allows for validation that the thresholding parameters (Segmentation: 0.8/2/220) appropriately detected and measured the volume of the ossified vessel in the grayscale image, as previously described [25,26,27]. In addition, ossified vessel thickness (OsV.Th, µm) and marrow volume (%) was assessed and reported.
Figure 1.
(A) Depicts the ranges of analysis within the marrow cavities of the tibial and femoral diaphyses, i.e., ranges between 30% and 85% of the tibial length and between 30% and 70% of the femoral length. (B) Depicts a cross-sectional µCT grayscale image and preview of a femur and contouring within the marrow cavity. As shown, the contouring excluded the cortical shell. The volume of the ossified vessels in the grayscale image is similar to the volume detected in the preview. The thresholding parameters were as follows: Segmentation: 0.8/2/220.
2.6. Statistical Analysis
General Linear Models were used to determine significant differences between groups. Tukey was chosen for the post hoc analyses. An alpha level of p < 0.05 was chosen a priori. The data are presented as means ± standard deviation (SD). The statistical analyses were run with SPSS software version 29, SPSS, Inc., Chicago, IL, USA.
3. Results
3.1. Rat Characteristics
Body mass was higher (p < 0.05) and tibial and femoral lengths were longer (p < 0.05) in all the T2DM groups compared to their age-matched CTL groups; see Table 1. Fasted blood glucose became significantly (p < 0.05) higher in early-stage T2DM and late-stage T2DM vs. CTL and HbA1c was higher (p < 0.05) in all T2DM vs. CTL rats (Table 1). In late-stage T2DM, the concentration of HbA1c nearly tripled that of CTL animals.
Table 1.
Rat characteristics.
3.2. Trabecular Microarchitecture and Density
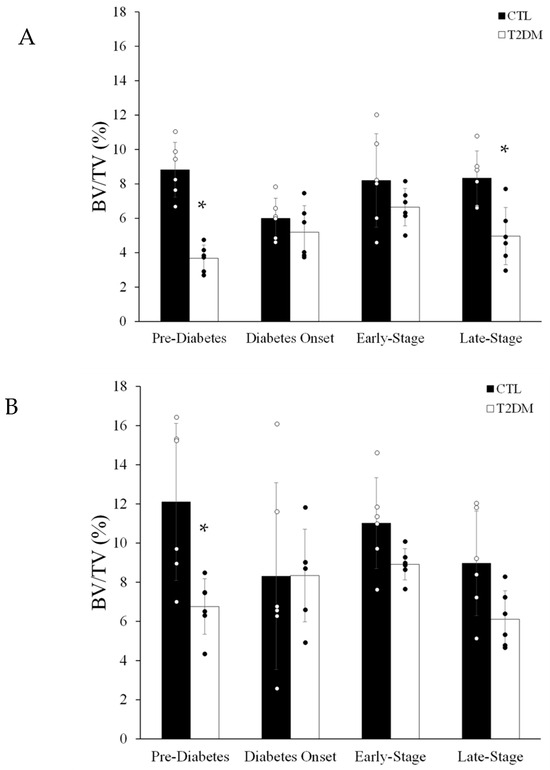
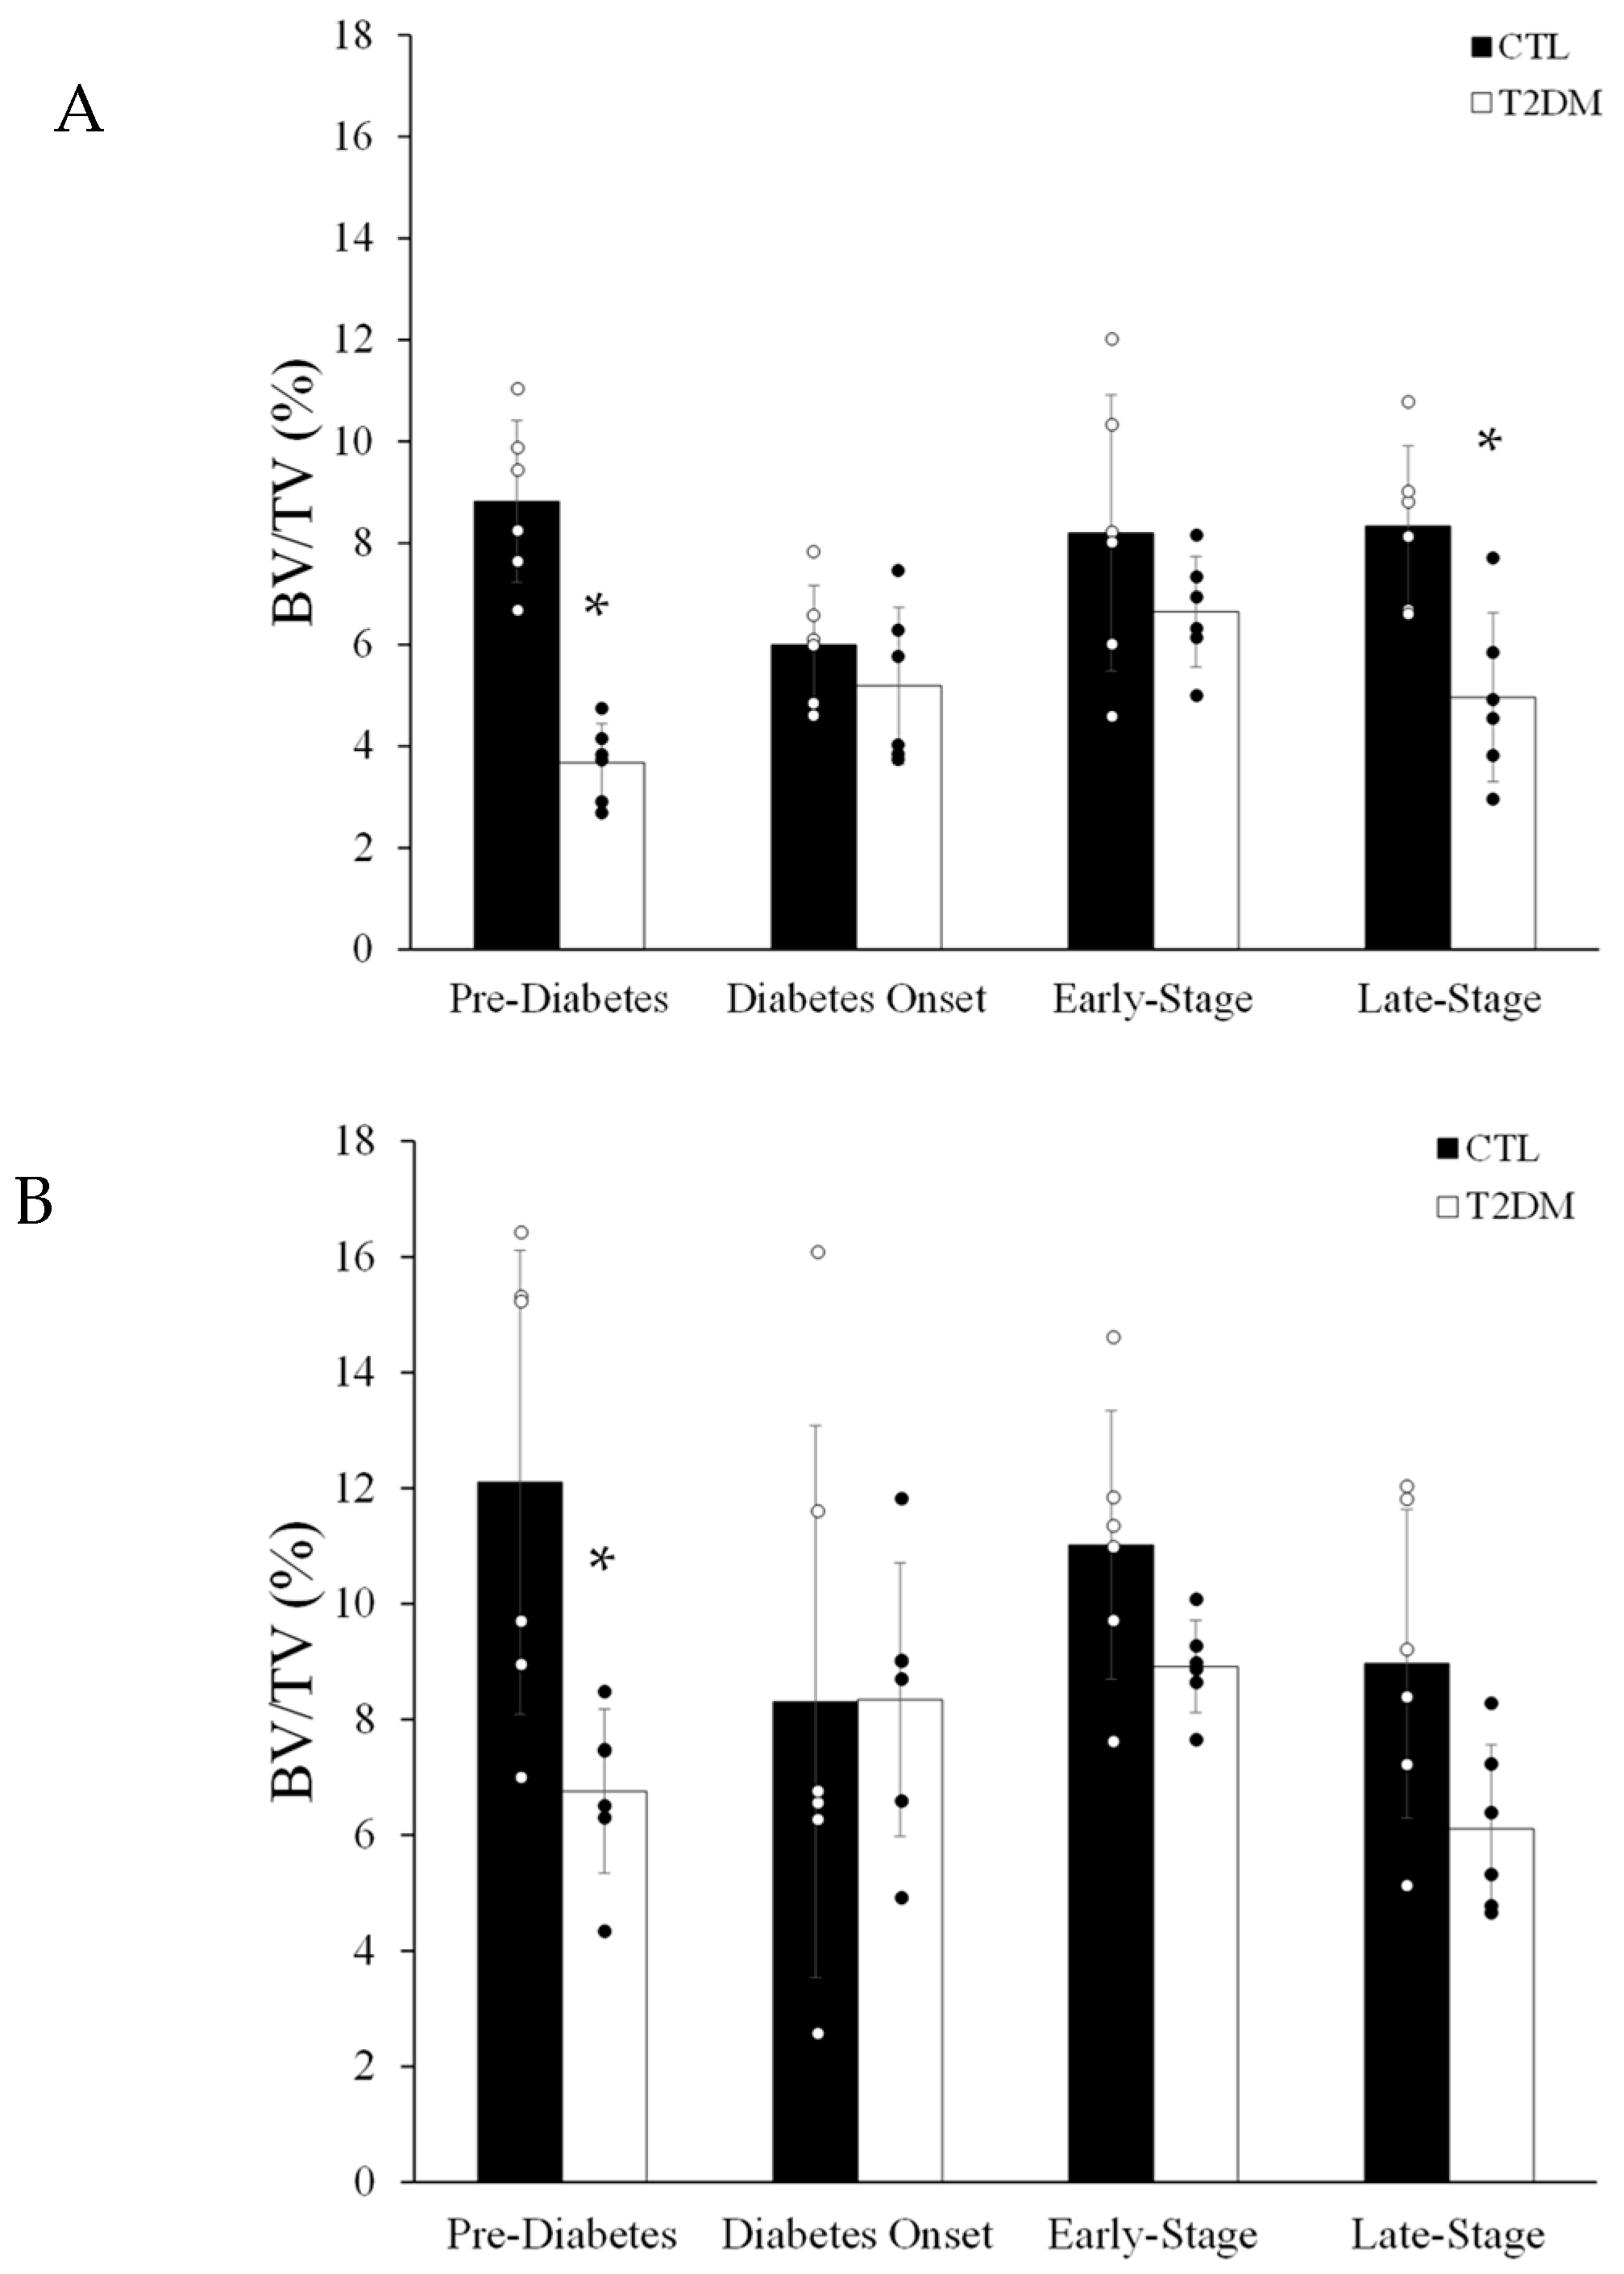
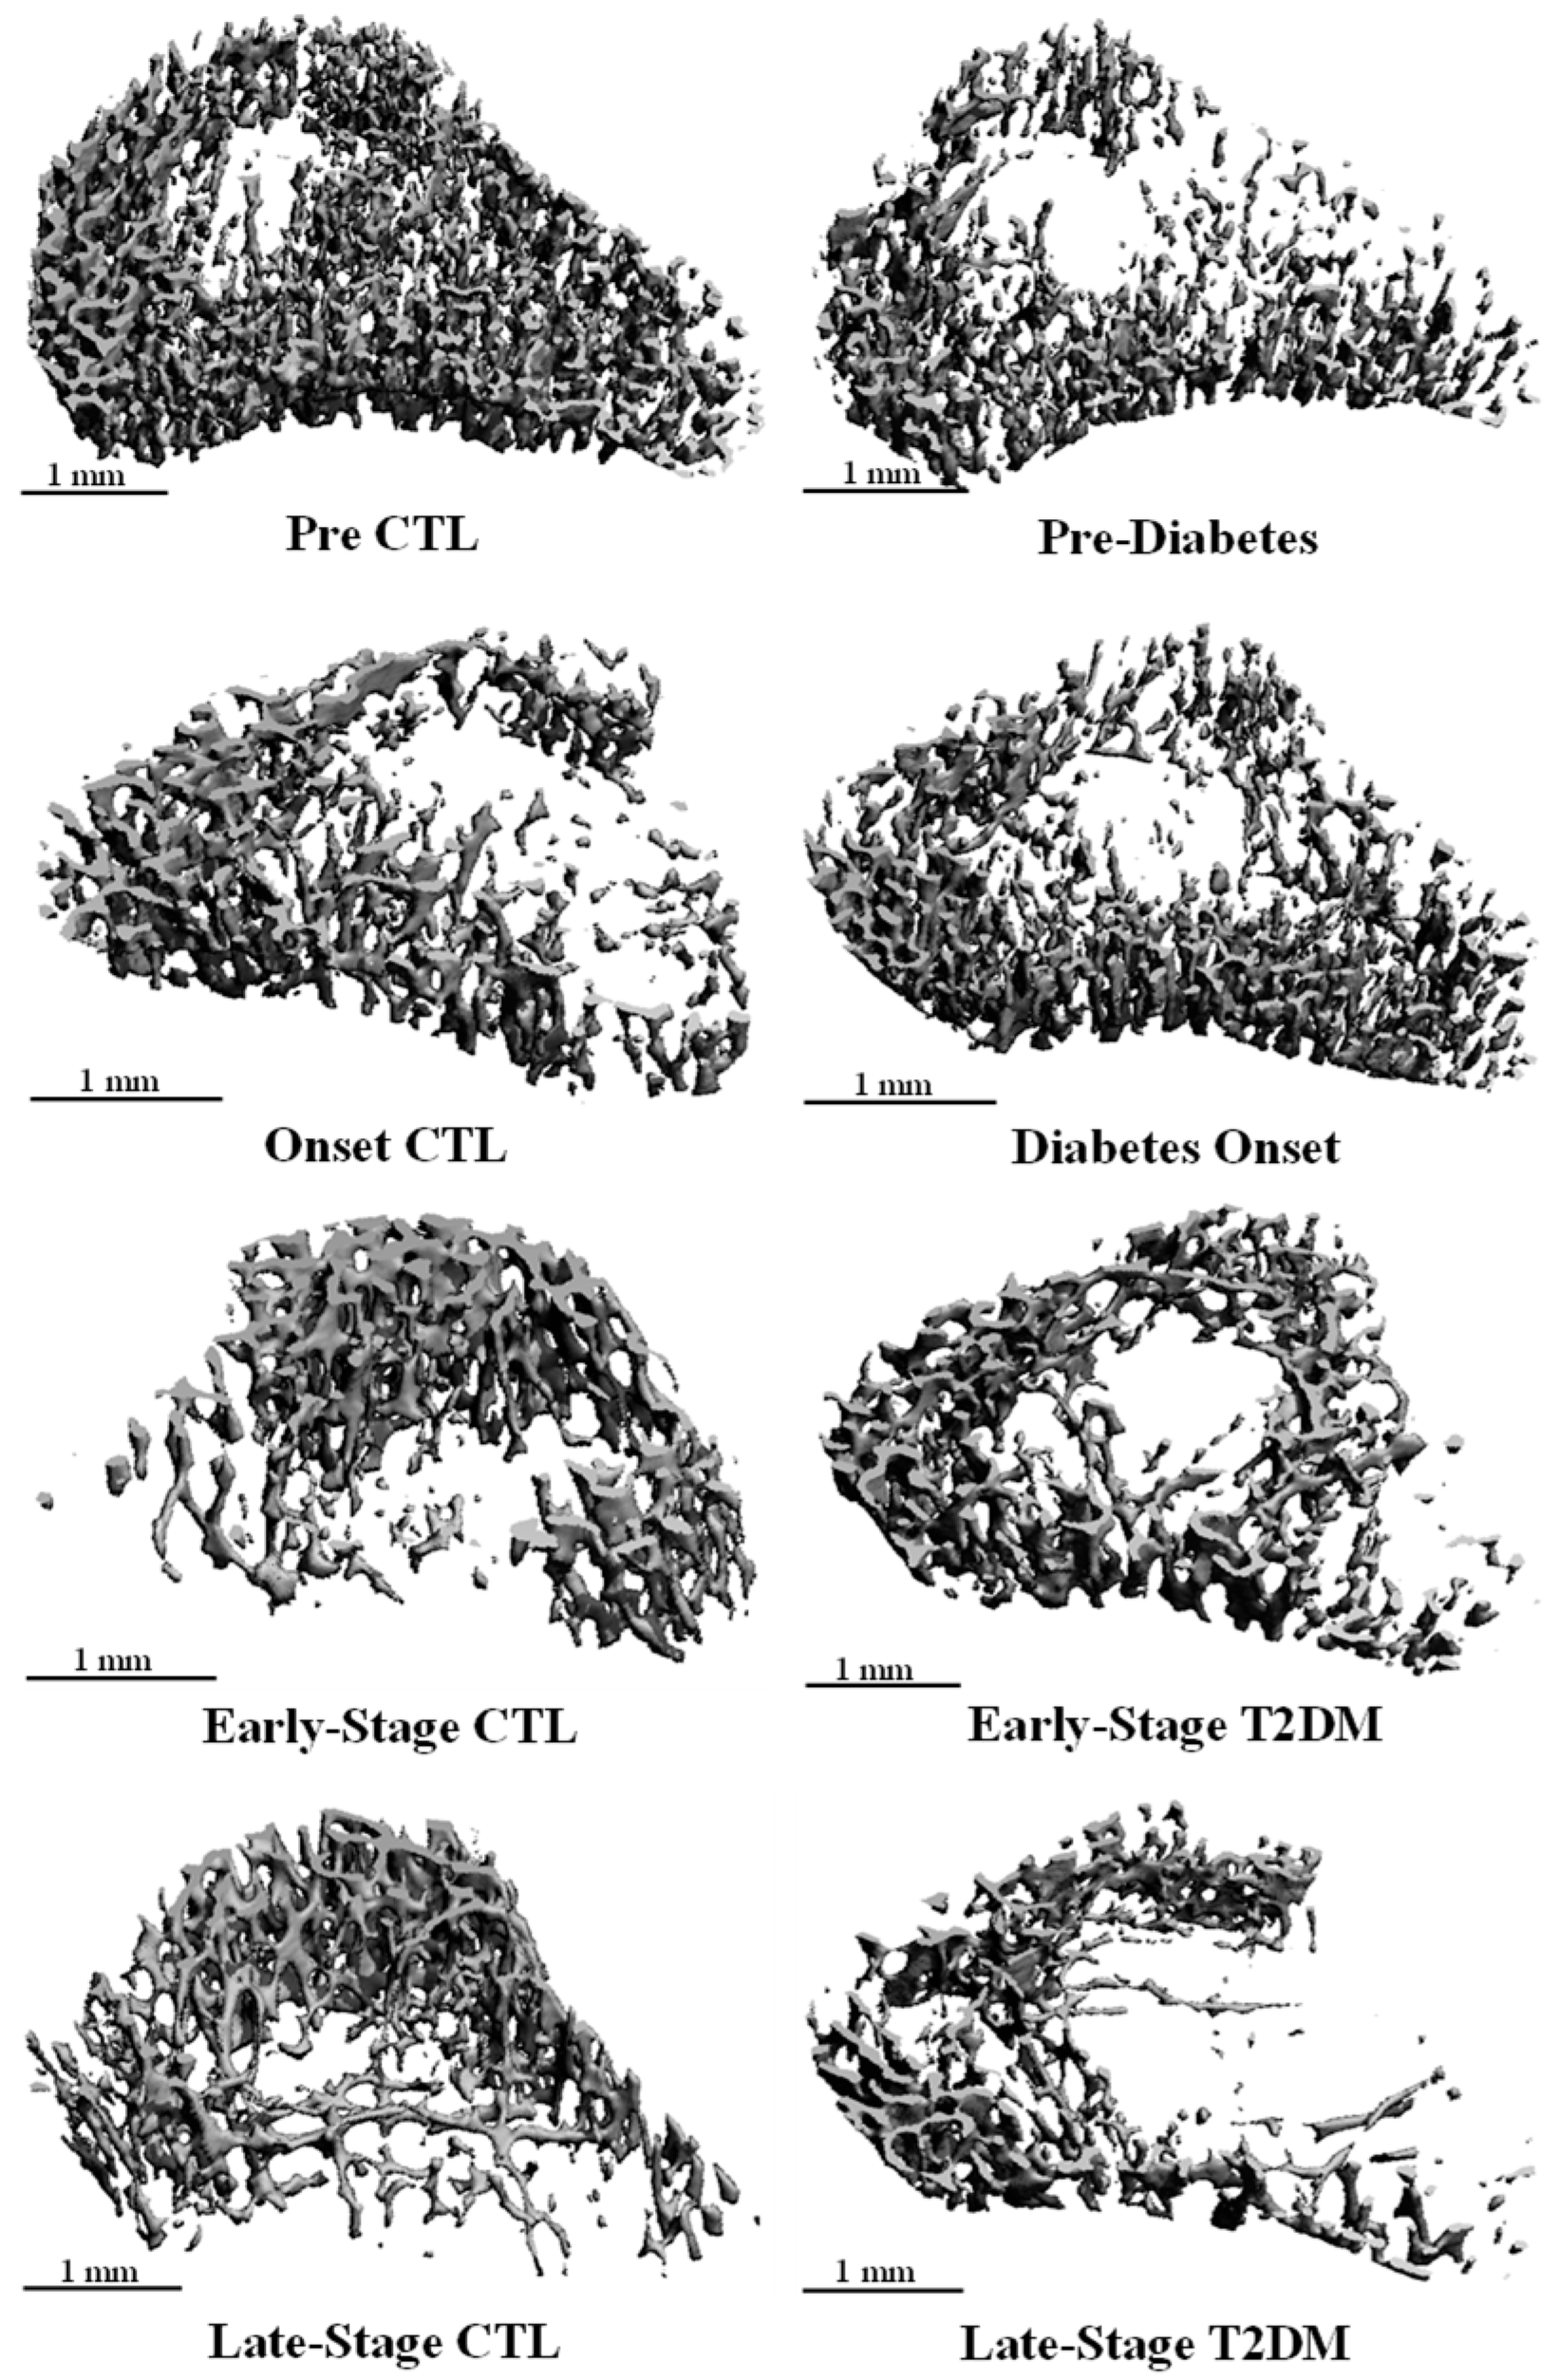
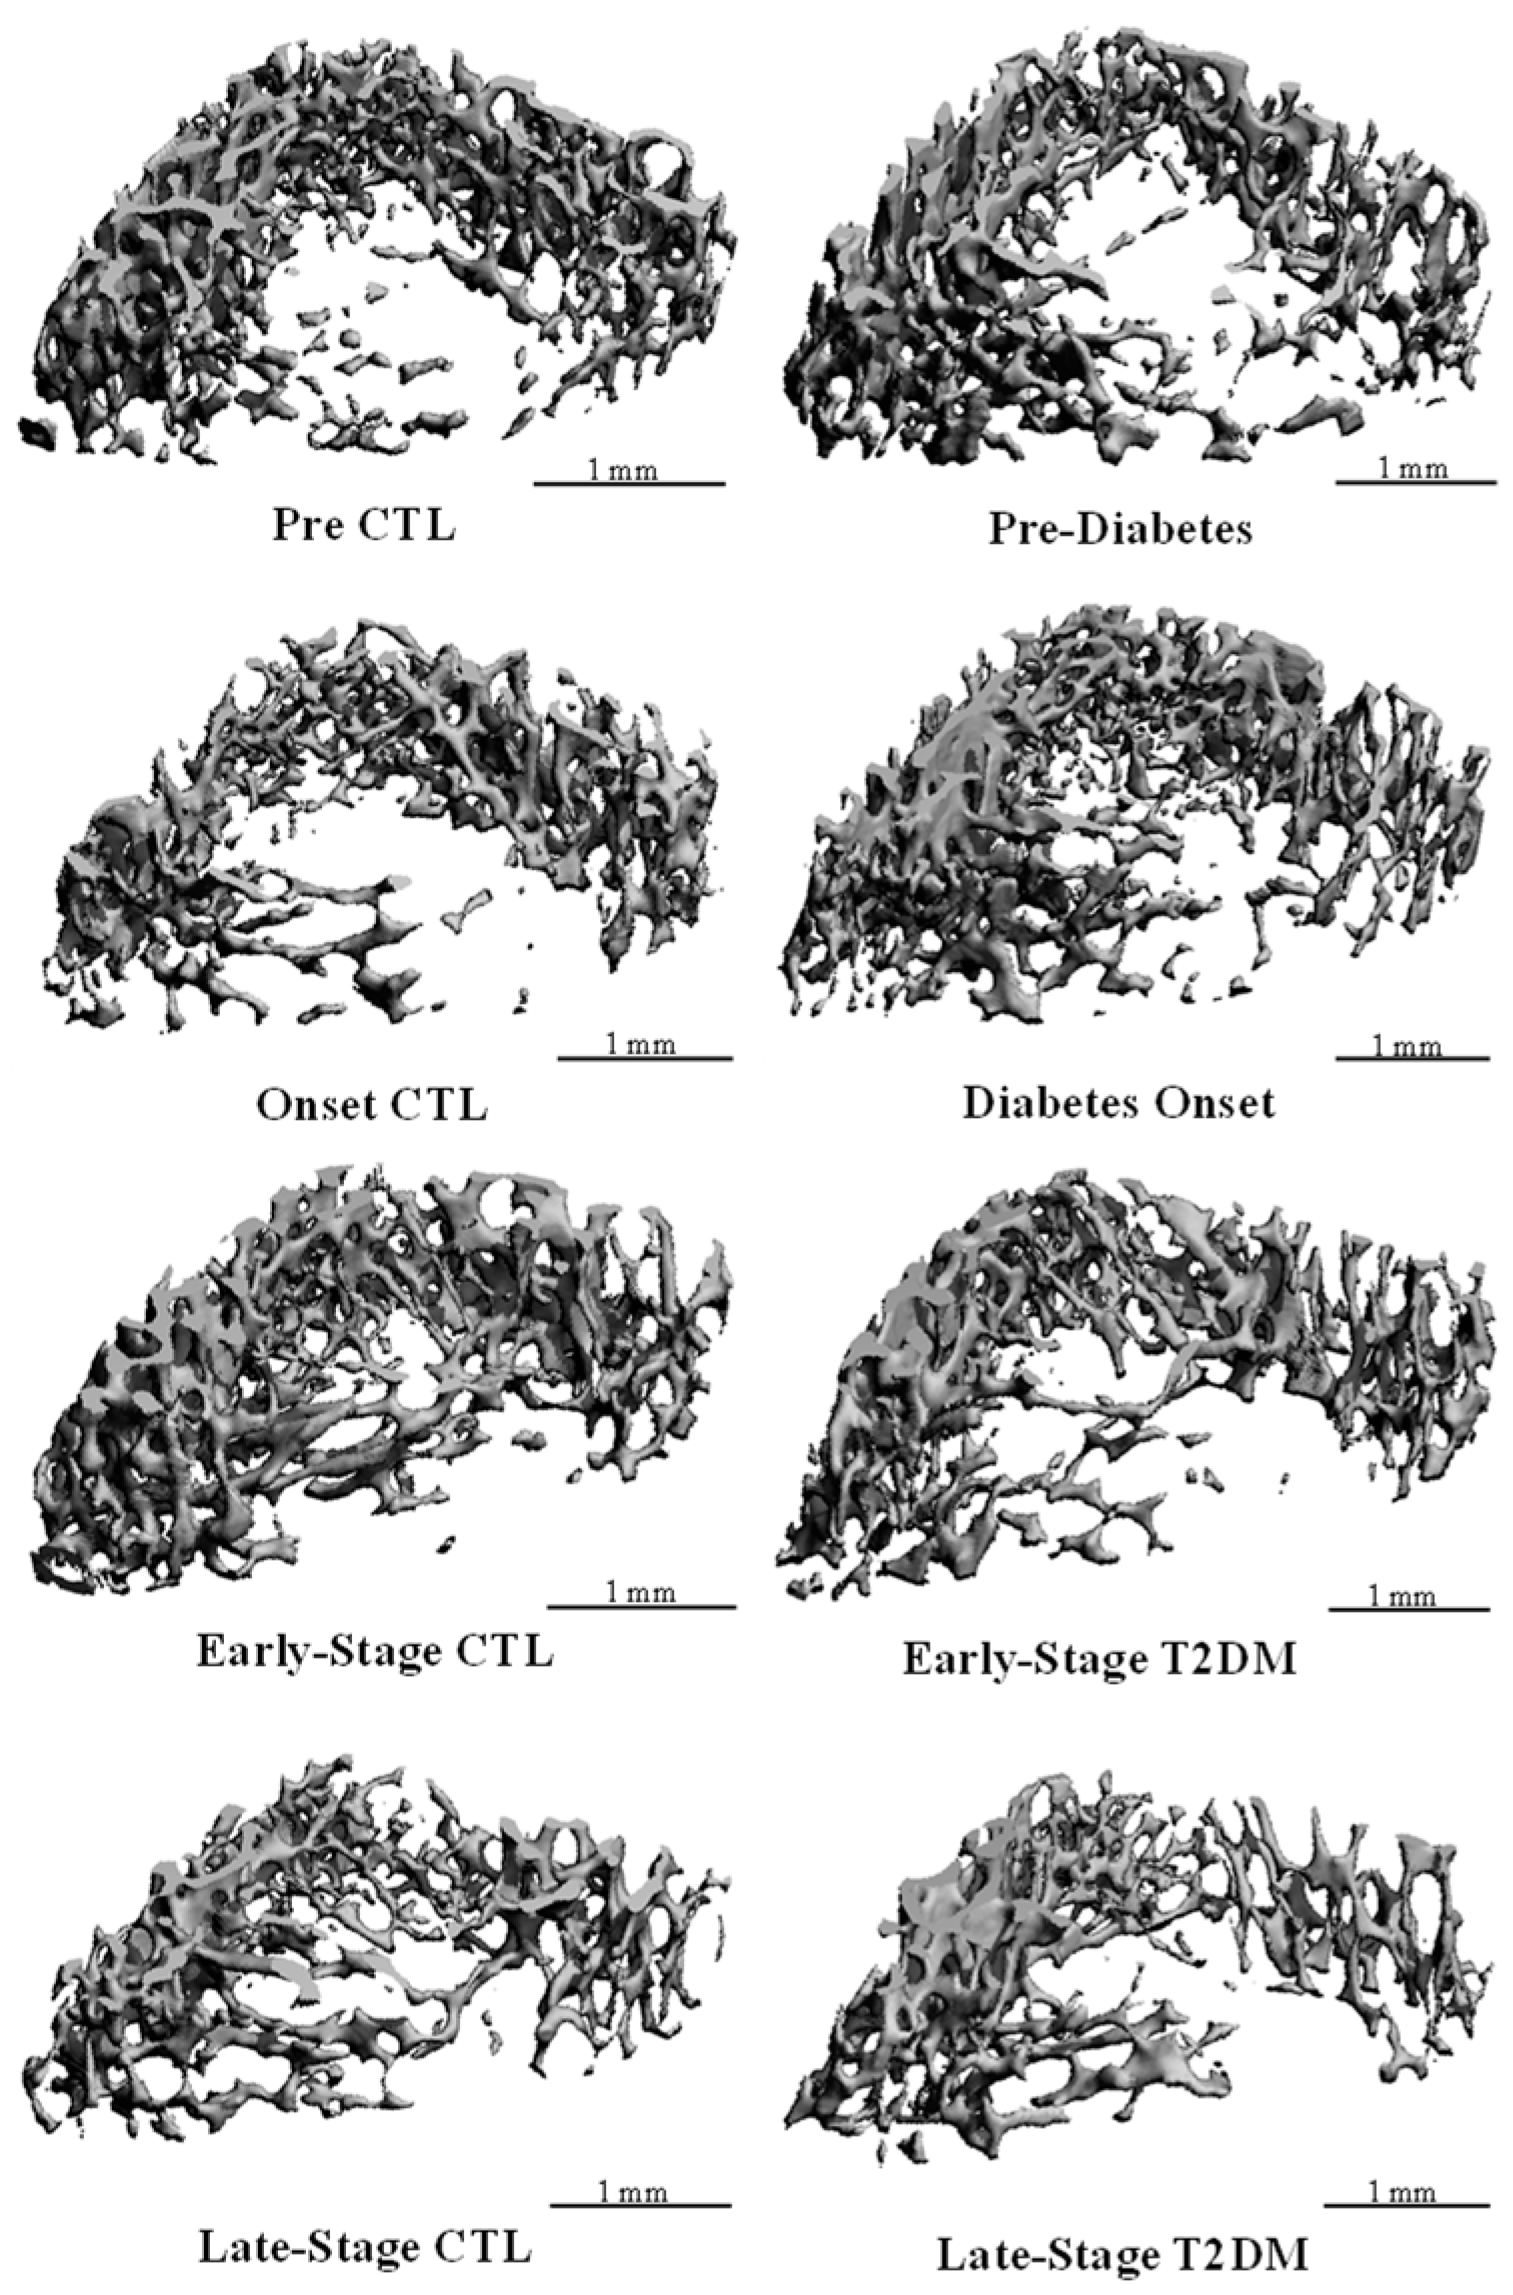
Trabecular BV/TV in the proximal tibial metaphysis was lower in pre-diabetes and late-stage T2DM vs. their age-respective CTL groups (Figure 2A), resulting from reduced (p < 0.05) Tb.N in pre-diabetes and late-stage T2DM and diminished (p < 0.05) Tb.Th in late-stage T2DM (Table 2). Corresponding with the decline in Tb.N, Tb.Sp was higher (p < 0.05) in both pre-diabetes and late-stage T2DM vs. the age-matched CTL rats. Trabecular BV/TV in the distal femoral metaphysis was lower (p < 0.05) in pre-diabetes vs. CTL rats (Figure 2B) and was driven by a lower (p < 0.05) Tb.N. Trabecular number was also lower (p < 0.05) in early-stage T2DM vs. CTL, even though bone volume remained similar. Trabecular thickness did not differ between groups, but Tb.Sp was higher (p < 0.05) in pre-diabetes and early-stage T2DM. Representative µCT images of the proximal tibial metaphysis and distal femoral metaphysis are depicted in Figure 3 and Figure 4, respectively. Trabecular density in the proximal tibial metaphysis did not differ at any age; however, trabecular density in the distal femoral metaphysis was reduced (p < 0.05) in all T2DM groups vs. the age-respective CTL (Table 2).
Figure 2.
Bone volume-to-total volume ratio in the (A) proximal tibial and (B) distal femoral metaphyses from CTL (n = 6) and T2DM (n = 6) rats. Values are means ± SD. * denotes a significant (p < 0.05) difference from age-matched CTL rats.
Table 2.
Trabecular bone microarchitecture and density.
Figure 3.
Representative μCT images of BV/TV (%) in the proximal tibial metaphysis of the CTL and T2DM groups.
Figure 4.
Representative μCT images of BV/TV (%) in the distal femoral metaphysis of the CTL and T2DM groups.
3.3. Cortical Bone Parameters
At the tibial and femoral midshafts, neither cortical thickness nor porosity differed between groups (Table 3). Cortical density at the tibial midshaft was lower (p < 0.05) in pre-diabetes and diabetes onset. Cortical density at the femoral midshaft was lower (p < 0.05) in pre-diabetes, diabetes onset, and late-stage T2DM, but did not differ at early-stage T2DM vs. the respective CTL (Table 3).
Table 3.
Cortical bone parameters.
3.4. Diaphyseal Marrow Parameters
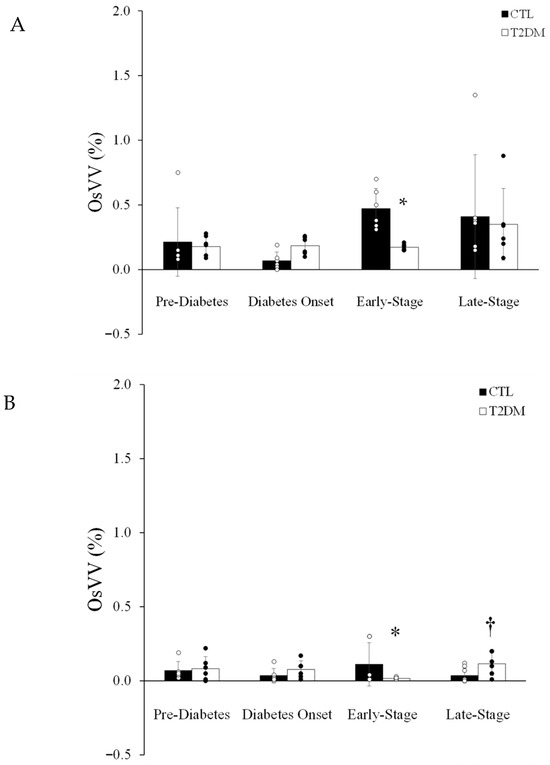
The marrow volume within the tibial diaphysis was larger in pre-diabetes, early-stage T2DM, and late-stage T2DM vs. their respective CTL groups (Table 4). In the tibial diaphysis, OsVV did not differ between groups except in early-stage T2DM, where it was lower (p < 0.05) vs. CTL (Figure 5A). Ossified vessel thickness did not differ between diabetes onset and early-stage T2DM vs. their respective CTL but was thicker in pre-diabetes and late-stage T2DM vs. their respective CTLs (Table 4). In the femoral diaphysis, marrow volume was larger (p < 0.05) in all stages of T2DM vs. CTL (Table 4), while OsVV lower (p < 0.05) in early-stage T2DM vs. their respective CTL (Figure 5B). Interestingly, there was a tendency (p = 0.07) for a higher OsVV in the late-stage T2DM vs. their respective CTL group. Further, the ossified vessels were thicker (p < 0.05) at diabetes onset vs. CTL rats but did not differ between any other groups.
Table 4.
Diaphyseal marrow parameters.
Figure 5.
Ossified vessel volume (%) in the (A) tibial and (B) femoral diaphyses from CTL (n = 6) and T2DM (n = 6) rats. Values are means ± SD. * denotes a significant (p < 0.05) difference from age-matched CTL rats. † denotes a tendency (p = 0.07) for difference from age-matched CTL rats.
4. Discussion
The skeletal microangiopathy that accompanies diabetes includes a loss of vascular integrity and marrow endothelial cells [18], rarefaction of arterioles, capillaries and sinusoids [18], reduced endothelium-dependent and -independent vasodilator function, augmented vasoconstrictor function, diminished passive mechanical distensibility and vascular conductance [20], enhanced vascular stiffness [20], declines in skeletal perfusion [18,19], and reduced bone and marrow blood flow [20]. These alterations often coincide with reduced bone volume and osteopenia [18,19], diminished bone mineral density, and a loss of bone mechanical properties [21]. We extend upon these previous reports to include thicker ossified vessels in pre-diabetes (tibia), diabetes onset (femur), and late-stage T2DM (tibia), indicating enhanced accumulation of mineral and/or bone on the marrow vasculature (Figure 5). Consistent with observances in other strains of rodents [25,26,27], we report bone marrow blood vessel ossification in both T2DM (i.e., Sprague Dawley background) and Sprague Dawley CTL rats. In contrast to expectations, OsVV did not differ between groups, except in early-stage T2DM whereby it was diminished in the tibia and femur vs. CTL rats. Interestingly, the decline in OsVV occurred at the same stage of T2DM (i.e., early-stage) in both the tibia and femur, suggestive of a true physiological or pathological phenomenon. Notably, a tendency for a higher OsVV was observed in the femur in late-stage T2DM.
Diabetic pathology was observed in this polygenic rat model by evidence of elevated body masses and HbA1c at all diabetic stages, and fasted blood glucose concentrations that became and remained elevated in the early-stage T2DM and late-stage T2DM, respectively (Table 1). The other major findings are several-fold. Type 2 diabetes mellitus impacted the skeleton. For example, trabecular bone volume was reduced in the tibia and femur in pre-diabetes, normalized to control values with diabetes onset and in early-stage T2DM, and declined only in the tibia in late-stage T2DM (Figure 2). Trabecular density in the proximal tibia was unaffected by diabetes; however, in the distal femur, density was lower in T2DM rats at all stages (Table 2). Interestingly, cortical thickness and porosity were unaffected by diabetes in both long bones (Table 3); however, cortical density was reduced in pre-diabetes and diabetes onset in the tibia and femur and reduced in late-stage T2DM in the femur (Table 3). The declines in trabecular and cortical bone did not affect growth of the long bones such that the tibial and femoral lengths in the T2DM rats exceeded their respective CTLs. Overall, the changes in the vascular and bone parameters were dependent upon the stage of diabetes, the bone compartment (i.e., trabecular vs. cortical) and the long bone (i.e., tibia vs. femur).
Overall, the UCD polygenic rat model of T2DM elicited a divergent pattern in hindlimb long bone development related to the onset and progression of the disease. For example, reduced trabecular bone volume was observed despite no changes in cortical thickness and porosity, indicating a greater impact of T2DM on trabecular bone. Further, reductions in density were more evident in the femur vs. the tibia and more evident in cortical vs. trabecular bone. For example, trabecular density was lower in the distal femoral metaphysis in all the T2DM vs. CTLs, whereas no differences in density were observed in the proximal tibial metaphysis. In the Zucker diabetic fatty (ZDF) rat (i.e., a model of T2DM), trabecular density in the distal femoral metaphysis was augmented during pre-diabetes (7 weeks); i.e., during normoglycemia and hyperinsulinemia [21]. These data contrast the current findings. As the disease progressed into short-term (13 weeks) and long-term (20 weeks) diabetes in the ZDF rats, trabecular density was reduced, coinciding with hyperglycemia [21]. Cortical density at the tibial and femoral mid-shafts from the UCD rats was reduced in the T2DM vs. CTL rats. These data correspond to what was observed in the ZDF rat, such that the deficits in cortical density at the femoral mid-shaft were significant, even though the differences were less than 5% [21].
In this investigation, the changes in trabecular density are not linked to the changes in blood glucose. For example, fasted blood glucose became significantly higher during early-stage T2DM and late-stage T2DM when trabecular density did not differ between groups in the tibia and was lower in all stages of T2DM vs. CTL in the femur. In addition, cortical density was lower in the tibia and femur in pre-diabetes and diabetes onset, i.e., at times when blood glucose concentrations were similar between groups. Only at late-stage T2DM did higher blood glucose concentrations coincide with a lower cortical density at the femoral mid-shaft. Interestingly, higher HbA1c concentrations coincided with the lower trabecular and cortical densities observed in the femur. Higher HbA1c are suggestive of prolonged elevations in blood glucose concentrations [22].
The data from this investigation illustrate how the onset and progression of T2DM may influence trabecular and cortical bone. For example, trabecular bone volume in the proximal tibia and distal femora was reduced in pre-diabetes and in the proximal tibia during late-stage T2DM. Skeletal maturity in rodents occurs at ~20 weeks of age; therefore, the tibiae and femora of rats in pre-diabetes (i.e., 12 weeks old) and diabetes onset (i.e., 14 weeks old) were still undergoing skeletal development. Thus, the lower bone volumes in pre-diabetes represent delayed trabecular bone development as opposed to bone loss. As the animals aged, the delay in trabecular bone development during pre-diabetes was corrected by diabetes onset and early-stage T2DM, i.e., trabecular bone volume was normalized to CTL values by 14 and 20 weeks of age. By 22 weeks of age (i.e., late-stage T2DM), trabecular bone volume declined in comparison to CTL animals. At this age of skeletal maturity (i.e., 22 weeks old), the lower trabecular bone volume can be described as a loss, as opposed to delayed development. Interestingly, the loss and thinning of vertebral trabecular bone were also reported in 6-month-old UCD T2DM rats [28], demonstrating that the axial skeleton is also affected. The discrepancies in bone development did not affect the length of the bones, such that the tibiae and femora were longer in the diabetic rats.
Expansion of the marrow volume was observed in the diaphyses from all T2DM groups, except for the tibia in diabetes onset. In other words, the diaphyses were wider in comparison to CTL diaphyses despite similar cortical shell thicknesses and porosities. Once again, these findings suggest that overall long bone growth was not inhibited by diabetes in the UCD rats. This interpretation is additionally supported by the longer bone lengths in all stages of T2DM. Similar phenotypes were observed in the Goto–Kakizaki T2DM model [27], where augmented diameters were evident despite a compromised microarchitecture. These findings emphasize the need to avoid generalizing skeletal outcomes across diabetic animal models. In addition, the generalization of skeletal outcomes among bones (e.g., tibiae and femora) within the same model (e.g., UCD T2DM polygenic rat model) should be avoided.
The microangiopathy described in this investigation relates to the thickening of the ossified bone marrow blood vessels in the pre-diabetes and late-stage T2DM tibiae and during diabetes onset in femora. These data suggest an accumulation of mineral and/or ossification on the blood vessels with T2DM. Ossified vessel volume in the tibia and femur for the T2DM and CTL groups ranged from 0% to 1.35% in the tibia and from 0% to 0.22% in the femur, representing high variability. This variability mimics previous reports in rats and mice [25,26,27] and these data extend upon the previous findings to include the Sprague Dawley rat strain as being susceptible to bone marrow blood vessel ossification. In contrast with our expectations, OsVV did not differ between T2DM vs. CTL, except for a lower OsVV in the early-stage T2DM. Currently, this phenomenon is unexplainable but did coincide with elevated fasted blood glucose and HbA1c. In addition, the tendency for a higher OsVV in femoral diaphysis in late-stage T2DM is in keeping with our expectation. Further, reduced trabecular bone volume coincided with increased ossified vessel thickness. In other words, the lower trabecular bone volume in the tibia in pre-diabetes and late-stage T2DM coincided with thicker ossified vessels in the diaphyseal marrow. Advancement into diabetes onset led to thicker ossified vessels in the femur. These findings may also align with the clinical “calcification paradox,” wherein increased vascular calcification co-exists with reduced bone mass [29]. Dysregulated calcium and phosphate handling has been proposed as contributing mechanisms, promoting mineral deposition in the vasculature while compromising skeletal integrity [29]. In addition, elevated activity of bone morphogenic protein in the absence [30,31] and presence of hyperglycemia [32] have been identified as factors contributing to vascular calcification as well. Thus, bone marrow blood vessel ossification may reflect a similar imbalance in calcium and phosphate handling and/or the hyperactivity of bone morphogenic protein.
We must consider the possibility that the differences in OsVV between the early-stage T2DM and CTL rats may reflect enhanced mineralization of the bone marrow blood vessels in the CTL animals, as opposed to a decline or delay of mineralization in the T2DM rats. Our previous publications depict the presence of ossified vessels across the lifespan of rats that encompassed 20 weeks of age [26]. Thus, ossified vessels represent the presence of bone vascular pathology in the absence of overt pathologies such as T2DM. To date, the etiologies of bone marrow blood vessel ossification are unknown but may relate to the bone marrow microenvironment [33] and the conversion of endothelial and/or vascular smooth muscle cells into osteogenic phenotypes [25]. In this regard, differences in the bone marrow milieu (e.g., pro- and anti-inflammatory cytokines) between the CTL and early-stage T2DM may have accelerated and/or decelerated the progression of ossification. Further, endothelial cells can transition into mesenchymal lineages [34], a process known as endothelial to mesenchymal transition (i.e., EndMT). The transition of endothelial cells into osteogenic and chondrogenic phenotypes has also been previously described [35]. These descriptions in the literature [34,35] provide support for our premise. Further, pro-inflammatory factors are suspected to contribute to vascular calcification and the association between lipids and atherosclerosis and cardiovascular calcification has been long-standing [36]. For example, pro-inflammatory lipids such as 1-Palmitoyl-2-(5-oxovaleroyl)-sn-glycero-3-phosphocholine (POVPC) are often present inside atherosclerotic lesions [37]. When treated with POVPC, human umbilical vein endothelial cells experienced altered morphology and diminished expression of endothelial nitric oxide synthase and CD31 [37]. While uncertain of the connection, if any, between EndMT and bone marrow blood vessel ossification, similarities between these two types of vascular pathologies appear present.
Bone marrow microangiopathy has been extensively characterized in other reports [18,19,38] to include structural alterations independent from bone marrow blood vessel ossification. In a type 1 diabetes mellitus model, long-term (i.e., 27–30 weeks) diabetes resulted in a depletion of marrow endothelial cells, a diminished number of arterioles (~67%), capillaries (~61%) and sinusoids (~100%) per millimeter of area, and microvascular bleeding into the marrow cavity of the tibia and femur in male CD1 mice [18]. Additionally, reduced hematopoiesis, enhanced hypoxia and increased adiposity occurred in these animals [18]. Similar findings were present in female C57BL/6J type 1 diabetes mellitus mouse model [19]. The duration of diabetes in this experiment was 2 months. Similar to the male CD1 mice, adiposity within the femur was augmented, and vascular endothelial growth factor, hypoxia-inducible factor-1alpha, nerve growth factor and the number of CD31+ cells were attenuated [19]. In type 1 diabetic male C57BL/6 mice, an abnormal and sparce bone marrow vasculature was observed following 3 weeks of the disease [38]. In this instance, the number of type H capillaries were diminished, along with the number of type H and type L endothelial cells and their proliferative capacity [38]. In total, diabetes represents a significant challenge to both blood vessels and bone.
Overall, body mass was not correlated to bone volume and density, such that augmented body mass was observed in the presence of reduced bone volume in the tibia and femur in pre-diabetes and reduced bone volume in the tibia in late-stage T2DM. Similarly, despite higher body masses at all stages of T2DM, there were no differences in trabecular density in the tibia between the pre-diabetes, diabetes onset, early-stage T2DM and late-stage T2DM. In contrast, cortical density in the tibia was lower in pre-diabetes and diabetes onset vs. the CTL groups. It is interesting to note that the declines in cortical density observed in pre-diabetes and diabetes onset were normalized to CTL values in the early-stage T2DM and late-stage T2DM rats. This represents a disconnect between body mass and bone density in the UCD T2DM polygenic rat model, consistent with the demonstrated complexities between high body mass and bone health in this disease [39].
The totality of the findings in the UCD T2DM rats have direct relevance to skeletal fragility observed in diabetic individuals, a population in which fracture risk is increased despite normal or only modestly reduced bone mineral density. Diabetes is associated with alterations in bone microarchitecture and material properties, all of which are key components of bone quality that may contribute to fracture susceptibility beyond what is captured by bone mineral density alone. Bone quality and bone–vascular interactions may compromise skeletal mechanical competence, providing a mechanistic explanation for the disconnect between bone mineral density and fracture risk in T2DM. These findings suggest that stage-specific skeletal and marrow vascular alterations associated with T2DM begin early and may progress with duration of the disease. We posit that the manifestation of microangiopathy within the skeleton compounds, if not elicits, some of the pathology imposed upon bone. Thus, examining the time course of pathogenesis in blood vessels and bone may expose a divergent, but coupled, pathway of development. In other words, if microangiopathy occurs prior to bone pathology, clinically treating the vascular dysfunction may alleviate or eliminate the development of a particular pathology in bone.
Several limitations of this study should be considered. First, the cross-sectional design limits the ability to track longitudinal skeletal and vascular adaptations within the same animals across the progression of T2DM. Although animals were categorized by clearly defined disease stages and compared with age-matched CTLs, longitudinal approaches would be required to directly assess interactions among metabolic dysfunction, bone remodeling and vascular ossification within the marrow space. Second, while high resolution μCT provides robust and reproducible measures of trabecular microarchitecture and cortical thickness as well as mineralized vascular structures within the marrow, it does not permit evaluation of cellular or endothelial features of microangiopathy. Thus, future studies incorporating histological, immunohistochemical and functional analyses will be necessary to fully characterize the microangiopathy associated with the UCD T2DM model. For example, the characterization of vascular density, microvascular dysfunction, vascular hyalinosis, etc., would have added to the findings and will be explored in future experiments. In addition, the variability observed in some of the measurements, particularly in the OsVV analysis, may have resulted from the small sample sizes. Despite these limitations, the consistency of skeletal and vascular patterns observed across the long bones at the various disease stages supports the overall conclusions of this investigation.
Finally, the age range of the animals in this study is reflective of younger individuals diagnosed with T2DM [23], underscoring the relevance of our findings to juvenile diabetes [40]. In 6-month-old UCD T2DM rats, it was found that advanced glycation end products and collagen stiffness impaired vertebral whole-disk compressive behavior [41]. In the lumbar vertebrae and ulnae, whole-bone strength for a given bone mass was reduced and attributed to structural deficits and deficits in tissue material properties [28]. Further, ulnae had a diminished capability to resist bending, suggesting that the bone fragility observed in T2DM may represent a biomechanically inefficient bone structure and diminished tissue ductility [28]. Thus, T2DM elicited degenerative changes in the composition of the intervertebral disk, leading to thicker vertebral endplates [42]. Considering these magnitudes of deficit at 6 months of age in this rat model, declines in these and other parameters begin at much earlier ages. In other words, younger individuals diagnosed with T2DM may face a heightened risk of fractures during their lifetime due to longer durations of the disease. Understanding the sequence of events may prove crucial when exploring preventive healthcare strategies aimed at minimizing bone loss, particularly as these individuals age. Regarding this objective, the UCD T2DM polygenic rat model is likely to be a valuable animal model to study.
Author Contributions
Conceptualization, A.J.S., M.L.H. and R.D.P.; methodology, A.J.S., M.L.H. and R.D.P.; validation, R.D.P.; formal analysis, J.M., H.O. and R.D.P.; investigation, J.M., H.O., M.L.H., S.C., R.K.M., M.S., Y.H., A.-K.G., A.J.S. and R.D.P.; resources, A.J.S., M.L.H. and R.D.P.; data curation, J.M., H.O. and R.D.P.; writing—original draft preparation, J.M. and R.D.P.; writing—review and editing, J.M., A.J.S., M.L.H., S.C., M.S., A.-K.G., K.L.S., P.J.H. and R.D.P.; visualization, R.D.P.; supervision, A.J.S., M.L.H. and R.D.P.; project administration, A.J.S., M.L.H. and R.D.P.; funding acquisition, A.J.S., M.L.H. and P.J.H. All authors have read and agreed to the published version of the manuscript.
Funding
This research was funded by UT Austin College of Education Small Grants Program (MH) and NHLBI HL 144723 (AS), NIA/NIH R01 AG085572 (PJH).
Institutional Review Board Statement
The animal study protocol was approved by the Institutional Review Board (or Ethics Committee) of The University of Texas at Austin (protocol AUP-2022-0049, approved on 30 March 2022).
Informed Consent Statement
Not applicable.
Data Availability Statement
Data supporting the reported results are available upon request.
Acknowledgments
The authors have reviewed and edited the output and take full responsibility for the content of this publication.
Conflicts of Interest
The authors declare no conflicts of interest.
Abbreviations
The following abbreviations are used in this manuscript:
| T2DM | Type 2 Diabetes Mellitus |
| DM | Diabetes Mellitus |
| ZDF | Zucker Diabetic Fatty |
| PNA | Principal Nutrient Artery |
| UCD | University of California Davis |
| CTL | Control |
| HbA1c | Hemoglobin A1c |
| EtOH | Ethanol |
| mg | Milligram |
| kg | Kilogram |
| mm | Millimeter |
| μCT | Micro-Computed Tomography |
| kVp | Kilovoltage Peak |
| BV/TV | Bone Volume-to-Total Volume Ratio |
| Tb.Th | Trabecular Thickness |
| Tb.N | Trabecular Number |
| Tb.Sp | Trabecular Separation |
| Mg HA/cm3 | Milligram Hydroxyapatite per Cubic Centimeter |
| µm | Micron |
| Ct. | Cortical |
| OsVV | Ossified Vessel Volume |
| OsV.Th | Ossified Vessel Thickness |
| EndMT | Endothelial-to-Mesenchymal Transition |
| POVPC | 1-Palmitoyl-2-(5-oxovaleroyl)-sn-glycero-3-phosphocholine |
References
- Rosengren, A.; Dikaiou, P. Cardiovascular outcomes in type 1 and type 2 diabetes. Diabetologia 2023, 66, 425–437. [Google Scholar] [CrossRef] [Scilit]
- Ahlqvist, E.; Storm, P.; Käräjämäki, A.; Martinell, M.; Dorkhan, M.; Carlsson, A.; Vikman, P.; Prasad, R.B.; Aly, D.M.; Almgren, P.; et al. Novel subgroups of adult-onset diabetes and their association with outcomes: A data-driven cluster analysis of six variables. Lancet Diabetes Endocrinol. 2018, 6, 361–369. [Google Scholar] [CrossRef] [Scilit]
- Stidsen, J.V.; Henriksen, J.E.; Olsen, M.H.; Thomsen, R.W.; Nielsen, J.S.; Rungby, J.; Ulrichsen, S.P.; Berencsi, K.; Kahlert, J.A.; Friborg, S.G.; et al. Pathophysiology-based phenotyping in type 2 diabetes: A clinical classification tool. Diabetes Metab. Res. Rev. 2018, 34, e3005. [Google Scholar] [CrossRef] [Scilit]
- Hedevang Christensen, D.; Nicolaisen, S.K.; Ahlqvist, E.; Stidsen, J.V.; Nielsen, J.S.; Hojlund, K.; Olsen, M.H.; García-Calzón, S.; Ling, C.; Rungby, J.; et al. Type 2 diabetes classification: A data-driven cluster study of the Danish Centre for Strategic Research in Type 2 Diabetes (DD2) cohort. BMJ Open Diabetes Res. Care 2022, 10, e002731. [Google Scholar] [CrossRef] [Scilit]
- Viigimaa, M.; Sachinidis, A.; Toumpourleka, M.; Koutsampasopoulos, K.; Alliksoo, S.; Titma, T. Macrovascular Complications of Type 2 Diabetes Mellitus. Curr. Vasc. Pharmacol. 2020, 18, 110–116. [Google Scholar] [CrossRef] [Scilit] [PubMed]
- Galicia-Garcia, U.; Benito-Vicente, A.; Jebari, S.; Larrea-Sebal, A.; Siddiqi, H.; Uribe, K.B.; Ostolaza, H.; Martín, C. Pathophysiology of type 2 diabetes mellitus. Int. J. Mol. Sci. 2020, 21, 6275. [Google Scholar] [CrossRef] [Scilit]
- Faselis, C.; Katsimardou, A.; Imprialos, K.; Deligkaris, P.; Kallistratos, M.; Dimitriadis, K. Microvascular complications of type 2 diabetes mellitus. Curr. Vasc. Pharmacol. 2020, 18, 117–124. [Google Scholar] [CrossRef] [Scilit] [PubMed]
- Vestergaard, P. Discrepancies in bone mineral density and fracture risk in patients with type 1 and type 2 diabetes--a meta-analysis. Osteoporos. Int. 2007, 18, 427–444. [Google Scholar] [CrossRef] [Scilit]
- Janghorbani, M.; Van Dam, R.M.; Willett, W.C.; Hu, F.B. Systematic review of type 1 and type 2 diabetes mellitus and risk of fracture. Am. J. Epidemiol. 2007, 166, 495–505. [Google Scholar] [CrossRef] [Scilit] [PubMed]
- Schwartz, A.V. Efficacy of osteoporosis therapies in diabetic patients. Calcif. Tissue Int. 2017, 100, 165–173. [Google Scholar] [CrossRef] [Scilit]
- Bhatti, F.; Dadwal, U.C.; Valuch, C.R.; Tewari, N.P.; Awosanya, O.D.; de Andrade Staut, C.; Sun, S.; Mendenhall, S.K.; Perugini, A.J.; Nagaraj, R.U.; et al. The effects of high fat diet, bone healing, and BMP-2 treatment on endothelial cell growth and function. Bone 2021, 146, 115883. [Google Scholar] [CrossRef] [Scilit]
- Loder, R. The influence of diabetes mellitus on the healing of closed fractures. Clin. Orthop. Relat. Res. 1988, 232, 210–216. [Google Scholar] [CrossRef] [Scilit]
- Gortler, H.; Rusyn, J.; Godbout, C.; Chahal, J.; Schemitsch, E.H.; Nauth, A. Diabetes and healing outcomes in lower extremity fractures: A systematic review. Injury 2018, 49, 177–183. [Google Scholar] [CrossRef] [Scilit]
- Prisby, R. Mechanical, hormonal and metabolic influences on blood vessels, blood flow and bone. J. Endocrinol. 2017, 235, R77–R100. [Google Scholar] [CrossRef] [Scilit]
- Prisby, R. The clinical relevance of the bone vascular system: Age-related implications. Clin. Rev. Bone Miner. Metab. 2019, 17, 48–62. [Google Scholar] [CrossRef] [Scilit]
- Prisby, R. Bone Marrow Microvasculature. Compr. Physiol. 2020, 10, 1009–1046. [Google Scholar] [CrossRef] [Scilit]
- Le, T.; Sanchez, A.S.; Nashawi, D.; Kulkarni, S.; Prisby, R.D. Diabetes and the Microvasculature of the Bone and Marrow. Curr. Osteoporos. Rep. 2024, 22, 11–27. [Google Scholar] [CrossRef] [Scilit]
- Oikawa, A.; Siragusa, M.; Quaini, F.; Mangialardi, G.; Katare, R.G.; Caporali, A.; van Buul, J.D.; van Alphen, F.P.; Graiani, G.; Spinetti, G.; et al. Diabetes mellitus induces bone marrow microangiopathy. Arterioscler. Thromb. Vasc. Biol. 2010, 30, 498–508. [Google Scholar] [CrossRef] [Scilit] [PubMed]
- Peng, J.; Hui, K.; Hao, C.; Peng, Z.; Gao, Q.X.; Jin, Q.; Lei, G.; Min, J.; Qi, Z.; Bo, C.; et al. Low bone turnover and reduced angiogenesis in streptozotocin-induced osteoporotic mice. Connect. Tissue Res. 2016, 57, 277–289. [Google Scholar] [CrossRef] [Scilit]
- Stabley, J.; Prisby, R.D.; Behnke, B.J.; Delp, M.D. Type 2 diabetes alters bone and marrow blood flow and vascular control mechanisms in the ZDF rat. J. Endocrinol. 2015, 225, 47–58. [Google Scholar] [CrossRef] [Scilit] [PubMed]
- Prisby, R.; Swift, J.M.; Bloomfield, S.A.; Hogan, H.A.; Delp, M.D. Altered bone mass, geometry and mechanical properties during the development and progression of type 2 diabetes in the Zucker diabetic fatty rat. J. Endocrinol. 2008, 199, 379–388. [Google Scholar] [CrossRef] [Scilit] [PubMed]
- Cummings, B.P.; Digitale, E.K.; Stanhope, K.L.; Graham, J.L.; Baskin, D.G.; Reed, B.J.; Sweet, I.R.; Griffen, S.C.; Havel, P.J. Development and characterization of a novel rat model of type 2 diabetes mellitus: The UC Davis type 2 diabetes mellitus UCD-T2DM rat. Am. J. Physiol. Regul. Integr. Comp. Physiol. 2008, 295, R1782–R1793. [Google Scholar] [CrossRef] [Scilit]
- Nadeau, K.J.; Anderson, B.J.; Berg, E.G.; Chiang, J.L.; Chou, H.; Copeland, K.C.; Hannon, T.S.; Huang, T.T.-K.; Lynch, J.L.; Powell, J.; et al. Youth-onset type 2 diabetes consensus report: Current status, challenges, and priorities. Diabetes Care 2016, 39, 1635–1642. [Google Scholar] [CrossRef] [Scilit] [PubMed]
- Samora, M.; Huo, Y.; McCuller, R.K.; Chidurala, S.; Stanhope, K.L.; Havel, P.J.; Stone, A.J.; Harrison, M.L. Spontaneous baroreflex sensitivity is attenuated in male UCD-type 2 diabetes mellitus rats: A link between metabolic and autonomic dysfunction. Auton. Neurosci. 2023, 249, 103117. [Google Scholar] [CrossRef] [Scilit]
- Prisby, R. Bone marrow blood vessel ossification and “microvascular dead space” in rat and human long bone. Bone 2014, 64, 195–203. [Google Scholar] [CrossRef] [Scilit]
- Guderian, S.; Lee, S.; McLane, M.A.; Prisby, R.D. Progressive ossification of the bone marrow vasculature with advancing age corresponds with reduced red blood cell count and percentage of circulating lymphocytes in male Fischer-344 rats. Microcirculation 2019, 25, e12550. [Google Scholar] [CrossRef] [Scilit]
- Lee, S.; Prisby, R.D. Short-term intermittent PTH 1-34 administration and bone marrow blood vessel ossification in Mature and Middle-Aged C57BL/6 mice. Bone Rep. 2019, 10, 100193. [Google Scholar] [CrossRef] [Scilit]
- Acevedo, C.; Sylvia, M.; Schaible, E.; Graham, J.L.; Stanhope, K.L.; Metz, L.N.; Gludovatz, B.; Schwartz, A.V.; Ritchie, R.O.; Alliston, T.N.; et al. Contributions of Material Properties and Structure to Increased Bone Fragility for a Given Bone Mass in the UCD-T2DM Rat Model of Type 2 Diabetes. J. Bone Miner. Res. 2018, 33, 1066–1075. [Google Scholar] [CrossRef] [Scilit]
- Shanahan, C.M.; Crouthamel, M.H.; Kapustin, A.; Giachelli, C.M. Arterial calcification in chronic kidney disease: Key roles for calcium and phosphate. Circ. Res. 2011, 109, 697–711. [Google Scholar] [CrossRef] [Scilit] [PubMed]
- Yao, Y.; Jumabay, M.; Ly, A.; Radparvar, M.; Cubberly, M.R.; Boström, K.I. A role for the endothelium in vascular calcification. Circ. Res. 2013, 113, 495–504. [Google Scholar] [CrossRef] [Scilit]
- Yao, Y.; Jumabay, M.; Wang, A.; Boström, K.I. Matrix Gla protein deficiency causes arteriovenous malformations in mice. J. Clin. Investig. 2011, 121, 2993–3004. [Google Scholar] [CrossRef] [Scilit]
- Boström, K.I.; Jumabay, M.; Matveyenko, A.; Nicholas, S.B.; Yao, Y. Activation of vascular bone morphogenetic protein signaling in diabetes mellitus. Circ. Res. 2011, 108, 446–457. [Google Scholar] [CrossRef] [Scilit]
- Lee, S.; Bice, A.; Hood, B.; Ruiz, J.; Kim, J.; Prisby, R.D. Intermittent PTH 1-34 administration improves the marrow microenvironment and endothelium-dependent vasodilation in bone arteries of aged rats. J. Appl. Physiol. 2018, 124, 1426–1437. [Google Scholar] [CrossRef] [Scilit]
- Medici, D.; Shore, E.M.; Lounev, V.Y.; Kaplan, F.S.; Kalluri, R.; Olsen, B.R. Conversion of vascular endothelial cells into multipotent stem-like cells. Nat. Med. 2010, 16, 1400–1406. [Google Scholar] [CrossRef] [Scilit]
- Yao, J.; Wu, X.; Qiao, X.; Zhang, D.; Zhang, L.; Ma, J.A.; Cai, X.; Boström, K.I.; Yao, Y. Shifting osteogenesis in vascular calcification. JCI Insight 2021, 6, e143023. [Google Scholar] [CrossRef] [Scilit]
- Hsu, J.J.; Tintut, Y.; Demer, L.L. Regulation of cardiovascular calcification by lipids and lipoproteins. Curr. Opin. Lipidol. 2022, 33, 289–294. [Google Scholar] [CrossRef] [Scilit] [PubMed]
- Li, Y.; Zhang, Y.-X.; Ning, D.-S.; Chen, J.; Li, S.-X.; Mo, Z.-W.; Peng, Y.-M.; He, S.-H.; Chen, Y.-T.; Zheng, C.-J.; et al. Simvastatin inhibits POVPC-mediated induction of endothelial-to-mesenchymal cell transition. J. Lipid Res. 2021, 62, 100066. [Google Scholar] [CrossRef] [Scilit] [PubMed]
- Hu, X.-F.; Xiang, G.; Wang, T.-J.; Ma, Y.-B.; Zhang, Y.; Yan, Y.-B.; Zhao, X.; Wu, Z.-X.; Feng, Y.-F.; Lei, W. Impairment of type H vessels by NOX2-mediated endothelial oxidative stress: Critical mechanisms and therapeutic targets for bone fragility in streptozotocin-induced type 1 diabetic mice. Theranostics 2021, 11, 3796–3812. [Google Scholar] [CrossRef] [Scilit] [PubMed]
- Sheu, A.; Greenfield, J.R.; White, C.P.; Center, J.R. Contributors to impaired bone health in type 2 diabetes. Trends Endocrinol. Metab. 2023, 34, 34–48. [Google Scholar] [CrossRef] [Scilit]
- Pihoker, C.; Scott, C.R.; Lensing, S.Y.; Cradock, M.M.; Smith, J. Non-insulin dependent diabetes mellitus in African-American youths of Arkansas. Clin. Pediatr. 1998, 37, 97–102. [Google Scholar] [CrossRef] [Scilit]
- Rosenberg, J.L.; Schaible, E.; Bostrom, A.; Lazar, A.A.; Graham, J.L.; Stanhope, K.L.; Ritchie, R.O.; Alliston, T.N.; Lotz, J.C.; Havel, P.J.; et al. Type 2 diabetes impairs annulus fibrosus fiber deformation and rotation under disc compression in the University of California Davis type 2 diabetes mellitus (UCD-T2DM) rat model. PNAS Nexus 2023, 2, pgad363. [Google Scholar] [CrossRef] [Scilit] [PubMed]
- Fields, A.J.; Berg-Johansen, B.; Metz, L.N.; Miller, S.; La, B.; Liebenberg, E.C.; Coughlin, D.G.; Graham, J.L.; Stanhope, K.L.; Havel, P.J.; et al. Alterations in intervertebral disc composition, matrix homeostasis and biomechanical behavior in the UCD-T2DM rat model of type 2 diabetes. J. Orthop. Res. 2015, 33, 738–746. [Google Scholar] [CrossRef] [Scilit] [PubMed]

Disclaimer/Publisher’s Note: The statements, opinions and data contained in all publications are solely those of the individual author(s) and contributor(s) and not of MDPI and/or the editor(s). MDPI and/or the editor(s) disclaim responsibility for any injury to people or property resulting from any ideas, methods, instructions or products referred to in the content. |
© 2026 by the authors. Licensee MDPI, Basel, Switzerland. This article is an open access article distributed under the terms and conditions of the Creative Commons Attribution (CC BY) license.