


Abstract
Gravimetric mass loss in polymer–biogenic filler systems is often reported as polymer biodegradation without establishing which phase of the material is lost. This study proposes and applies an analytical framework that combines FTIR identification of the starting material, a phase balance ceiling, and removable inventory kinetics to assess such claims. Post-consumer cup plastic was blended with pyroconverted cassava (Manihot esculenta) peel dextrin in four matrix/dextrin/turpentine formulations (70/10/20 to 30/50/20% w/w) and exposed for 30 days to Aspergillus niger and A. fumigatus in Rivalier moist chambers with Sabouraud dextrose broth. FTIR revealed that the material sold as polypropylene contained polystyrene: the matrix ranged from essentially polystyrene (formulation B) to polypropylene-rich (C and D), as shown by the aromatic 755/697 doublet and a PS/PP spectral index spanning more than one order of magnitude. Mass loss profiles followed a first-order removable inventory model with rate constants of to (nominal residual solvent scenario) and inventory half-lives of 10–70 d. The removal rate increased with dextrin content ( for both species) with a reproducible reversal between 30 and 40% dextrin that survives explicit bounding of the specimen surface-to-volume covariate. Five of the eight conditions remained below the removable fraction ceiling even on a dry basis; the other three required residual solvent fractions of only 1.2, 1.9, and 11.9% w/w, below the 20% nominal loading, so that no observation requires degradation of the PP/PS matrix. A greenness assessment of the framework with AGREE (0.62), MoGAPI (77%), and AGSA (66.7%) places it above the confirmatory methods it is intended to gate (respirometry, high-temperature GPC), with low throughput, manual operation, and the biosafety of the fungal assay as its main remaining limitations. The framework provides a reproducible, low-burden basis for separating selective removal of biodegradable or volatile phases from evidence that can legitimately support polymer biodegradation claims.
1. Introduction
The accumulation of single-use plastics constitutes one of the most persistent environmental problems of the contemporary material economy. Polyolefins—polypropylene (PP) and polyethylene (PE)—and polystyrene (PS) dominate the disposable packaging fraction because of their low cost, light weight, and chemical stability; precisely the same properties that make them useful also turn them into wastes with century-scale persistence in landfills, soils, and water bodies [1,2,3]. The saturated carbon backbone of PP and PE, lacking hydrolyzable functional groups, and the pendant aromatic ring of PS offer very few sites for enzymatic attack, making the biological degradation of these polymers under environmental conditions extraordinarily slow [4,5,6,7].
The biological degradation pathway has generated a growing body of literature, but with highly heterogeneous quality. At one end are rigorous studies in which pure PP subjected to thermal or UV pretreatments yields first-order removal constants with maxima on the order of and half-lives of several tens of days only after pretreatment, with verification by spectroscopy and microscopy [8]. At the other end are numerous reports of PP mass losses of up to 60% attributed to microbial consortia, or losses of 16–45% in polyolefins over weeks of incubation, frequently without abiotic controls, verification of polymer identity, or phase mass balances [4,9,10,11]. This three-order-of-magnitude dispersion in the reported rates does not reflect biological variability; rather, it reflects a fundamental methodological problem. When the tested specimen contains biodegradable or volatile phases—starch, plasticizers, residual solvents, additives—gravimetric mass loss does not discriminate which component disappears, and the interpretation of “plastic biodegradation” remains unsupported unless it is verified against the chemical identity of the material and the mass balance of its phases [9,12].
The mechanisms by which filamentous fungi interact with polymer surfaces are partially characterized and explain both the potential and the limitations of the biological pathway. Initial colonization proceeds through hyphal adhesion and biofilm formation, mediated by hydrophobins that enable attachment to hydrophobic surfaces; subsequent chemical attack depends on the secretion of extracellular enzymes—laccases, peroxidases, esterases, and cutinases—whose effectiveness on saturated hydrocarbon chains is very limited unless oxidized groups have been introduced by abiotic pretreatment (thermo- or photooxidation), which act as points of entry [4,8,13,14,15,16,17,18,19]. In the absence of such groups, fungal activity on virgin polyolefins is restricted to slow surface erosion and utilization of accessible additives and phases [20,21,22,23,24]. The genus Aspergillus accounts for a substantial proportion of the isolates reported in plastic waste: A. niger is a reference amylolytic degrader, with a glucosidic enzyme system (amylases, glucoamylases) directly applicable to starch or dextrin phases, whereas A. fumigatus is notable for its ubiquity in landfills and compost and its ability to colonize diverse polymer surfaces [4,5,25]. This pair of species therefore constitutes a reasonable and reproducible biological test system for composites containing a carbohydrate phase.
The regional context adds applied motivation. Latin America is both a major producer of cassava—with the peel representing a proportional residual stream—and a region where plastic waste is predominantly managed through final disposal, with disposable packaging representing a visible and persistent fraction. A route that uses a derivative of an agro-industrial residue to modify the end-of-life of plastic waste—without requiring industrial composting infrastructure or imported biodegradable resins—has, if its limitations are stated honestly, a real application niche in short-service-life articles.
Polyolefin–starch blends have been studied since the 1970s, when Griffin introduced starch as a biodegradable filler in polyolefins [26], as a strategy to accelerate the disintegration of packaging: the polysaccharide phase acts as a preferential substrate for microbial attack, fragments the material, and increases the exposed surface area [9,27]. The accumulated evidence—including reprocessed PP/PBAT/thermoplastic starch blends [12] and olefinic elastomers with starches exposed to five fungal species [28]—converges on a consistent result: fungal attack is concentrated in the polysaccharide phase while the olefinic matrix persists; in the extreme case, the neat elastomer showed no mass loss throughout the entire cultivation period [28]. Thermogravimetric analyses of PP–starch blends after soil burial confirmed that degradation affects the starch-based additive rather than the PP matrix [9]. Despite this convergence, studies continue to be published that report composite mass loss as biodegradation of the host plastic.
In parallel, the valorization of cassava (Manihot esculenta) processing residues has gained momentum within the circular bioeconomy agenda. Cassava is the world’s fourth-largest starch crop, and its starch has well-characterized functional properties [29,30]. The peel—accounting for approximately 10% to 15% of tuber mass—is discarded or used as animal feed, despite containing a recoverable starch fraction; the valorization pathways explored include thermoplastic starch films, extruded biocomposites reinforced with peel fiber, coagulants for water treatment, and biorefinery substrates [31,32]. To the authors’ knowledge, none of these pathways converts peel starch into dextrin for incorporation as a biodegradable phase in blends with post-consumer plastics. Pyroconverted dextrin offers processing advantages over native starch (lower viscosity, greater solubility, and improved dispersion in hydrophobic matrices) arising from its lower molar mass and partially repolymerized structure [33,34].
The preceding review makes it possible to formulate precisely the three gaps addressed by this study. The first is material-related: the biodegradable phase used in blends with polyolefins has almost universally been native or thermoplastic starch from conventional sources—maize, potato, and cassava pulp [9,12,26,28,35,36]—and neither dextrin, whose processing advantages over native starch are documented [33,34,37] nor specifically dextrin derived from cassava peel starch has been reported as a sacrificial phase in post-consumer plastics. The second concerns the descriptor: gravimetric biodeterioration studies predominantly report final percentage mass losses at an arbitrary time rather than kinetic constants with their associated uncertainty; formal first-order quantification with half-lives, introduced for pretreated polypropylene by Samat et al. [8], has not been applied to compositional series of plastic/biogenic filler blends, which prevents comparison among systems and projection of behavior beyond the duration of each test [38]. The third concerns verification: in reporting practice, there is no explicit and systematic comparison between the observed mass loss and the inventory of biodegradable phases in the specimen, an omission that lies at the root of the inflated claims of “polyolefin biodegradation” highlighted by critical reviews of the field [4,20,39].
This work jointly closes these three gaps, and its contribution is articulated through four elements. First, it provides the first quantitative assessment of the behavior of pyroconverted cassava peel dextrin as a sacrificial phase in a post-consumer plastic matrix, establishing a “residue plus residue” pathway—agro-industrial filler combined with post-consumer plastic—that does not appear in the valorization agenda for cassava peel [29,31,32]. Second, it determines first-order kinetic constants with standard errors, half-lives, and a series-level analysis of variance across a compositional series of four formulations and two Aspergillus species, elevating the field’s descriptor from an isolated percentage to a transferable parameter. Third, it formalizes the mass balance ceiling criterion and the complementary sacrificial-phase utilization metric, proposed as a zero-cost standard verification against overinterpretation of gravimetric tests. Fourth, it demonstrates through independent spectral reassignment that a post-consumer stream labeled as polypropylene contained polystyrene in a proportion that varied between batches, thereby elevating prior FTIR verification of the material to a minimum reporting requirement in studies involving recycled plastics. Finally, because the framework is itself an analytical procedure, its greenness is assessed with three established metrics and discussed critically, together with the sustainability implications of the material route.
The study is organized around three falsifiable hypotheses: that the first-order kinetic constant of mass loss increases monotonically with dextrin content for both fungal species; that the cumulative loss is fully explainable by the biodegradable/volatile inventory of the specimen, that is, that the system exhibits selective phase removal rather than matrix biodegradation and that the effect of fungal species depends on the availability of carbohydrate substrate with dominance of the amylolytic degrader A. niger in dextrin-rich formulations and attenuation or reversal of the difference under substrate scarcity. The three hypotheses are quantitatively tested in Section 3 and resolved in Section 5.
The objective of the study is therefore threefold: (i) to quantify the mass loss kinetics of post-consumer plastic/cassava peel dextrin blends under attack by A. niger and A. fumigatus; (ii) to verify, through mass balance and FTIR spectroscopy, whether such loss is attributable to the biodegradable phase or to the synthetic matrix; and (iii) to derive from this verification a control framework applicable to the rigorous interpretation of gravimetric biodeterioration tests in plastic/biogenic filler composites. Anticipating the main conclusions, the mass loss is described by first-order kinetics based on the removable inventory, with a strongly positive but not strictly monotonic compositional dependence; the phase balance, subjected to sensitivity analysis with respect to residual solvent, is consistent with exclusive removal of the sacrificial phase, and the matrix—which was found to be a mixed PP/PS stream—does not need to be invoked to explain any observation. The remainder of the article is organized as follows: Section 2 describes the materials, the production and characterization of the dextrin, the preparation of the blends, the biodeterioration test, and the kinetic-statistical analysis; Section 3 reports the characterization of the raw materials, the spectral reidentification of the matrix, the kinetics, the mass balance, and the physicomechanical properties; Section 4 discusses the methodological implications, the greenness of the framework, and limitations; and Section 5 concludes.
2. Materials and Methods
2.1. Materials, Reagents, and Microorganisms
The plastic matrix was obtained from rigid, transparent, thermoformed post-consumer disposable cups (Selva brand, Lima, Peru), collected after use, washed with water and neutral detergent, rinsed with distilled water, air-dried, and manually reduced to fragments for dissolution. The chemical identity of this matrix was verified a posteriori by FTIR spectroscopy (Section 3.2); for the reasons established therein, the material is referred to throughout this article as “post-consumer matrix” rather than “PP”. Cassava peel (Manihot esculenta Crantz) was acquired from four different commercial establishments to capture the variability of the residue as generated within the distribution chain and was processed fresh. The reagents used were hydrochloric acid (HCl, analytical grade), anhydrous sodium sulfate (), iodine solution (for qualitative verification of polysaccharides), and commercial turpentine (Arquimax brand, Villa María del Triunfo, Lima, Peru), as the processing solvent. Commercial strains of Aspergillus niger and Aspergillus fumigatus were used as test microorganisms, selected because they represent, respectively, a reference amylolytic degrader and a species ubiquitous in plastic waste and compost with documented capacity to colonize polymer surfaces [4,5]; the physiological profiles of both species have been extensively described [40,41]. The culture medium was Sabouraud dextrose broth (dextrose 4 g, peptone 1 g, distilled water 100 mL; no agar), sterilized by autoclaving; the strains were commercial isolates whose collection designations were not recorded, which is stated as a reproducibility limitation in Section 4.11.
2.2. Extraction of Starch from Cassava Peel
Starch was extracted using the manual method of the International Center for Tropical Agriculture [42], traditionally employed in the rural cassava starch agro-industry, following the sequence: peel washing, wet grinding, filtration of the slurry through cloth (repeated until the wash water no longer exhibited a whitish coloration, typically three passes), starch sedimentation, supernatant siphoning, oven drying, grinding of the dried solid, and final sieving. Seven extraction runs were performed with initial peel masses ranging from 625 to 1500 g and water-to-solid ratios of 1:1 or 1:2 (Table 1). One run (No. 4) was entirely discarded: the sample underwent accidental freezing, and thawing with water caused the loss of sedimentable starch; the event is recorded as part of the process traceability and was not included in any subsequent characterization. The gravimetric starch yield was determined on one 500 g aliquot of peel from each of the four establishments (6.2, 4.8, 7.2, and 4.6% dry starch; mean 5.69 ± 1.24%, ).
Table 1.
Cassava peel starch extraction runs.
2.3. Physicochemical Characterization of the Cassava Peel and Starch
The cassava peel was characterized using samples from the four establishments by the following methods, with one sample per establishment () for moisture, total solids, ash, pH, fat, and starch yield, and in duplicate for fiber. Moisture and total solids (AOAC 14.004): oven drying at 105 °C to constant mass of ∼5 g aliquots in pre-weighed capsules, with gravimetric calculation of the water fraction and the complementary solids fraction. Ash (AOAC 31-012): furnace incineration of ∼5 g aliquots in pre-weighed crucibles to a white-gray residue of constant mass. Fat (AOAC 1980): organic solvent extraction of 2.5 g aliquots and gravimetric quantification of the extract; it should be noted that solvent losses during the operation may slightly bias this parameter, which is considered in the interpretation. Fiber (FIBERTEC method): sequential digestion and gravimetric determination of the residue in filtering crucibles. pH (COVENIN 1315/1979): direct potentiometry with simultaneous temperature recording (23.1–23.8 °C during the measurements).
The extracted starch was additionally characterized in terms of: gelatinization temperature (CIAT, 1995), by dispersing 10 g of starch in distilled water to a final volume of 100 mL, transferring 50 mL of the suspension to a beaker immersed in an 85 °C bath, and continuously stirring with a thermometer until gel formation and stabilization of the reading, which was recorded as the gelatinization temperature (triplicate); kinematic viscosity (ASTM D-4212, cup viscometer), based on triplicate efflux times (7.56, 7.50, and 7.04 s) converted using the instrument constant (35.03 ± 0.08 cSt); and cold water solubility, determined gravimetrically from the dissolved solid after equilibration and filtration. Qualitative verification of the starch identity was performed using iodine solution (characteristic blue coloration of the amylose–iodine complex).
2.4. Production of Dextrin by the Dry Route
Dextrinization followed the dry route with acid catalysis [33,34], selected over the wet route because of its lower process-water consumption and its ability to produce highly soluble yellow dextrins suitable as a dispersible phase. The protocol was as follows: (i) preparation of a water:starch suspension at a ratio of 1:2; (ii) acidification with 0.1 mol HCl to pH 3, the optimum value reported for dextrinization [33]; (iii) pre-drying of the acidified sample at 55–60 °C until moisture was below 5%, a condition required for the roasting process to proceed under dry conditions; and (iv) roasting at 150 °C until conversion to yellow dextrins, a class in which hydrolysis and repolymerization mechanisms occur sequentially [33]. During the wet stage of the process, gel formation was observed at 75–76 °C, with stabilization at 85 °C, consistent with the gelatinization temperature determined for this starch. The product was a yellow-brown powder with the adhesive–plasticizing behavior expected of dextrins. Its iodine test gave a blue coloration, i.e., a substantial fraction of helical amylose survived the roasting: the filler is a dextrin of low-to-moderate degree of conversion rather than a fully converted yellow dextrin [33,37]. No determination of molecular mass, reducing sugar content, or glycosidic linkage pattern was performed; the consequences for transferability are discussed in Section 4.11. An ATR spectrum was also acquired at INZIT on 0.5 g of the powder (record 2236-38-14-17143); as explained in Section 3.2, that record is not compatible with a polysaccharide and is therefore not used as evidence of the filler structure.
2.5. Preparation of the Blends and Specimens
The blends were obtained by the dissolution technique: fragments of the post-consumer matrix were dissolved in turpentine at 145 °C (a temperature that ensures dissolution of the polyolefinic and styrenic fractions in the hot terpene under simple thermal control), dextrin was incorporated under stirring until homogeneous dispersion was achieved, and the mass was pressed into plates and dried until free solvent was removed. Four formulations were prepared with matrix/dextrin/solvent ratios (% w/w): B = 70/10/20, C = 50/30/20, A = 40/40/20, and D = 30/50/20 (the letter identifies the formulation throughout the article and in the spectra). Three design decisions are explicitly justified. First, the nominal solvent fraction was kept fixed at 20% in all four formulations, so that the compositional space has a single degree of freedom (dextrin content, linked to matrix content by ); the constant nominal loading deliberately eliminates the initial solvent dose as a compositional factor, although it cannot be excluded that the residual fraction retained after drying depends on composition, an issue addressed in Section 3.6 and Section 4.7. Second, the four dextrin levels (10, 30, 40, and 50%) span the practical range of interest from the minimum to the maximum loading compatible with specimen integrity. Third, the process produces a physical blend: at 145 °C in turpentine, there is no mechanism for copolymerization or covalent crosslinking between the synthetic chains and dextrin; therefore, the term “copolymer”, frequently used in analogous literature, is chemically incorrect for this system and is not used. Specimens were cut manually from the pressed plates, which are porous and irregular rather than films of defined thickness; individual masses ranged from 0.012 to 0.445 g (analytical balance, 1 mg resolution). The mass dispersion inherent to manual cutting of such a material is reported in Section 3.3, where its possible influence on the kinetics through the specimen surface-to-volume ratio is bounded explicitly rather than assumed away.
2.6. Biodeterioration Test Experimental Procedure
The test followed the Rivalier moist chamber (slide culture) method [43]. Each specimen was placed on a sterile glass slide wetted with inoculated Sabouraud dextrose broth (0.08–1.17 g per chamber, median 0.32 g, obtained by differential weighing of the chamber before and after medium addition); the slide rested on a bent glass rod inside a glass Petri dish with a small water reservoir to maintain a saturated atmosphere (glass support and reservoir added 3–17 g to the chamber mass), and the closed chambers were kept at laboratory temperature for 30 days. The factorial design is summarized in Table 2: two fungal species × four formulations × three replicate chambers, plus three control chambers per fungus containing matrix processed with the same 20% solvent and without dextrin, complemented by sixteen chambers per fungus in which pure dextrin (0.5, 1, 1.5, and 2% of the medium mass; four replicates per level) was exposed to the same inoculum to verify qualitatively that both species colonize the filler. Two constraints of this design must be stated. First, the control specimens available were small (12–25 mg in five of the six chambers; 226 mg in one), which at 1 mg resolution precludes a meaningful mass loss series, and no specimen mass series was recorded for them; the controls are therefore not used quantitatively (Section 4.7). Second, no sterile (uninoculated) chamber with dextrin-containing specimens was included, so that biotic consumption and abiotic dissolution of the water-soluble dextrin into the medium film cannot be separated (Section 4.7).
Table 2.
Experimental design of the biodeterioration test.
The weighing protocol was as follows: at each sampling point, the specimen was removed from the slide, superficially cleaned to remove adhering mycelium and medium, weighed on an analytical balance, and returned to its slide. The analyzed time series correspond to the mean of the three replicates per condition; individual initial masses were retained. Two methodological decisions require explicit disclosure. First, the total mass of each chamber assembly was also recorded at each sampling point (Supplementary Table S1); however, this record isnot used as an indicator of fungal growth or degradation, because the mass loss of a periodically opened chamber is dominated by evaporation of the reservoir water and of the medium film and, to a lesser extent, by and respiratory vapor, and therefore lacks direct biological interpretation; its use as a proxy for growth—a practice observable in studies of this type—is thermodynamically invalid. Second, Sabouraud broth contains dextrose as a carbon source: the test therefore characterizes biodeterioration under non-carbon-limited conditions—the realistic scenario of plastic waste in contact with organic matter—rather than intrinsic biodegradability in a carbon-free medium as prescribed by standardized mineralization tests [44]; this boundary condition limits the scope of the conclusions and is revisited in Section 4.11.
2.7. FTIR Spectroscopy and Band Reassignment Criterion
The spectra of the final products B, C, and D were recorded by attenuated total reflectance (ATR) using a Shimadzu IRPrestige-21 spectrometer (Shimadzu Corporation, Kyoto, Japan). over 4000–600 at the Instituto Zuliano de Investigaciones Tecnológicas (INZIT, Venezuela; reports 2236-38-14-17139, -17140, and -17141); a fourth record (-17143) was obtained on the powder submitted as dextrin. All wavenumber ranges in this article are given in descending order, as read on the spectra. The traces shown in Figure 1 were digitized from the scanned records with a two-segment abscissa calibration (4000–2000 and 2000–600 , as printed by the instrument) anchored on the labeled band positions; checked against the 83 band positions labeled in the four reports, the residual positional error of isolated bands is below 15 (median 1–9 ), and the digitized traces are provided as Supplementary Material. The temporal status of these records must be stated precisely: they correspond to the composites as obtained after processing, before the biodeterioration test. Accordingly, in this work, FTIR evidence is used exclusively to establish the chemical identity of the phases in the starting material—not to claim spectral persistence of the matrix after incubation, a verification that would require paired initial/final spectra and is identified as pending in Section 4.11. The assignments in the original report were independently reviewed against published vibrational patterns of isotactic PP [45], atactic PS [46], and general functional groups [47,48], according to the following criterion: a band is assigned to a phase only if its position and relative intensity are compatible with the published pattern for that phase, and any band incompatible with the nominal identity of the material (in particular, any aromatic signal in a material declared as PP) requires reconsideration of that identity rather than forcing the assignment. The discrepancies identified between the original report and the reassignment are explicitly reported in Section 3.2, given their direct relevance to the identity of the matrix.
2.8. Physical and Mechanical Characterization of the Blends
The composites were characterized by flame test (instrumental protocol for plastic identification—combustion behavior upon removal from the burner, flame color, smoke odor, and residue); density (ASTM D792-08, by immersion); apparent melting point using the instrumental method; and tensile test using a Lloyd LR300K universal testing machine (Lloyd Instruments Ltd., Bognor Regis, West Sussex, UK). (force range 0–6000 N; stretching rate 0.01 mm ), recording maximum breaking force (MBF), maximum elongation, and maximum stress, with the original thermoformed material used as a reference. Only specimens from formulations A and C reached the geometry (thickness and dimensions) admissible by the equipment grips; those from B and D could not be tested, and this restriction is reported as observed, without extrapolation or imputation.
2.9. Kinetic Analysis
For each of the eight series (four formulations × two fungi), the first-order kinetic model was evaluated
where is the specimen mass on day t, is the initial mass, and k is the removal rate constant. The selection of the first-order model over the canonical alternatives is based on empirical discrimination: a mechanism limited by a constant external surface area would lead to zero-order kinetics (, linear loss), whereas a mechanism limited by diffusion through an increasingly depleted layer would lead to stronger deceleration than the exponential form (of the type ); the observed functional form is assessed using the coefficient of determination and residual analysis of the logarithmic linearization (Section 3.4). The first-order model also has a direct physical interpretation—removal rate proportional to the remaining mass of accessible substrate—and precedent as a comparative descriptor in fungal biodeterioration of polyolefins [8]; the determination of rates, rather than only final extents, is likewise recommended practice in modern plastic biodegradation assessment [38,49]. The empirical constant was estimated by linear regression of against the seven temporal points, with its standard error and ; it is used only as a descriptor within the 30-day observation window and is not assigned a half-life of the total mass, because the model in Equation (1) implies , and such extrapolation contradicts the central hypothesis of the study (persistence of the matrix). The physically consistent model adopted incorporates the non-removable asymptote by construction: defining the removable fraction and the conversion of the inventory , the following model is fitted:
The constant is estimated by regression of against t, and the half-life of the removable inventory, , is reported; unlike a half-life of the total mass, this quantity does have physical meaning under the intact matrix hypothesis. The asymptotic model with a free residual fraction, , was additionally evaluated by nonlinear least squares; with seven points and a 30-day observation horizon, the parameter was found to be unidentifiable (standard errors of 0.5–5.4 for estimates that collapse to the boundary), confirming that the asymptote should be fixed by composition rather than freely fitted, as stated herein.
2.10. Statistical Analysis
The unit of replication in this study is the series (one formulation × one fungus, mean of three chambers), because replicate-level trajectories were not retained. Inference was therefore restricted to what this structure supports. First, for each series the first-order slope and its standard error were obtained by ordinary least squares on the seven time points; this standard error describes fit precision within a series, not between-specimen variability, and it is reported as such. Serial correlation of the residuals was examined with the Durbin–Watson statistic, and the slopes were re-estimated by generalized least squares with an AR(1) error structure (Prais–Winsten) to check their robustness. Second, the effect of formulation was tested with a two-way additive analysis of variance on of the eight series (formulation as factor, fungal species as block, 3 residual degrees of freedom); the log scale was chosen because rate constants are compared as ratios. This design cannot test the formulation × species interaction, so the species comparison within each formulation is reported descriptively. Third, the monotonic association between dextrin content and was explored with Spearman’s coefficient ( per fungus), whose low power is acknowledged. Fourth, because specimen masses differ between series and the specimens are irregular fragments, the possible contribution of the surface-to-volume ratio to any between-series difference in was bounded with two limiting geometries: a surface-limited thin slab, for which , and a surface-limited compact fragment, for which . A bulk-limited process implies no dependence on . A difference in that exceeds the ratio predicted by the most conservative geometry cannot be attributed to specimen mass. No analysis of covariance pooling the seven time points of a series as independent observations is reported, since such p-values are not valid for repeated measurements.
Finally, the mass balance ceiling criterion was applied. For each condition, the total mass loss at 30 days, , was compared with the formulated biodegradable/volatile fraction of the specimen, , which is the maximum mass loss compatible with an intact matrix; the criterion is satisfied when . This fraction is obtained from the formulation through Equation (3):
Here, and are the nominal mass fractions of matrix and dextrin in the formulation (Section 2.5), and s is the mass fraction of residual solvent present in the specimen at . This quantity was not measured; because the specimens were dried until free solvent was removed, and because the balance must refer to the composition actually weighed at rather than to the initial wet formulation, the ceiling is evaluated as a sensitivity analysis between two extreme scenarios: dry basis (, minimum ceiling) and nominal loading (, maximum ceiling), and for each condition the threshold is reported, defined as the minimum residual solvent fraction that makes the observed loss compatible with exclusive removal of the sacrificial phase: . A loss exceeding would constitute gravimetric evidence of attack on the matrix; a loss between the two ceilings is compatible with phase removal provided that . Complementarily, sacrificial-phase utilization is defined as the ratio between the observed loss and its ceiling:
This ratio quantifies the fraction of the available biodegradable/volatile inventory effectively removed over the test horizon; is dimensionless and bounded within under the intact matrix hypothesis, and values close to unity indicate depletion of the inventory (anticipating kinetic saturation), whereas low values indicate remaining inventory. All calculations were performed in Python 3 (NumPy and SciPy); the complete analysis workflow is provided as reproducible supplementary material. All figures were generated at 600 dpi, labeled in English using a decimal point and without an internal title, in accordance with MDPI’s editorial convention.
3. Results
3.1. Characterization of the Cassava Peel, Starch, and Dextrin
Table 3 summarizes the physicochemical characterization of the cassava peel used as raw material, compared with reference values for the pulp [50]. The peel exhibits moisture and pH values comparable to those of the pulp, but a higher ash content (1.79% versus 0.5–1.5%), a four-fold higher fat content (0.82% versus 0.20%)—consistent with the concentration of lipids in the peripheral tissues of the tuber [51]—and, most importantly, a starch yield of only 5.69 ± 1.24%, compared with 92–98% for the pulp. This contrast defines the nature of the resource: the peel does not compete with the pulp as a starch source, but it makes an amylose-containing fraction of an otherwise discarded residue recoverable, which is precisely the logic of cascade valorization within the circular bioeconomy [32]. The dispersion among establishments is small for moisture, total solids, ash, fat, and pH (coefficients of variation below 5%), moderate for fiber (10%), and appreciable only for the starch yield (22%), which affects the recoverable quantity but not the quality of the extracted starch.
Table 3.
Physicochemical characterization of cassava peel (four samples from different commercial establishments; fiber in duplicate) and reference values for the pulp [50].
The extracted starch (Table 4) exhibited characteristics compatible with those of commercial cassava starch in terms of moisture, total solids, and pH, with two informative deviations: a gelatinization temperature slightly above the reference range (75.3 °C versus 58.7–70 °C), attributable to the greater hydration resistance of granules originating from cortical tissue [50], and very low cold water solubility (1.62%), as expected for unmodified native starch. The viscosity (35.0 cSt) was close to the reference value of 33 cSt [33]. Overall, the cassava peel starch is functionally equivalent to pulp starch for the purpose of dextrinization.
Table 4.
Physicochemical characterization of starch extracted from cassava peel (triplicate).
Dry-route dextrinization (pH 3, roasting at 150 °C) produced a yellow-brown dextrin that retained a blue iodine response, i.e., a partially converted product (Section 2.4). The pure dextrin chambers provided qualitative evidence that both fungi colonize the filler: light microscopy of the dextrin after 30 days showed hyphae, conidiophores, and sporulation on the dextrin mass, more conspicuous for A. niger than for A. fumigatus. These chambers did not provide a valid quantitative measure of dextrin consumption, because the only mass recorded was that of the whole chamber assembly, which is dominated by water evaporation. The intrinsic biodegradability of the pyroconverted dextrin is therefore supported qualitatively but not quantified, and the attribution of the mass loss of the blends to removal of the dextrin phase rests on the phase balance of Section 3.6 and on the spectroscopic evidence of Section 3.2, not on this preliminary test.
3.2. Spectral Identity of the Post-Consumer Matrix: A Methodological Warning
The FTIR-ATR spectra of the final products B, C, and D (Figure 1; Table 5) show that the matrix identity differs among formulations. The spectrum of formulation B is that of polystyrene: aromatic C–H stretching at 3082, 3059, and 3025 ; a single aliphatic C–H stretching band at 2918 without the bands at 2950 and 2870 ; ring vibrations at 1601 and 1492 ; the characteristic set at 1328, 1181, 1155, 1069, 1028, 965, 906, and 841 ; and the intense out-of-plane doublet of the monosubstituted ring at 755 and 697 (7% transmittance), whereas the diagnostic bands of isotactic PP (2950, 1376 intense, 1167, 998, and 973 ) are absent or negligible. Formulations C and D show the complete isotactic-PP fingerprint—C–H stretching at 2950, 2917, 2871, and 2838 ; / deformation at 1451 and 1375 ; helix regularity bands at 1169–1165, 997, 970, and 841–840 —together with the PS signature, strong in C (698 at 8% transmittance) and weaker in D (698 at 38%). A semi-quantitative PS/PP index, the absorbance ratio of the PS out-of-plane band to the PP symmetric deformation (, read from the digitized records), decreases from 10.1 (B) to 2.3 (C) and 0.67 (D); the aromatic-to-aliphatic C–H stretching ratio () follows the same order (0.42, 0.09, and 0.01). The three formulations were therefore prepared from cup fragments of different resin content, from essentially PS in B to PP-rich in D. Since ATR intensities depend on contact, these indices rank the formulations but do not quantify the PS mass fraction.
Table 5.
Revised assignment of the main FTIR bands of the final products, by formulation. PP: isotactic polypropylene; PS: polystyrene; DEX: carbohydrate (dextrin) phase.
Figure 1.
FTIR-ATR spectra of the final products B, C, and D, digitized from the original analytical records (INZIT 2236-38-14-17139, -17140, and -17141). Markers above each trace indicate the bands assigned to isotactic polypropylene (triangles), polystyrene (circles), the carbohydrate phase (squares), and carbonyl bands of tentative origin (diamonds); the assignment is detailed in Table 5.
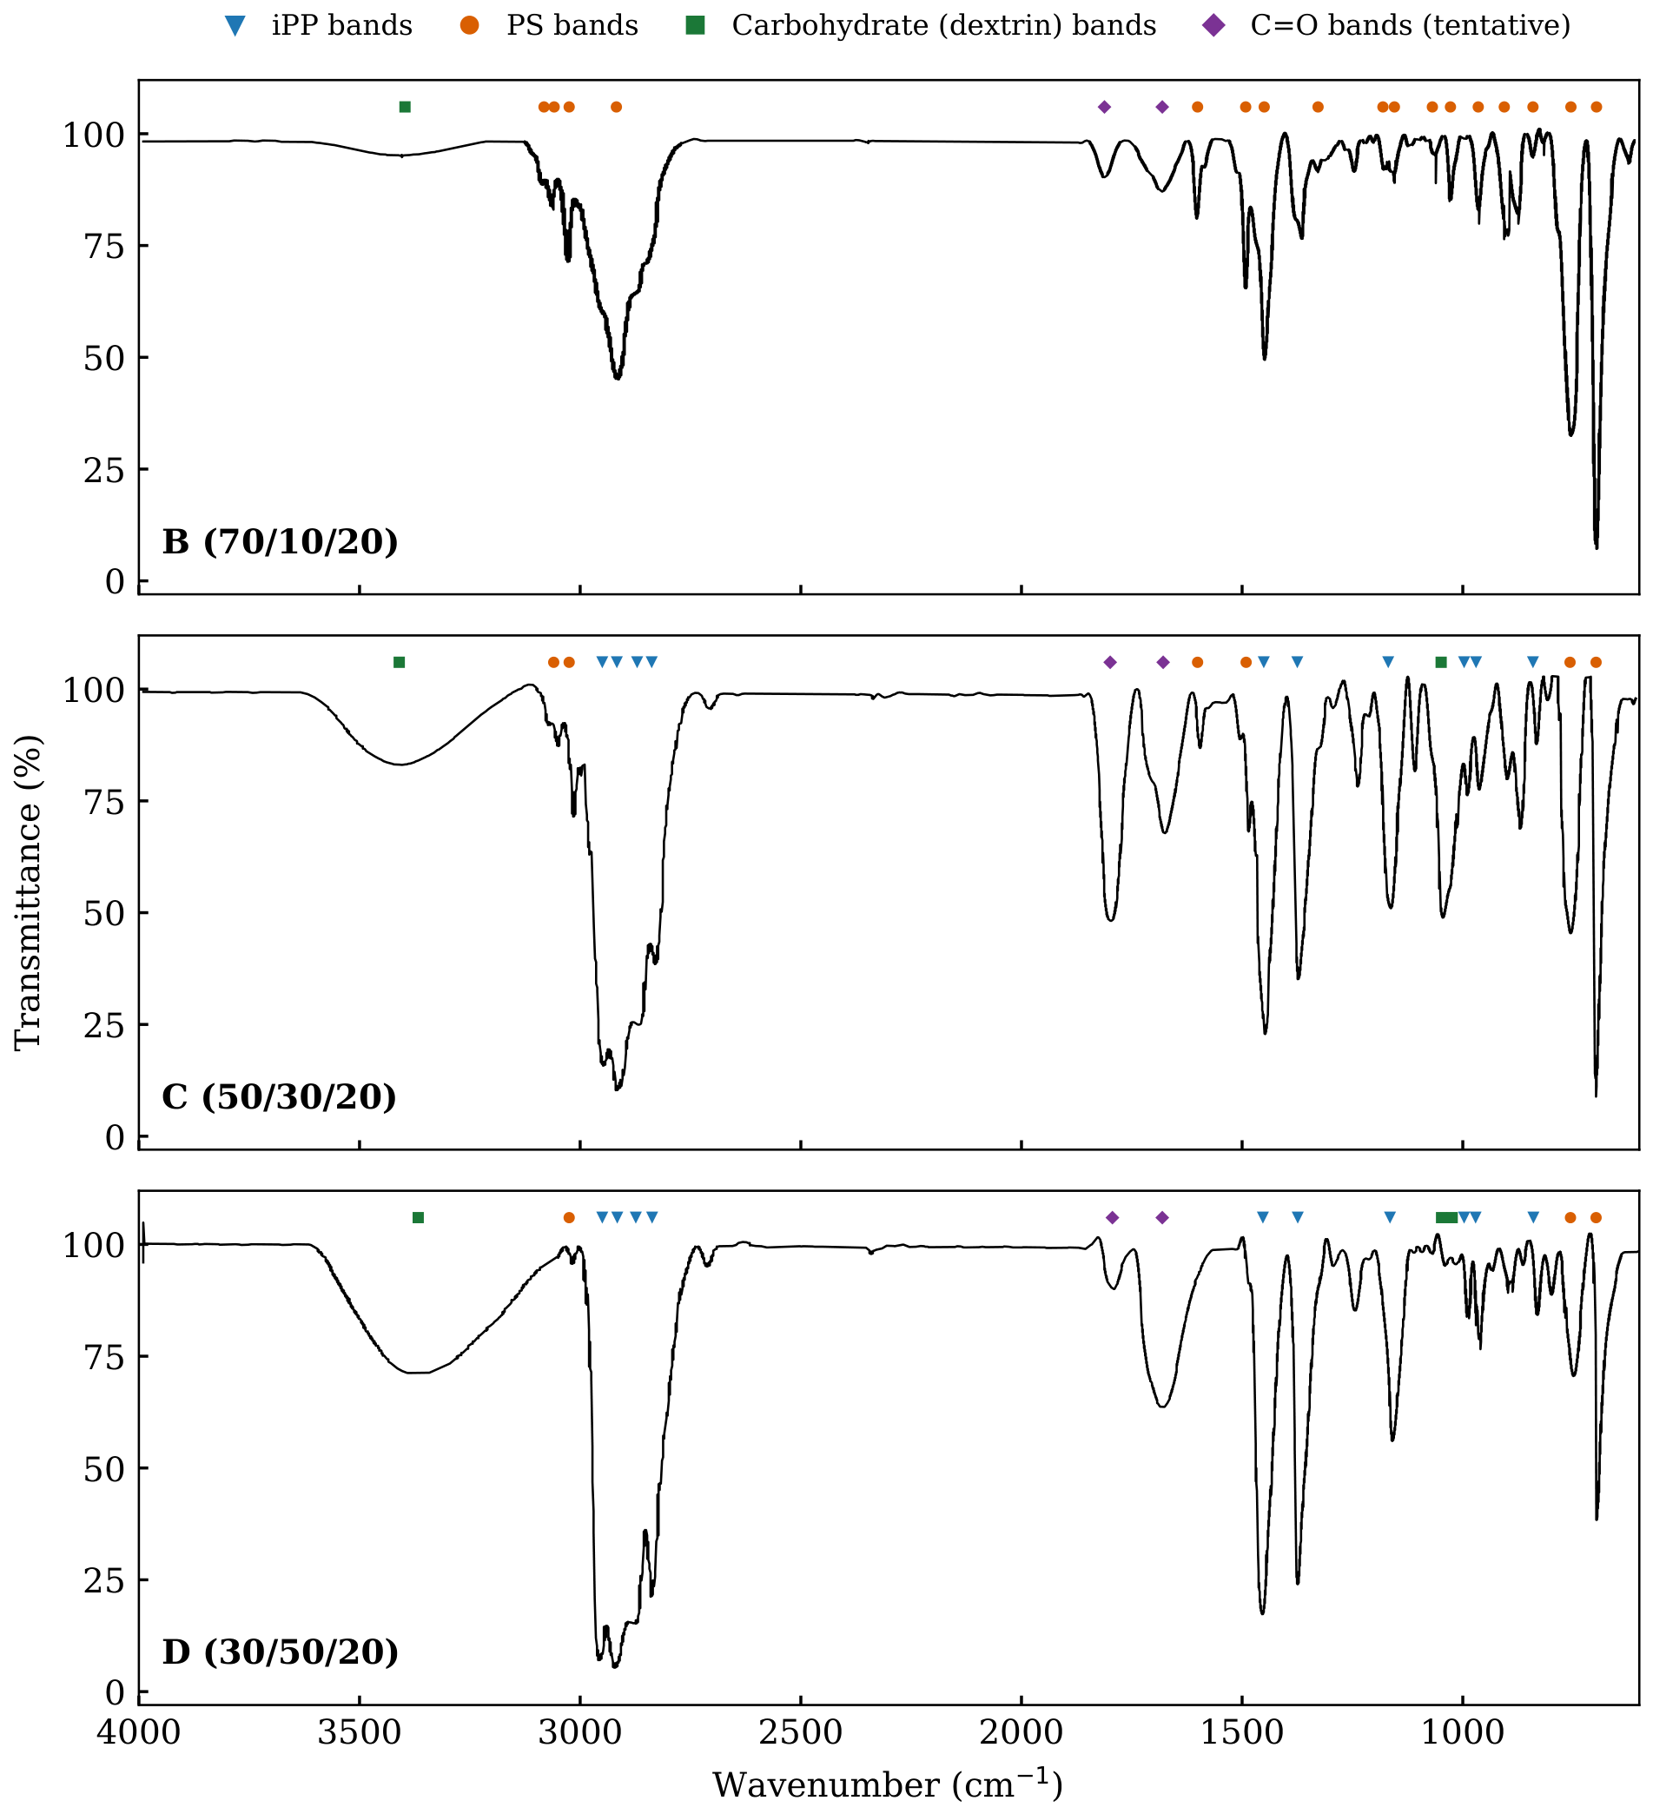
Since neither PP nor a carbohydrate contains any aromatic bonds, the only chemically consistent interpretation of the coexistence of both fingerprints is that the post-consumer cups constituted a mixed PP/PS stream of variable composition, in which the fragments used for formulation B were crystal polystyrene, which is also consistent with the dominant industrial practice of thermoforming rigid transparent cups from crystal polystyrene—and with the direct precedent of cassava starch–polystyrene composites reported in the literature [35], whereas thermoformed PP is typically translucent. It should be noted that the original analytical report assigned the bands at 964–971 to aromatic ethers (Ar–O––O–Ar) and the band at 840 to aromatic substitution; the independent review performed here reassigns them to PS (965 and 841 ) in B and to overlapping PS and isotactic-PP bands in C and D, whereas the 755/697 doublet and the 1601/1492 pair admit no assignment other than PS.
The carbohydrate phase is evidenced in the composites themselves: the O–H stretching absorbance at 3410–3367 increases with the dextrin loading (0.023, 0.081, and 0.147 absorbance units for 10, 30, and 50% dextrin, i.e., approximately in proportion), and the C–O/C–O–C envelope at 1049–1024 appears in C and D. Two carbonyl features, at 1812–1794 and 1681–1679 , are present in all three products and cannot be assigned unambiguously: the former is compatible with a strained lactone or anhydride, the latter with carbonyls formed by autoxidation of terpene residues or by the pyroconversion of the carbohydrate; both are recorded as tentative in Table 5. The ATR record obtained on the powder submitted as dextrin (INZIT 2236-38-14-17143; Supplementary Figure S4) shows no absorption whatsoever in the O–H stretching region, together with a very intense C=O band at 1778 and sharp, intense C–O bands at 1174–1042 ; such a spectrum is incompatible with any polysaccharide, whatever its degree of conversion. That record was therefore not used as evidence of the dextrin structure, and its origin (sample mix-up or contamination at the analytical service, or an artifact of the measurement) cannot be established a posteriori.
This finding has two consequences. The first is local and applies throughout the article: the study material is redefined as a post-consumer physical blend of (PP+PS)/dextrin/turpentine whose PP/PS ratio differs among formulations, and formulation B is treated as a PS/dextrin blend. The second is general: in biodegradation studies involving recycled or post-consumer plastics, identification of the polymer based on commercial labeling is not admissible; prior spectroscopic verification of the material, batch by batch, should be considered a minimum reporting requirement, at the same level as the abiotic control, because the correct attribution of any observed change depends on it.
3.3. Specimen Masses and the Surface-to-Volume Covariate
The initial masses of the averaged series (; Table 6) were 0.156, 0.367, 0.167, and 0.161 g for formulations A, B, C, and D with A. niger, and 0.118, 0.219, 0.115, and 0.107 g with A. fumigatus. Figure 2 compares these values with the masses of the individual replicate specimens derived from differential weighing of the chamber assemblies. For six of the eight groups the mean of the three assembly-derived masses coincides with to within 1 mg; for A with A. niger and D with A. fumigatus the assembly-derived values (mean 0.097 and 0.037 g) fall below by 60–70 mg, a discrepancy attributable to evaporation of the medium film between the two chamber weighings from which they are obtained. The series’ values, which are the direct specimen weighings that anchor the kinetics, are used throughout; the assembly-derived values of these two groups are shown as open symbols and not used further.
Table 6.
Kinetic parameters of mass loss (average series of three replicates). : empirical constant of total mass (window descriptor, Equation (1)); the standard error describes fit precision within a series. and : rate constant and half-life of the removable inventory (Equation (2), nominal base ). : inventory conversion at 30 days.
Figure 2.
Assembly-derived masses of the three replicate specimens per group (circles) and initial mass of the averaged series used for the kinetic analysis (horizontal bars), for A. niger (left) and A. fumigatus (right). Open circles: groups whose assembly-derived masses are inconsistent with (see text). The Control group corresponds to post-consumer matrix processed with solvent and without dextrin.
The dispersion of specimen masses matters because a surface-limited removal process would make depend on the surface-to-volume ratio of the specimen. Within each species the series A, C, and D have nearly identical (0.156–0.167 g with A. niger; 0.107–0.118 g with A. fumigatus), so that comparisons among these three formulations are free of this covariate under any geometry: the expected k ratio due to mass alone lies between 0.93 and 1.10 for the thin-slab limit and between 0.98 and 1.03 for the compact fragment limit. Formulation B is heavier (0.367 and 0.219 g), and the A. niger specimens were 1.3–1.7 times heavier than their A. fumigatus counterparts in all four formulations. The bounds implied by these ratios are used in Section 3.5 to decide which differences in can and cannot be attributed to specimen mass.
3.4. Mass Loss Kinetics
Figure 3 presents the evolution of the residual mass fraction for the four formulations under each fungus, together with the removable inventory model from Equation (2) under the nominal scenario. The empirical descriptor from Equation (1) described the eight series with coefficients of determination ranging from 0.955 to 0.998 (Table 6; linearization in Figure S1 and residual analysis in Figure S2 of the Supplementary Material), the residuals are bounded within logarithmic units in seven series and reach at the last point of D with A. fumigatus, and they share a mild curvature (negative at both ends, positive at intermediate times) that is the signature of the deceleration expected as the removable inventory depletes—the reason why the inventory-based model of Equation (2) is preferred over the total-mass descriptor; no initial lag phase is resolvable at the five-day sampling frequency.
Figure 3.
Residual mass fraction of the four formulations (matrix/dextrin/solvent, % w/w) during 30 days of incubation with A. niger (left) and A. fumigatus (right). The curves correspond to the removable inventory model from Equation (2), , under the nominal residual solvent scenario (), with according to Table 6.
Three observations emerge from Table 6. The first concerns the functional form: the empirical constant describes the observation window well, but its extrapolation lacks physical meaning (it would imply despite the persistence of the matrix) so that the physically meaningful parameter is , the rate constant of the removable inventory, whose half-lives (10.2 to 70.2 days on the nominal basis) represent the time required to remove half of the sacrificial phase rather than half of the total mass. The second concerns magnitude: —calculated under the nominal scenario of residual solvent retention, , and therefore dependent on this scenario through —spans nearly one order of magnitude within the same material system (9.9 to 67.8 ), and the extreme case—formulation C with A. niger, whose inventory reaches —exhibits the lowest of the series (0.858), precisely the behavior expected as the inventory approaches depletion. The third concerns composition and requires precision: the dependence of the rate on dextrin content is strongly positive but not strictly monotonic. The empirical ordering of according to dextrin content is for both species: formulation C (30%) exceeds A (40%) with both A. niger (19.4 versus 14.7 ) and A. fumigatus (16.4 versus 9.3 ), and the Spearman coefficient—, not , identical in both series—records exactly this deviation. The recurrence of the same local inversion in both fungal series argues against a species-specific anomaly and motivates the accessibility hypothesis—dextrin content would not be the only controlling variable, with the distribution, connectivity, and morphology of the dispersed phase emerging as a second variable—although the absence of replicate-level temporal trajectories prevents a formal variance-based test of this mechanism; the utilization metric develops this interpretation in Section 3.6.
3.5. Effect of Formulation and Microorganism
At the level of the series, the two-way additive analysis of variance on (formulation as factor, species as block) indicates a formulation effect (, ) and no main effect of species (, ); the same conclusion is reached on the linear scale (, ; , ). The primary evidence of the compositional effect is nevertheless its size—a factor of 10.3 and 4.3 in between the extremes—and its consistency across the two species. The within-series regressions are robust: Durbin–Watson statistics of 0.84–1.67 in seven series (3.24 in B with A. niger) indicate mild serial correlation, but the Prais–Winsten re-estimation changes the slopes by less than 1% and the standard errors by a factor of 0.5–1.2 (Supplementary Table S2), so that the limitation of the design is the absence of independent replicates, not the precision of the fits. Regarding the first hypothesis proposed in the Introduction, the verdict must be precise: it is refuted in its strict formulation—monotonicity is not satisfied between 30 and 40% dextrin—but supported as a global trend ( in both series). The local inversion is not an artifact of specimen mass: C and A have almost the same within each species (mass ratio 1.07 with A. niger, 0.97 with A. fumigatus), so that the ratio expected from surface-to-volume effects alone lies between 0.93 and 1.03, whereas the observed ratios are 1.32 and 1.76. Likewise, the difference between D and B (observed of 10.3 and 4.3) exceeds the largest ratio attributable to the lighter D specimens under the thin-slab limit (2.3 and 2.1). The reproducible inversion is therefore a finding, shifting the conceptual model from “more dextrin, higher rate” toward “inventory and accessibility”.
The comparison between fungi (Table 7; Figure 4a) must be read together with the specimen-mass covariate, because the A. niger specimens were 1.3–1.7 times heavier in every formulation. In formulations A, C, and D the fitted slope was higher for A. niger by factors of 1.58, 1.18, and 1.24, although the heavier specimens would have predicted ratios of 0.66–0.91 under a surface-limited process (Table 7); the advantage of A. niger with abundant carbohydrate substrate is therefore robust to the covariate and, if anything, underestimated. In formulation B—the formulation poorest in dextrin and, according to Section 3.2, the one whose matrix is essentially polystyrene—the ordering is reversed ( for A. fumigatus versus for A. niger, ratio 0.52); here the A. niger specimens were 1.68 times heavier, and the ratio expected from mass alone is 0.60 under the thin-slab limit and 0.84 under the compact fragment limit. The reversal is thus confounded with specimen mass and cannot be attributed to the species with the available data. The physiological interpretation—amylolytic advantage of A. niger when carbohydrate is abundant [4,5], and surface colonization advantage of A. fumigatus under scarcity—remains plausible for its first half and untested for its second; its verification would require enzymatic profiling and surface microscopy, which are beyond the scope of the present study. In terms of the proposed contrast, the third hypothesis is supported in its first component (dominance of A. niger in dextrin-rich formulations) and undetermined in its second (reversal under substrate scarcity).
Table 7.
Kinetic constants of the two fungi by formulation, with the specimen-mass covariate: initial mass of the series , observed ratio (A. niger)/ (A. fumigatus), and ratio expected from the surface-to-volume effect alone under the two limiting geometries (thin slab, ; compact fragment, ). A bulk-limited process predicts a ratio of 1.
Figure 4.
(a) Empirical constant by formulation and fungus (error bars: standard error of the regression). (b) Mass loss at 30 days versus the removable fraction under the two residual solvent scenarios: dry basis (, open symbols) and nominal (, filled symbols), connected by lines for each condition; the diagonal indicates the mass balance ceiling. Three conditions cross the diagonal only under the dry-basis scenario.
3.6. Mass Balance: Sensitivity Analysis of the Ceiling to Residual Solvent
The mass balance ceiling should refer to the composition of the specimen actually weighed at , and this composition depends on how much solvent remained after drying—a quantity that was not quantified. Figure 4b and Table 8 therefore present the contrast under the two extreme scenarios of Equation (3): dry basis () and nominal loading ().
Table 8.
Sensitivity of the mass balance to residual solvent: mass loss at 30 days, ceilings on a dry basis () and nominal basis (), utilization on both bases, and residual solvent threshold required for compatibility with exclusive removal of the sacrificial phase.
Under the nominal scenario, all eight conditions fall below the 1:1 diagonal: the maximum observed mass loss (55.9%, D with A. niger) is below its ceiling (70%), and the maximum inventory utilization is (C with A. niger). Under the dry-basis scenario, in contrast, three conditions exceed their ceiling: C with A. niger (), B with A. fumigatus (), and C with A. fumigatus (). The threshold quantifies the residual solvent required by each condition: 11.9%, 1.9%, and 1.2% w/w, respectively, with for the remaining five conditions. Consequently, the conclusion of exclusive removal of the sacrificial phase is conditional and explicit: it holds if the residual retention of turpentine in the specimens was at least 12% w/w in the most demanding case—a value well below the nominal loading of 20% and plausible for drying that removes free solvent but not solvent occluded within the polymeric mass—and it fails only under the extreme assumption of complete solvent removal, in which case the three aforementioned conditions would indicate unaccounted partial retention or the onset of attack on additional phases. Three independent lines of evidence support the former interpretation: the intact chemical identity required by the processing itself, the agreement with the literature on polyolefin–polysaccharide blends in which the matrix persists [9,12,28], and the explicit recognition in the state of the art that no microorganism capable of utilizing pure polypropylene as its sole carbon source has been reported [8]. Definitive discrimination requires quantification of the residual solvent (TGA, loss-on-heating, or gas chromatography) and paired FTIR spectra before and after incubation; both verifications are declared pending in Section 4.11. As an explicit propagation of this uncertainty, the Supplementary Material (Figure S3) reports for across the eight conditions, showing the magnitude of the shift in the kinetic constant as the residual retention scenario is varied. It must also be stated that the ceiling criterion is agnostic to the removal mechanism: dextrin dissolved into the medium film and dextrin consumed enzymatically on the specimen are both removals of the sacrificial phase, and the present design does not separate them (Section 4.7); the criterion tests whether the matrix must be invoked, not how the removable phase left the specimen.
Table 8 translates the same contrast into the utilization metric. Regardless of the scenario, the compositional pattern is robust: utilization is highest in the intermediate formulation C and lower at both extremes, a behavior visible in Figure 5b and consistent with the local inversion of between 30 and 40% (Figure 5a). The structural interpretation—stated as a hypothesis—is that at low content the dispersed phase remains largely occluded (inaccessible inventory), whereas at very high content the inventory increases faster than the effective attack front over 30 days, placing the accessibility optimum at intermediate compositions, close to the percolation threshold of the dispersed phase; its verification would require phase-morphology microscopy and extended-time experiments.
Figure 5.
Compositional dependence. (a) Empirical constant as a function of dextrin content: the overall dependence is positive, with a reproducible local inversion between 30 and 40% in both species. (b) Inventory utilization on a nominal basis (filled symbols) and dry basis (open symbols): three conditions exceed the depletion line under the dry-basis scenario, quantifying the sensitivity to residual solvent.
In summary, the defensible statement is as follows: the mass loss is consistent with removal of the sacrificial phase under any residual solvent retention equal to or greater than 12% w/w, with no observation requiring the assumption of matrix consumption; the second hypothesis is therefore conditionally corroborated, with the quantitative condition and the verifications required to close the argument explicitly identified. The contrast with the naive interpretation is at the heart of the article: a reader without phase analysis might have titled the study “56% polypropylene biodegradation in 30 days”; the phase analysis shows that such a claim is untenable.
3.7. Physical and Mechanical Properties of the Blends
Table 9 summarizes the physical characterization of the four formulations. Apparent densities ranged from 0.785 (A) to 1.00 g (D) without a monotonic dependence on composition; since the pressed plates are porous, these values reflect the porosity of each batch as much as the density of its phases. The apparent melting points (182–198 °C) exceed the reference range for PP (160–175 °C); in light of Section 3.2, this increase reflects the multiphase nature of the material—including the styrenic phase and the dispersed solid filler, which delay specimen collapse during an instrumental melting test—rather than an assumed crosslinking mechanism, which is chemically unfeasible in this system. In the flame test, all four formulations burned with a yellow flame with a blue center, a paraffin-like odor, and little residue, a behavior qualitatively dominated by the polyolefin fraction.
Table 9.
Physical properties of the blends and the reference matrix.
In tensile testing (Table 10), the maximum breaking force decreased from 250 N in the reference thermoformed matrix to 126 N in C (30% dextrin) and 32 N in A (40%), with maximum stresses of 0.78 and 0.20 MPa, respectively, compared with 1.3 MPa for the reference. This pattern is expected for a rigid particulate filler without interfacial compatibilization: the dispersed dextrin phase acts as a stress concentrator and embrittles the material, consistent with reports for starch fillers in polyolefins [9]. The greater elongation of A (34.1 mm) compared with C (3.75 mm) and the reference (25 mm) is reported as an observation without mechanistic interpretation, given the absence of mechanical replicates and the inability to test B and D because of geometric constraints of the equipment. The strength–biodegradability trade-off is nevertheless quantified: formulation C combines the highest strength among the tested blends (126 N; 60% of the reference in terms of stress) with removable inventory half-lives of 10.2–14.5 days under the nominal scenario, making it the natural candidate for short-service-life applications.
Table 10.
Tensile mechanical properties of the tested blends and the reference matrix (Lloyd LR300K). Formulations B and D did not meet the admissible geometry requirements of the equipment.
4. Discussion
4.1. What Gravimetric Mass Loss Demonstrates and What It Does Not
The central result of this work is not that the blends lose mass under fungal attack—an expected result repeatedly reported for polyolefin–polysaccharide systems [9,12,28]—but rather the demonstration that interpreting such mass loss requires an explicit phase analysis: under the nominal ceiling, all eight conditions can be fully explained without affecting the matrix, while the sensitivity analysis converts the previously implicit assumption regarding residual solvent into a quantified threshold () relative to a nominal loading of 20%. This demonstration turns the result into a useful methodological counterexample: a system that, when interpreted without the ceiling criterion, could have been titled “56% polypropylene biodegradation in 30 days” (a statement of the same type as those found throughout the literature and identified as inflated by recent critical reviews [4]) is fully consistent with selective removal of the sacrificial phase and does not require any attack on the matrix when interpreted using the ceiling criterion. The state of the art itself supports this interpretation at its current frontier: the reference literature recognizes that, to date, no microorganism capable of utilizing pure polypropylene as its sole carbon source has been reported [8]; therefore, any appreciable mass loss in a compound containing accessible phases should, unless demonstrated otherwise, be presumed attributable to those phases.
Comparison with the primary literature further reinforces this interpretation. In olefinic elastomers containing starch, the pure polymer did not lose mass throughout the entire cultivation period with five fungal species [28]; in PP–starch blends buried in soil, thermogravimetric analysis demonstrated that degradation affected the additive rather than the matrix [9]; and in reprocessed PP/PBAT/thermoplastic starch blends, fungal attack was concentrated in the biodegradable phases [12]. The present work adds two elements to this body of evidence: formal kinetic quantification (rate constants with standard errors and half-lives, rather than isolated final percentages) and the ceiling criterion as an explicit, zero-cost verification that we propose adopting as a reporting standard for gravimetric tests of plastic/bio-based filler composites.
4.2. Positioning of the Novelty Relative to the State of the Art
It is important to delimit precisely what this work adds relative to its closest precedents, because honesty about novelty is as essential as honesty about the data. Compared with Ramis et al. [9], who demonstrated by thermogravimetric analysis that in PP–starch blends buried in soil degradation affects the additive rather than the matrix, this work replaces starch with pyroconverted dextrin derived from a waste stream (peel rather than pulp), adds temporal kinetic resolution that burial experiments do not provide, and formalizes the phase contrast as a quantitative ceiling criterion. Compared with Shang et al. [28], who established the resistance of pure olefinic elastomer to attack by five fungi, this work provides the systematic compositional dependence of the kinetic constant across four filler levels and two species. Compared with de Oliveira et al. [12], who characterized preferential fungal attack on biodegradable phases in reprocessed PP/PBAT/thermoplastic starch blends, this work dispenses with the polyester compatibilizer—thereby isolating the recalcitrant matrix/sacrificial-phase pair—and adds the utilization metric . Compared with Kiatkamjornwong et al. [35], a direct precedent for polystyrene–cassava starch systems, this work employs a real post-consumer stream (with the finding of mixed and variable identity that this revealed) rather than virgin grafted resin. Finally, compared with Samat et al. [8], from whom the first-order kinetic descriptor is adopted, this work extends it from pretreated pure PP to compositional series of blends, a domain in which the descriptor had not previously been applied and in which, as shown in Table 11, it is particularly necessary for uncovering spurious comparisons. None of the five precedents combine waste-derived filler, post-consumer matrix, formal kinetic quantification, and phase balance verification; this combination, together with the four contribution elements stated in the Introduction, constitutes the specific contribution of this work.
Table 11.
First-order kinetic constants from this work compared with values reported or derived from the literature ( when the original study reports only final mass loss L at time t).
4.3. First-Order Kinetics as a Descriptor and Its Physical Interpretation
The adequacy of the first-order form across the eight series (; residuals within with the mild curvature discussed in Section 3.4, Figure S2 of the Supplementary Material) is itself informative. Removal limited by a constant external surface would produce zero-order kinetics (linear mass loss over time), whereas removal limited by diffusion through an increasingly depleted layer would produce stronger deceleration than the exponential form. The observed proportionality between rate and remaining mass is consistent with a mechanism in which the accessible dextrin phase is depleted in an approximately homogeneous manner—plausible for porous specimens in which the medium film reaches the dispersed phase throughout the fragment, where percolation of the dispersed phase continuously exposes new substrate as the preceding material is removed. The strong overall compositional dependence of k supports the same interpretation—a higher fraction of sacrificial phase results in a larger effective attack front—while the reproducible local inversion between 30 and 40% qualifies this interpretation in the appropriate direction: the connectivity and accessibility of the dispersed phase, rather than its quantity alone, govern the attack front, fully consistent with the maximum utilization observed at the intermediate composition.
The comparative value of the descriptor deserves emphasis in contrast to the prevailing practice of reporting only final percentages of mass loss. Two studies with identical final percentages may correspond to radically different kinetics (one approaching saturation and the other still in progress), while final percentages depend on the arbitrary duration of the test. The constant k and its half-life, by contrast, are transferable: they allow behavior to be projected to other time horizons and systems tested over different durations to be compared, as demonstrated by the reference [8] for pretreated PP. The availability of k with its standard error also enables a bounded comparison among conditions, of which this work provides a complete example (Table 7).
4.4. Quantitative Comparison with Constants Reported in the Literature
Table 11 positions the constants obtained in this work against those derivable from recent studies of fungal biodeterioration of polyolefins; for consistency with common practice in the literature, the comparison uses the empirical total-mass constant , with the extrapolation caveats already stated. When the original study reports only the final loss L at time t, the constant is estimated under the same first-order assumption as ; the exercise is approximate: it assumes the kinetic form, but it provides a homogeneous comparison that isolated percentages cannot. Three observations emerge. First, the formulation richest in dextrin, D (k of 22.2 and 27.5 with A. fumigatus and A. niger, respectively), exceeds every tabulated pure or pretreated polyolefin system, including the maximum value reported with thermal pretreatment ( [8]), and formulation C (16.4 and 19.4 ) matches or exceeds that pretreated-PP value; the comparison does not imply mechanistic equivalence (here, the sacrificial phase is removed rather than the polymer) but it quantifies the effectiveness of the filler strategy relative to pretreatment as an accelerator of disintegration. Second, the low-dextrin formulation B with A. niger ( ) falls within the range of untreated polyolefins attacked by environmental fungi, consistent with a minimal accessible inventory and with a styrenic matrix. Third, several high values reported in the literature for “polyethylene” or “polypropylene” without material characterization or phase controls—for example, the equivalent of for PE film in liquid medium [52]—are of the same order as those of our blends containing 30–50% biodegradable phase (Figure 6), illustrating exactly the interpretive risk that the ceiling criterion neutralizes: without phase balance, a constant of this magnitude is indistinguishable from the removal of additives, fillers, or oxidized fractions.
Figure 6.
First-order kinetic constants from this work (circles) compared with those reported or derived from the literature (squares; Table 11): PE film with A. niger, Ahmed et al. [52]; thermally pretreated PP with E. album, Samat et al. [8]; PE microplastics with A. niger, Safdar et al. [25]; LDPE with an Aspergillus consortium, D’Souza et al. [53]; and neat POE without filler with five fungi, Shang et al. [28].
4.5. Implications of the PP/PS Finding for Studies Using Recycled Materials
The spectroscopic reidentification of the matrix has implications that extend beyond this study. The increasing availability of post-consumer streams as research feedstocks—desirable from a circular economy perspective—introduces a systematic risk of misidentification: collection streams mix resins with similar appearances, commercial labeling provides manufacturer information rather than information about the collected batch, and different resins respond differently to biological attack, thermal processing, and analytical characterization. In this case, the PS signature coexists with the isotactic-PP fingerprint in C and D, whereas the fragments used for B were essentially PS: the PS/PP index spans more than one order of magnitude across the three formulations (Section 3.2). This gradient is a hidden covariate of the compositional series. B is at once the formulation with the least dextrin, the heaviest specimens, and a styrenic matrix, and its lowest mass loss cannot be attributed to any one of these factors alone. The ceiling criterion is unaffected, because PP and PS are both non-removable phases, but the transferability of for formulation B to a PP matrix is not established. The operational lesson is direct: prior FTIR verification of the material should be a reporting requirement in any biodegradation assay involving recycled or post-consumer plastics, and band assignments provided by external analytical services should be checked against reference spectra of the nominal polymer, because—as documented here—they may contain assignments incompatible with the declared material identity without this inconsistency being flagged in the report.
4.6. The Compositional Space as a Mixture Design: Correct Interpretation and Natural Extension
The four formulations tested belong to a restricted compositional space: with the solvent fraction fixed at 20%, the matrix and dextrin fractions are constrained by , such that the system has a single compositional degree of freedom and the four tested points (10, 30, 40, and 50% dextrin) are positions along the same segment of the mixture simplex. This structure has two interpretive consequences that should be made explicit. The first is negative: in a restricted mixture space, it is meaningless to refer to the “best condition” as the one in which both components are simultaneously at their maximum levels, because such levels are mutually exclusive on the simplex; any optimization must be formulated over the actual degree of freedom (dextrin content) and against an explicit objective function, which here is necessarily a trade-off. Table 6 and Table 10 show that the kinetic constant and mechanical strength evolve in opposite directions with increasing dextrin content. The second is constructive: the strong overall compositional dependence of k with the reproducible local inversion between 30 and 40% dextrin together with the maximum utilization at the intermediate composition (Table 8) suggests that a formal mixture design with axial points and genuine replicates would allow the optimum of the strength–degradability trade-off to be located with valid inference and canonical Scheffé models to be fitted for and mechanical properties while also releasing the solvent fraction as a second degree of freedom and controlling matrix identity and specimen geometry. This represents a natural experimental extension of the present work along the compositional axis.
4.7. Declared Confounders: Residual Solvent, Dissolution into the Medium, Catabolite Repression, and the Control
The processing solvent introduces a potential confounder that this work declares and bounds rather than ignores. Turpentine is volatile, and a residual fraction retained in the solid may evaporate during the 30-day incubation, contributing to mass loss through an abiotic pathway; terpenes also possess documented antifungal activity, which would introduce an inhibitory effect in the opposite direction. Honest treatment of this confounder requires two qualifications that are incorporated in this version. First, the constant nominal solvent loading (20% across the four formulations) reduces, but does not eliminate, the associated confounder: residual retention after drying may depend on composition—through the chemical affinity between the terpene and each phase, porosity, and morphology—such that constant initial loading does not guarantee constant residual retention, and this is explicitly acknowledged. Second, the sensitivity analysis in Section 3.6 quantifies exactly how much is required from the residual solvent in each condition: none in five of the eight conditions, and between 1.2 and 11.9% w/w in the remaining three—plausible requirements for drying that removes free solvent but not occluded solvent, although not verified. Definitive discrimination requires quantification of residual solvent in a newly prepared batch (thermogravimetric analysis, loss-on-heating, or gas chromatography of the extract) and a usable dextrin-free reference, extensions identified as priorities.
The slide culture geometry adds two confounders that a solid agar description would have hidden. First, the specimen rests on a film of liquid broth, and the pyroconverted dextrin is water-soluble: part of the removable inventory can therefore leave the specimen by dissolution into the film and be consumed there, or simply be lost during cleaning, without enzymatic attack on the solid. Second, the broth contains 4% dextrose, which represses the expression of amylolytic enzymes in Aspergillus through carbon-catabolite repression [54]; the enzymatic removal rates measured here are thus, if anything, lower than those attainable under carbon limitation, and the species contrast may be shaped by differential sensitivity to repression. Neither effect threatens the central conclusion because the ceiling criterion bounds the loss regardless of the removal mechanism, but both restrict the mechanistic reading: the kinetic constants are operational removal rates of the sacrificial phase under moist, inoculated, carbon-replete conditions, not rates of fungal digestion of the solid. The single experiment that separates the two pathways is a sterile chamber with the same dextrin-containing specimens, which was not included and is the first design priority for any replication.
The directions of the remaining biases are known even where their magnitudes are not: evaporation of residual turpentine inflates the apparent biological removal but not the total removable inventory (solvent is part of the ceiling); adhesion of mycelium or medium not removed by cleaning adds mass and underestimates the loss; mechanical loss of fragments of an embrittled specimen during cleaning overestimates it; and water uptake by the carbohydrate phase between cleaning and weighing underestimates it. Dextrin-free control was intended to bound the first of these, but its specimens (12–25 mg in five of six chambers) were too small for 1 mg gravimetry and no specimen series was recorded; the absence of a usable abiotic reference is therefore acknowledged as a limitation rather than replaced by an assumption.
4.8. Positioning Within Cassava Peel Valorization
Within the cassava-waste valorization agenda, the route quantified here occupies a specific niche. The dominant routes—thermoplastic starch films, peel-fiber biocomposites, and biorefinery approaches [31,32]—produce fully bio-based materials or reinforce virgin matrices. The peel-derived dextrin + post-consumer plastic route differs in objective: it does not produce a bioplastic but rather modifies, in a controlled manner, the end of life of an existing conventional plastic by using a waste-derived derivative as the modifier. Its merit should be evaluated in these terms: it accelerates partial disintegration (loss of the sacrificial phase, fragmentation, and increased exposed surface area) without claiming matrix mineralization, which was not measured. The conceivable application niche is short-service-life articles in which accelerated loss of structural integrity is functional to the end-of-life management scheme, with formulation C (50/30/20) representing the best strength–degradability trade-off among those tested; it should be emphasized that this work does not claim that such disintegration constitutes an environmental improvement, a claim that would require life-cycle assessment, mineralization measurements, and particle fate analysis. The reverse implication must be stated with equal honesty: accelerated fragmentation of a non-biodegradable matrix may generate microplastics more rapidly than the original material [55], and the net desirability of this strategy relative to mechanical recycling routes depends on the end-of-life management system, an assessment that falls within the scope of a life-cycle analysis beyond the present work.
4.9. Application and Scale-Up Perspectives
Transferring the route quantified here to any real-world application requires addressing three engineering issues that this work allows to be formulated precisely. The first concerns the processing route: dissolution in turpentine at 145 °C is suitable at the laboratory scale because of its simple thermal control, but it introduces the residual solvent confounder and a solvent recovery cost that would make it poorly competitive at scale; the obvious industrial alternative is melt mixing by extrusion, which eliminates the solvent from the system—and, with it, the volatile fraction of the ceiling in Equation (3), thereby simplifying the phase balance—at the cost of subjecting the dextrin to an additional thermal history whose effect on its biodegradability must be verified. The second concerns interfacial compatibilization: the decrease in mechanical strength documented in Table 10 is typical of a dispersed polar filler without coupling in a nonpolar matrix, and the incorporation of maleic-anhydride-grafted PP-type agents (PP-g-MA) is the standard approach for recovering part of the strength; its foreseeable side effect—improved interfacial adhesion implies a dispersed phase that is less accessible to biological attack—makes compatibilization another variable in the strength–degradability trade-off rather than a free improvement. The third concerns the identity and consistency of the post-consumer stream: the PP/PS finding in Section 3.2 implies that any scale-up requires either prior classification of the stream by resin (with the associated cost) or characterization of the behavior of the PP/PS blend as a matrix in its own right, accepting its variability. From an application perspective, the profile obtained—half-lives of the removable inventory ranging from 10.2 to 70.2 days under the nominal residual solvent scenario () modulated by composition, with a persistent matrix—defines the realistic niche: short-service-life articles whose end-of-life management could benefit from accelerated fragmentation and loss of structural integrity (e.g., temporary agricultural containment elements) while explicitly excluding any application requiring complete disappearance of the material, for which this strategy offers no evidence of effectiveness.
4.10. Greenness and Sustainability of the Verification Framework
The framework proposed here is an analytical procedure in its own right—identification of the starting material, gravimetric monitoring of the specimen, and a phase balance computation—and can therefore be assessed with the metrics of green analytical chemistry [56]. Three tools with published scoring rules and freely available software were applied: AGREE [57], which scores the twelve principles of green analytical chemistry on a 0–1 scale; MoGAPI [58], which assigns 3, 2, or 1 points to the fields of the analytical procedure, including whether it is quantitative, and reports the percentage of the maximum; and AGSA [59], which scores the twelve principles from 1 to 3 and reports the percentage of 36 points as the area of a twelve-pointed star. The system boundary is the analysis of one composite specimen: one ATR spectrum of the starting material (no sample preparation), one Rivalier chamber with 0.3 g of Sabouraud broth (median) and a few grams of reservoir water, seven weighings over 30 days, and the computation. The fabrication of the composite (dissolution in turpentine at 145 °C) and of the dextrin (acid roasting) are the sample, not the method, and are discussed separately below. Table 12 lists the input assigned to every criterion so that the assessment can be reproduced with the original software (the option selected in each software and the resulting criterion scores are given in Supplementary Table S3), and Figure 7 shows the resulting pictograms, generated with the original software of each metric. Where a criterion admitted more than one reading, the less favorable option was selected, and a step repeated over time (the seven weighings) was counted once. Two confirmatory procedures that the framework is intended to gate were assessed with the same logic for comparison: aerobic mineralization by respirometry under controlled composting (ISO 14855-1 [44]: 45–180 days at 58 °C, several hundred grams of compost inoculum per reactor, alkaline traps) and high-temperature gel permeation chromatography of polyolefins (ASTM D6474 [60]: dissolution in 1,2,4-trichlorobenzene at 140–160 °C).
Table 12.
Inputs of the greenness assessment of the verification framework and resulting scores. Criteria are numbered as in AGREE (1–12) and MoGAPI (fields 1–16); AGSA principles follow the AGREE numbering. Numbers in parentheses in the MoGAPI column identify the fields.
Figure 7.
Greenness pictograms of the verification framework, generated with the original software of each metric and reproduced without modification: (a) AGREE, twelve criteria colored by score with the overall score (0.62) at the center; (b) MoGAPI, fields colored green (3), yellow (2), or red (1), field 6 not applicable, central circle for a quantitative procedure (77%); (c) AGSA, twelve principles scored 1–3 and the resulting star area (66.67%; the software displays a decimal comma). Inputs in Table 12.
The three tools agree on the diagnosis. The framework scores 0.62 (AGREE), 77% (MoGAPI, just above the lower limit of the “excellent green” class, ≥75%), and 66.7% (AGSA), above the two confirmatory procedures in every metric (0.25–0.48; 60–67%; 53–61%), and its profile is sharply split. Its strengths are those of a solvent-free, derivatization-free procedure built on direct spectroscopy, gravimetry, and computation: no toxic reagents, bio-based culture medium, energy below 0.1 kWh per specimen because incubation proceeds at laboratory temperature, and a phase balance pillar that consumes nothing at all. Its weaknesses are equally clear and are intrinsic to any culture-based biodeterioration test: a 30-day duration that reduces throughput to less than one specimen per ten hours, manual and non-miniaturized operation, off-line positioning, several grams of biologically contaminated waste per specimen, and—the point that deserves most attention—the use of A. fumigatus, an opportunistic human pathogen handled at biosafety level 2 [41], in chambers that are opened seven times. This hazard is reflected only in AGSA, because the safety criteria of AGREE and MoGAPI are restricted to chemical hazards. The last item is the single modification with the largest effect on both greenness and practicability: for routine application of the framework, a biosafety-level-1 amylolytic species (A. niger alone, or a Trichoderma isolate) should replace A. fumigatus, the chambers should be autoclaved before disposal, and the assay should be run in a biological safety cabinet.
The environmental argument of the framework does not, however, lie in these scores but in its position in a tiered strategy. The ceiling criterion is a gate: only when the observed loss exceeds the removable inventory does the claim of matrix degradation need the confirmatory methods—respirometry over months or chromatography in hot chlorinated solvent—whose burden the metrics quantify. In the present study, the gate closed for all eight conditions under the nominal solvent scenario and for five of eight on a dry basis, i.e., the heavier methods would have been justified, at most, for three conditions. This is also where the honesty of the assessment must be complete: the verifications that this article leaves pending (thermogravimetry or gas chromatography of the residual solvent, paired spectra after incubation, respirometry) are precisely the less green ones, so that part of the framework’s favorable profile is a consequence of its incompleteness rather than a merit of its design. Finally, greenness is not sustainability. The route that produces the specimens—dissolution in turpentine at 145 °C with the associated VOC emission and solvent recovery burden and acid roasting of the starch—would score poorly under any of these tools, and the net environmental desirability of dextrin-filled post-consumer plastics depends on end-of-life fate and microplastic generation, which require life-cycle assessment (Section 4.8). What the framework offers in sustainability terms is accessibility: an analytical balance, glassware, a culture medium, and an FTIR service are sufficient to apply the ceiling criterion, which places a rigorous first-tier verification of biodegradation claims within reach of laboratories that cannot afford respirometric or chromatographic infrastructure.
4.11. Limitations
This study should be interpreted in light of the following explicit limitations.
First: no direct evidence of matrix invariance. No evolution measurements (ISO 14855/14852), gel permeation chromatography, or paired FTIR spectra after incubation were obtained; the available spectra establish the identity of the starting material only. The statement that no observation requires matrix attack rests on the phase balance with its stated sensitivity and on convergence with the literature on polyolefin–polysaccharide systems, not on a demonstration of chemical invariance.
Second: residual solvent not quantified and no usable abiotic reference. The fraction of turpentine retained in the specimens at was not measured; the sensitivity analysis in Section 3.6 formally bounds its consequences (maximum required threshold relative to a nominal loading of 20%) but does not eliminate them, and retention may also depend on composition. The dextrin-free control specimens were too small for gravimetric kinetics and no sterile chamber with dextrin-containing specimens was included so that evaporation, dissolution into the medium, and fungal consumption are not separated. Direct quantification (TGA, loss-on-heating, or GC) is the highest-yield individual verification still pending.
Third: identifiability of the asymptotic model. Free fitting of the residual fraction proved non-identifiable with seven data points and a 30-day time horizon; the asymptote must be fixed by composition (Equation (2)), and its empirical estimation would require substantially longer experiments.
Fourth: averaged series without individual trajectories. The unit of replication is the series; the inference on formulation effects has three residual degrees of freedom, the species main effect is not detectable, and the formulation × species interaction cannot be tested. The replicate masses of two groups are known only from assembly weighings that are inconsistent with the direct specimen weighings (Section 3.3).
Fifth: carbon-replete medium. Sabouraud broth contains dextrose; the assay characterizes removal under non-carbon-limited conditions, with catabolite repression of amylolysis, and is not equivalent to standardized intrinsic-biodegradability tests.
Sixth: incomplete characterization of the filler. The dextrin was characterized by its iodine response (blue, i.e., partial conversion), gelatinization behavior, and the O–H band of the composites; degree of conversion, molecular mass, and linkage pattern were not determined, and the ATR record obtained on the powder is incompatible with a polysaccharide and unusable. The intrinsic biodegradability of the filler was verified qualitatively (colonization) but not quantified. Transferability of the constants to dextrins of other roasting severities is therefore not established.
Seventh: matrix composition variable across formulations. The PP/PS ratio differs among the three formulations, from essentially PS in B to PP-rich in D and was not quantified; quantification by calibrated spectral deconvolution, DSC, or TGA of the starting material is the natural pending verification. It is a hidden covariate of the compositional series, together with specimen mass in formulation B.
Eighth: specimen geometry. The specimens are irregular porous fragments; the influence of the surface-to-volume ratio was bounded with limiting geometries rather than measured, and standardized specimen geometry is a requirement for any replication.
Ninth: strains and biosafety. The collection designations of the commercial strains were not recorded, and the containment conditions under which A. fumigatus was handled are not documented.
These limitations constrain the evidentiary scope of the results, but not the structure of the proposed verification framework, which constitutes the central methodological contribution of this work.
5. Conclusions
The mass loss kinetics of physical blends of post-consumer plastic with pyroconverted dextrin derived from cassava peel were quantified under attack by Aspergillus niger and Aspergillus fumigatus, and the interpretation of the results was subjected to a three-component verification framework: verified chemical identity of the starting material, a phase balance ceiling, and kinetics formulated on the removable inventory. The three hypotheses proposed in the Introduction were tested with the rigor that each permit, and their verdicts—one partial refutation that constitutes a finding, one conditional corroboration, and one hypothesis supported in its first component and undetermined in its second—articulate the conclusions.
Regarding the kinetics, the physically consistent description of the process is the first-order model applied to the removable inventory, , which incorporates by construction the asymptote corresponding to the non-removable matrix; its constants range from to under the nominal scenario —on which depends explicitly through —and its half-lives—the only quantity in the inventory with physical a meaning under the persistent matrix hypothesis—range from 10.2 to 70.2 days. The first hypothesis is therefore refuted in its strict formulation but corroborated as a global trend: the compositional dependence of the rate is strongly positive ( for both species) but exhibits a reproducible local inversion between 30 and 40% dextrin, identical in the two independent biological series and not attributable to specimen mass, shifting the conceptual model from “more inventory, higher rate” toward joint control by inventory and accessibility of the dispersed phase—an interpretation reinforced by the maximum utilization at the intermediate composition (0.90 on a nominal basis).
Regarding the attribution of mass loss, the second hypothesis is conditionally corroborated, with the condition quantitatively established: under the nominal ceiling, none of the eight conditions exceeds its removable fraction, whereas under the extreme assumption of complete solvent removal, three conditions would exceed it, requiring residual turpentine retention of only 1.2 to 11.9% w/w—compared to a nominal loading of 20%—to restore compatibility. The parsimonious interpretation, supported by the phase identity established by FTIR, convergence with the literature on polyolefin–polysaccharide blends, and the recognition in the state of the art that no reported microorganism utilizes pure polypropylene as its sole carbon source, is selective removal of the sacrificial phase, by dissolution into the medium and fungal consumption in proportions that the present design cannot separate; definitive closure requires quantification of the residual solvent and paired spectra before/after incubation, both of which have been identified and prioritized as necessary verifications.
Regarding the effect of species, A. niger exhibits higher rates than A. fumigatus in the dextrin-rich formulations A, C, and D, a difference that survives and is if anything underestimated by the specimen-mass covariate, consistent with its amylolytic specialization; the reversal observed in formulation B is confounded with specimen mass and matrix identity (essentially polystyrene) and remains undetermined.
The central value of the work, however, does not lie in the material itself but in the framework: the operational demonstration that gravimetric mass loss is not equivalent to plastic biodegradation, and that its interpretation requires, jointly, verified chemical identity, phase balance with explicit sensitivity to volatile components, and kinetics formulated on the inventory that is actually removable. Applied to this system itself, the framework converted a naive interpretation—“56% polypropylene biodegradation in 30 days”—into a defensible and bounded conclusion; applied to the field, it provides a zero-cost honesty check whose omission lies at the root of many inflated claims in the literature. The collateral finding of material identity—polystyrene, in a proportion that varied between batches, under the commercial labeling of polypropylene—also elevates prior spectroscopic verification of the material to a minimum requirement in studies involving recycled plastics. Assessed with AGREE, MoGAPI, and AGSA, the framework is greener than the confirmatory methods that it is designed to gate, and its remaining environmental burdens—duration, manual operation, and the biosafety of the fungal assay—are identified together with the modifications that would remove them.
Future work should be prioritized according to evidentiary yield: first, quantification of residual solvent, a sterile chamber with dextrin-containing specimens, and paired initial/final FTIR spectra; subsequently, respirometry and gel permeation chromatography, preservation of replicate-specific trajectories, standardized specimen geometry, quantification of the PP/PS ratio, and extended-time experiments capable of identifying the asymptote and testing the accessibility hypothesis through phase-morphology microscopy.
Supplementary Materials
The following supporting information can be downloaded at: https://www.mdpi.com/article/10.3390/analytica7040074/s1. Figure S1: Linearization versus incubation time; Figure S2: Residuals of the fits of Figure S1; Figure S3: Rate constant of the removable inventory ; Figure S4: ATR record INZIT 2236-38-14-17143; Table S1: Chamber-assembly masses of the thirty polymer chambers at day 0; Table S2: Regression diagnostics of the eight weighing series; Table S3: Options selected in the original software for the verification framework and resulting criterion scores; Table S4: Criterion-by-criterion scores of the two comparison procedures; Table S5: Complete weighing series of the biodeterioration test.
Author Contributions
Conceptualization, S.M.N.G., R.J.B. and Y.C.A.; methodology, S.M.N.G., R.J.B. and Y.C.A.; software, Y.C.A.; validation, S.M.N.G., S.V.N.G., N.J.C.R., G.A.B.C., R.J.B. and Y.C.A.; formal analysis, R.J.B. and Y.C.A.; investigation, S.M.N.G., S.V.N.G., N.J.C.R. and G.A.B.C.; resources, S.M.N.G., S.V.N.G. and N.J.C.R.; data curation, S.M.N.G. and Y.C.A.; writing—original draft preparation, S.M.N.G. and Y.C.A.; writing—review and editing, S.M.N.G., S.V.N.G., N.J.C.R., G.A.B.C., R.J.B. and Y.C.A.; visualization, Y.C.A.; supervision, R.J.B. and Y.C.A.; project administration, S.M.N.G. and Y.C.A. All authors have read and agreed to the published version of the manuscript.
Funding
This research received no external funding.
Institutional Review Board Statement
Not applicable.
Informed Consent Statement
Not applicable.
Data Availability Statement
The complete weighing series, the specimen and chamber masses, the digitized spectra, and the reproducible analysis workflow are provided as Supplementary Material. The primary laboratory records were generated in the M.Sc. thesis of the first author [61]; the Supplementary Material documents the correspondence between the summaries reported in the thesis and the complete weighing series used here. Original laboratory records are available from the corresponding author upon reasonable request.
Conflicts of Interest
The authors declare no conflict of interest.
Abbreviations
The following abbreviations and symbols are used in this manuscript:
| AGREE | Analytical GREEnness metric |
| AGSA | Analytical Green Star Area |
| ATR | Attenuated total reflectance |
| DEX | Pyroconverted dextrin (carbohydrate) phase |
| FTIR | Fourier-transform infrared spectroscopy |
| MBF | Maximum breaking force |
| MoGAPI | Modified Green Analytical Procedure Index |
| PE | Polyethylene |
| PP | Polypropylene |
| PS | Polystyrene |
| Empirical total mass loss constant (30-day window) | |
| Kinetic constant of the removable inventory | |
| Half-life of the removable inventory () | |
| X | Conversion of the removable inventory |
| Removable fraction of the specimen | |
| Utilization of the sacrificial phase | |
| s | Residual solvent fraction in the specimen at |
| Minimum residual solvent fraction compatible with exclusive phase removal |
References
- Geyer, R.; Jambeck, J.R.; Law, K.L. Production, use, and fate of all plastics ever made. Sci. Adv. 2017, 3, e1700782. [Google Scholar] [CrossRef] [Scilit] [PubMed]
- Jambeck, J.R.; Geyer, R.; Wilcox, C.; Siegler, T.R.; Perryman, M.; Andrady, A.; Narayan, R.; Law, K.L. Plastic waste inputs from land into the ocean. Science 2015, 347, 768–771. [Google Scholar] [CrossRef] [Scilit] [PubMed]
- Barnes, D.K.A.; Galgani, F.; Thompson, R.C.; Barlaz, M. Accumulation and fragmentation of plastic debris in global environments. Philos. Trans. R. Soc. B 2009, 364, 1985–1998. [Google Scholar] [CrossRef] [Scilit] [PubMed]
- Sutkar, P.R.; Dhulap, V.P. Advancements in polypropylene biodegradation: A comprehensive microbial and analytical review. Sustain. Chem. Environ. 2025, 9, 100213. [Google Scholar] [CrossRef] [Scilit]
- Alshehrei, F. Biodegradation of synthetic and natural plastic by microorganisms. J. Appl. Environ. Microbiol. 2017, 5, 8–19. [Google Scholar]
- Zhang, N.; Ding, M.; Yuan, Y. Current advances in biodegradation of polyolefins. Microorganisms 2022, 10, 1537. [Google Scholar] [CrossRef] [Scilit] [PubMed]
- Tokiwa, Y.; Calabia, B.P.; Ugwu, C.U.; Aiba, S. Biodegradability of plastics. Int. J. Mol. Sci. 2009, 10, 3722–3742. [Google Scholar] [CrossRef] [Scilit] [PubMed]
- Samat, A.F.; Carter, D.; Abbas, A. Biodeterioration of pre-treated polypropylene by Aspergillus terreus and Engyodontium album. npj Mater. Degrad. 2023, 7, 28. [Google Scholar] [CrossRef] [Scilit]
- Ramis, X.; Cadenato, A.; Salla, J.M.; Morancho, J.M.; Vallés, A.; Contat, L.; Ribes, A. Thermal degradation of polypropylene/starch-based materials with enhanced biodegradability. Polym. Degrad. Stab. 2004, 86, 483–491. [Google Scholar] [CrossRef] [Scilit]
- Cacciari, I.; Quatrini, P.; Zirletta, G.; Mincione, E.; Vinciguerra, V.; Lupattelli, P.; Giovannozzi Sermanni, G. Isotactic polypropylene biodegradation by a microbial community: Physicochemical characterization of metabolites produced. Appl. Environ. Microbiol. 1993, 59, 3695–3700. [Google Scholar] [CrossRef] [Scilit] [PubMed]
- Arutchelvi, J.; Sudhakar, M.; Arkatkar, A.; Doble, M.; Bhaduri, S.; Uppara, P.V. Biodegradation of polyethylene and polypropylene. Indian J. Biotechnol. 2008, 7, 9–22. [Google Scholar]
- de Oliveira, T.A.; Barbosa, R.; Mesquita, A.B.S.; Ferreira, J.H.L.; de Carvalho, L.H.; Alves, T.S. Fungal degradation of reprocessed PP/PBAT/thermoplastic starch blends. J. Mater. Res. Technol. 2020, 9, 2338–2349. [Google Scholar] [CrossRef] [Scilit]
- Lucas, N.; Bienaime, C.; Belloy, C.; Queneudec, M.; Silvestre, F.; Nava-Saucedo, J.-E. Polymer biodegradation: Mechanisms and estimation techniques. Chemosphere 2008, 73, 429–442. [Google Scholar] [CrossRef] [Scilit] [PubMed]
- Shah, A.A.; Hasan, F.; Hameed, A.; Ahmed, S. Biological degradation of plastics: A comprehensive review. Biotechnol. Adv. 2008, 26, 246–265. [Google Scholar] [CrossRef] [Scilit] [PubMed]
- Gu, J.-D. Microbiological deterioration and degradation of synthetic polymeric materials: Recent research advances. Int. Biodeterior. Biodegrad. 2003, 52, 69–91. [Google Scholar] [CrossRef] [Scilit]
- Mohanan, N.; Montazer, Z.; Sharma, P.K.; Levin, D.B. Microbial and enzymatic degradation of synthetic plastics. Front. Microbiol. 2020, 11, 580709. [Google Scholar] [CrossRef] [Scilit] [PubMed]
- Jeyakumar, D.; Chirsteen, J.; Doble, M. Synergistic effects of pretreatment and blending on fungi mediated biodegradation of polypropylenes. Bioresour. Technol. 2013, 148, 78–85. [Google Scholar] [CrossRef] [Scilit] [PubMed]
- Arkatkar, A.; Juwarkar, A.A.; Bhaduri, S.; Uppara, P.V.; Doble, M. Growth of Pseudomonas bacillus Biofilms Pretreated Polypropyl Surface. Int. Biodeterior. Biodegrad. 2010, 64, 530–536. [Google Scholar] [CrossRef] [Scilit]
- Yamada-Onodera, K.; Mukumoto, H.; Katsuyaya, Y.; Saiganji, A.; Tani, Y. Degradation of polyethylene by a fungus, Penicillium simplicissimum YK. Polym. Degrad. Stab. 2001, 72, 323–327. [Google Scholar] [CrossRef] [Scilit]
- Restrepo-Flórez, J.-M.; Bassi, A.; Thompson, M.R. Microbial degradation and deterioration of polyethylene—A review. Int. Biodeterior. Biodegrad. 2014, 88, 83–90. [Google Scholar] [CrossRef] [Scilit]
- Strömberg, E.; Karlsson, S. The effect of biodegradation on surface and bulk property changes of polypropylene, recycled polypropylene and polylactide biocomposites. Int. Biodeterior. Biodegrad. 2009, 63, 1045–1053. [Google Scholar] [CrossRef] [Scilit]
- Auta, H.S.; Emenike, C.U.; Jayanthi, B.; Fauziah, S.H. Growth kinetics and biodeterioration of polypropylene microplastics by Bacillus sp. Rhodococcus sp. Isol. Mangrove Sediment. Mar. Pollut. Bull. 2018, 127, 15–21. [Google Scholar] [CrossRef] [Scilit] [PubMed]
- Albertsson, A.-C.; Andersson, S.O.; Karlsson, S. The mechanism of biodegradation of polyethylene. Polym. Degrad. Stab. 1987, 18, 73–87. [Google Scholar] [CrossRef] [Scilit]
- Sivan, A. New perspectives in plastic biodegradation. Curr. Opin. Biotechnol. 2011, 22, 422–426. [Google Scholar] [CrossRef] [Scilit] [PubMed]
- Safdar, A.; Ismail, F.; Iftikhar, H.; Khokhar, A.M.; Javed, A.; Imran, M.; Safdar, B. Determination of biodegradation potential of Aspergillus niger, Candida albicans, Acremonium sclerotigenum Polyethylene, Polyethyl. Terephthalate, Polystyr. Microplastics. Int. J. Microbiol. 2024, 2024, 7682762. [Google Scholar] [CrossRef] [Scilit] [PubMed]
- Griffin, G.J.L. Biodegradable fillers in thermoplastics. Adv. Chem. Ser. 1974, 134, 159–170. [Google Scholar] [CrossRef] [Scilit]
- Chandra, R.; Rustgi, R. Biodegradable polymers. Prog. Polym. Sci. 1998, 23, 1273–1335. [Google Scholar] [CrossRef] [Scilit]
- Shang, X.-Y.; Fu, X.; Chen, X.-D.; Yang, L.-S. Biodegradation of blends of polyethylene-octene elastomer with starches by fungi. J. Appl. Polym. Sci. 2009, 114, 3574–3584. [Google Scholar] [CrossRef] [Scilit]
- Tonukari, N.J. Cassava and the future of starch. Electron. J. Biotechnol. 2004, 7, 5–8. [Google Scholar] [CrossRef]
- Zhu, F. Composition, structure, physicochemical properties, and modifications of cassava starch. Carbohydr. Polym. 2015, 122, 456–480. [Google Scholar] [CrossRef] [Scilit] [PubMed]
- Marenco-Orozco, G.A.; Tadini, C.C. Synergistic valorization of cassava processing byproducts: Improving extruded biocomposites properties through peel fiber incorporation. Starch–Stärke 2026, 78, e70218. [Google Scholar] [CrossRef] [Scilit]
- Martinaud, E.; Hierro-Iglesias, C.; Hammerton, J.; Hadad, B.; Evans, R.; Sacharczuk, J.; Lester, D.; Derry, M.J.; Topham, P.D.; Fernandez-Castane, A. Valorising cassava peel waste into plasticized polyhydroxyalkanoates blended with polycaprolactone with controllable thermal and mechanical properties. J. Polym. Environ. 2024, 32, 3503–3515. [Google Scholar] [CrossRef] [Scilit] [PubMed]
- Velasco, R.J.; Luna, W.A.; Mera, J.A.; Villada, H.S. Producción de dextrinas a partir de almidón nativo de yuca por ruta seca en una agroindustria rural. Inf. Tecnol. 2008, 19, 15–22. [Google Scholar] [CrossRef] [Scilit]
- Aristizábal Galvis, J.; Moreno, F.L.; Basto Ospina, G. Estudio de una nueva técnica e implementación de una línea piloto de proceso para la obtención de dextrinas a partir de almidón de yuca. Ing. Investig. 2007, 27, 26–33. Available online: https://www.redalyc.org/articulo.oa?id=64327205 (accessed on 12 September 2026).
- Kiatkamjornwong, S.; Sonsuk, M.; Wittayapichet, S.; Prasassarakich, P.; Vejjanukroh, P.-C. Degradation of styrene-G-Cassava Starch Filled Polystyrene Plastics. Polym. Degrad. Stab. 1999, 66, 323–335. [Google Scholar] [CrossRef] [Scilit]
- Avérous, L.; Halley, P.J. Biocomposites based on plasticized starch. Biofuels Bioprod. Biorefin. 2009, 3, 329–343. [Google Scholar] [CrossRef] [Scilit]
- Wurzburg, O.B. (Ed.) Modified Starches: Properties and Uses; CRC Press: Boca Raton, FL, USA, 1986. [Google Scholar]
- Chinaglia, S.; Tosin, M.; Degli-Innocenti, F. Biodegradation rate of biodegradable plastics at molecular level. Polym. Degrad. Stab. 2018, 147, 237–244. [Google Scholar] [CrossRef] [Scilit]
- Krueger, M.C.; Harms, H.; Schlosser, D. Prospects for microbiological solutions to environmental pollution with plastics. Appl. Microbiol. Biotechnol. 2015, 99, 8857–8874. [Google Scholar] [CrossRef] [Scilit] [PubMed]
- Schuster, E.; Dunn-Coleman, N.; Frisvad, J.C.; van Dijck, P.W.M. On the safety of Aspergillus niger—Review. Appl. Microbiol. Biotechnol. 2002, 59, 426–435. [Google Scholar] [CrossRef] [Scilit] [PubMed]
- Latgé, J.-P. Aspergillus fumigatus Aspergillosis. Clin. Microbiol. Rev. 1999, 12, 310–350. [Google Scholar] [CrossRef] [Scilit] [PubMed]
- CIAT. La Industria del Almidón en el Departamento del Cauca, Colombia; CIAT: Cali, Colombia, 1995. [Google Scholar]
- Riddell, R.W. Permanent stained mycological preparations obtained by slide culture. Mycologia 1950, 42, 265–270. [Google Scholar] [CrossRef] [Scilit]
- ISO 14855-1:2012; Determination of the Ultimate Aerobic Biodegradability of Plastic Materials Under Controlled Composting Conditions. ISO: Geneva, Switzerland, 2012.
- Andreassen, E. Infrared and Raman spectroscopy of polypropylene. In Polypropylene: An A–Z Reference; Karger-Kocsis, J., Ed.; Kluwer: Dordrecht, The Netherlands, 1999; pp. 320–328. [Google Scholar]
- Liang, C.Y.; Krimm, S. Infrared spectra of high polymers. VI. Polystyrene. J. Polym. Sci. 1958, 27, 241–254. [Google Scholar] [CrossRef] [Scilit]
- Socrates, G. Infrared and Raman Characteristic Group Frequencies: Tables and Charts, 3rd ed.; Wiley: Chichester, UK, 2001. [Google Scholar]
- Gulmine, J.V.; Janissek, P.R.; Heise, H.M.; Akcelrud, L. Polyethylene characterization by FTIR. Polym. Test. 2002, 21, 557–563. [Google Scholar] [CrossRef] [Scilit]
- Ru, J.; Huo, Y.; Yang, Y. Microbial degradation and valorization of plastic wastes. Front. Microbiol. 2020, 11, 442. [Google Scholar] [CrossRef] [Scilit] [PubMed]
- Aristizábal, J.; Sánchez, T. Guía Técnica para la Producción y Análisis del Almidón de Yuca; FAO Agricultural Services Bulletin 163; FAO: Rome, Italy, 2007. [Google Scholar]
- Buitrago, J.A. La Yuca en la Alimentación Animal; CIAT: Cali, Colombia, 1990. [Google Scholar]
- Ahmed, M.; Iram, S.; Tabassum, N.; Sajid, M.; Paseutsakoun, K.; Aleksza, L.; Székács, A. Biodegradation efficacy of Aspergillus niger and Trichoderma harzianum Low-Density Polyethylene. Polymers 2025, 17, 1303. [Google Scholar] [CrossRef] [Scilit] [PubMed]
- DSouza, G.C.; Sheriff, R.S.; Ullanat, V.; Shrikrishna, A.; Joshi, A.V.; Hiremath, L.; Entoori, K. Fungal biodegradation of low-density polyethylene using consortium of Aspergillus Species Control Conditions. Heliyon 2021, 7, e07008. [Google Scholar] [CrossRef] [Scilit] [PubMed]
- Ruijter, G.J.G.; Visser, J. Carbon repression in Aspergilli. FEMS Microbiol. Lett. 1997, 151, 103–114. [Google Scholar] [CrossRef] [Scilit]
- Andrady, A.L. Microplastics in the marine environment. Mar. Pollut. Bull. 2011, 62, 1596–1605. [Google Scholar] [CrossRef] [Scilit] [PubMed]
- Gałuszka, A.; Migaszewski, Z.; Namieśnik, J. The 12 principles of green analytical chemistry and the SIGNIFICANCE mnemonic of green analytical practices. TrAC Trends Anal. Chem. 2013, 50, 78–84. [Google Scholar] [CrossRef] [Scilit]
- Pena-Pereira, F.; Wojnowski, W.; Tobiszewski, M. AGREE—Analytical GREEnness metric approach and software. Anal. Chem. 2020, 92, 10076–10082. [Google Scholar] [CrossRef] [Scilit] [PubMed]
- Mansour, F.R.; Płotka-Wasylka, J.; Locatelli, M. Modified GAPI (MoGAPI) tool and software for the assessment of method greenness: Case studies and applications. Analytica 2024, 5, 451–457. [Google Scholar] [CrossRef] [Scilit]
- Mansour, F.R.; Bedair, A.; Belal, F.; Magdy, G.; Locatelli, M. Analytical Green Star Area (AGSA) as a new tool to assess greenness of analytical methods. Sustain. Chem. Pharm. 2025, 46, 102051. [Google Scholar] [CrossRef] [Scilit]
- ASTM D6474-20; Standard Test Method for Determining Molecular Weight Distribution and Molecular Weight Averages of Polyolefins by High Temperature Gel Permeation Chromatography. ASTM International: West Conshohocken, PA, USA, 2020.
- Navas Gotopo, S.M. Biodegradación del Polipropileno Mediante el Empleo de Dextrina Proveniente de Desechos de Manihot esculenta. Master’s Thesis, Universidad de Camagüey “Ignacio Agramonte Loynaz”, Camagüey, Cuba, 2014. [Google Scholar]
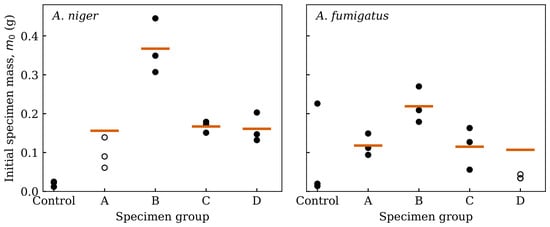
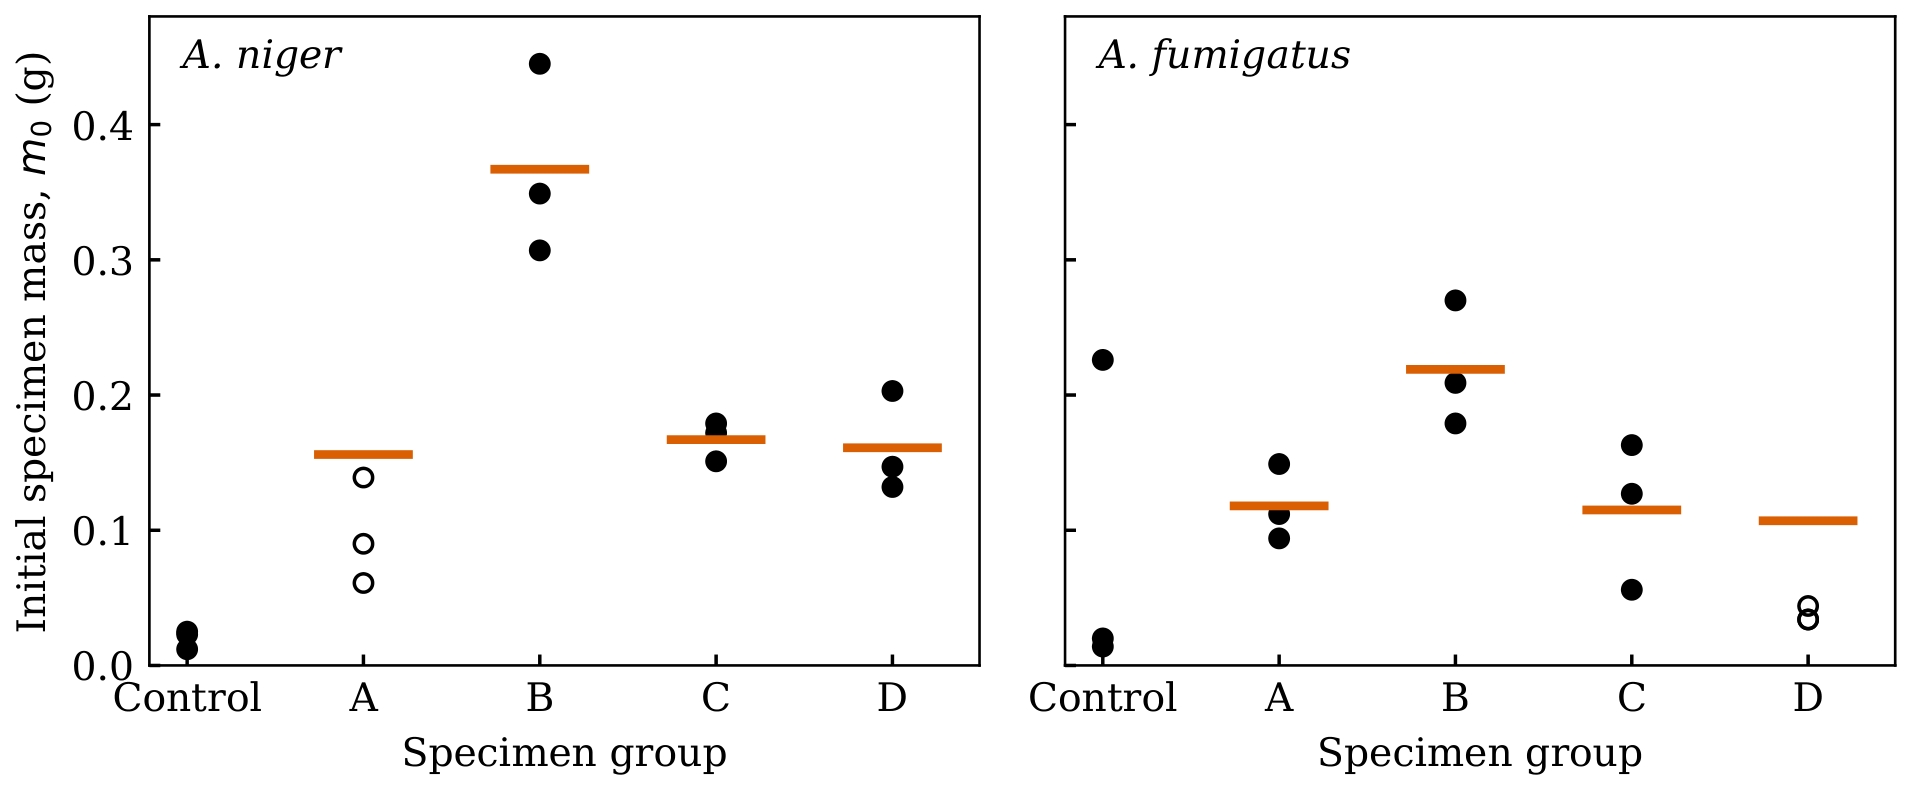
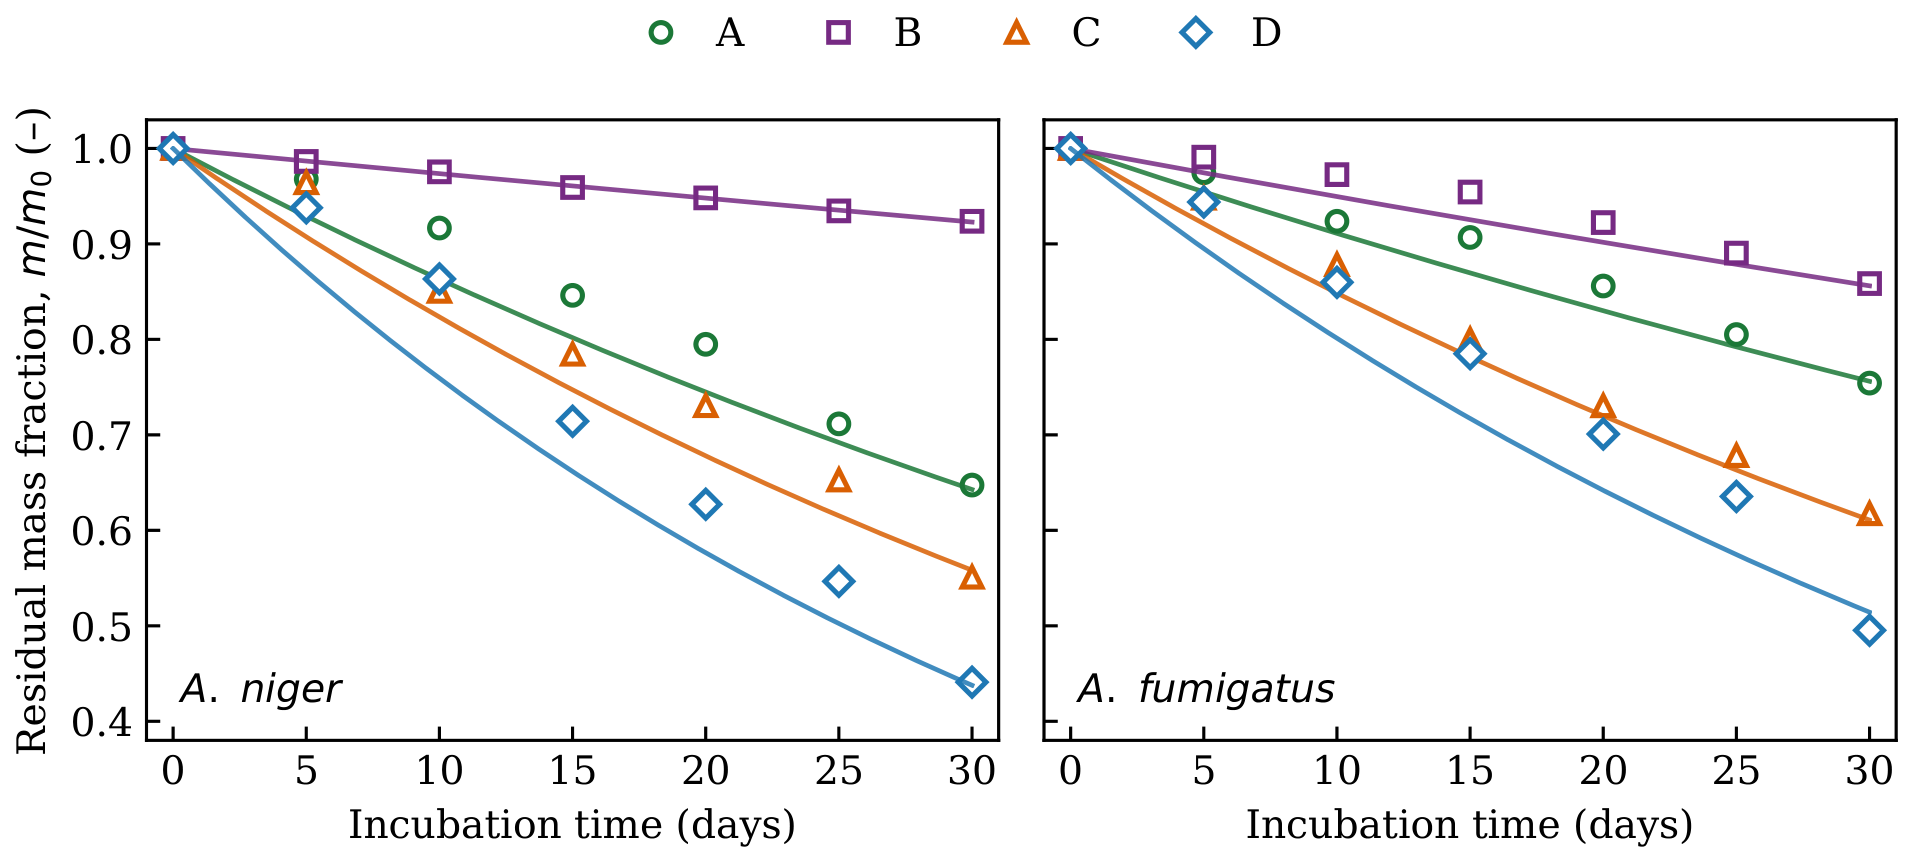
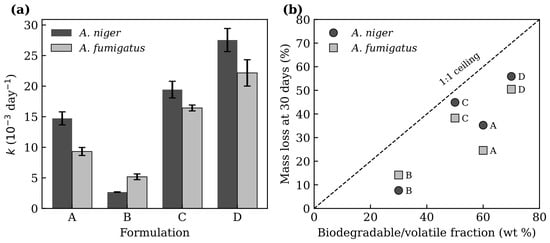
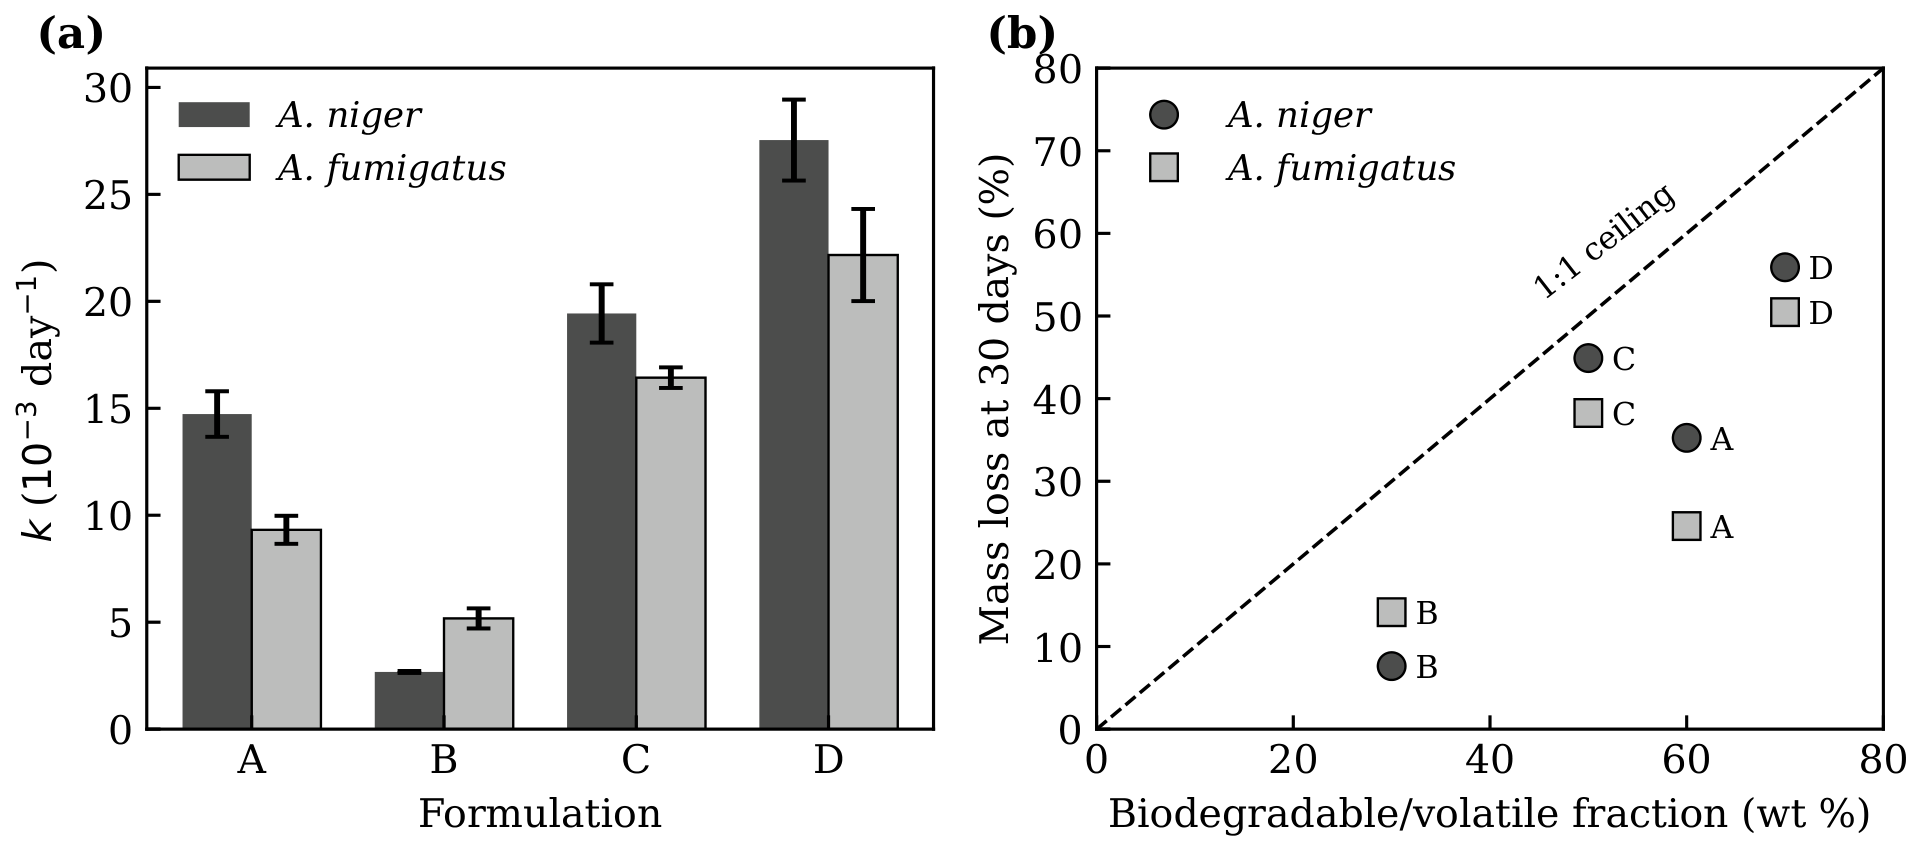
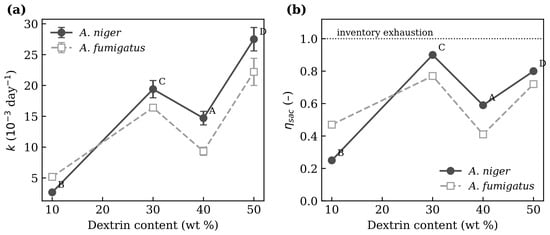
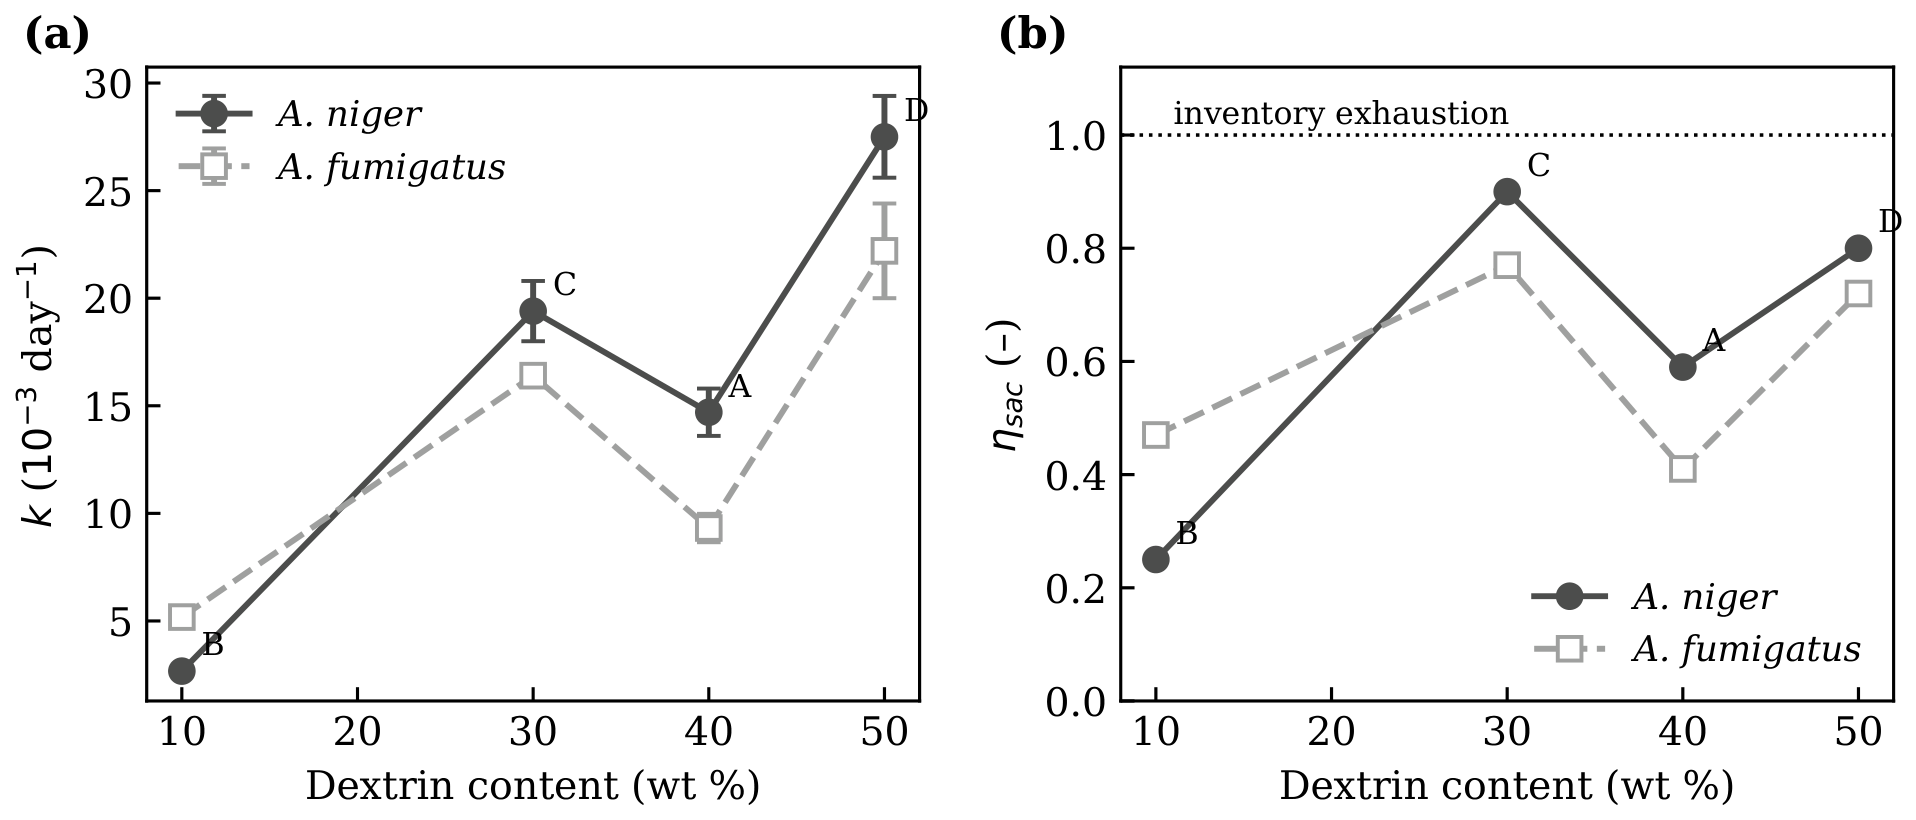
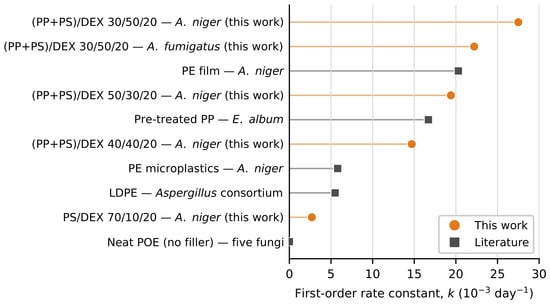
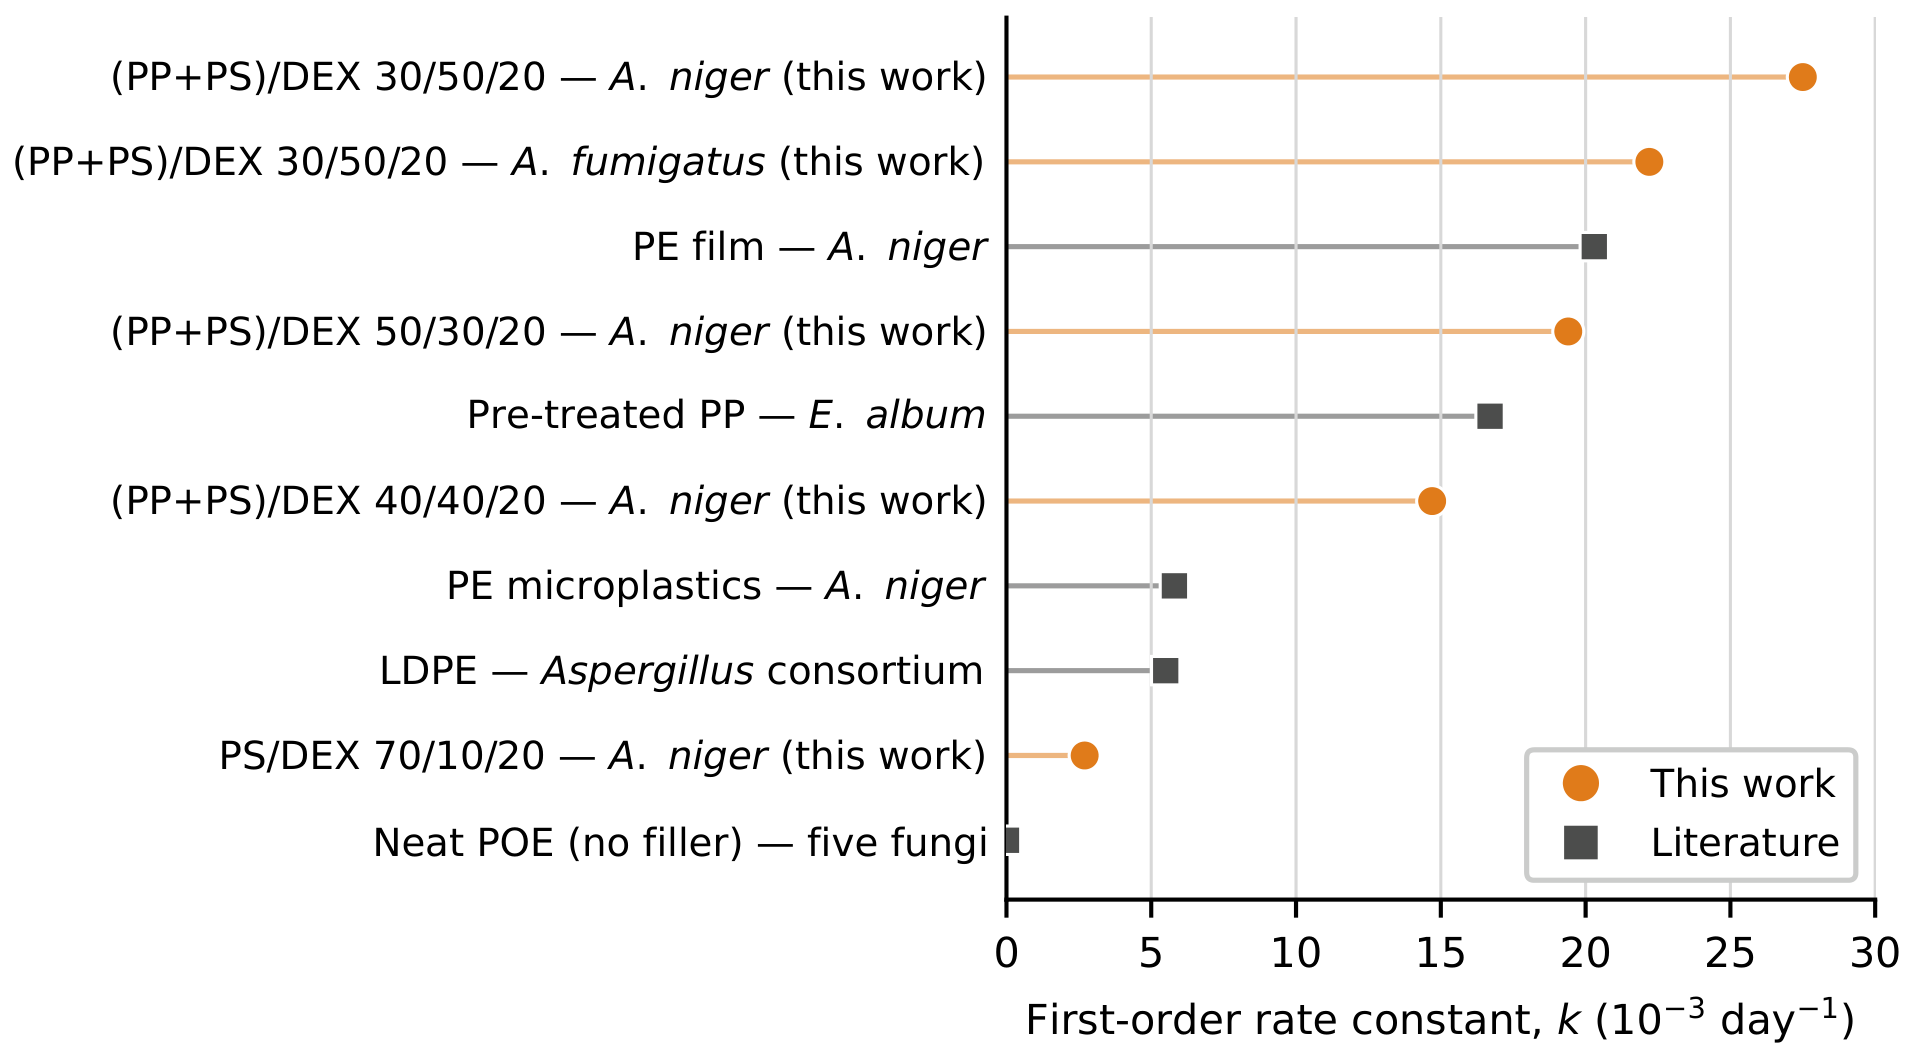
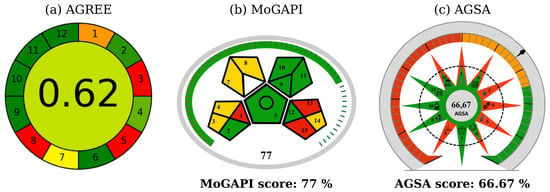
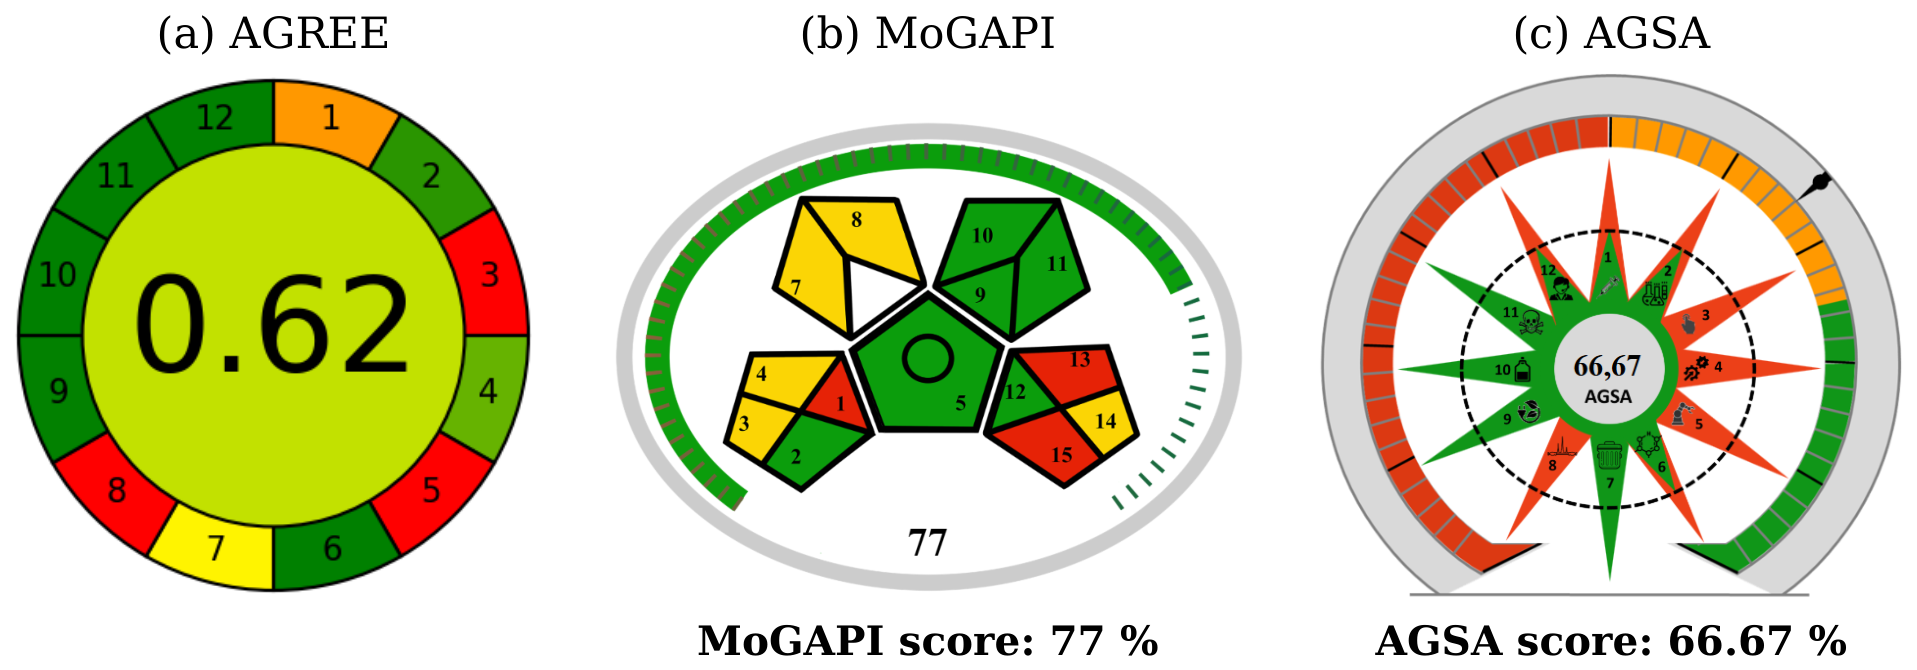

Disclaimer/Publisher’s Note: The statements, opinions and data contained in all publications are solely those of the individual author(s) and contributor(s) and not of MDPI and/or the editor(s). MDPI and/or the editor(s) disclaim responsibility for any injury to people or property resulting from any ideas, methods, instructions or products referred to in the content. |
© 2026 by the authors. Licensee MDPI, Basel, Switzerland. This article is an open access article distributed under the terms and conditions of the Creative Commons Attribution (CC BY) license.