


Abstract
This study evaluates wavelength-dispersive X-ray fluorescence (WDXRF) for the quantification of iron and other major elements in archeological ochre, employing a borate-flux fusion technique adapted for small sample quantities. Cross-sectional microXRF mapping of glass samples fused from iron ore reference materials confirmed high compositional homogeneity for Fe, Si, K, and Ca across a broad concentration range. WDXRF calibration curves, derived from twenty certified reference materials of iron ores, facilitated the quantification of Mg, Al, Si, P, Ca, Ti, Mn, and Fe in samples with an iron content spanning 25–66 wt.%. The approach was validated via WDXRF and flame atomic absorption spectrometry (FAAS) analysis of seven archaeological ochre specimens from the Paleolithic site Kamennaya Balka II, covering the primary iron-bearing phases of goethite, jarosite, hematite, and magnetite. The agreement between WDXRF and FAAS samples confirms the accuracy of iron determination, irrespective of the iron mineral phase.
1. Introduction
Archeological ochre comprises a significant category of mineral specimens characterized by iron-derived pigmentation [1]. Elemental analysis of these materials offers critical insights into their provenance [2,3], enabling the reconstruction of ancient migratory pathways and behavioral patterns [4,5,6]. Independent of the specific research aim, the analysis of ochre specimens frequently involves comparing their physicochemical properties to establish taxonomic groupings or to correlate them with potential iron ore source materials. Key diagnostic characteristics often include phase [7,8,9], isotopic [10], and elemental composition [11,12].
The choice of analytical and preparation methods for an ochre sample depends largely on the form in which it was discovered. Archeological ochre may present as a cluster of iron-rich fragments, a remnant of wall or rock painting [6,13], loose powder [14], pigment traces on tools [15] or other objects [16], or individual pieces ranging from a few millimeters [17,18] to several centimeters in size [19,20,21].
Working with archeological ochre typically involves the handling of small samples, which makes the use of standard industrial methods for iron ore analysis challenging. Obtaining a representative sample is often impossible, and, as some researchers note [22], destructive sampling is undesirable for specimens that are mechanically stable pieces rather than powders. Therefore, when working with archaeological ochre—especially small specimens—it is preferable to employ non-destructive techniques, where the object is analyzed without contact, or low-destructive methods that minimize damage during sample preparation and measurement [23,24].
Elemental analysis is frequently used to classify ochre samples or to determine their geological provenance, as it enables differentiation based on the content of transition elements (V, As, Cu, and Zn) [25,26], alkaline earth metals, and heavy metals [27]. Like some other geological materials, archeological ochre can be linked to a specific deposit through its rare earth element (REE) profile, which reflects the geological processes involved in the rock’s formation [18,28].
One common approach for processing analytical results in ochre analysis involves the normalization of concentrations of elements on iron content [23,28,29]. However, accurately determining iron and other macro- and microcomponents is complicated by the material’s natural heterogeneity, which impacts the accuracy of both invasive and non-destructive analyses.
Non-destructive XRF methods are further constrained by irregular sample shapes, as standard XRF instrument geometries and many common concentration calculation algorithms are optimized for flat, homogeneous samples [30]. Invasive methods, such as mass-spectrometry with inductive-coupled plasma (ICP-MS) or flame atomic absorption spectroscopy (FAAS), present a distinct challenge: they are typically designed for digested samples, whereas ochre can contain significant proportions of quartz [31,32] and zirconium-bearing minerals [23,33,34], necessitating complicated digestion protocols for complete dissolution [35,36].
An alternative approach to sample homogenization involves fusion with fluxes based on sodium or lithium borates. This method enables a standardized analysis of ochre, regardless of the mineral composition. Furthermore, the production of glass beads allows for the determination of both major and microelements using various analytical techniques while maintaining a unified sample preparation protocol.
Such a scheme was implemented in the study [23], where, following the fusion of ochre samples, electron probe microanalysis (EPMA) was performed to determine Na, Mn, Ca, K, Al, Mg, Fe, Ti, and Si, while laser ablation mass spectrometry was employed to measure trace amounts of other elements. The authors propose using a mixture of lithium metaborate (LiBO2) and lithium tetraborate (Li2B4O7) as a flux, as this achieves near-maximum solubility for hematite and “non-ferrous” impurity phases in ochre. The same scheme is recommended for WDXRF analysis of iron ore for industrial purposes [37,38].
X-ray fluorescence analysis (XRF) is commonly used for the primary characterization of ochre macrocomposition due to the greater availability of equipment, relative simplicity of operation, and the potential for rapid analysis. Furthermore, it allows for analysis without sample preparation in the case of classical or portable energy-dispersive XRF [22,39], or with minimal preparation when using with total reflection XRF [40]. Nevertheless, with classical and especially portable energy-dispersive spectrometers, results are often limited to a semi-quantitative assessment of the bulk composition of ochre samples or to the pre-screening of mineral specimens.
For quantitative analysis, a sample homogenization stage is necessary. XRF requires the preparation of a mechanically stable sample with a flat surface. The most common preparation method involves grinding the sample and pressing the powder into tablets with a binder or loading it into a sample cup. However, some researchers note that XRF results for such specimens may be distorted due to insufficient homogeneity [41,42]. Unlike powder pressing, fusion creates homogeneous glass and, through dilution, reduces matrix effects in X-ray fluorescence analysis associated with particle size variations.
A 1:1 mixture of LiBO2 and Li2B4O7 has previously been proposed [23] as a flux for archeological ochre samples, owing to its ability to maximize the solubility of hematite and non-iron impurity phases.
Our study aims to evaluate the feasibility of fusing ochre with borates for the rapid and accurate determination of the primary macrocomponent—iron. We employed a simplified approach using only lithium metaborate as flux. For iron quantification, we utilized WDXRF; while it may be less efficient than EDXRF for determining a sample’s complete macrocomposition, it enables the accurate determination of a single component within a comparable timeframe.
In this study, we also preliminary assessed the feasibility of using sodium tetraborate (Na2B4O7) as an alternative to lithium borate fluxes. Historically, sodium tetraborate was widely used in the 1950s and 1960s for sample fusion in X-ray fluorescence analysis [43]. However, several inherent disadvantages have led to its gradual replacement by lithium borates in routine analytical practice:
- Sodium tetraborate is stable in air primarily as a decahydrate (Na2B4O7·10 H2O) [44]. Its high crystal hydrate water content causes intense gas release and “scattering” of the sample within the furnace during fusion.
- The non-stoichiometry of sodium tetraborate—resulting from the variable number of water molecules [45,46]—precludes precise determination of sample component dilution, potentially introducing errors into quantitative analysis.
Despite these factors, we contend that employing this “outdated” flux for preparing archeological samples remains justified compared to lithium borates for the following reasons:
- First, using Na2B4O7 avoids the risk of lithium contamination in mass spectrometers—a critical factor in routine geological studies [47]. This advantage is particularly significant when samples are introduced via laser ablation directly from the glass, where the absence of lithium prevents interference with the analysis of geochemical elements.
- Second, sodium tetraborate is significantly cheaper than lithium borates.
- Third, the higher molar mass of Na2B4O7 compared to lithium borates leads to increased absorption of primary and secondary radiation during X-ray fluorescence analysis [48]. While this may slightly reduce sensitivity, it enhances reproducibility and accuracy by minimizing variations in the average molar mass of the glass when analyzing samples with diverse macrocompositions [49].
This study evaluates the potential of WDXRF for iron determination in small ochre samples fused with lithium metaborate. To validate these results, we used both iron ore reference materials and archeological samples. Iron content in these materials was determined using an independent method—flame atomic absorption spectrometry (FAAS)—following complete acid digestion. Additionally, we conducted a qualitative assessment of the ore fusion procedure using sodium tetraborate and proposed a method for optimal flux preparation.
2. Materials and Methods
2.1. Reagents
Iron (III) oxide and silicon (IV) oxide (analytical grade, RusChem, Moscow, Russia) were used to prepare model mixtures. Lithium metaborate (99% wt, analytical grade, Acros, Geel, Belgium), sodium tetraborate decahydrate (analytical grade, RusChem, Moscow, Russia), sodium bromide (Fluka, Basel, Switzerland) and lithium bromide (99%, Sigma Aldrich, Darmstadt, Germany) were used to obtain glasses. HF (high-purity grade, SigmaTek, Khimki, Russia), HNO3 (high-purity grade, Laverna, Moscow, Russia), HClO4 (high-purity grade, Laverna, Moscow, Russia) and H3BO3 (analytical grade, RusChem, Moscow, Russia; additional purification was performed by recrystallization) were used to digest archeological ochre samples. All solutions were prepared using deionized water (18.2 MΩ/cm, Milli-Q, ADVANTAGE A10, Millipore Corporation, Molsheim, France).
2.2. Certified Reference Materials and Archeological Samples
The study used 20 iron ores reference materials: CRM 281-89P, CRM 1132-85P, CRM 9977-2011, CRM 6409-92, CRM 11016-2017, RM 10199-2013, CRM 1865-87P (The Institute for Certified Reference Materials, Yekaterinburg, Russia), KZ.03.01.00213-2010, KZ.03.01.00210-2010, CRM 5403-90, KZ.03.01.00211-2010, KZ.03.01.00212-2010 (Tsentrgeoanalit, Irkutsk, Russia), CRM 8515-2004, CRM 8488-2003 (West Siberian Testing Center, Novokuznetsk, Russia), SO 2D, SO No. 195 (VNIISO, USSR Ministry of Ferrous Metallurgy, Sverdlovsk, USSR), SO 1B (Ural Institute of Ferrous Metals, Yekaterinburg, Russia), CRM 2742-83 (Ministry of Geology of the Kazakh SSR, North Kazakhstan Production Geological Association, Rudnyi, Kazakhstan), USZ 29-99/CGL 113 (Central Geological Laboratory, Ulaanbaatar, Mongolia), and SARM 12 (National Institute for Metallurgy, Johannesburg, Republic of South Africa). The composition of the reference materials is presented in Supplementary Materials (Table S1).
Seven archeological samples of ochre (IDs: kb2 006, kb2 027, kb2 149, kb2 163, kb2 180, kb2 329, and kb2 338) from the Paleolithic site of Kamennaya Balka II were kindly provided by E.A. Vinogradova, the head of the Don archaeological expedition of the Lomonosov Moscow State University. Sample masses were about 300–400 mg for kb2 027, kb2 163, kb2 329, and kb2 338 and exceeded 1 g for kb2 006, kb2 149 and kb2 180 before grinding. The archaeological description of this site is presented elsewhere [50,51]. Preliminary homogenization of the samples was performed using a PULVERISETTE 7 premium line planetary micromill with 20 mL agate beakers and 1 cm diameter agate balls (Fritsch, Idar-Oberstein, Germany).
2.3. Sample Preparation Methods
2.3.1. Preparation of Glasses for 110 mg Samples
Lithium metaborate was pre-dried at 450 °C for 4 h. Sodium tetraborate decahydrate was pre-dehydrated in a muffle furnace by holding at two temperatures: +75 °C and +400 °C. (See Section 4 of the Results for more details on the development of the sodium tetraborate preparation procedure.). Before fusion, archeological ochre samples were manually ground using an agate mortar and pestle. Seven archaeological ochre samples and 20 iron ore reference materials were calcined in a muffle furnace at 950 °C for 4 h, after which 110.0 mg portions were collected. The portions were homogenized with 1.1 g of flux in an agate mortar before melting 7 drops of 40 mg/mL LiBr solution as the releasing agent (lithium metaborate flux) or 300 μL of 30 mg/mL NaBr (sodium tetraborate flux). The mixture was placed in a platinum crucible and melted at 1100 °C for 19 min in a TheOX automatic electric furnace (Claisse, Quebec, Quebec, Canada) installed at the Isotope-Geochemical Research Center of the Vinogradov Institute of Geochemistry, Siberian Branch of the Russian Academy of Sciences [52], after which the melt was poured onto a heated platinum disk. The formed glasses had the form of hemispheres with a diameter of 9 to 13 mm. A detailed description of the technique is presented in [53].
2.3.2. Preparing the Glass for Analysis
To obtain an elemental distribution profile, the glass was sawed in half lengthwise with a hacksaw. The surface of the resulting fragments was polished using a diamond grindstone and 200 and 2000 mesh sandpaper.
2.3.3. Acid Digestion of Samples for FAAS
A test portion (50 mg) of each analyzed sample was placed in a (polytetrafluoroethylene) PTFE container. A total of 1.0 mL of HF and 1.0 mL of HNO3 were added to the sample. The PTFE container was then placed in a titanium autoclave and heated in an oven for 16 h at 210 °C. After cooling, 0.5 mL of HClO4 was added to each sample (after cooling and opening the containers), and the resulting mixture was evaporated to a residual volume of 0.3–0.4 mL. A total of 0.5 mL of HNO3 and 0.5 mL of 0.05 M H3BO3 were added to the solution, and the contents of the container were again evaporated to a residual volume of 0.3–0.4 mL. At the final stage, 0.5 mL of HNO3 was added to each container; the final volume after evaporation was in the range of 0.3–0.4 mL. After adding 2 mL of HNO3 (1:1) to the mineralized sample, the solution was maintained at 160 °C for 10 h. The contents of each container were then transferred to a 100.0 mL volumetric flask; an additional 1 mL of HNO3 was added (to obtain 2% m/m HNO3 in the final solution), and the mixture was diluted to the final volume, thoroughly mixed, and analyzed using FAAS. The procedure is described in more detail in [54].
2.4. Methods of Analysis
2.4.1. Powder X-Ray Microdiffraction
To determine the mineral composition, samples ground in an agate mortar with alcohol were analyzed by powder diffraction on a DRON-3.0 X-ray diffractometer (Bourevestnik JSC, Saint Petersburg, Russia) with the following scanning conditions: CuKα radiation, Ni-filter, V = 30 kV, I = 20 mA, and scanning step = 0.05°. X-ray diffraction patterns were identified using a phase search program. Semi-quantitative component ratios were calculated from corundum numbers using the Reference Intensity Ratio (RIR) method [55].
2.4.2. MicroXRF Mapping
Samples of glass were cut, polished and prepared for imaging by mounting on an acrylic plate using double-sided adhesive tape. MicroXRF maps were recorded using a Tornado M4+ microX-ray fluorescence spectrometer (Bruker, Berlin, Germany) with a rhodium-anode tube. The spectrometer chamber was evacuated to a residual pressure of 25 mbar, and the detector operated at 275,000 cps. The exposure time per point was 50 ms, with a scanning step of 40 μm. The resulting element distribution maps were processed using the Hyperspy 2.4.0. software package for Python.
2.4.3. Flame Atomic Absorption Spectroscopy
Iron was determined using a KVANT-2MT flame atomic absorption spectrometer (Cortec, Moscow, Russia) in an acetylene–air flame at wavelengths of 248.3 nm and 285.2 nm. Non-selective absorption was automatically corrected using a deuterium lamp. The spectrometer was calibrated before measurement to achieve maximum signal intensity.
2.4.4. Wavelength-Dispersive X-Ray Fluorescence Analysis
WDXRF analyses were performed at the Isotope-Geochemical Research Shared Use Center of the Vinogradov Institute of Geochemistry, Siberian Branch of the Russian Academy of Sciences [52], using an S4 Pioneer wavelength-dispersive X-ray fluorescence spectrometer (Bruker AXS, Germany) equipped with a Soller optical scheme, an X-ray tube with a Rh anode and a 8 mm collimator mask for the measurement of small-size samples. Table 1 summarizes the measurement conditions, including analytical line, X-ray tube voltage, current, crystal, collimator, and detector. Exposure times were optimized to achieve count rate measurement errors of less than 0.3% for Al, Si, and Fe, and less than 1% for other elements, resulting in a total analysis time of approximately 8 min per sample.
Table 1.
Measurement conditions for analytical lines.
2.4.5. Thermogravimetric Analysis
A 9.45 mg sample of sodium tetraborate decahydrate was analyzed using a NETZSCH TG 209 F1 Libra thermogravimetric analyzer (NETZSCH-Gerätebau GmbH, Selb, Germany). The sample was placed in an open 85 µL aluminum oxide crucible.
The analysis was conducted under a dynamic nitrogen atmosphere over a temperature range from 25 °C to 600 °C. The temperature program consisted of heating from 25 °C to 80 °C at 1 K/min, from 80 °C to 160 °C at 3 K/min, and from 160 °C to 600 °C at 5 K/min.
To eliminate the effects of dynamic nitrogen flow and temperature-dependent changes in the Archimedes force due to varying gas density during weighing, a baseline thermogravimetric curve was recorded for an empty annealed crucible prior to measurement.
3. Results and Discussion
This study evaluates the feasibility of elemental analysis of glasses produced by fusing small ochre samples with borate fluxes. Preliminary archeological ochre piece mineral composition was estimated.
Initially, the homogeneity of lithium metaborate-based glass was assessed across a wide range of iron oxide concentrations.
Subsequently, we demonstrated the viability of developing linear calibration curves for the determination of ochre macrocomponents via WDXRF analysis; the accuracy for iron and other certified components was validated using two reference samples. Furthermore, iron determination was verified for archeological samples of varying phase compositions using flame atomic absorption spectroscopy as an independent analytical method.
Finally, we qualitatively investigated the potential of utilizing sodium tetraborate—a more accessible flux—for the fusion of reference iron ore samples, with particular attention directed toward the preliminary preparation of sodium tetraborate decahydrate for high-temperature fusion.
3.1. Brief Archeological Sample Characterization
Seven archeological samples were selected due to their mass which is higher than average (about 110 mg). The samples studied were recovered during excavations at the Kamennaya Balka II archeological site (Rostov Region, Russia). This is a multi-layered archaeological site that served as a settlement for Upper Paleolithic humans. The main layer containing the studied samples dates back to the period between 15,500 and 16,500 years ago. The structure of this site and its archaeological context are presented in greater detail in works [50,51].
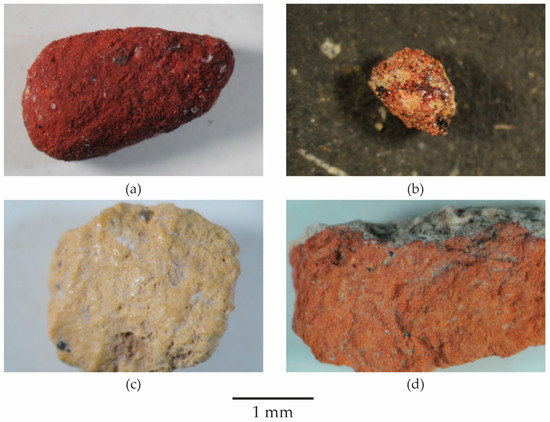
These are yellow to red mechanically stable pieces with various homogeneity according to optical microscopic analysis (photographs taken with an optical microscope are shown in Figure 1).
Figure 1.
Analyzed samples of ochre pieces from the collection of the Kamennaya Balka II site (Rostov Region, Russia): (a) kb2 329, (b) kb2 027, (c) kb2 149, and (d) kb2 180. The scale bar is 1 mm.
Determining the macrocomposition of iron ore via X-ray fluorescence spectroscopy enables accurate quantification of primary macrocomponents, particularly iron, which is typically present in oxide form. However, studies indicate that, beyond “oxide” iron, archeological ochre may contain phases such as iron hydroxides, sulfides, or sulfates with varying oxidation states [7,56]. We selected archaeological ochre samples from the Kamennaya Balka II site, ensuring sufficient mass to perform fusion with lithium metaborate, FAAS analysis, and powder microdiffraction. Of the provided collection after grinding, only three (kb2 006, kb2 149, and kb2 180) retained a mass greater than 300 mg, which was the threshold required for all three analytical methods. The phase analysis results for these samples are presented in Table 2.
Table 2.
List of minerals identified in archeological ochre samples using X-ray powder diffraction.
The results indicate that quartz was detected in all three archeological ochre samples, while calcite and feldspar were identified in individual specimens. The X-ray diffraction results are presented in greater detail in Supplementary Files (Figures S2–S4).
Notably, powder diffraction revealed distinct mineral phases serving as the primary chromophore: goethite in sample 006, jarosite in sample 180, and a mixture of both in sample 149. X-ray microdiffraction could not be performed on samples 027, 329, 163, and 338 due to insufficient material. Consequently, iron speciation in these specimens was evaluated visually. The bright red hue of sample 329 suggests the presence of hematite, whereas for the remaining samples, color analysis indicates that significant quantities of black magnetite or hematite are unlikely. In these cases, the most probable chromophores are siderite, limonite, goethite, or jarosite.
3.2. Assessing the Elemental Homogeneity of Ochre Glasses Fused with Lithium Metaborate
A total of 1.1 g of LiBO2 was used to melt 110 mg of ochre [23,37]. A larger dilution factor could have artificially increased the detection limits for iron and other macrocomponents, while a smaller one might have resulted in incomplete elimination of matrix effects [48]. The melting procedure is described in detail in Section 2.3 of the Materials and Methods.
The accuracy of determining iron and other macrocomponents depends directly on the elemental distribution in the resulting glass, which is influenced by the particle size of the fused powder. Consequently, we selected certified reference materials of iron ores for the primary experiments, as their particle sizes are strictly regulated and controlled during production.
To evaluate the homogeneity of glasses synthesized through the fusion of iron ore samples with lithium metaborate at a 1:10 mass ratio, cross-sectional elemental distributions were characterized via microXRF mapping. CRM 2743-72 and SARM 12 were selected as certified reference materials, chosen for their distinct iron concentrations and the comprehensive nature of their certified elemental profiles relative to other CRMs employed in this study. The certified elemental compositions of these materials are detailed in Table 3.
Table 3.
Certified contents of elements (expressed as oxides) in reference materials SARM 12 and CRM 2742-83.
According to manufacturer specifications, magnetite is the primary iron-bearing mineral phase in both samples. In SARM 12, the principal macrocomponent is iron oxide, whereas CRM 2742-83 contains significant amounts of silicon and aluminum oxides.
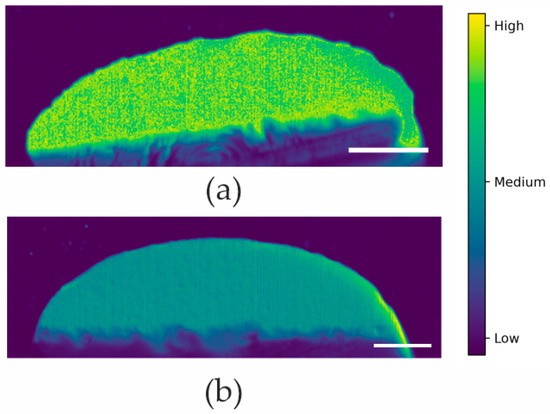
Although the samples also comprise magnesium, aluminum, and calcium oxides, cross-sectional mapping was not performed for the first two elements due to challenges in recording their analytical signals. The resulting elemental distribution maps for iron in glasses synthesized by fusing these samples with lithium metaborate are presented in Figure 2.
Figure 2.
Cross-sectional iron distribution maps of glasses prepared by fusing with lithium metaborate: (a) SARM 12 and (b) CRM 2742-83. Scale bar is 2 mm.
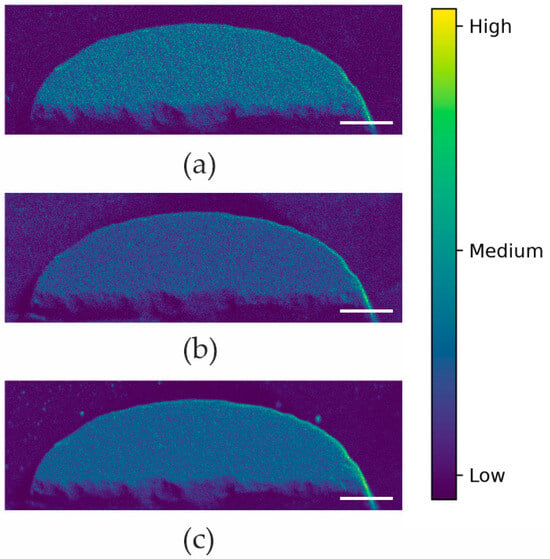
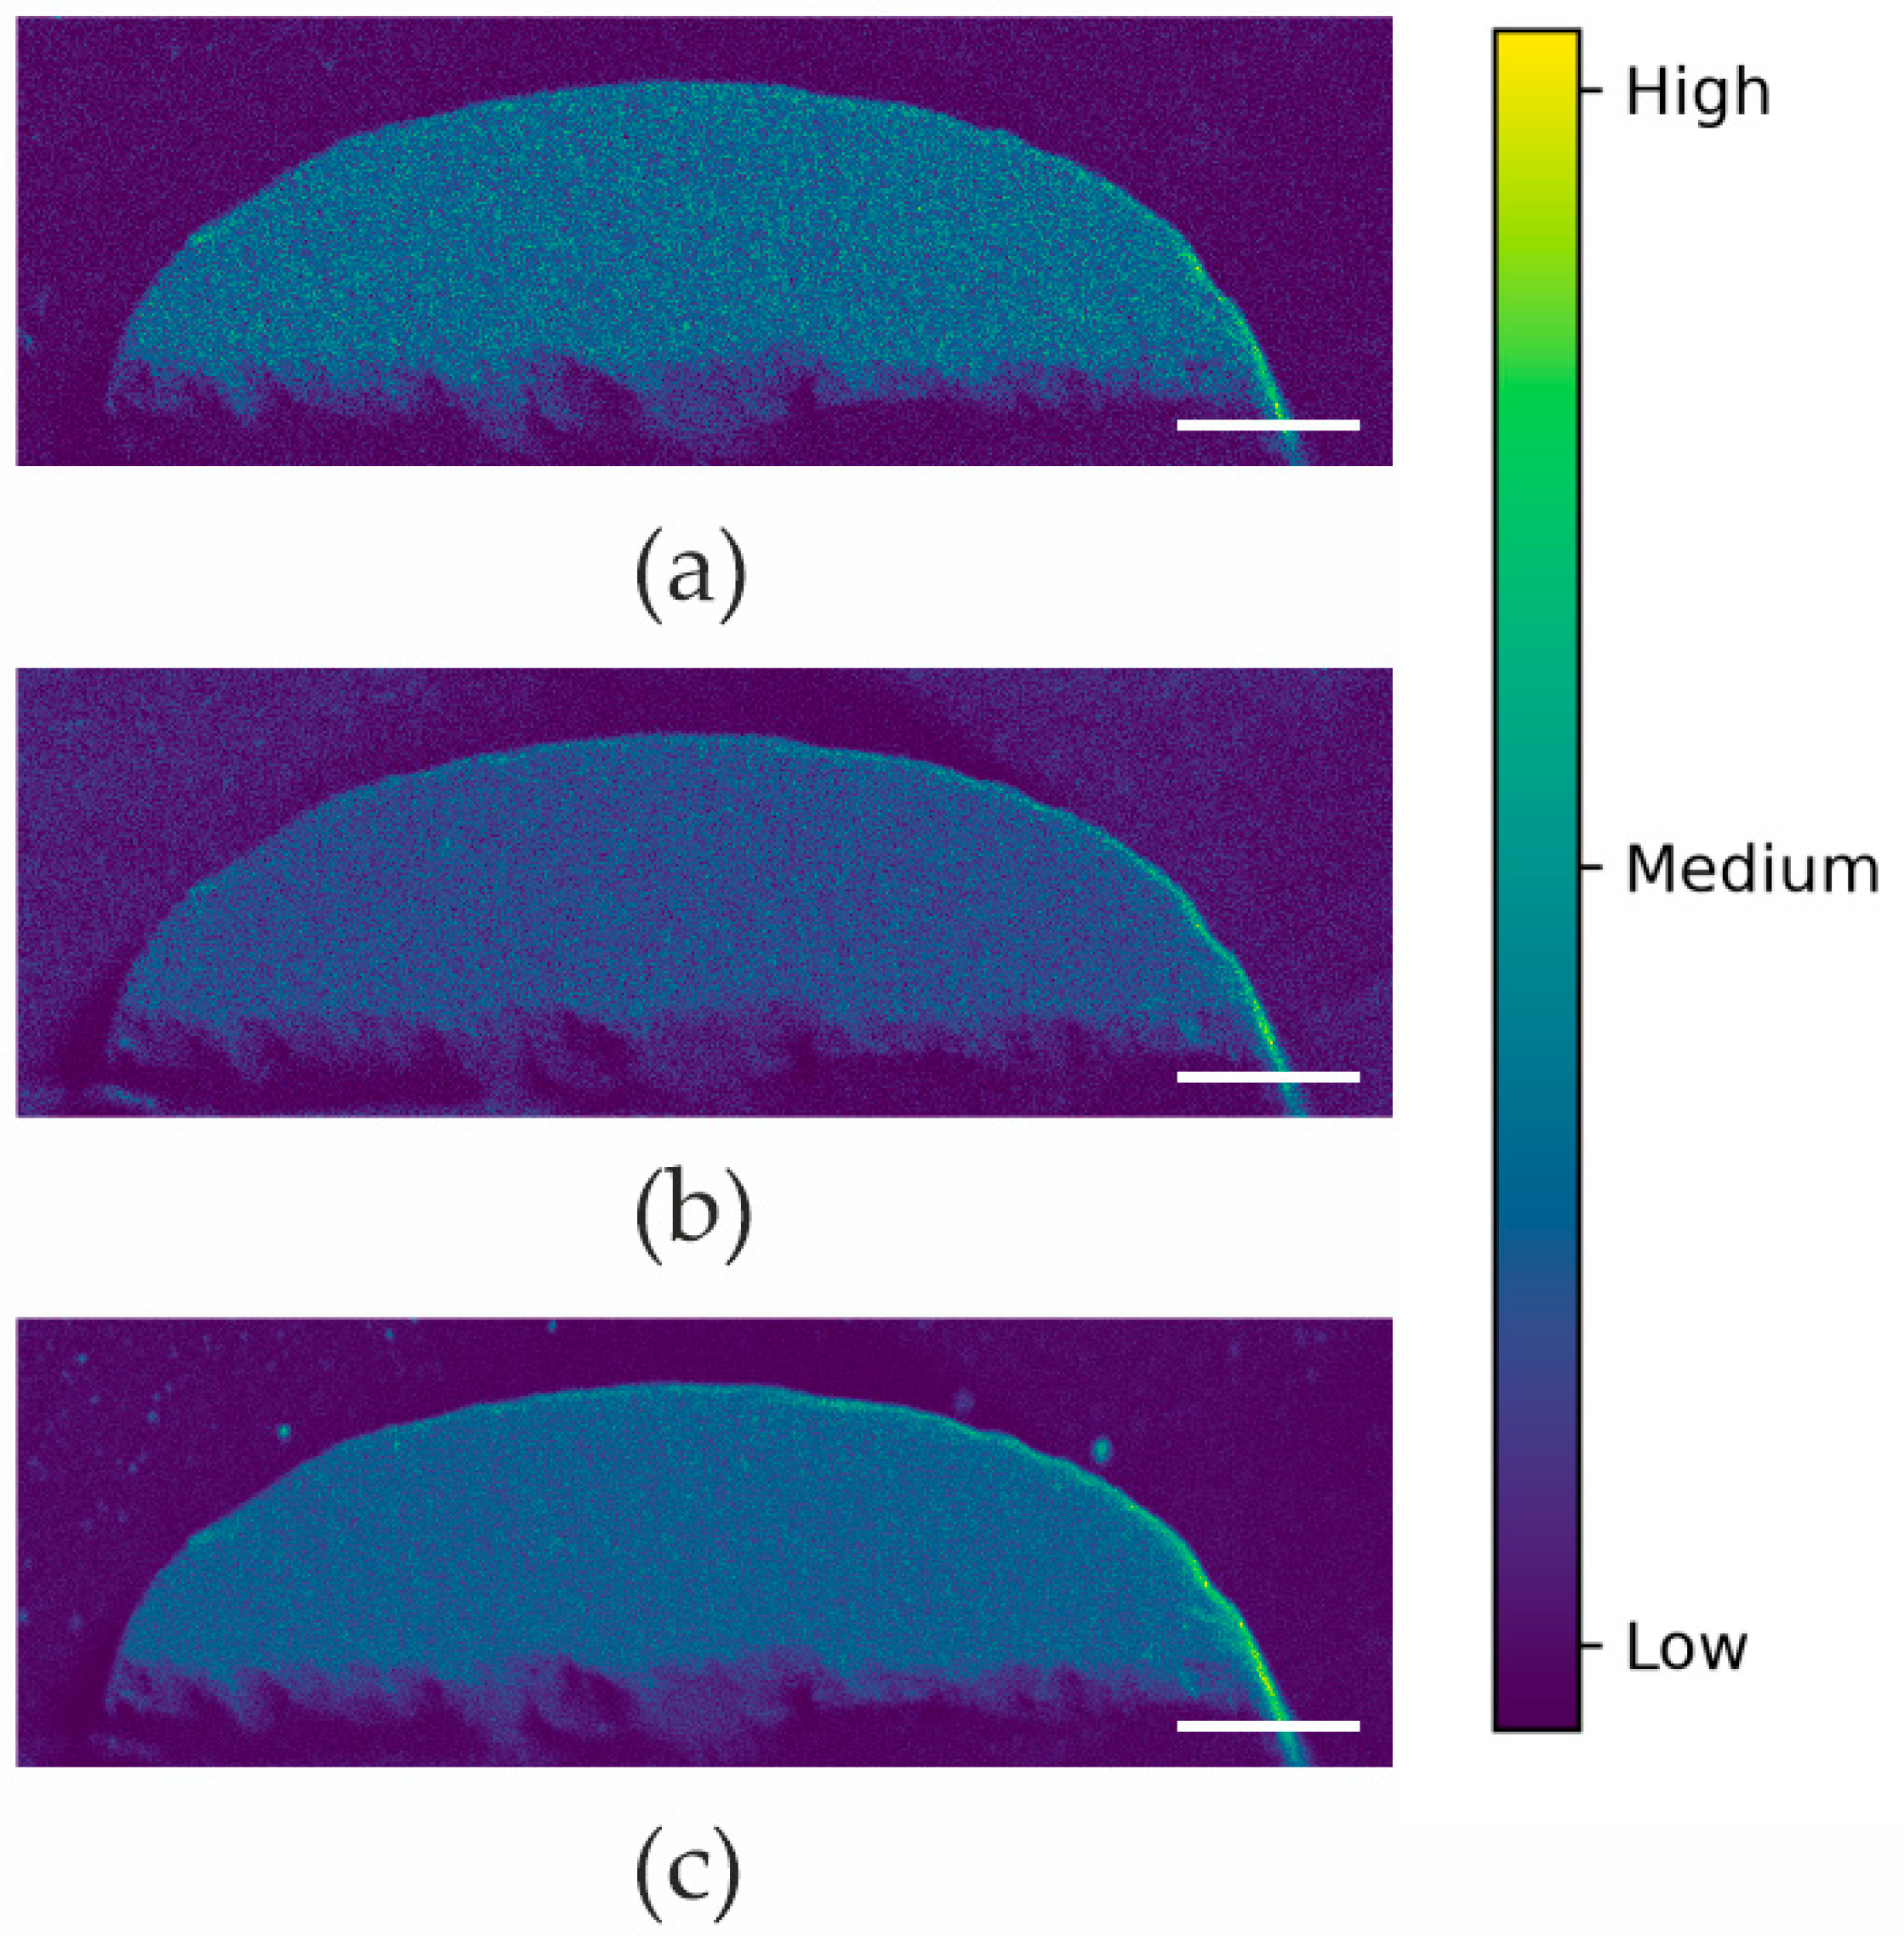
The comparable degree of homogeneity observed in these sections suggests that the K, Ca, and Si present in sample CRM 2742-83—which are virtually absent in SARM 12—do not affect the iron distribution throughout the glass. Furthermore, the major components of this matrix are also distributed uniformly across the section, as shown in Figure 3.
Figure 3.
Cross-sectional elemental distribution maps of glasses prepared by fusing CRM 2742-83 with lithium metaborate: (a) Si, (b) K, and (c) Ca. Scale bar is 2 mm.
These maps reveal high homogeneity for iron and potassium. Silicon and calcium also exhibit good homogeneity, albeit with some “noisiness” due to lower signal intensities. Aluminum homogeneity was not assessed owing to its low signal intensity.
Therefore, irrespective of the iron oxide concentration, the major components of iron-containing ores are uniformly distributed, confirming the suitability of sample preparation methods for XRF analysis of elements such as K, Si, Ca, and Fe.
3.3. WDXRF Calibration
To obtain calibration curves for WDXRF analysis, 20 certified reference samples of iron ores were fused with lithium metaborate according to the procedure described previously. Iron, as well as rock-forming elements, were chosen as analytes. The ranges of certified contents of analytes (all expressed as oxides, excluding iron) in the calibration set are presented in Table 4. Matrix effect correction was applied based on the fundamental parameters approach, using the “variable alphas” option of spectrometer SpectraPlus software. Table 3 also contains Root Mean Squared Error (RMSE) values and relative RMSE (RMSErel) values, calculated as the ratio of RMSE to the average content of the analyte in the calibration set.
Table 4.
Certified content ranges of compounds in 20 iron ore reference samples used for WDXRF spectrometer calibration.
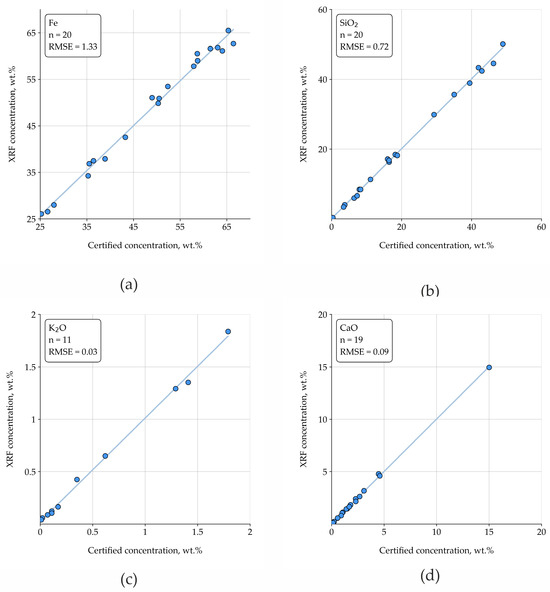
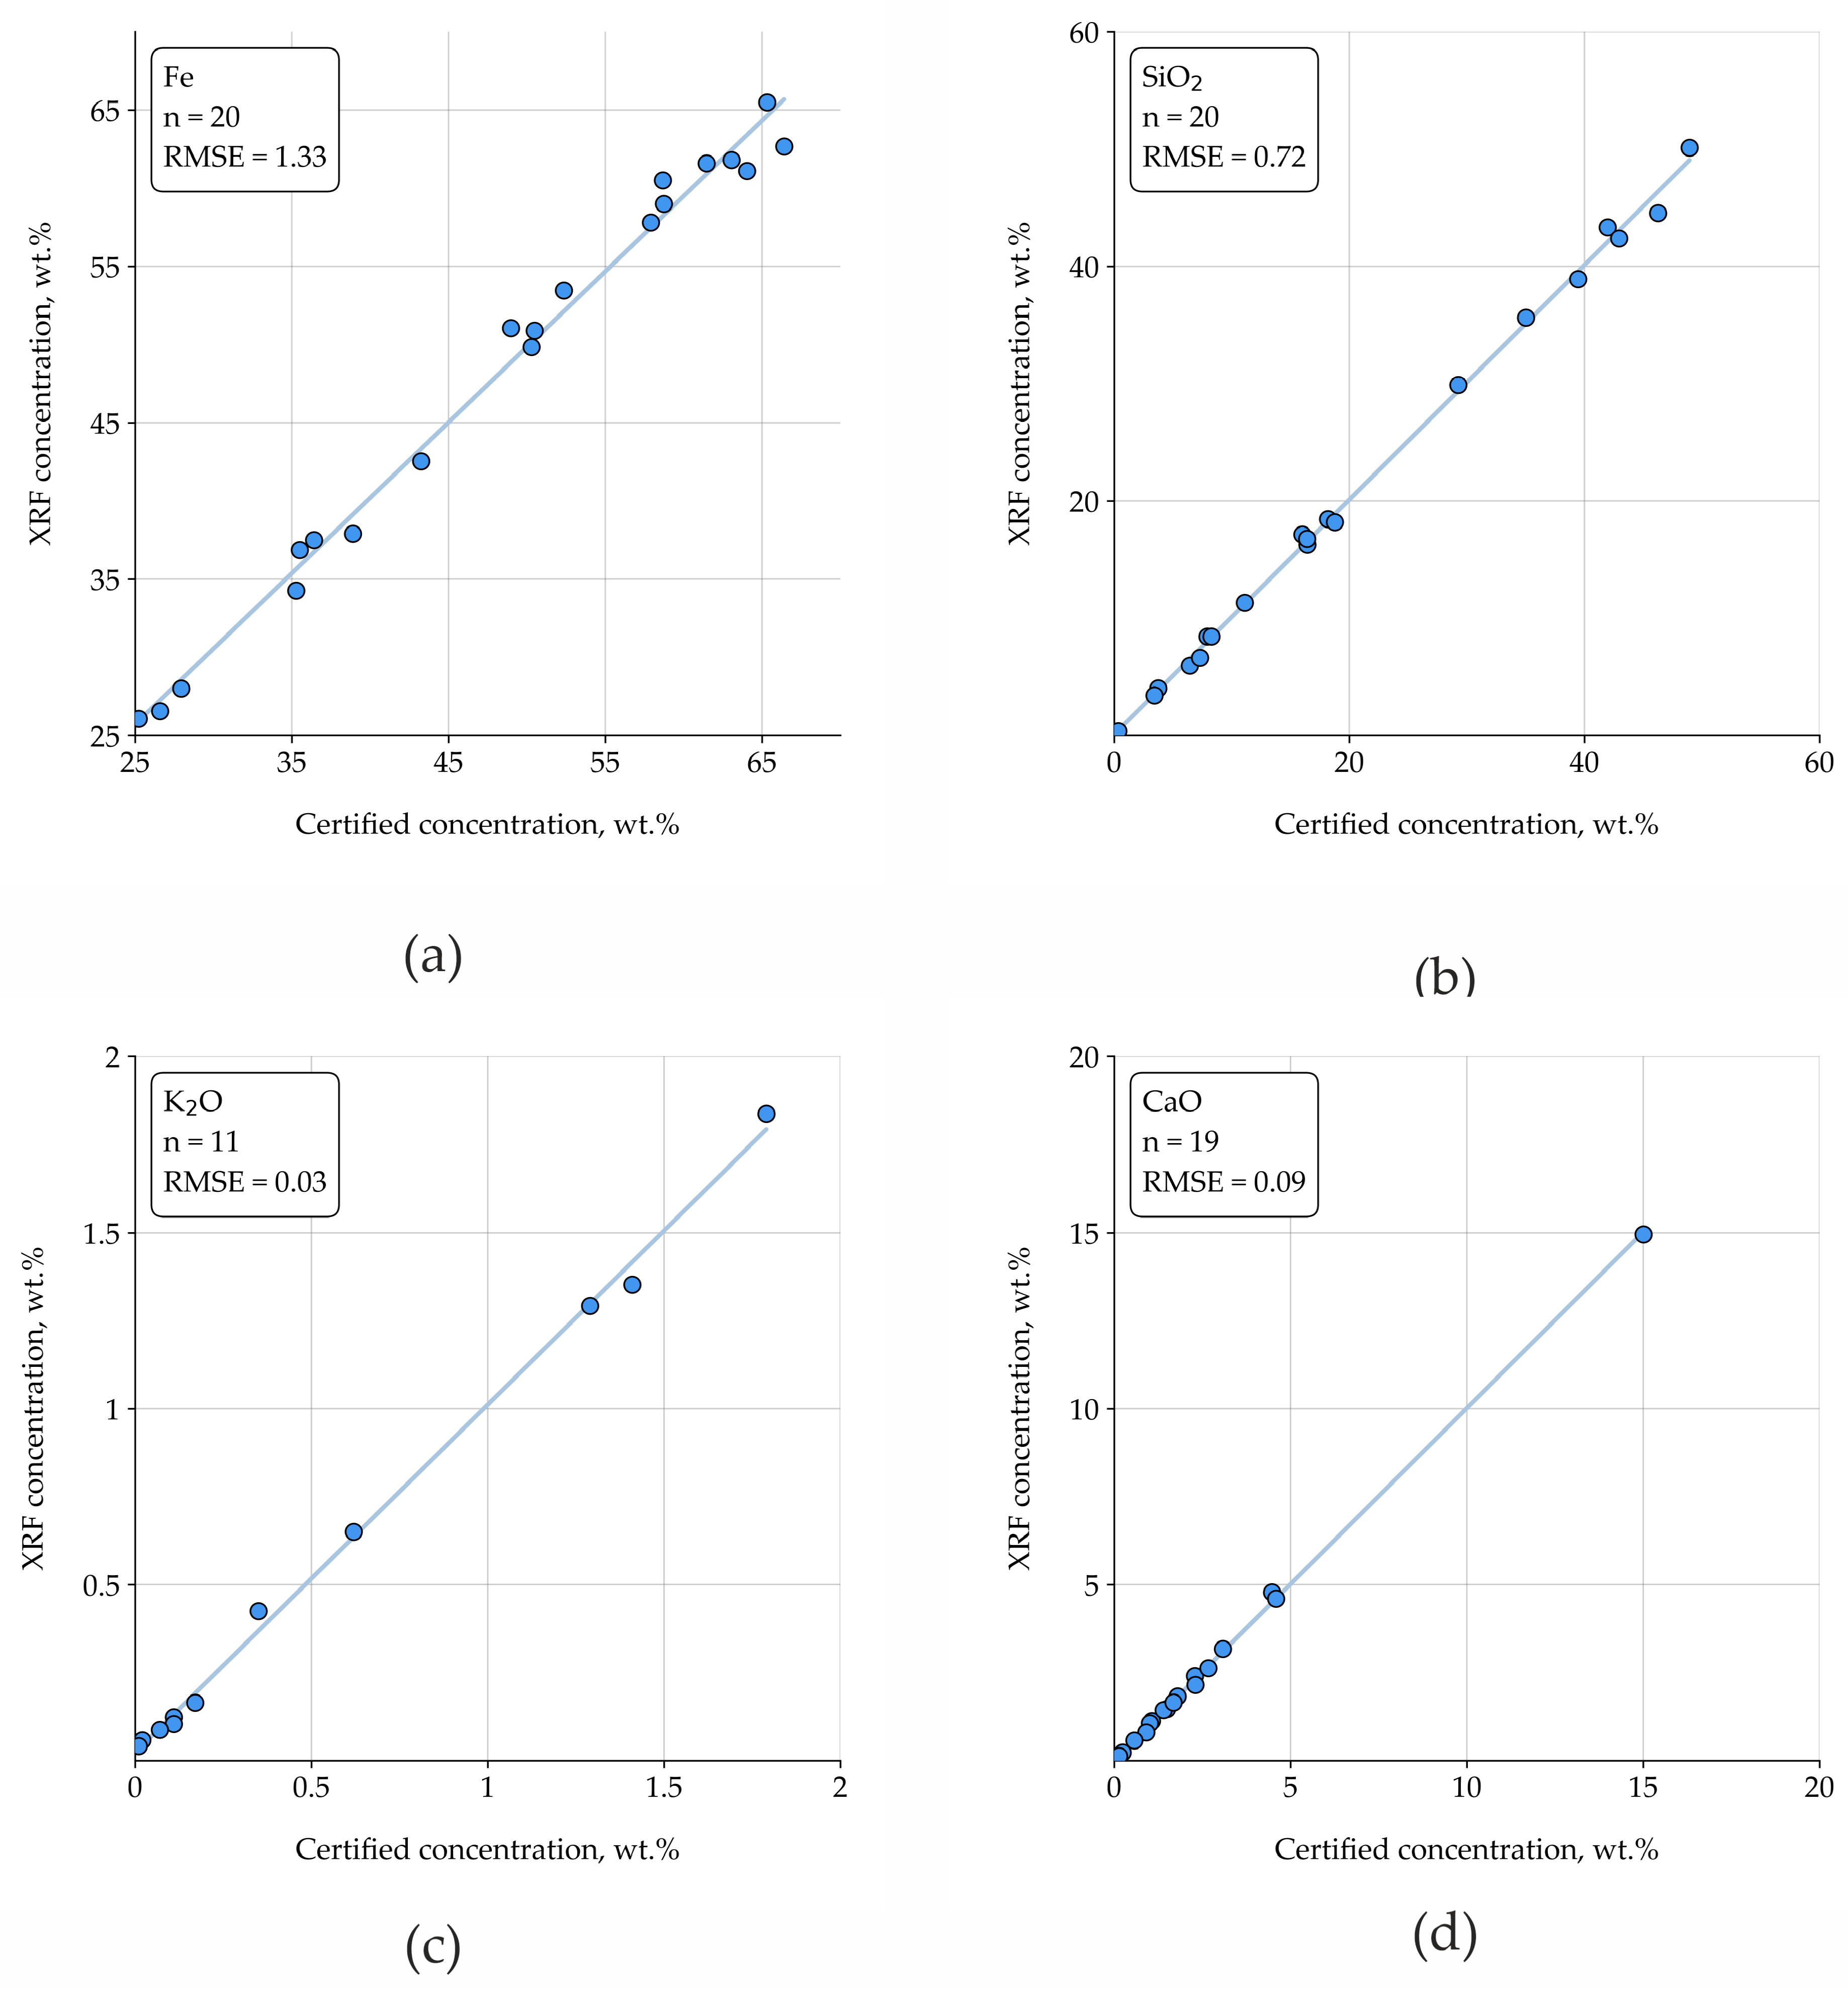
For all determined elements, linear regression of measured concentrations versus certified values showed slope coefficients close to 1, while intercept values were statistically insignificant; the coefficients of determination were above 0.99. More detailed information about all RMs can be seen in the Supplementary Materials (Table S2).
This confirms the absence of systematic error throughout the concentration range investigated. As an example, Figure 4 shows the correlations between certified concentrations and the results of WDXRF for four analytes found as main compounds of minerals detected in ochre samples (see Section 3.1): Fe, SiO2, K2O, and CaO. Correlations for other rock-forming elements are shown in the Supplementary Materials (Figure S1).
Figure 4.
Calibration curves for WDXRF determination of (a) Fe, (b) SiO2, (c) K2O, and (d) CaO in RMs fused with lithium metaborate.
3.4. Validation of WDXRF Iron Determination in Ochre Samples of Varying Phase Compositions
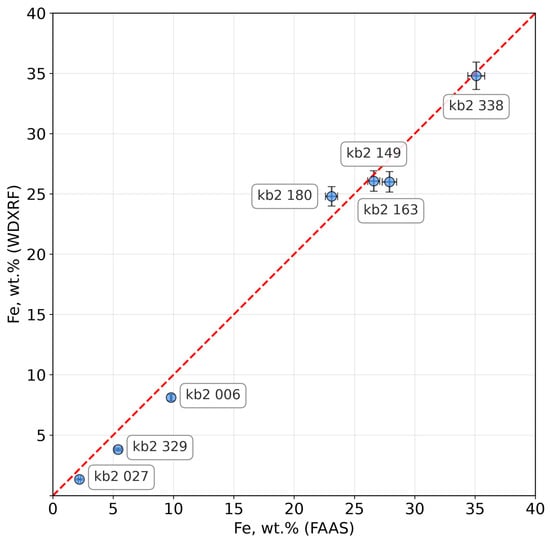
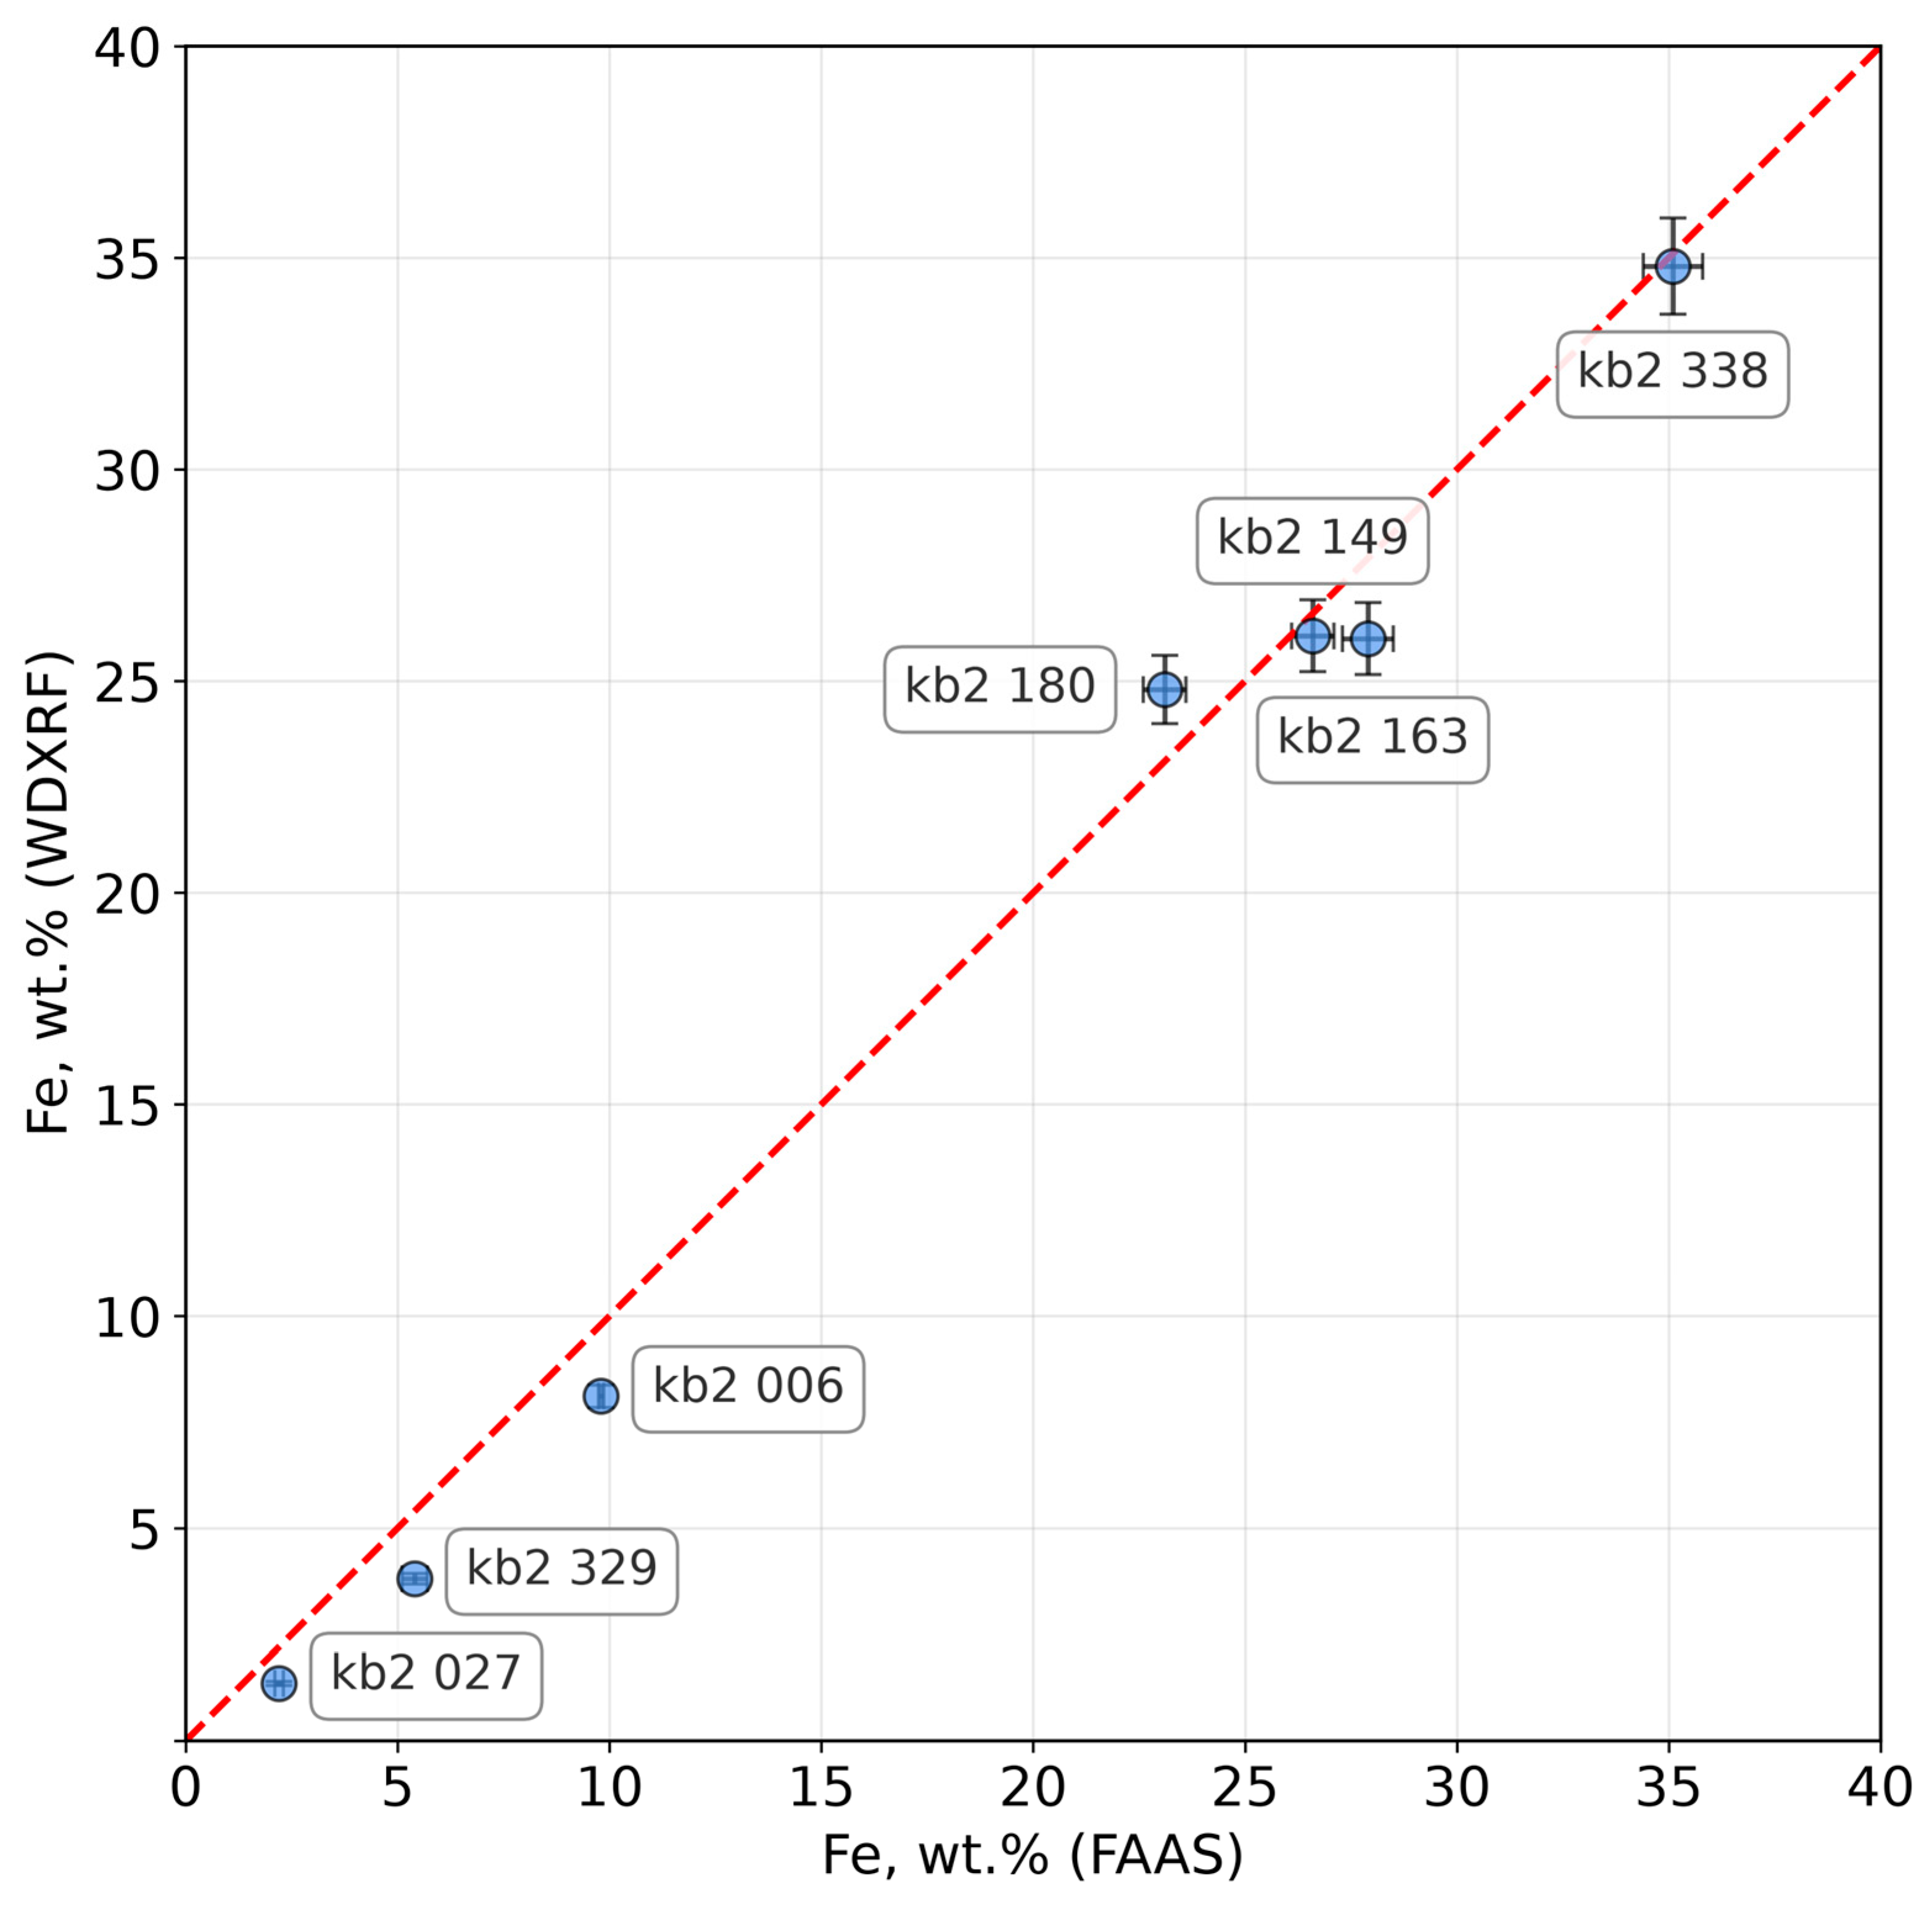
Samples weighing approximately 110 mg were fused with lithium metaborate, while 20 mg portions of each sample were subjected to complete acid mineralization. A comparison of the results is presented in Figure 5.
Figure 5.
Pairplot illustrating the correspondence between iron concentrations determined by FAAS and WDXRF. Additional data presented in Supplementary Materials (Table S3).
Due to the limited number of archeological ochre samples, a comprehensive metrological processing of the results, including parallel measurements, was not possible. A comparison of individual results revealed discrepancies in iron content between the FAAS and WDXRF methods for only two samples: sample kb2 163 (28.0 ± 0.6 vs. 26.0 ± 0.8 wt.%) and sample kb2 180 (23.0 ± 0.5 vs. 24.8 ± 0.8 wt.%). Most likely, these differences are related to the melting characteristics of various minerals present in the archaeological ochre (for example, jarosite was detected in sample kb2 180; see Table 1).
However, a comparison of the iron determination results for the remaining five archeological ochre samples suggests that, in most cases, WDXRF analysis of glasses obtained by fusing 110 mg samples with lithium metaborate yields accurate results.
3.5. Application of Sodium Tetraborate as a Flux for the Fusion of Ochre Samples (Preliminary Data)
Some researchers consider sodium tetraborate to be a more accessible and equipment-friendly [47,57,58] flux for XRF macrocomponent determination and mass spectrometric determination of ore microcomposition, preferring it for its theoretically higher solubility of certain minerals during smelting and enhanced analytical reproducibility due to the higher cation mass. Our initial attempt to use sodium tetraborate as an alternative to lithium metaborate, without prior preparation, led to the scattering of both the flux and the sample, caused by the intense release of water vapor at approximately 300 °C. Consequently, we established optimal pretreatment parameters for sodium tetraborate decahydrate to effectively remove water.
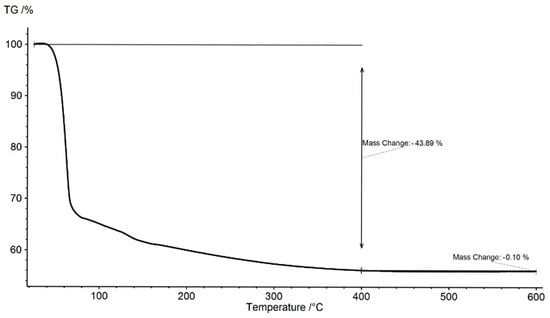
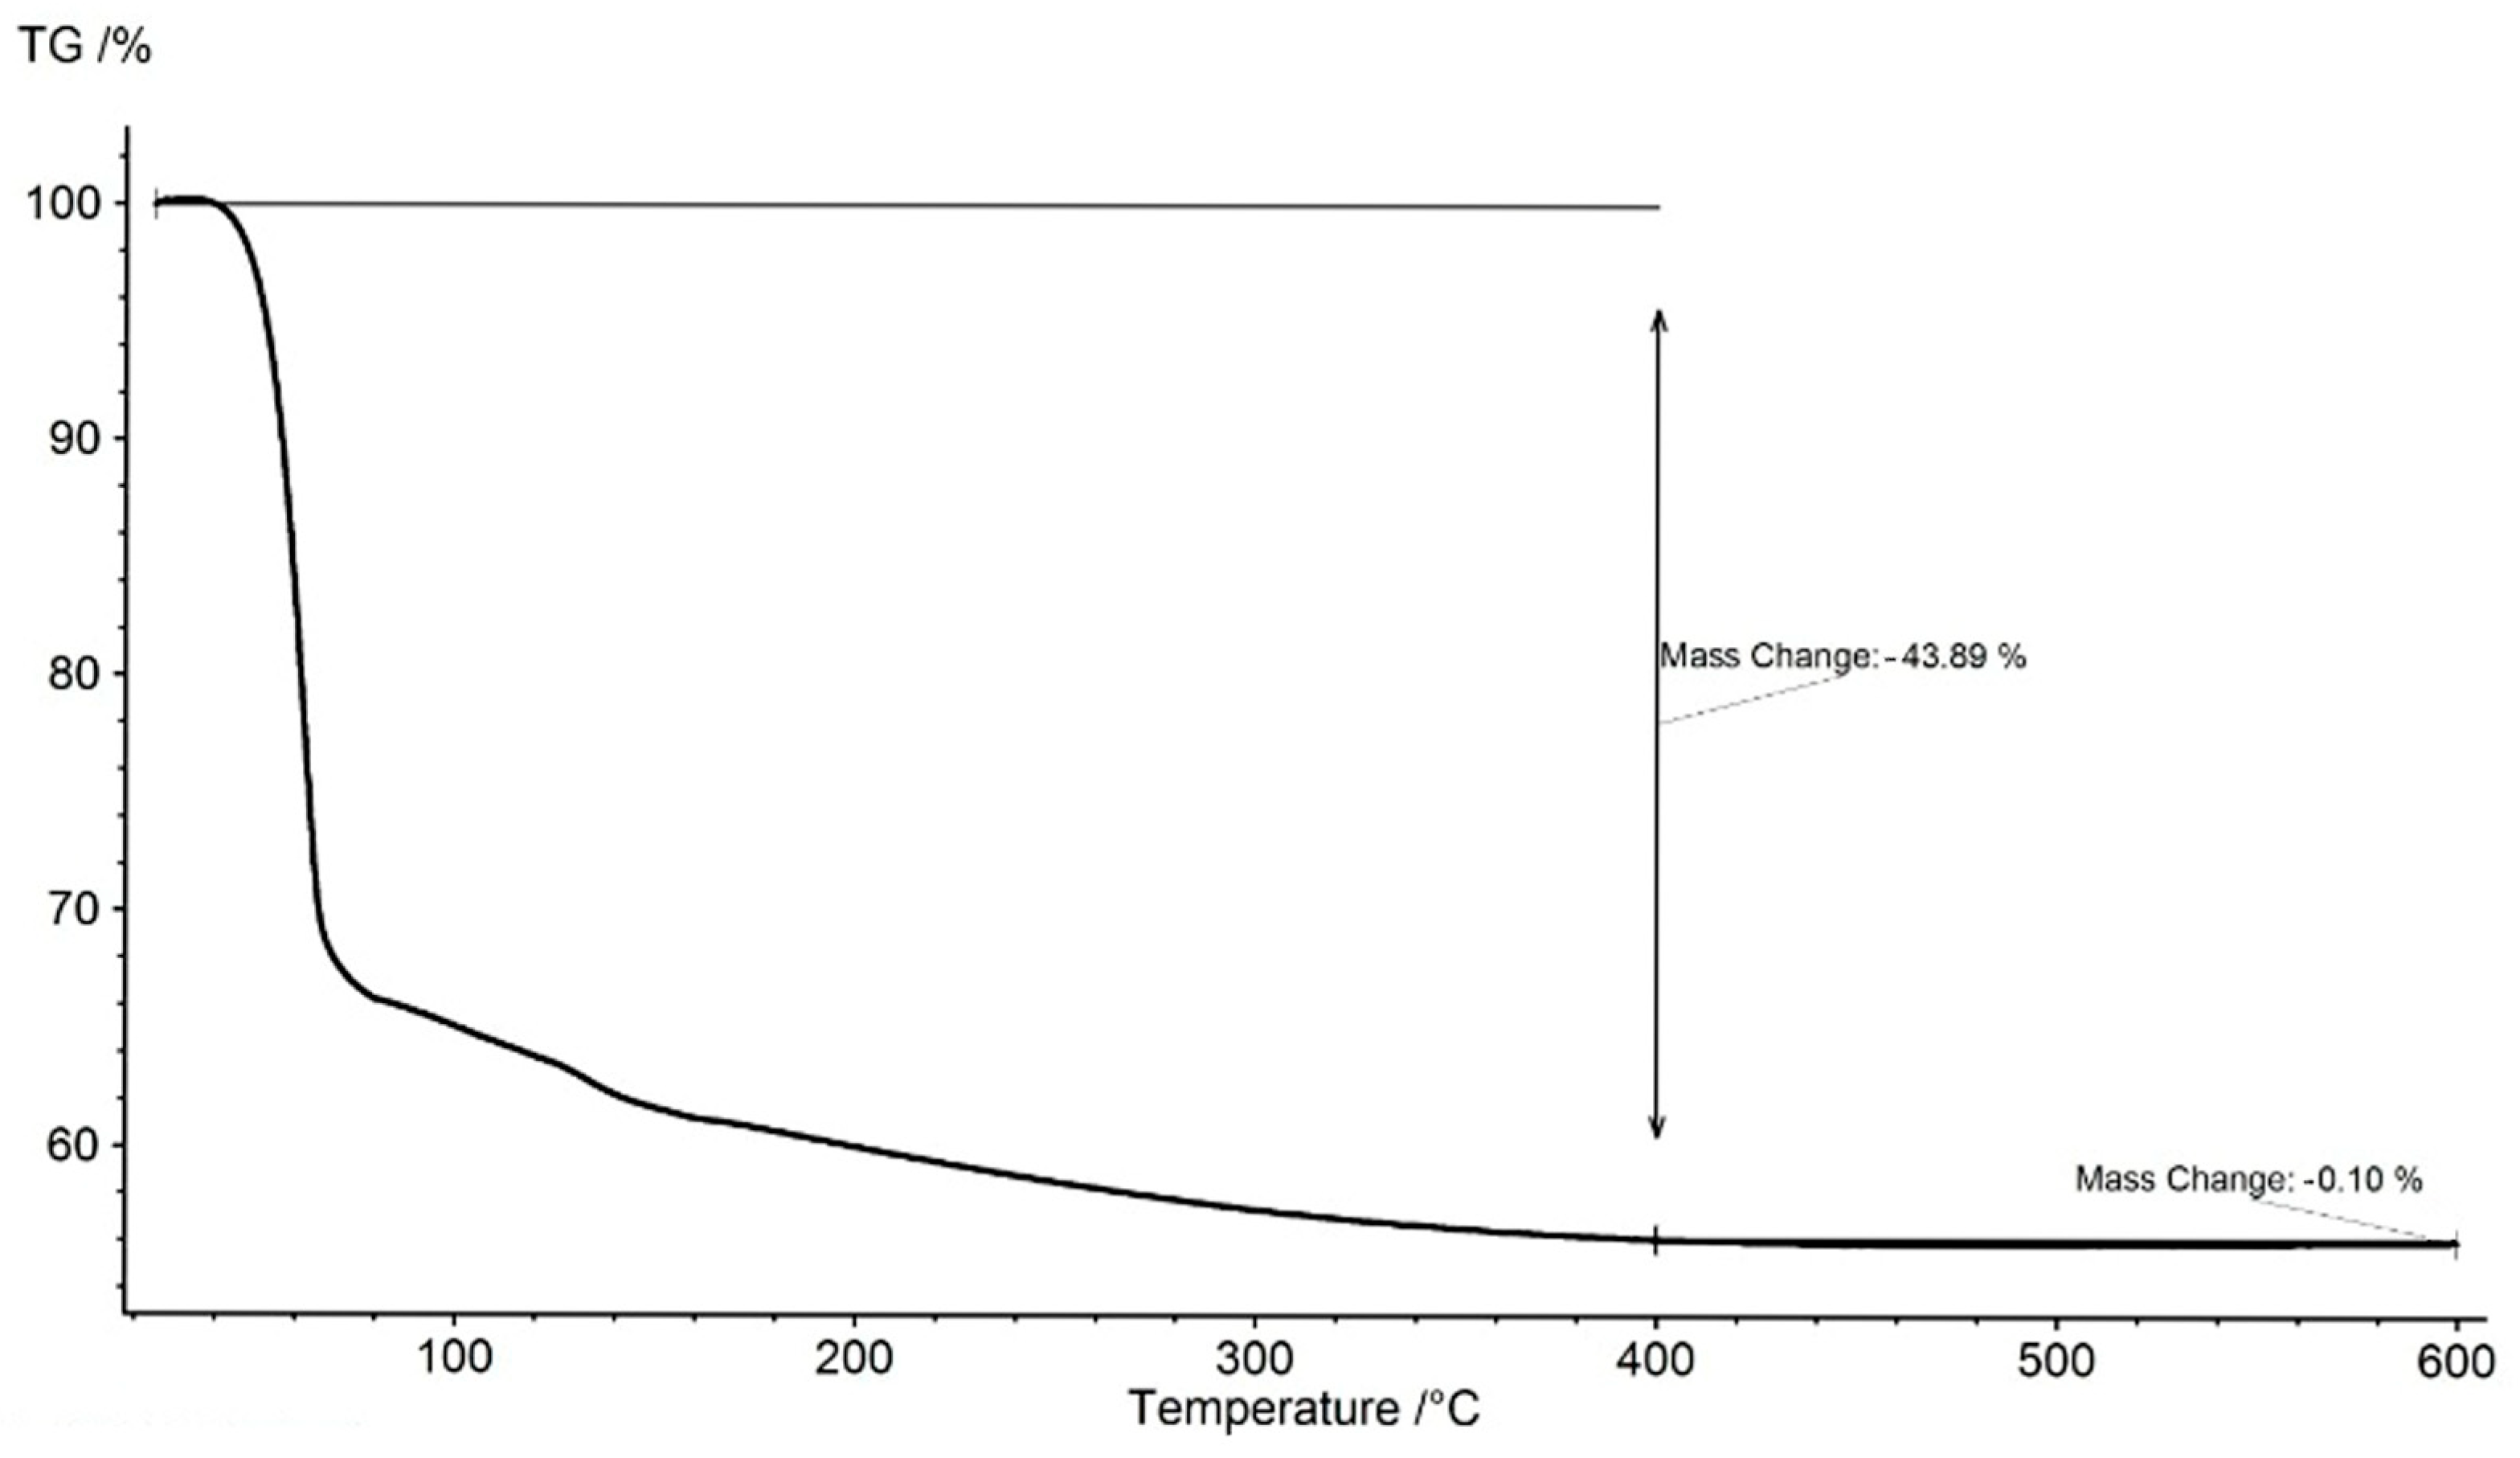
For this purpose, a thermogravimetric study of the crystalline hydrate was conducted, with results presented in Figure 6.
Figure 6.
Thermogravimetric analysis results for sodium tetraborate decahydrate.
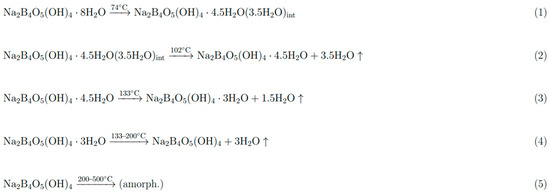
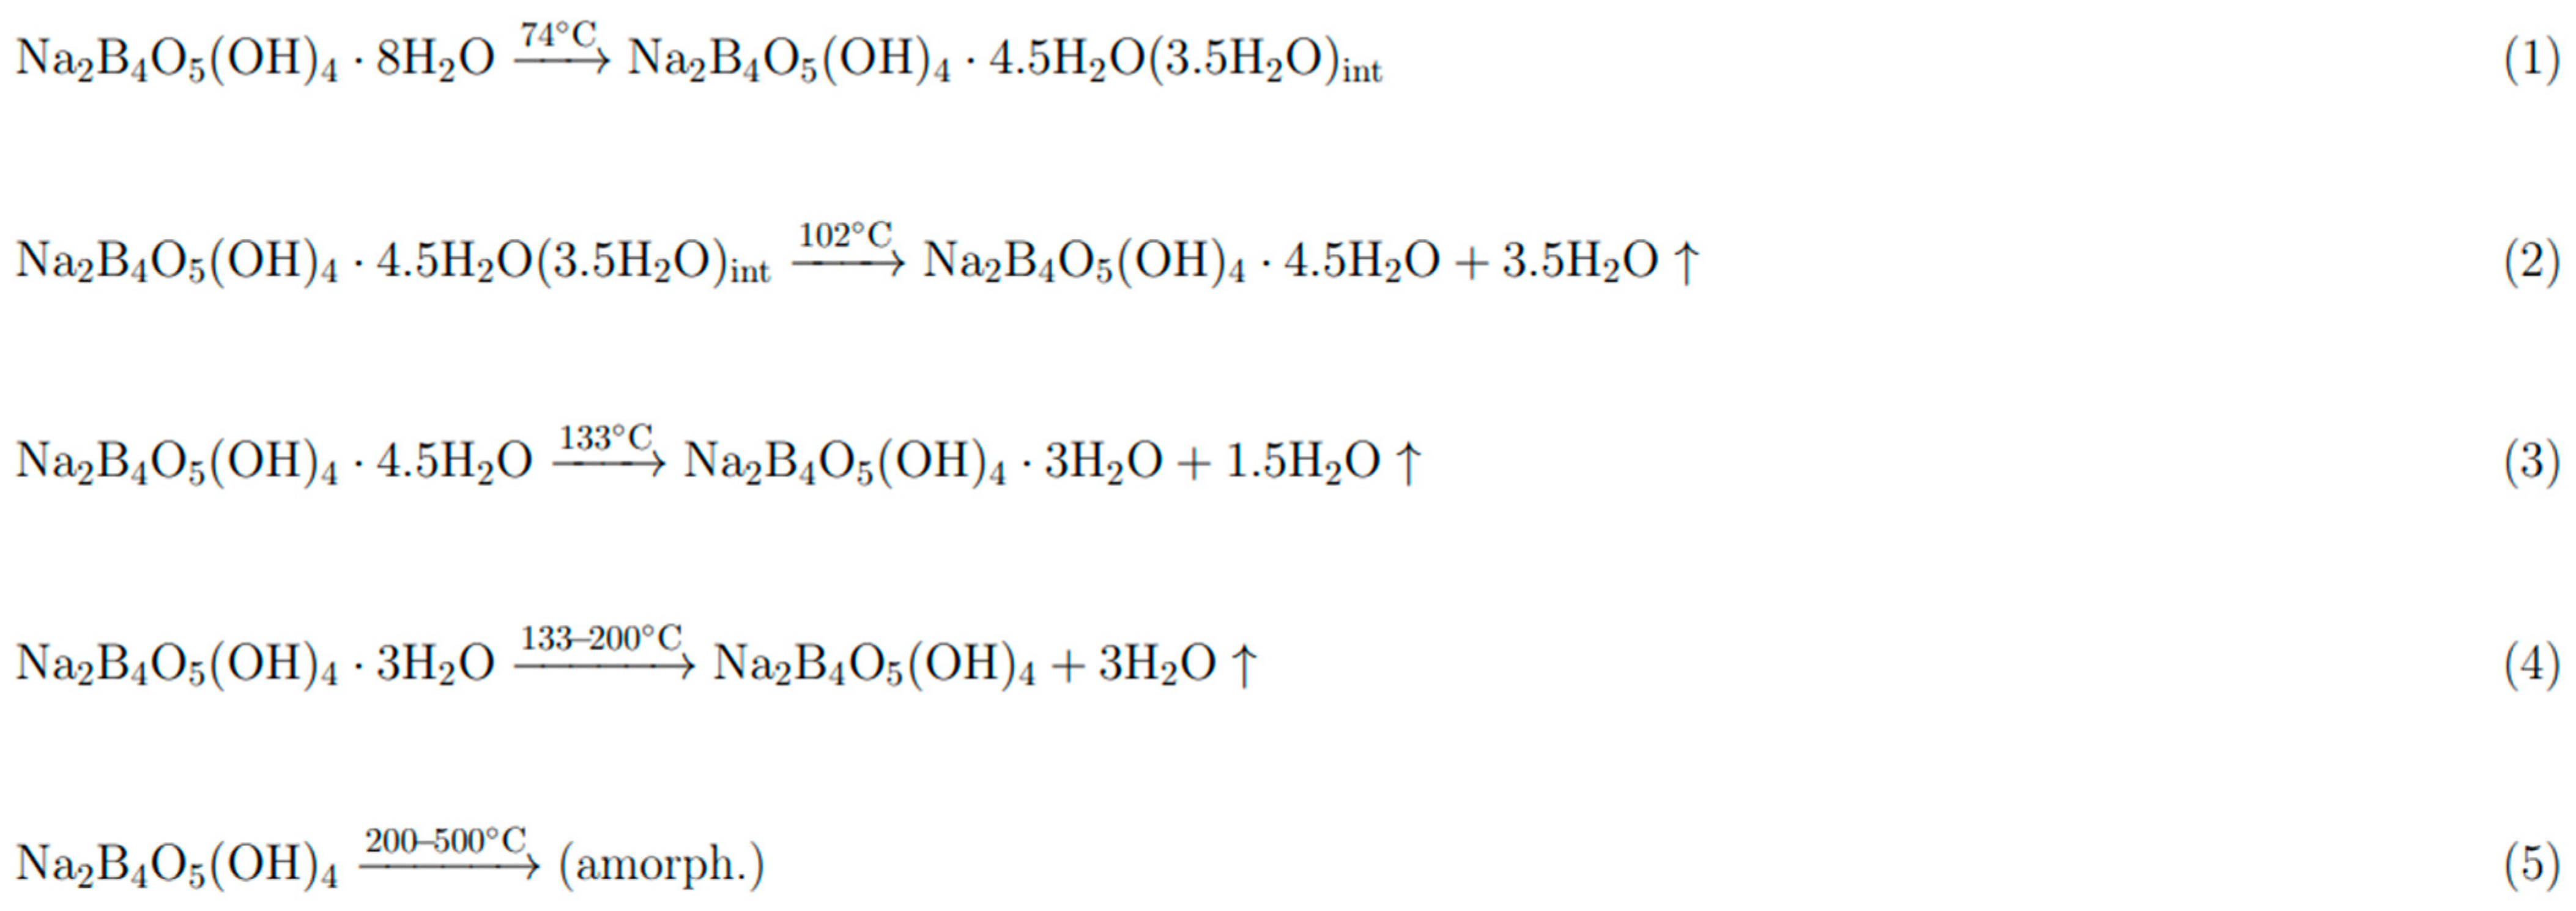
As illustrated in Figure 6, the crystalline hydrate of sodium tetraborate undergoes a mass loss of approximately 44% upon heating to 400 °C. At a low heating rate, dehydration initiates at around 45 °C, with the majority of water released by 70 °C. This stage eliminates most of the water vapor responsible for scattering the sample and flux. Subsequent heating from 70 °C to 400 °C results in an additional ~10% mass loss, half of which occurs by 200 °C. The residual trace water is removed from Na2O·2B2O3 up to 600 °C, concurrently with recrystallization into the anhydrous crystalline phase, according to [56]. Experimentally, a mass loss of 43.9 ± 0.8 wt.% was recorded, implying that the commercial “decahydrate” initially comprised an average of 8.8 water molecules prior to thermogravimetric analysis. For the stoichiometric composition Na2B4O7·10H2O, complete dehydration would yield a mass loss of 47.2 ± 0.8%.
It can be assumed that the dehydration of the starting compound first proceeds to sodium tetraborate pentahydrate, Na2B4O7·5H2O, followed almost immediately by the formation of Na2B4O7. At this stage, the theoretical mass loss amounts to 14.5 wt.% of the initial mass. The remaining ~10% mass loss is attributed to two water molecules released upon heating above 200 °C. According to data from the literature, an alternative process at 200–400 °C involves the transition of sodium tetraborate dihydrate from a crystalline to an amorphous state. However, if the final product were Na2B4O7·2H2O, the mass loss would be only 37.7%; thus, the most likely product upon heating sodium tetraborate to 400 °C remains anhydrous Na2B4O7. The proposed dehydration mechanism based on the literature [56] is shown in Figure 7.
Figure 7.
Possible dehydration mechanism for sodium tetraborate decahydrate.
We recommend the following temperature program for pre-treating sodium tetraborate decahydrate in a muffle furnace: heat from room temperature to 70 °C at a rate of 1 °C/min, hold at this temperature for 10 min, then ramp to 400 °C without controlling the heating rate, and finally hold at 400 °C for 3 h.
This treatment converts the flux into Na2O·2B2O3, making it suitable for subsequent fusion with ochre samples. However, the dehydrated flux exhibits high porosity: the initially powdery material foams and sinters into a voluminous, foam-like structure upon heating. To address this, the flux should be ground immediately before use to minimize the volume it occupies in the crucible.
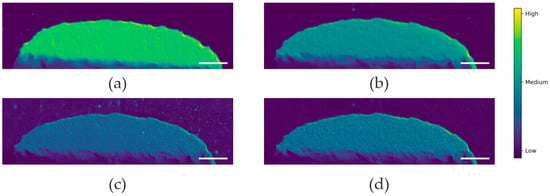
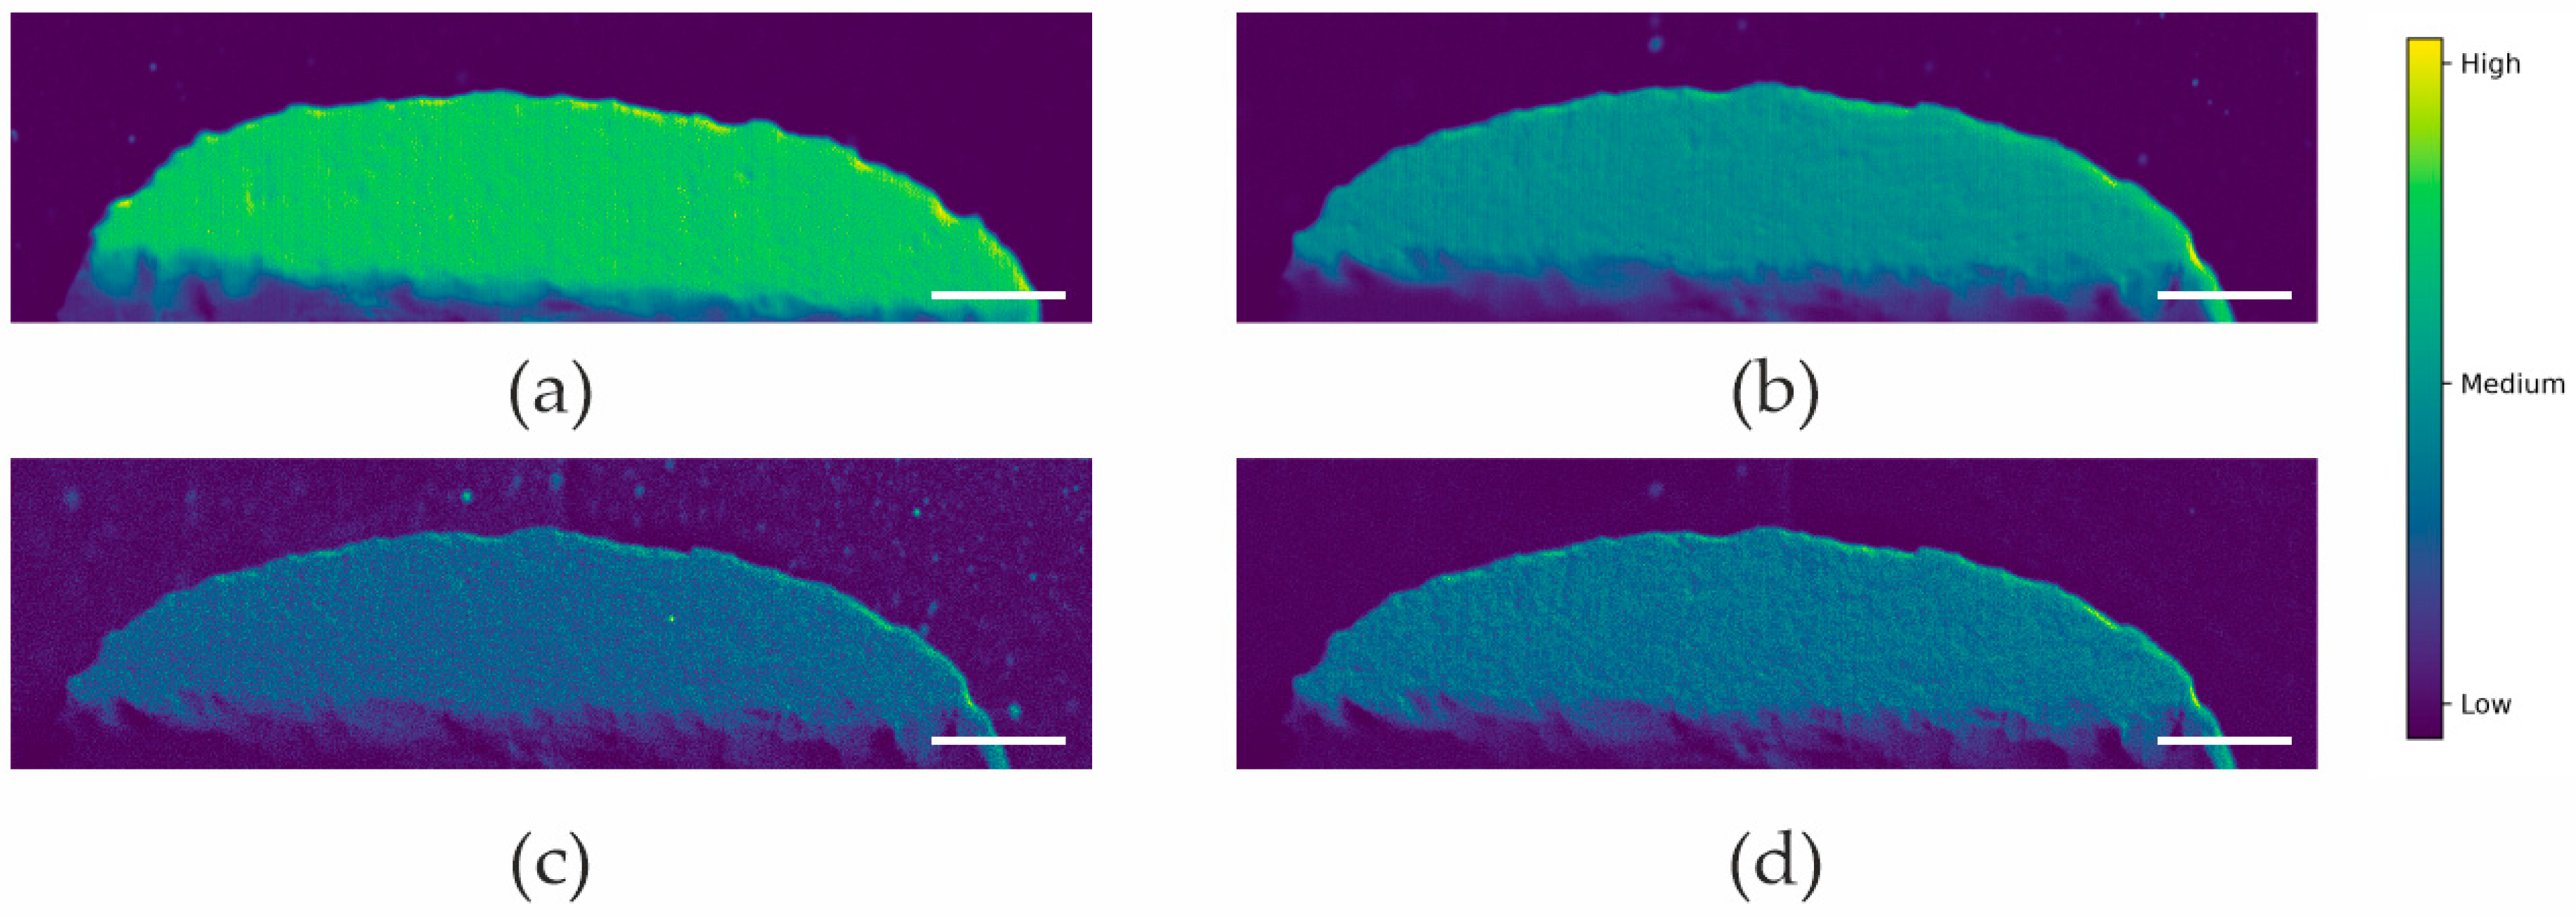
To evaluate the efficacy of this flux relative to lithium metaborate, we conducted elemental mapping on glasses derived from fusing certified iron ore reference samples SARM 12 and CRM 2742-83. The resulting images are presented in Figure 8.
Figure 8.
Cross-sectional elemental distribution maps of glasses prepared by fusing with the sodium tetraborate: (a) Fe, sample SARM 12; (b) Fe, sample CRM 2742-83; (c) Ca, sample CRM 2742-83; (d) K, sample CRM 2742-83. The scale bar is 2 mm.
Regarding the compositional uniformity of the resulting glass, this flux performs comparably to lithium metaborate for iron ore samples containing magnetite. Future research will investigate the potential for quantitative analysis of archeological ochre glasses using sodium tetraborate as a fusion flux.
4. Conclusions
In this study, we investigated the feasibility of using WDXRF to determine the major components of small archeological ochre samples and analogous iron-bearing ores following fusion with lithium metaborate. The results demonstrated that the resulting glass beads exhibited a high degree of compositional homogeneity across a broad range of iron concentrations. This finding was confirmed directly for two certified magnetite ore reference materials through elemental microXRF mapping and indirectly by constructing linear calibration curves based on twenty certified reference materials. Calcium, silicon, and potassium—elements commonly associated with archaeological ochre—were likewise distributed uniformly throughout the cross-sections of the fused samples.
To validate the proposed analytical procedure, seven archeological ochre specimens were processed, and the accuracy of iron determination was evaluated by flame atomic absorption spectrometry. The potential of sodium tetraborate as an alternative flux was also assessed on a preliminary basis. Qualitative examination of the microXRF maps indicated that glasses produced using pre-treated borax exhibited compositional uniformity comparable to that achieved with the metaborate-based procedure. Overall, the proposed approach provides a cost-effective strategy for the analysis of major components in large collections of archaeological ochre. Nevertheless, a comprehensive evaluation of its applicability will require the analysis of a larger set of archaeological ochre samples characterized by diverse macro- and microelement compositions and containing chromophoric phases hosted by different minerals.
Supplementary Materials
The following supporting information can be downloaded at https://www.mdpi.com/article/10.3390/analytica7040068/s1, Table S1. Composition of RMs used with confidence intervals (where possible). For RMs KZ.03.01.00210-2010. KZ.03.01.00211-2010. KZ.03.01.00212-2010. KZ.03.01.00213-2010. №195. 1-B. 8488-2003 the confidence interval is not specified. For SARM 12 the manufacturer provides limits at 95% confidence level. which is given in braces. All values are presented in wt.%. Table S2. Data set used for WDXRF spectrometer calibration. Table S3. Data obtained with FAAS and WDXRF analysis of archaeological ochre pieces. Figure S1. Calibration curves for WDXRF analysis of ochre: (a)—TiO2, (b)—MnO, (c)—Al2O3, (d)—MgO, (e)—Na2O, (f)—P2O5. Figure S2. XRD data for kb2 149. Figure S3. XRD data for kb2 006. Figure S4. XRD data for kb2 180.
Author Contributions
Conceptualization, V.L. and M.S.; methodology, V.C., A.A. and V.L.; investigation, M.P., A.Z., A.A. and V.L.; resources, G.P., V.C., and M.S.; data curation, M.S., V.C. and V.L.; writing—original draft preparation, V.L. and V.C.; writing—review and editing, V.C., G.P. and M.S.; visualization, M.S. and V.L.; project administration, M.S. and V.L. All authors have read and agreed to the published version of the manuscript.
Funding
This work was carried out as part of a state assignment of the Lomonosov Moscow State University, project # AAAA-A21-121011990021-7, and of the Vinogradov Institute of Geochemistry, Siberian Branch of the Russian Academy of Sciences, project 0284-2026-0010.
Data Availability Statement
The data presented in this study are available in the article.
Acknowledgments
The research was performed using the equipment of the Geodynamics and Geochronology center at the Institute of the Earth’s Crust SB RAS and the Isotope-Geochemical Studies center at the Vinogradov Institute of Geochemistry SB RAS. M. S., V. L. and M.P. are grateful to the M.V. Lomonosov Moscow State University Program of Development for granting them access to the Tornado M4+ spectrometer and the NETZSCH TG 209 F1 Libra thermogravimetric analyzer.
Conflicts of Interest
The authors declare no conflicts of interest.
References
- Popelka-Filcoff, R.S.; Zipkin, A.M. The Archaeometry of Ochre Sensu Lato: A Review. J. Archaeol. Sci. 2022, 137, 105530. [Google Scholar] [CrossRef] [Scilit]
- Dayet, L.; Le Bourdonnec, F.-X.; Daniel, F.; Porraz, G.; Texier, P.-J. Ochre Provenance and Procurement Strategies During The Middle Stone Age at Diepkloof Rock Shelter, South Africa. Archaeometry 2016, 58, 807–829. [Google Scholar] [CrossRef] [Scilit]
- Montalto, N.A.; Shortland, A.; Rogers, K. The Provenancing of Ochres from the Neolithic Temple Period in Malta. J. Archaeol. Sci. 2012, 39, 1094–1102. [Google Scholar] [CrossRef] [Scilit]
- Bouillot, L.D.; Wurz, S.; Daniel, F. Ochre Resources, Behavioural Complexity and Regional Patterns in the Howiesons Poort: New Insights From Klasies River Main Site, South Africa. J. Afr. Archaeol. 2017, 15, 20–41. [Google Scholar] [CrossRef] [Scilit]
- Watts, I. Ochre in the Middle Stone Age of Southern Africa: Ritualised Display or Hide Preservative? S. Afr. Archaeol. Bull. 2002, 57, 1–14. [Google Scholar] [CrossRef] [Scilit]
- Cuenca-Solana, D.; Gutiérrez-Zugasti, I.; Ruiz-Redondo, A.; González-Morales, M.R.; Setién, J.; Ruiz-Martínez, E.; Palacio-Pérez, E.; de las Heras-Martín, C.; Prada-Freixedo, A.; Lasheras-Corruchaga, J.A. Painting Altamira Cave? Shell Tools for Ochre-Processing in the Upper Palaeolithic in Northern Iberia. J. Archaeol. Sci. 2016, 74, 135–151. [Google Scholar] [CrossRef] [Scilit]
- Froment, F.; Tournié, A.; Colomban, P. Raman Identification of Natural Red to Yellow Pigments: Ochre and Iron-Containing Ores. J. Raman Spectrosc. 2008, 39, 560–568. [Google Scholar] [CrossRef] [Scilit]
- Trabska, J.; Samek, L.; Dutkiewicz, E. Ferruginous Raw Material Sources for Palaeolithic in Poland (Central Europe)—Provenance Studies: Occurrence, Litostratigraphy and Application. In Proceedings of the 9th International Conference on NDT of Art, Jerusalem, Israel, 25–30 May 2008. [Google Scholar]
- Wojcieszak, M.; Wadley, L. A Raman Micro-Spectroscopy Study of 77,000 to 71,000 Year Old Ochre Processing Tools from Sibudu, KwaZulu-Natal, South Africa. Herit. Sci. 2019, 7, 24. [Google Scholar] [CrossRef] [Scilit]
- Smith, M.A.; Pell, S. Oxygen-Isotope Ratios in Quartz as Indicators of the Provenance of Archaeological Ochres. J. Archaeol. Sci. 1997, 24, 773–778. [Google Scholar] [CrossRef] [Scilit]
- Lebon, M.; Beck, L.; Grégoire, S.; Chiotti, L.; Nespoulet, R.; Menu, M.; Paillet, P. Prehistoric Pigment Characterisation of the Abri Pataud Rock-Shelter (Dordogne, France). Open J. Archaeom. 2014, 2, 5456. [Google Scholar] [CrossRef] [Scilit]
- Beck, L.; Salomon, H.; Lahlil, S.; Lebon, M.; Odin, G.P.; Coquinot, Y.; Pichon, L. Non-Destructive Provenance Differentiation of Prehistoric Pigments by External PIXE. Nucl. Instrum. Methods Phys. Res. Sect. B Beam Interact. Mater. At. 2012, 273, 173–177. [Google Scholar] [CrossRef] [Scilit]
- Thomas, P.S.; Stuart, B.H.; McGowan, N.; Guerbois, J.P.; Berkahn, M.; Daniel, V. A Study of Ochres from an Australian Aboriginal Bark Painting Using Thermal Methods. J. Therm. Anal. Calorim. 2011, 104, 507–513. [Google Scholar] [CrossRef] [Scilit]
- Pakhunov, A.S.; Svetogorov, R.D.; Ovcharov, A.; Shushunov, M.N.; Senin, R.A. Analysis of Ochre Samples from the Cultural Layer of the Chamber of Signs at the Kapova Cave. Ross. Arkheol. 2021, 1, 18–30. [Google Scholar] [CrossRef] [Scilit]
- Villa, P.; Pollarolo, L.; Degano, I.; Birolo, L.; Pasero, M.; Biagioni, C.; Douka, K.; Vinciguerra, R.; Lucejko, J.J.; Wadley, L. A Milk and Ochre Paint Mixture Used 49,000 Years Ago at Sibudu, South Africa. PLoS ONE 2015, 10, e0131273. [Google Scholar] [CrossRef] [Scilit] [PubMed]
- Henshilwood, C.S.; d’Errico, F.; van Niekerk, K.L.; Coquinot, Y.; Jacobs, Z.; Lauritzen, S.-E.; Menu, M.; García-Moreno, R. A 100,000-Year-Old Ochre-Processing Workshop at Blombos Cave, South Africa. Science 2011, 334, 219–222. [Google Scholar] [CrossRef] [Scilit] [PubMed]
- Henshilwood, C.S.; Sealy, J.C.; Yates, R.; Cruz-Uribe, K.; Goldberg, P.; Grine, F.E.; Klein, R.G.; Poggenpoel, C.; van Niekerk, K.; Watts, I. Blombos Cave, Southern Cape, South Africa: Preliminary Report on the 1992–1999 Excavations of the Middle Stone Age Levels. J. Archaeol. Sci. 2001, 28, 421–448. [Google Scholar] [CrossRef] [Scilit]
- Velliky, E.C.; MacDonald, B.L.; Porr, M.; Conard, N.J. First Large-Scale Provenance Study of Pigments Reveals New Complex Behavioural Patterns during the Upper Palaeolithic of South-Western Germany. Archaeometry 2021, 63, 173–193. [Google Scholar] [CrossRef] [Scilit]
- d’Errico, F.; García Moreno, R.; Rifkin, R.F. Technological, Elemental and Colorimetric Analysis of an Engraved Ochre Fragment from the Middle Stone Age Levels of Klasies River Cave 1, South Africa. J. Archaeol. Sci. 2012, 39, 942–952. [Google Scholar] [CrossRef] [Scilit]
- Rosso, D.E.; Regert, M.; d’Errico, F. First Identification of an Evolving Middle Stone Age Ochre Culture at Porc-Epic Cave, Ethiopia. Sci. Rep. 2023, 13, 13261. [Google Scholar] [CrossRef] [Scilit] [PubMed]
- Culey, J.; Hodgskiss, T.; Wurz, S.; de la Peña, P.; Val, A. Ochre Use at Olieboomspoort, South Africa: Insights into Specular Hematite Use and Collection during the Middle Stone Age. Archaeol. Anthr. Sci. 2023, 15, 173. [Google Scholar] [CrossRef] [Scilit]
- Moyo, S.; Mphuthi, D.; Cukrowska, E.; Henshilwood, C.S.; Van Niekerk, K.; Chimuka, L. Blombos Cave: Middle Stone Age Ochre Differentiation through FTIR, ICP OES, ED XRF and XRD. Quat. Int. 2016, 404, 20–29. [Google Scholar] [CrossRef] [Scilit]
- Zipkin, A.M.; Ambrose, S.H.; Lundstrom, C.C.; Bartov, G.; Dwyer, A.; Taylor, A.H. Red Earth, Green Glass, and Compositional Data: A New Procedure for Solid-State Elemental Characterization, Source Discrimination, and Provenience Analysis of Ochres. J. Archaeol. Method Theory 2020, 27, 930–970, Correction in J. Archaeol. Method Theory 2020, 27, 971. [Google Scholar] [CrossRef] [Scilit]
- Scadding, R.; Winton, V.; Brown, V. An LA-ICP-MS Trace Element Classification of Ochres in the Weld Range Environ, Mid West Region, Western Australia. J. Archaeol. Sci. 2015, 54, 300–312. [Google Scholar] [CrossRef] [Scilit]
- Gil, M.; Carvalho, M.L.; Seruya, A.; Candeias, A.E.; Mirão, J.; Queralt, I. Yellow and Red Ochre Pigments from Southern Portugal: Elemental Composition and Characterization by WDXRF and XRD. Nucl. Instrum. Methods Phys. Res. Sect. A Accel. Spectrometers Detect. Assoc. Equip. 2007, 580, 728–731. [Google Scholar] [CrossRef] [Scilit]
- Mathis, F.; Bodu, P.; Dubreuil, O.; Salomon, H. PIXE Identification of the Provenance of Ferruginous Rocks Used by Neanderthals. Nucl. Instrum. Methods Phys. Res. Sect. B-Beam Interact. Mater. At. 2014, 331, 275–279. [Google Scholar] [CrossRef] [Scilit]
- Green, R.L.; Watling, R.J. Trace Element Fingerprinting of Australian Ocher Using Laser Ablation Inductively Coupled Plasma-Mass Spectrometry (LA-ICP-MS) for the Provenance Establishment and Authentication of Indigenous Art. J. Forensic. Sci. 2007, 52, 851–859. [Google Scholar] [CrossRef] [Scilit] [PubMed]
- Popelka-Filcoff, R.S.; Robertson, J.D.; Glascock, M.D.; Descantes, C. Trace Element Characterization of Ochre from Geological Sources. J. Radioanal. Nucl. Chem. 2007, 272, 17–27. [Google Scholar] [CrossRef] [Scilit]
- Aura Tortosa, J.E.; Gallello, G.; Roldán, C.; Cavallo, G.; Pastor, A.; Murcia-Mascarós, S. Characterization and Sources of Paleolithic–Mesolithic Ochre from Coves de Santa Maira (Valencian Region, Spain). Geoarchaeology 2021, 36, 72–91. [Google Scholar] [CrossRef] [Scilit]
- Dayet, L. Invasive and Non-Invasive Analyses of Ochre and Iron-Based Pigment Raw Materials: A Methodological Perspective. Minerals 2021, 11, 210. [Google Scholar] [CrossRef] [Scilit]
- Cavallo, G.; Fontana, F.; Gonzato, F.; Guerreschi, A.; Riccardi, M.P.; Sardelli, G.; Zorzin, R. Sourcing and Processing of Ochre during the Late Upper Palaeolithic at Tagliente Rock-Shelter (NE Italy) Based on Conventional X-Ray Powder Diffraction Analysis. Archaeol. Anthr. Sci. 2017, 9, 763–775. [Google Scholar] [CrossRef] [Scilit]
- Lombard, M. The Gripping Nature of Ochre: The Association of Ochre with Howiesons Poort Adhesives and Later Stone Age Mastics from South Africa. J. Hum. Evol. 2007, 53, 406–419. [Google Scholar] [CrossRef] [Scilit] [PubMed]
- Resano, M.; García-Ruiz, E.; Alloza, R.; Marzo, M.P.; Vandenabeele, P.; Vanhaecke, F. Laser Ablation-Inductively Coupled Plasma Mass Spectrometry for the Characterization of Pigments in Prehistoric Rock Art. Anal. Chem. 2007, 79, 8947–8955. [Google Scholar] [CrossRef] [Scilit] [PubMed]
- Keyser, W.; Ciobanu, C.L.; Cook, N.J.; Feltus, H.; Johnson, G.; Slattery, A.; Wade, B.P.; Ehrig, K. Mineralogy of Zirconium in Iron-Oxides: A Micron- to Nanoscale Study of Hematite Ore from Peculiar Knob, South Australia. Minerals 2019, 9, 244. [Google Scholar] [CrossRef] [Scilit]
- Crundwell, F.K. On the Mechanism of the Dissolution of Quartz and Silica in Aqueous Solutions. ACS Omega 2017, 2, 1116–1127. [Google Scholar] [CrossRef] [Scilit] [PubMed]
- Singh, A.K.; Padmasubashini, V.; Gopal, L. Determination of Uranium, Thorium and Rare-Earth Elements in Zircon Samples Using ICP-MS. J. Radioanal. Nucl. Chem. 2012, 294, 19–25. [Google Scholar] [CrossRef] [Scilit]
- Bouchard, M.; Milliard, A.; Rivard, S.; Ness, S. ISO 9516-1 Simplified Borate Fusion/WDXRF Analytical Method for Iron Ore Including Total Iron Analysis: Part 2. Powder Diffr. 2014, 29, 170–175. [Google Scholar] [CrossRef] [Scilit]
- Chubarov, V.M.; Borkhonova, E.I.; Amosova, A.A. Comparison of sample preparation techniques and matrix effects correction methods for X-ray fluorescence determination of total iron and rock-forming elements in iron ores. AuK 2020, 24, 107–113. [Google Scholar] [CrossRef] [Scilit]
- Holmqvist, E.; Lahtinen, M.; Ahola, M. Non-Invasive Chemical Characterisation of Archaeological Ochres from the Early 4th Millennium BCE Forager Graves and Settlements in Finland. J. Archaeol. Sci. Rep. 2026, 70, 105584. [Google Scholar] [CrossRef] [Scilit]
- Domingo, I.; García-Borja, P.; Roldán, C. Identification, processing and use of red pegments (hematite and cinnabar) in the Valencian Early Neolithic (Spain). Archaeometry 2012, 54, 868–892. [Google Scholar] [CrossRef] [Scilit]
- Homma, H. Comparison of analysis results between the fusion method and the pressed powder method for powder sample analysis. Rigaku J. 2018, 34, 19–23. [Google Scholar]
- Demir, F.; Budak, G.; Baydaş, E.; Şahin, Y. Standard Deviations of the Error Effects in Preparing Pellet Samples for WDXRF Spectroscopy. Nucl. Instrum. Methods Phys. Res. Sect. B Beam Interact. Mater. At. 2006, 243, 423–428. [Google Scholar] [CrossRef] [Scilit]
- Zivanovic, V. XRF Analysis of Mineralogical Matrix Effects and Differences between Pulverized and Fused Ferromanganese Slag. CI CEQ 2011, 17, 231–237. [Google Scholar] [CrossRef] [Scilit]
- Waclawska, I. Thermal Decomposition of Borax. J. Therm. Anal. 1995, 43, 261–269. [Google Scholar] [CrossRef] [Scilit]
- Akbay, E.; Altıokka, M.R. Kinetics of Borax Dehydration by Thermal Analysis. Anadolu. Univ. J. Sci. Technol. A-Appl. Sci. Eng. 2017, 18, 713–719. [Google Scholar] [CrossRef] [Scilit]
- Şahin, Ö.; Bulutcu, A. Dehydration Behaviour of Borax Pentahydrate to Anhydrous Borax by Multi-Stage Heating in a Fluidized. Turk. J. Chem. 2002, 26, 89–96. [Google Scholar]
- Leitzke, F.P.; Wegner, A.C.; Porcher, C.C.; Vieira, N.I.M.; Berndt, J.; Klemme, S.; Conceição, R.V. Whole-Rock Trace Element Analyses via LA-ICP-MS in Glasses Produced by Sodium Borate Flux Fusion. Braz. J. Geol. 2021, 51, e20200057. [Google Scholar] [CrossRef] [Scilit]
- Norrish, K.; Hutton, J.T. An Accurate X-Ray Spectrographic Method for the Analysis of a Wide Range of Geological Samples. Geochim. Cosmochim. Acta 1969, 33, 431–453. [Google Scholar] [CrossRef] [Scilit]
- Feret, F. Minimum Flux Fusion Processing of Iron Ores for XRF Analysis. X-Ray Spectrom. 1982, 11, 128–134. [Google Scholar] [CrossRef] [Scilit]
- Leonova, N.; Nesmeyanov, S.; Vinogradova, E.; Voeykova, O. Upper Paleolithic Subsistence Practices in the Southern Russian Plain: Paleolandscapes and Settlement System of Kamennaya Balka Sites. Quat. Int. 2015, 355, 175–187. [Google Scholar] [CrossRef] [Scilit]
- Khaikunova, N.A.; Vinogradova, E.A. Stone industry of the Kamennobalkovsky culture—Current state of research (on the materials of the 2nd cultural layer of sites Kamennaya Balka II and Tretiy Mys). Istor. Zhurnal Nauchnye Issled. 2020, 5, 66–85. [Google Scholar] [CrossRef] [Scilit]
- Skuzovatov, S.Y.; Belozerova, O.Y.; Vasil’eva, I.E.; Zarubina, O.V.; Kaneva, E.V.; Sokolnikova, Y.V.; Chubarov, V.M.; Shabanova, E.V. Centre of Isotopic and Geochemical Research (IGC SB RAS): Current State of Micro- and Macroanalysis. Geodin. Tektonofiz. 2022, 13, 8. [Google Scholar] [CrossRef] [Scilit]
- Amosova, A.A.; Panteeva, S.V.; Chubarov, V.M.; Finkelshtein, A.L. Determination of Major Elements by Wavelength-Dispersive X-Ray Fluorescence Spectrometry and Trace Elements by Inductively Coupled Plasma Mass Spectrometry in Igneous Rocks from the Same Fused Sample (110 Mg). Spectrochim. Acta Part B At. Spectrosc. 2016, 122, 62–68. [Google Scholar] [CrossRef] [Scilit]
- Okina, O.; Lyapunov, S.; Dubenskiy, A.; Erofeeva, K. An Investigation of Trace Elements’ Behavior during Chemical Preparation of Ultramafic Matrix Rock Samples Using Bomb Digestion for Analysis by ICP-MS. J. Anal. At. Spectrom. 2020, 35, 2627–2638, Correction in J. Anal. At. Spectrom. 2021, 36, 439. [Google Scholar] [CrossRef] [Scilit]
- Hubbard, C.R.; Snyder, R.L. RIR—Measurement and Use in Quantitative XRD. Powder Diffr. 1988, 3, 74–77. [Google Scholar] [CrossRef] [Scilit]
- Siuda, R.; Mączyński, P.; Oberc, T.; Tunia, K.; Werra, D.H.; Włodarczak, P. Yellow in the Third Millennium BC. From Studies on the Use of Pigments in the Funeral Rituals of Corded Ware Communities. J. Archaeol. Sci. Rep. 2025, 67, 105448. [Google Scholar] [CrossRef] [Scilit]
- Balaram, V.; Subramanyam, K.S.V. Sample Preparation for Geochemical Analysis: Strategies and Significance. Adv. Sample Prep. 2022, 1, 100010. [Google Scholar] [CrossRef] [Scilit]
- Padfield, T.; Grey, A. Major Element Rock Analysis by X-Ray Fluorescence—A Simple Fusion Method; Philips Analytical Equipment Bulletin; Philips: Eindhoven, The Netherlands, 1971. [Google Scholar]

Disclaimer/Publisher’s Note: The statements, opinions and data contained in all publications are solely those of the individual author(s) and contributor(s) and not of MDPI and/or the editor(s). MDPI and/or the editor(s) disclaim responsibility for any injury to people or property resulting from any ideas, methods, instructions or products referred to in the content. |
© 2026 by the authors. Licensee MDPI, Basel, Switzerland. This article is an open access article distributed under the terms and conditions of the Creative Commons Attribution (CC BY) license.