


Abstract
Serum albumin binding plays a critical role in determining the pharmacokinetic and pharmacodynamic behavior of many drugs. Despite extensive studies on human and bovine serum albumin, quantitative binding data for rabbit serum albumin remain limited for several therapeutically important compounds. In this study, the binding interactions of three oxicam-class non-steroidal anti-inflammatory drugs (meloxicam, tenoxicam, and piroxicam) with rabbit serum albumin were investigated using circular dichroism spectroscopy and fluorescence quenching measurements. Binding parameters were estimated using nonlinear mixed-effects models that simultaneously incorporated data from multiple spectral channels and experimental replicates while accounting for residual correlation and heteroscedastic variance. Fluorescence-based analyses produced estimates consistent with the combined models and showed substantially lower uncertainty compared with CD-only analyses. These findings demonstrate that fluorescence quenching provides more reliable quantitative estimates of albumin binding affinity, whereas CD measurements exhibit higher variability in this context. The results represent the first systematic report of oxicams binding to rabbit serum albumin, with stability constants of meloxicam (logK = 4.840 ± 0.009), piroxicam (logK = 5.068 ± 0.007 and tenoxicam (logK = 4.668 ± 0.004) and highlight the importance of experimental determination of binding parameters even within closely related drug classes. The modeling framework employed here provides a robust statistical approach for analyzing spectroscopic titration data and may be broadly applicable to studies of drug–protein interactions.
1. Introduction
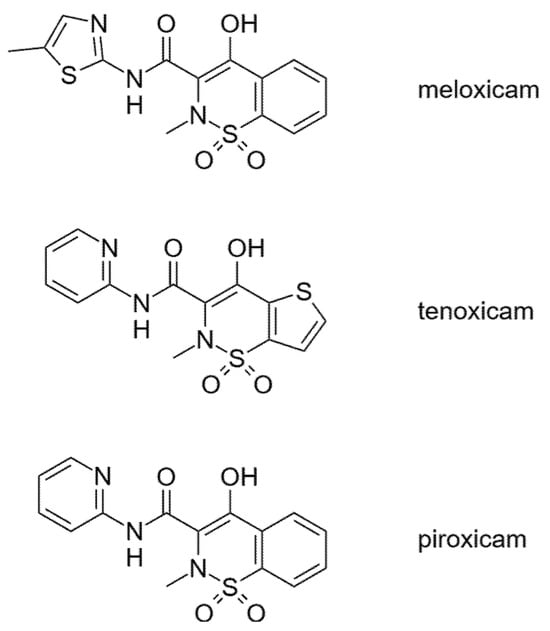
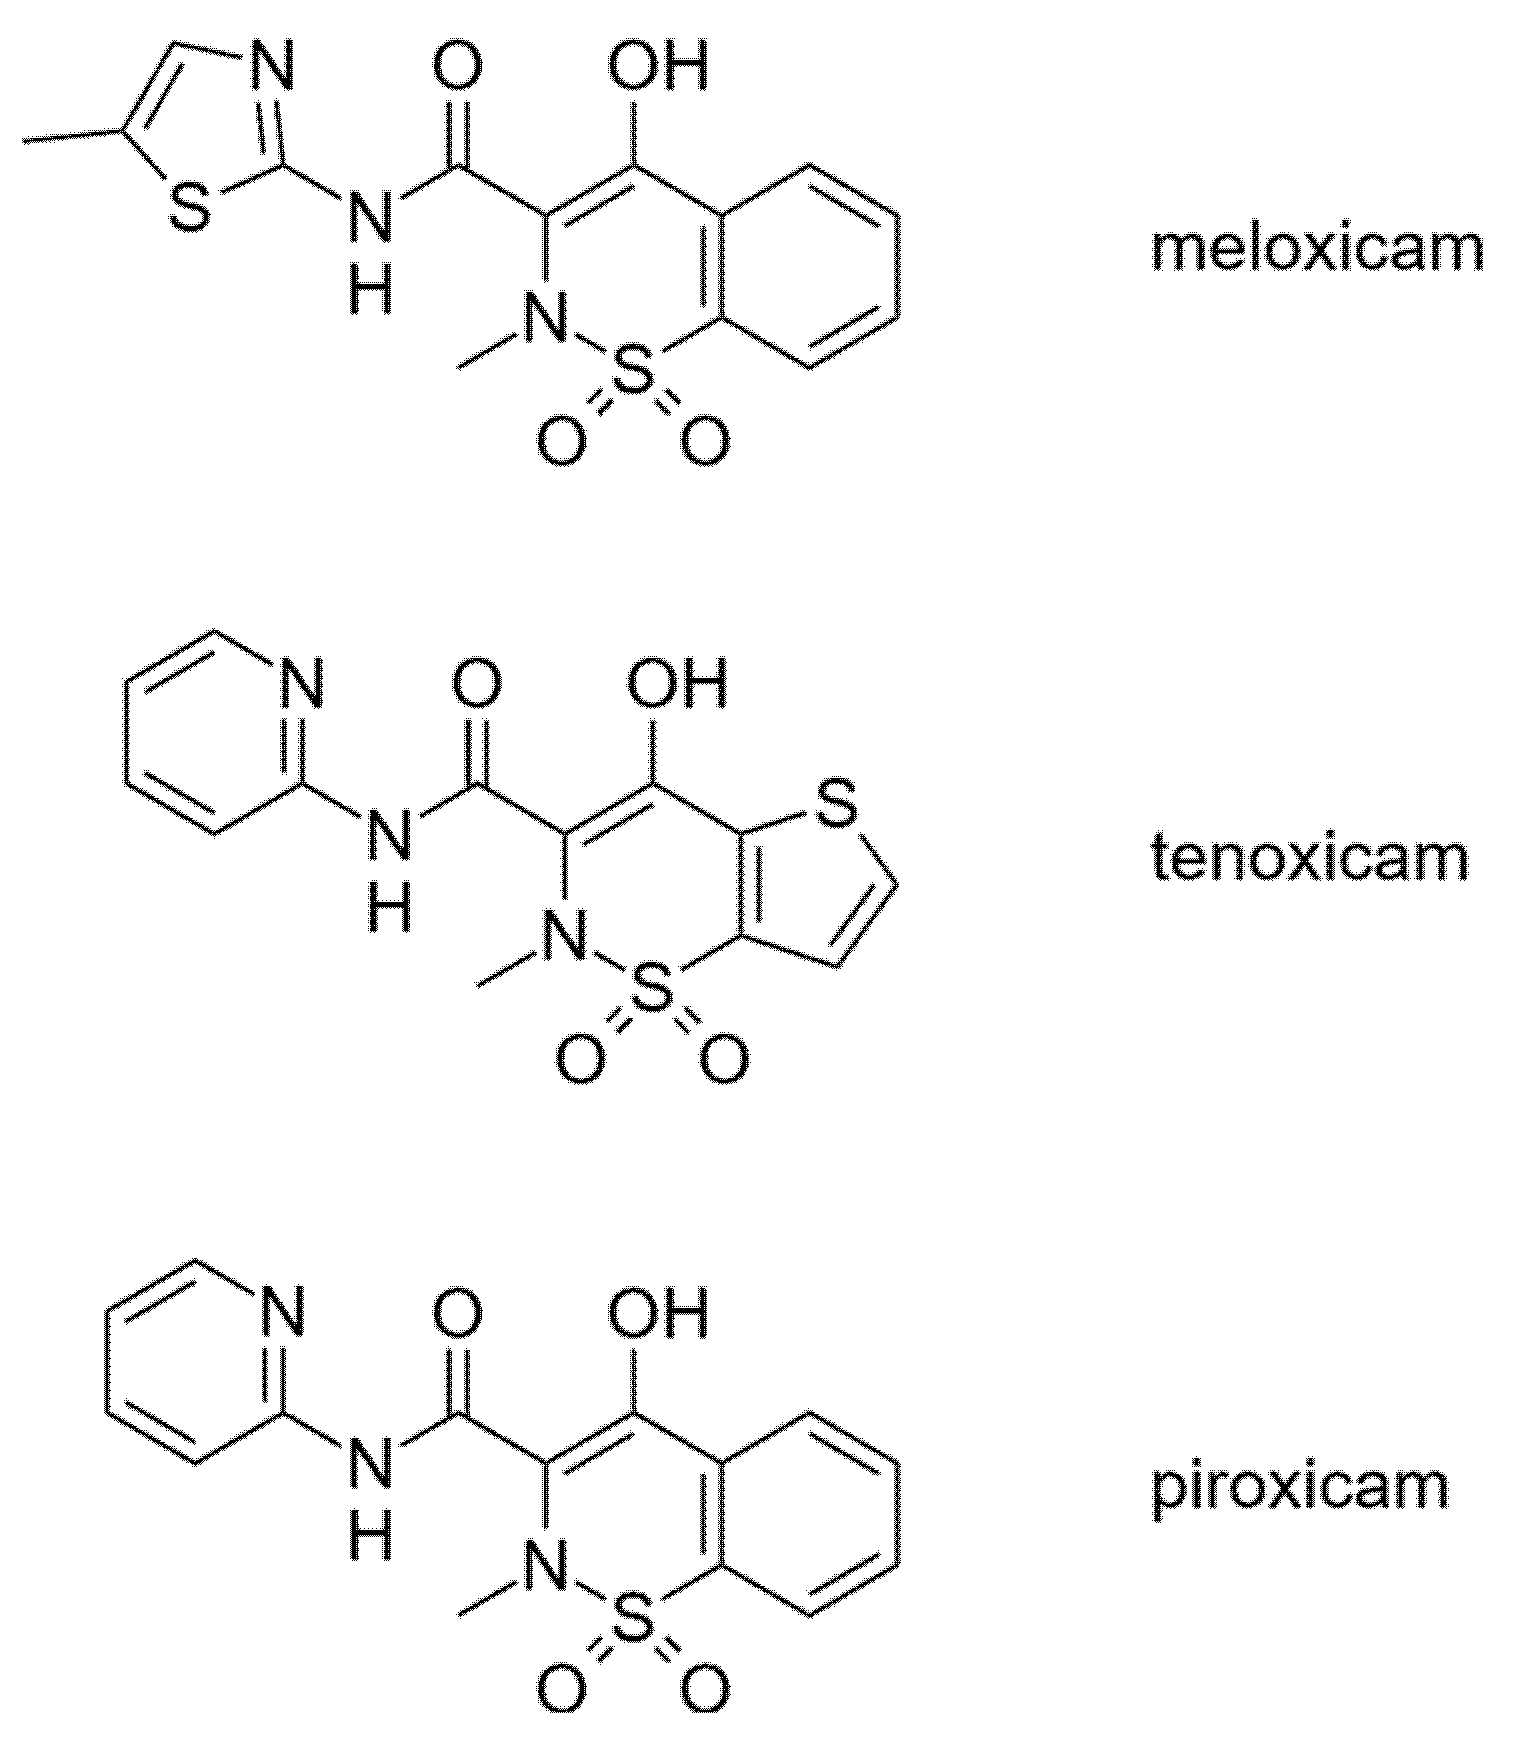
Non-steroidal anti-inflammatory drugs (NSAIDs) constitute one of the most widely used classes of therapeutic agents for the treatment of pain, inflammation, and fever. Among these, oxicam derivatives—including piroxicam, meloxicam, and tenoxicam (structures in Figure 1)—represent an important subclass characterized by relatively long elimination half-lives and high plasma protein binding. These compounds exert their pharmacological activity primarily through inhibition of cyclooxygenase enzymes and subsequent suppression of prostaglandin synthesis. Because of their strong affinity for serum proteins, particularly albumin, plasma protein binding plays a crucial role in determining their pharmacokinetic behavior, distribution, and pharmacodynamic activity [1,2].
Figure 1.
Structural formulae of the studied oxicams.
The pharmacokinetics of oxicam NSAIDs have been extensively investigated across multiple species, including humans and various laboratory animals. Meloxicam, for example, has been studied in a broad range of animal models, with pharmacokinetic parameters showing both qualitative similarities and quantitative interspecies differences relative to humans [3]. In rabbits specifically, several studies have examined the absorption, distribution, and elimination of meloxicam following oral administration, demonstrating relatively rapid absorption and substantial plasma protein binding [4,5,6]. Similarly, tenoxicam and piroxicam have been investigated in rabbits in the context of ocular pharmacokinetics, dermal absorption, and drug delivery studies [7,8,9,10]. In addition, the biological and toxicological effects of piroxicam in rabbits have been described in experimental veterinary studies [11,12]. Despite this extensive pharmacological interest, quantitative characterization of the fundamental binding interactions between oxicam NSAIDs and rabbit serum albumin has remained limited.
Serum albumin is the most abundant plasma protein in mammals and plays a critical role in the transport and distribution of endogenous metabolites and xenobiotics. Albumin possesses multiple binding sites capable of accommodating a wide variety of ligands, including many clinically important drugs [13]. Interactions between drugs and serum albumin strongly influence the free fraction of the drug in plasma, which in turn affects tissue distribution, clearance, and pharmacological activity. Importantly, albumin structure and ligand-binding properties vary between species due to differences in amino acid sequence and conformational stability [14]. These structural variations can lead to significant interspecies differences in drug–protein interactions, even for closely related albumins. Experimental quantification of these interactions is therefore essential when translating pharmacokinetic findings from animal models to humans.
Most previous spectroscopic investigations of oxicam-albumin interactions have focused on human and bovine serum albumin. Fluorescence spectroscopy and related approaches have demonstrated strong binding of meloxicam to albumin, with association constants typically in the range of 105 to 106 M−1 depending on experimental conditions [15,16]. Comparative fluorescence studies have also shown that albumin–ligand binding affinities can vary substantially across mammalian species, reflecting differences in albumin binding site structure and ligand accessibility [17]. This is important because, although serum albumins share a highly conserved three-domain architecture, mammalian albumins typically exhibit only 72–82% sequence identity relative to HSA, and even BSA is only 75.8% identical to HAS [18,19]. Moreover, structural comparisons have shown that rabbit and other non-human serum albumins preserve the overall albumin fold but may differ from HSA in the amino-acid composition, conformation, and electrostatic environment of ligand-binding regions, including sites relevant to drug binding [20]. Thus, subtle structural differences may translate into measurable species-dependent changes in ligand affinity and binding mode, even among closely homologous albumins. Although experimental data are crucial for identifying interspecies differences, systematic spectroscopic studies examining the interaction of oxicams with rabbit serum albumin remain scarce.
Spectroscopic techniques such as fluorescence quenching and circular dichroism (CD) provide complementary information about drug-protein interactions. Fluorescence measurements are particularly sensitive to changes in the microenvironment of intrinsic tryptophan residues (Trp-214 and 135) within the protein IIA and IB subdomains. Although oxicams are achiral compounds and therefore do not have their own circular dichroism (CD) spectrum, their electron transitions become chirally perturbed due to binding in the chiral environment of the protein, producing an induced circular dichroism (ICD) signal. The appearance of the ICD signal is clear evidence of binding. Traditionally, quantitative analysis of spectroscopic binding data has relied on single-wavelength measurements interpreted using Scatchard, Stern-Volmer, or double-logarithmic plots. Although prevalent, these approaches often neglect binding isotherms, inter-measurement correlations and may not fully exploit the information content available across multiple wavelengths and experimental replicates.
Recent advances in statistical modeling provide opportunities to analyze spectroscopic titration data using nonlinear mixed-effects approaches that simultaneously incorporate multiple spectral channels and experimental replicates. Such models allow systematic sources of variability (such as wavelength-specific responses and replicate-to-replicate variation) to be accounted for directly within the estimation procedure, leading to more robust parameter inference. The aim of the present study was therefore to characterize the binding interactions of three oxicams (meloxicam, tenoxicam, and piroxicam) with rabbit serum albumin using spectroscopic titration experiments combined with nonlinear mixed-effects modeling. Circular dichroism and fluorescence quenching data were analyzed jointly using a global statistical framework that accounts for wavelength-dependent responses, experimental replication, and correlated measurement noise. By integrating spectroscopic measurements with advanced statistical modeling, this study seeks to provide the first comprehensive quantitative assessment of oxicams binding to rabbit serum albumin and to establish a methodological framework for analyzing complex spectroscopic binding datasets.
2. Materials and Methods
2.1. Chemicals
All chemicals were purchased from Sigma-Aldrich (Merck KGaA, Darmstadt, Germany) and were used without further purification. The oxicams obtained purity results of 100–101% (by TLC or titration) based on the certificate of analysis, while the rabbit serum albumin was 99% pure (by agarose electrophoresis). Deionized water was prepared using a Milli-Q Direct 8 Millipore system (Merck Millipore, Molsheim, France).
2.2. Sample Preparation and Titration
Rabbit serum albumin was dissolved in phosphate-buffered saline (PBS, pH 7.4, ionic strength I = 0.15 mol L−1). The concentration of the albumin stock solutions was aimed at 0.8 mg mL−1, the exact amount of solid was measured with 0.1 mg reading accuracy.
The oxicam stock solutions were prepared using methanol and a cosolvent if required (20% dimethyl sulfoxide and acetonitrile were used for meloxicam and tenoxicam, respectively), with a concentration aimed at 0.3 mg mL−1. No effect of the cosolvent was observed based on blank titrations.
Aliquots of 3 mL of the protein solution were titrated with the oxicam stock solution. During titration, the amount of meloxicam was increased stepwise (while change in volume was negligible, in order to keep ionic strength stable), and CD and fluorescence spectra were recorded at each titration point. In each titration there were 10–15 titration points recorded, with oxicam concentration varying in the 5 μmol L−1–0.15 mmol L−1 range, and albumin kept near 15 μmol L−1. Titrations with all three oxicams were carried out in three or four parallel measurements to ensure reproducibility. The full experimental dataset can be found in the Supplementary Materials.
2.3. Circular Dichroism Spectroscopy and Fluorescence Quenching Spectroscopy
All measurements were performed using a JASCO J-815 circular dichroism spectropolarimeter (Jasco Ltd., Tokyo, Japan) equipped with a 150 W air-cooled xenon lamp. The system allows simultaneous detection of multiple optical signals, including circular dichroism, UV/Vis absorbance and fluorescence (Hamamatsu Photosensor H5784-04, Hamamatsu Photonics, Shizuoka, Japan).
CD and UV/Vis measurements were typically carried out in the 250–400 nm wavelength range, using the following parameters: data pitch of 0.1 nm, continuous scanning mode at a speed of 100 nm min−1, bandwidth of 2.0 nm, D.I.T. of 1 s, and a number of accumulations of 3. The observed spectral changes were attributed mainly to induced circular dichroism (ICD) signals arising from complex formation between meloxicam and serum albumin. In the present experiments, CD, UV/Vis absorbance and fluorescence spectra were recorded simultaneously in triple-channel mode, allowing parallel monitoring of spectral changes. The native solutions containing only the guest compounds did not have intrinsic CD or fluorescence activity. During fluorescence measurements, the total fluorescence intensity (summed over the range of 185–850 nm emission wavelengths) of the samples was recorded versus the excitatory wavelength (depicted on the horizontal axis of fluorescence spectra). Changes in fluorescence intensity were used to monitor protein–ligand interactions. All measurements were carried out at 25 °C. A Jasco CDF-426L unit (Jasco Ltd., Tokyo, Japan) was used to ensure constant temperature and fluorescent signal acquisition. Data acquisition and processing were performed using Spectra Manager software version 2.08.04 (JASCO Corp., Tokyo, Japan).
2.4. Statistical Analysis
Circular dichroism (CD) spectra were preprocessed prior to quantitative analysis. Spectral noise was reduced using a frequency-domain filtering approach based on fast Fourier transformation (FFT) with a Donoho–Johnstone universal threshold [21], followed by smoothing using cubic smoothing splines to suppress residual high-frequency fluctuations while preserving spectral features [22]. Blank spectra were subtracted from all measurements to remove baseline contributions.
To reduce dimensionality while preserving informative spectral regions, wavelengths were selected automatically. Regions with the lowest 25% local spectral slope (to avoid steep spectral transitions sensitive to noise amplification) and the highest 25% response variance across titration points were identified. From these candidate regions, a subset of wavelengths was sampled uniformly. This strategy balances information content with numerical stability, as excessive numbers of wavelengths relative to the number of titration points may lead to non-convergence of nonlinear regression models.
Binding parameters were estimated by fitting a nonlinear host–guest equilibrium model describing complex formation between host (H—serum albumin) and guest (G—oxicam analyte). A 1:1 binding stoichiometry was assumed based on the trend in the titration data, which affords the calculation of the complex (C) concentration from the quadratic solution of the mass-balance equations:
with
where K denotes the association constant, while and are total analyte concentrations known from stock solution concentrations. The observed CD or fluorescence signal was modeled as
as there is no direct contribution from free guest to the signal. Here and are the host and guest specific contributions to the signal. Parameters were estimated in terms of logK to improve numerical stability.
To account for multiple spectra acquired at different wavelengths and experimental replicates, nonlinear mixed-effects models were fitted using the ‘nlme’ framework [23]. Fixed effects included the global binding constant and wavelength-dependent CD response parameters:
Random effects were included for both experimental replicate (“parallel”) and wavelength (“channel”) levels to account for systematic variability between replicate measurements and spectral channels:
Heteroscedasticity between spectral responses was modeled using a variance function allowing response-specific residual variances. The base model was further extended stepwise by introducing residual correlation structures (autoregressive AR(1) or ARMA) across titration points and additional variance structures (channel-specific and fitted-value exponentially dependent variance models). Competing models were compared using Akaike’s information criterion (AIC), and the final model was selected based on the lowest AIC. Inner-filter effects were corrected using the standard absorbance-based relation , where and denote the sample absorbances at the excitation and emission wavelengths, respectively; however, no discernible difference was observed between fits obtained from corrected and uncorrected fluorescence data [24].
Model adequacy was evaluated using standard mixed-model diagnostics, including inspection of random-effect variance components, residual versus fitted plots stratified by wavelength and replicate, normal Q–Q plots of residuals, empirical Bayes estimates (BLUPs) of random effects, influence diagnostics, and residual autocorrelation analysis.
All analyses were performed using custom scripts written in R version 4.5.1 and developed in RStudio Version 2025.09.0+387 (Posit, Boston, MA, USA).
3. Results
3.1. Spectral Preprocessing and Wavelength Selection
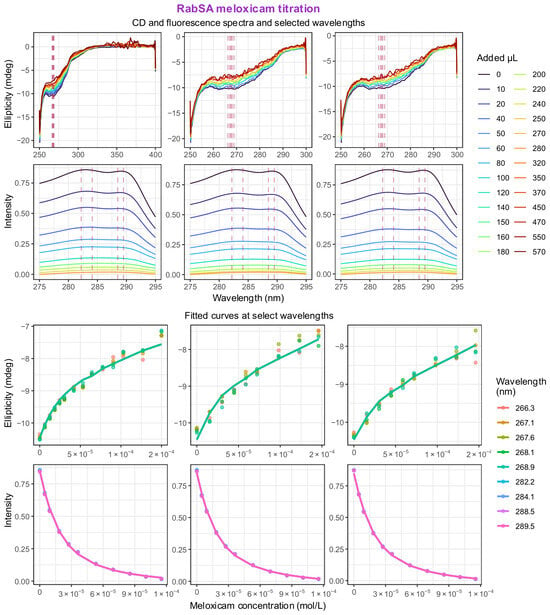
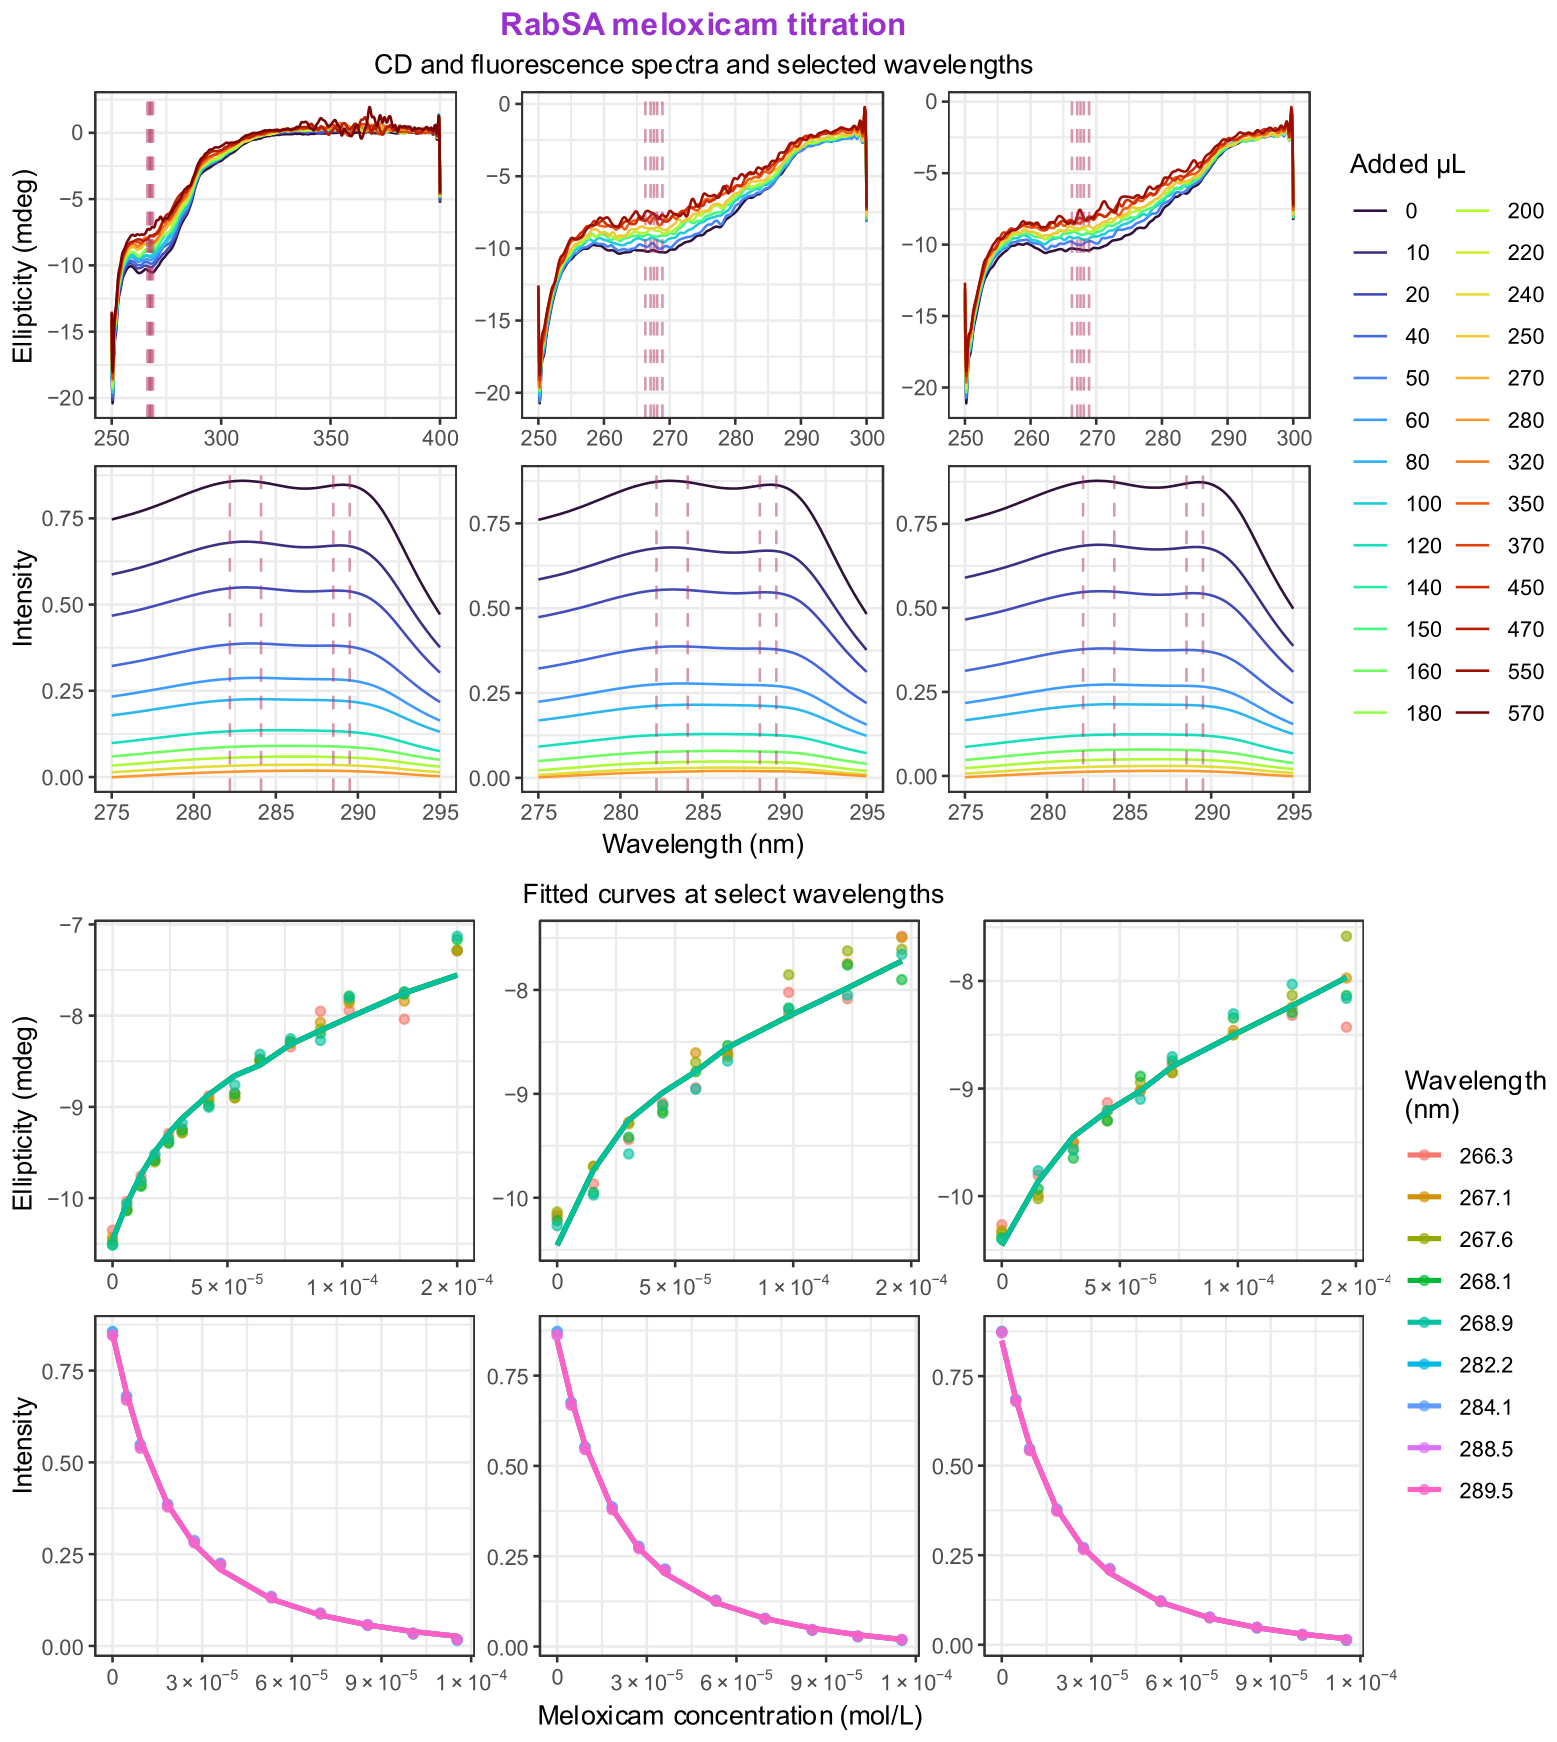
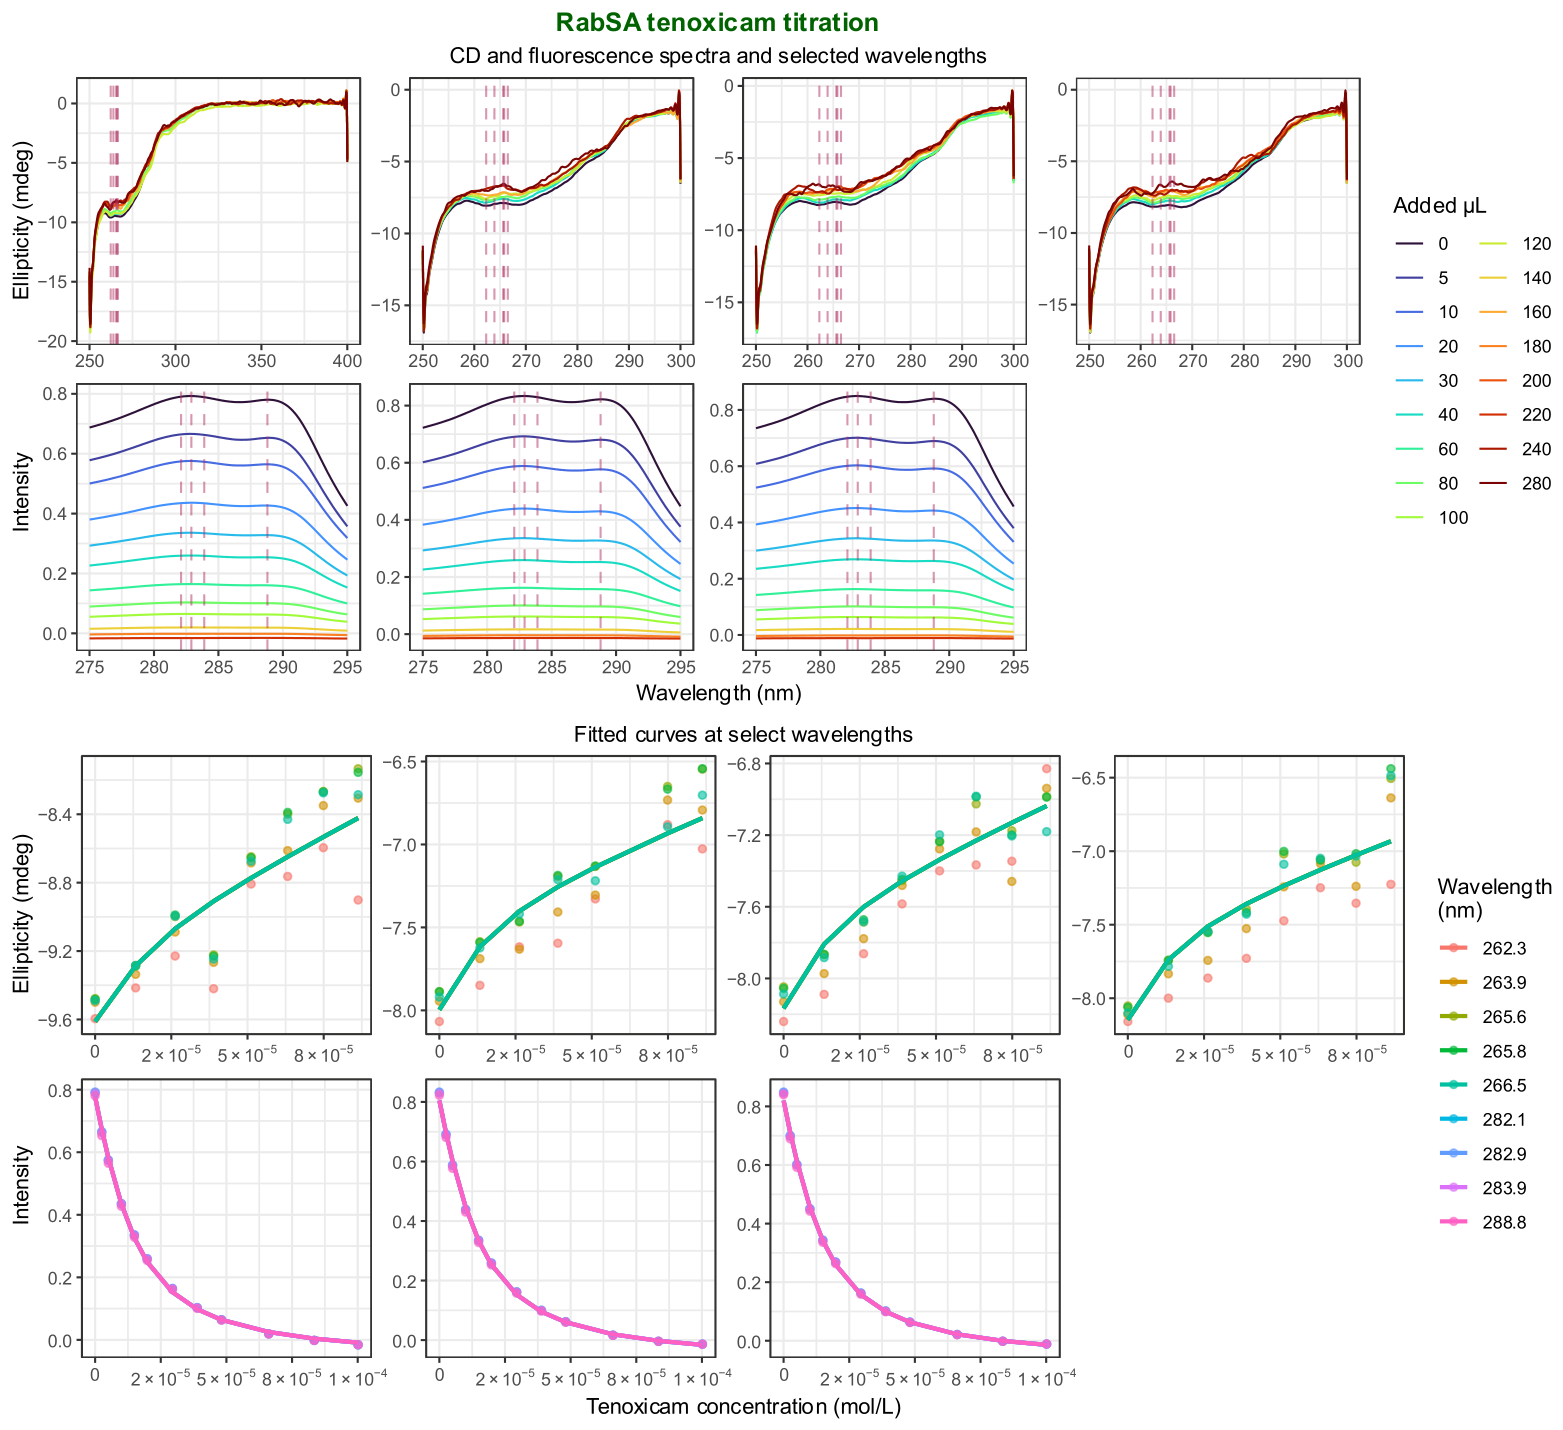
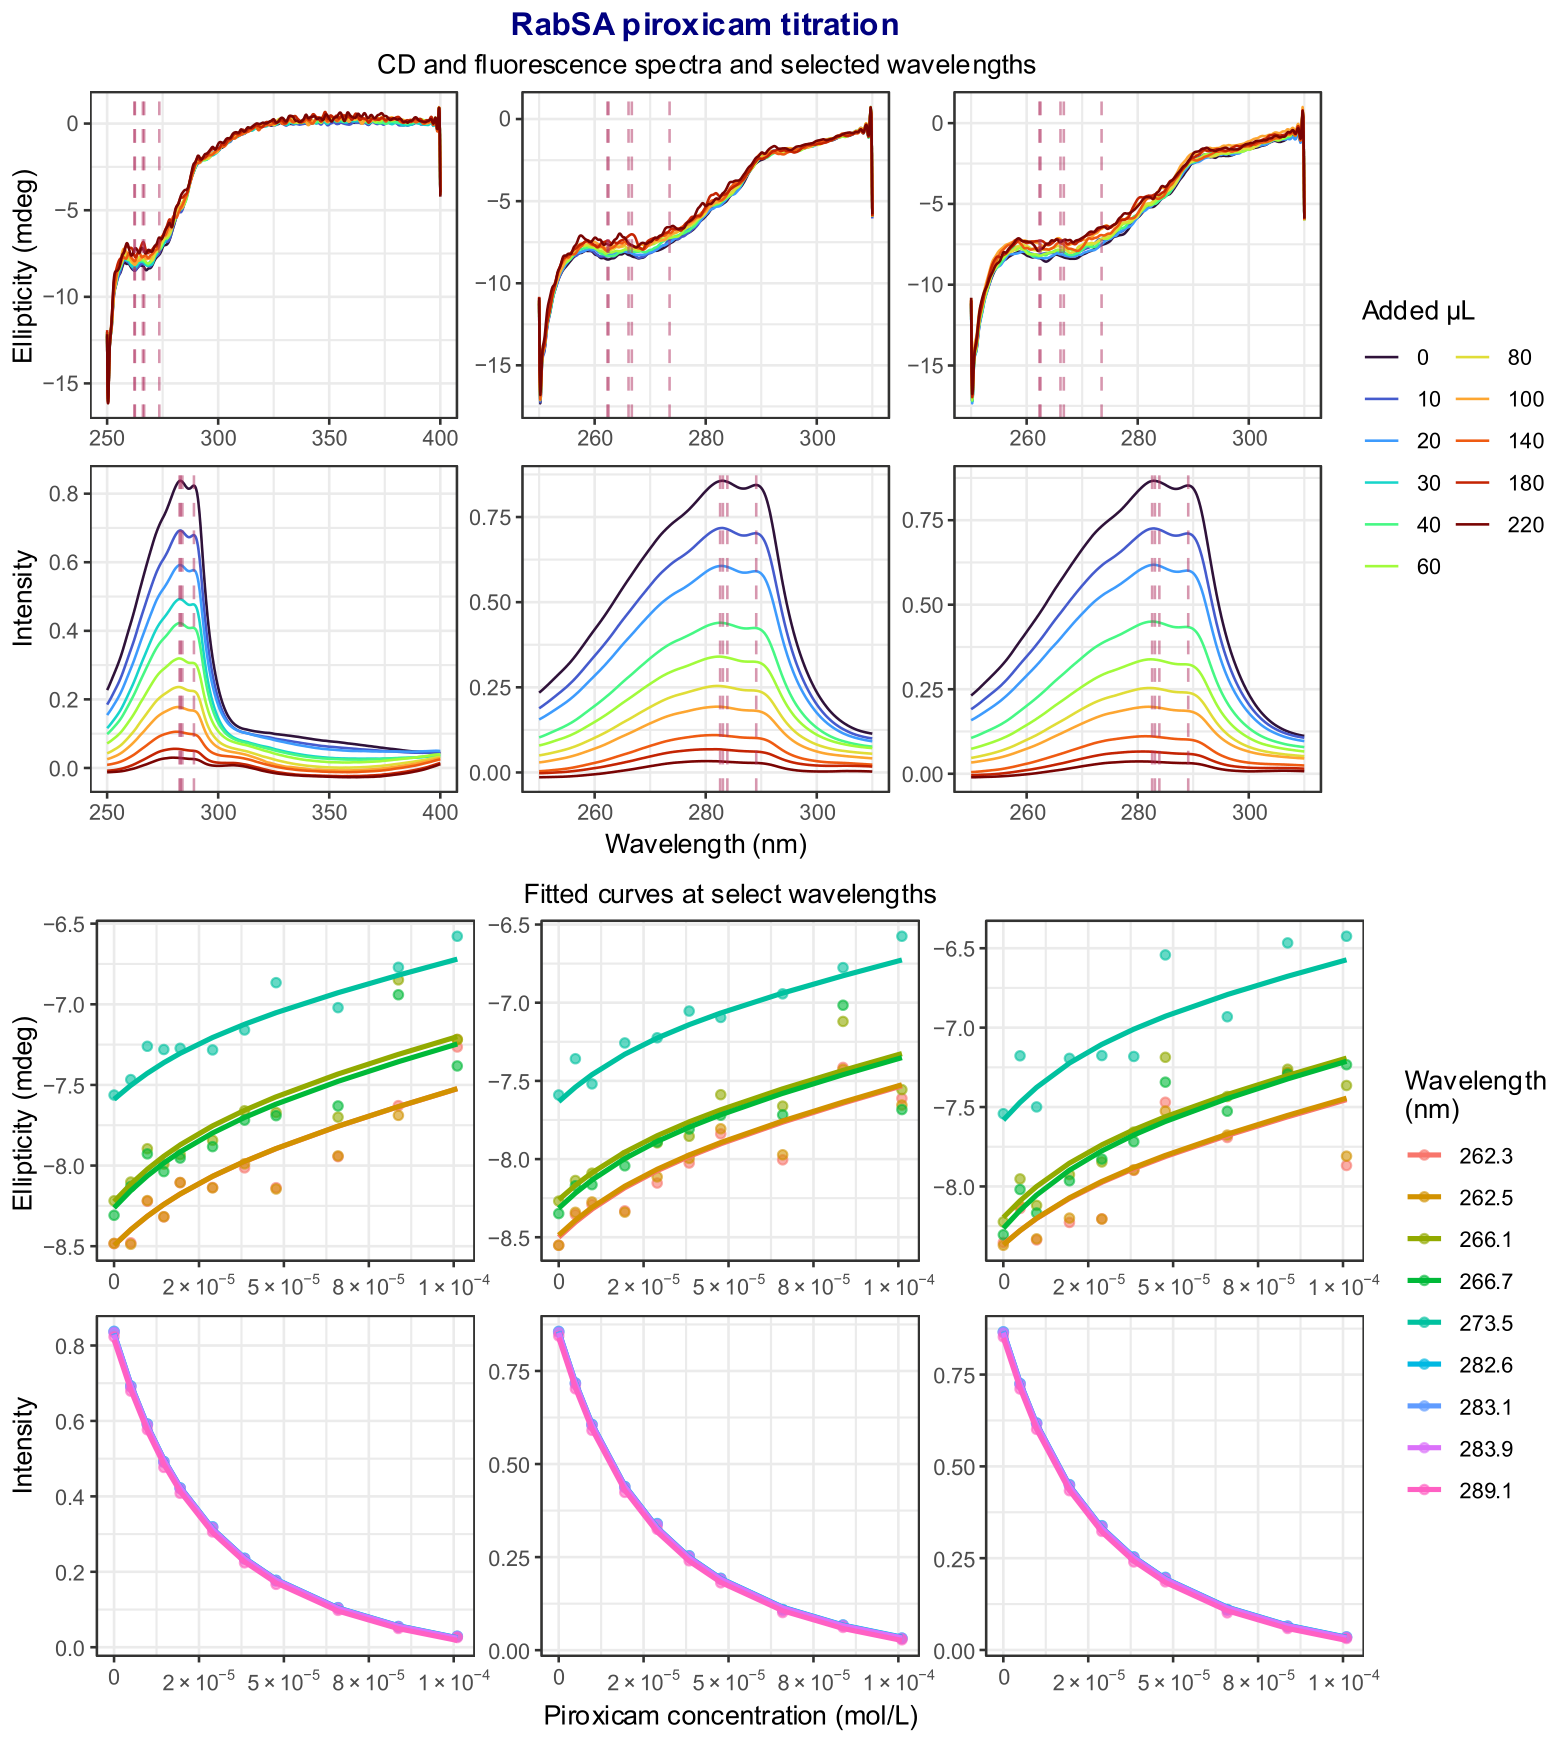
CD and fluorescence (FL) spectra were first denoised and blank-corrected prior to quantitative analysis. After preprocessing, wavelength regions exhibiting low spectral slope and high response variance across titration points were automatically identified and used for parameter estimation. Intuitively, regions with low spectral slope are less sensitive to small wavelength shifts or registration errors and therefore provide more robust intensity measurements, whereas regions with high variance across titration points are more likely to reflect systematic binding-related signal changes rather than baseline noise. This procedure yielded a reduced set of informative wavelengths for each experiment, allowing stable nonlinear regression (by reducing random noise via simultaneous fit) while preserving the spectral information required to characterize host-guest binding. The number of chosen wavelengths is limited by the number of titration points, so as not to overparameterize the fitted model. Potential bias in selecting certain spectral regions can be minimized by manual exclusion of spectral regions known to arise from structural components not directly involved in binding, such as the low-wavelength CD region. Representative processed spectra and fitted titration curves for the three investigated guest molecules are shown in Figure 2, Figure 3 and Figure 4.
Figure 2.
(Top) Circular dichroism and fluorescence quenching titration spectra of meloxicam with rabbit serum albumin after preprocessing. Dashed vertical lines correspond to chosen wavelengths. (Bottom) Titration data points of experimental data at selected wavelengths, and solid lines of nonlinear mixed-effects model fit using the optimal model selected by AIC. Titrations were repeated three times with both CD and fluorescence signals simultaneously recorded.
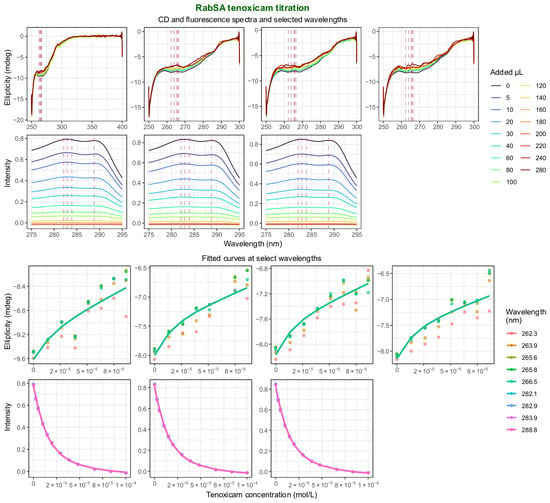
Figure 3.
(Top) Circular dichroism and fluorescence quenching titration spectra of tenoxicam with rabbit serum albumin after preprocessing. Dashed vertical lines correspond to chosen wavelengths. (Bottom) Titration data points of experimental data at selected wavelengths, and solid lines of nonlinear mixed-effects model fit using the optimal model selected by AIC. Titrations were repeated four times, in the first pilot study only the CD signal was recorded, in the next three repetitions both CD and fluorescence signals were simultaneously recorded.
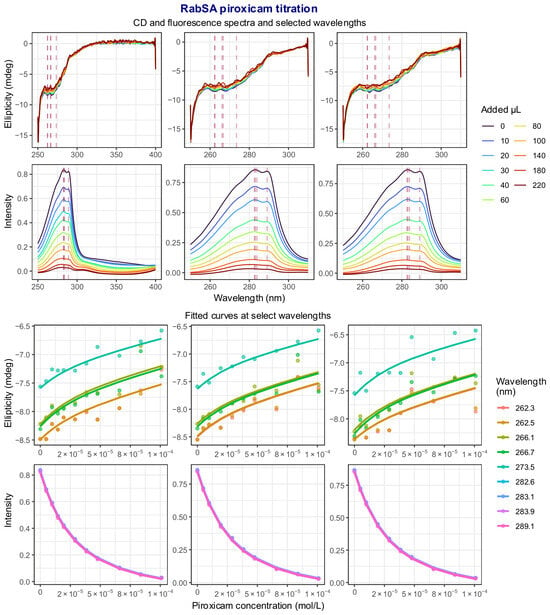
Figure 4.
(Top) Circular dichroism and fluorescence quenching titration spectra of piroxicam with rabbit serum albumin after preprocessing. Dashed vertical lines correspond to chosen wavelengths. (Bottom) Titration data points of experimental data at selected wavelengths, and solid lines of nonlinear mixed-effects model fit using the optimal model selected by AIC. Titrations were repeated three times with both CD and fluorescence signals simultaneously recorded.
3.2. Model Selection
For each guest-host system, several nonlinear mixed-effects model variants were evaluated, differing in the residual correlation structure and variance model. Candidate models included the base model without residual correlation, models incorporating autoregressive AR(1) or ARMA residual structures, and models further allowing wavelength-specific residual variance and fitted-value dependent heteroscedasticity. Model comparison was performed using Akaike’s information criterion (AIC). The selected model for each dataset corresponded to the variant with the lowest AIC value.
Importantly, model selection and parameter estimation were performed within the concentration range considered to reflect the primary 1:1 binding process. The fluorescence signal binding curves indicated that the first specific binding isotherm was adequately captured and higher binding stoichiometry cannot be inferred from the isotherm shape. This distinction is relevant because the induced CD response is small relative to the intrinsic CD signal of the protein host, and at higher guest concentrations nonspecific binding and accompanying perturbation of the protein structure may distort the CD spectrum and lead to misleading apparent saturation behavior. In contrast, fluorescence more directly reports the local environment of the IIA binding site via the nearby tryptophan residues. Therefore, substrate concentrations were not extended further, in order to minimize contributions from nonspecific binding and secondary structural perturbations.
Across all systems, models incorporating both residual correlation and heteroscedastic variance structures generally provided the best fit to the data. In particular, models combining autoregressive correlation with wavelength-specific variance and fitted-value exponentially dependent variance frequently produced the lowest AIC values. However, the differences in the selected optimal model structure among the investigated systems should not be overinterpreted as reflecting intrinsic differences in binding behavior; they are more plausibly attributable, at least in part, to experimental variability and noise characteristics specific to individual datasets. At the same time, the overall model comparison clearly indicates that some form of nontrivial residual variance and/or correlation structure is necessary for an adequate statistical description of the data. In certain cases, however, these effects may be partially masked by noise, such that the additional flexibility of the more complex models does not always translate into sufficient improvement to justify the extra degrees of freedom.
3.3. Binding Analysis of Meloxicam with Rabbit Serum Albumin
For the meloxicam-rabbit serum albumin (RabSA) system, combined analysis of CD and FL datasets resulted in the best fit for the model incorporating AR(1) residual correlation together with all defined variance structures. This model yielded an association constant of 4.894 ± 0.009 (all binding constants are reported in base 10 log units ± standard error and are depicted in Table 1). When the datasets were analyzed separately, the CD-only data produced a lower estimate of the binding constant, with larger uncertainty: 4.447 ± 0.045. The FL-only analysis produced a binding constant comparable to the joint analysis: 4.840 ± 0.009. The AIC comparison indicated a clear improvement of models incorporating residual correlation relative to the base model without correlation (Table 2).
Table 1.
Estimated binding constants for guest-RabSA complexes. In the best model description ‘var(2)’ denotes variance weight structure for both the channel and fitted-value levels. Most reliable method of using only FL is depicted in bold.
Table 2.
Model comparison based on Akaike’s information criterion (AIC) for combined CD and FL datasets. In the best model description ‘var(2)’ denotes variance weight structure for both the channel and fitted-value levels, while ‘var’ denotes variance weight structure only for the channel level. Bold AIC values denote the best model for that oxicam, while NA (not applicable) refers to a model that did not converge.
3.4. Binding Analysis of Tenoxicam with Rabbit Serum Albumin
For the tenoxicam-RabSA system, the combined CD and FL datasets yielded the best performance for an ARMA correlation model, with a binding constant estimate of 5.120 ± 0.011. Analysis of CD spectra alone again resulted in a substantially lower and less precise estimate: 3.651 ± 0.268. In contrast, the FL-only analysis yielded a value close to the combined-data estimate: 5.068 ± 0.007, with the best-fitting model including ARMA residual correlation and heteroscedastic variance. The corresponding AIC value for the FL-only model was −1112.08, indicating a markedly improved likelihood relative to simpler models (Table 2).
3.5. Binding Analysis of Piroxicam with Rabbit Serum Albumin
For the piroxicam-RabSA system, the combined CD and FL analysis favored the model including AR(1) residual correlation and heteroscedastic variance, producing a binding constant of 4.671 ± 0.006. Separate analysis of CD data produced a lower estimate with substantially larger uncertainty: 4.060 ± 0.241. The FL-only dataset yielded a value nearly identical to the combined-data estimate: 4.668 ± 0.004, with the best-fitting model again incorporating AR(1) residual correlation and heteroscedastic variance (AIC = −937.54).
3.6. Comparison of Binding Constants Across Systems
The combined CD and FL analyses produced consistent and precise binding constant estimates for all three investigated ligands. The highest affinity was observed for tenoxicam (5.120), followed by meloxicam (4.894) and piroxicam (4.671). Across all systems, fluorescence-based estimates were closely aligned with the combined-data results and exhibited small standard errors, whereas CD-only estimates showed substantially larger uncertainty and, in two cases, lower point estimates of the association constant.
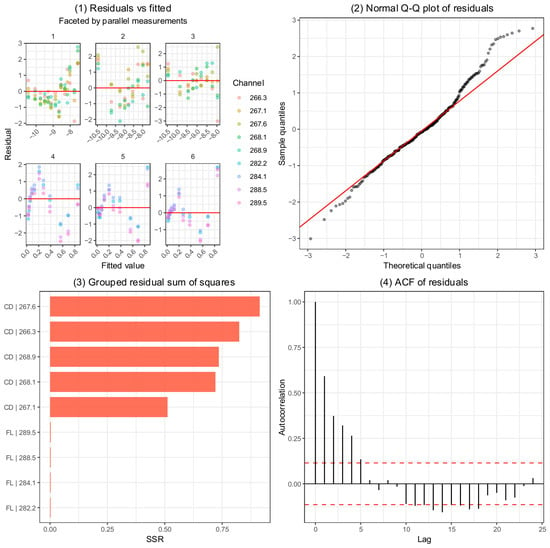
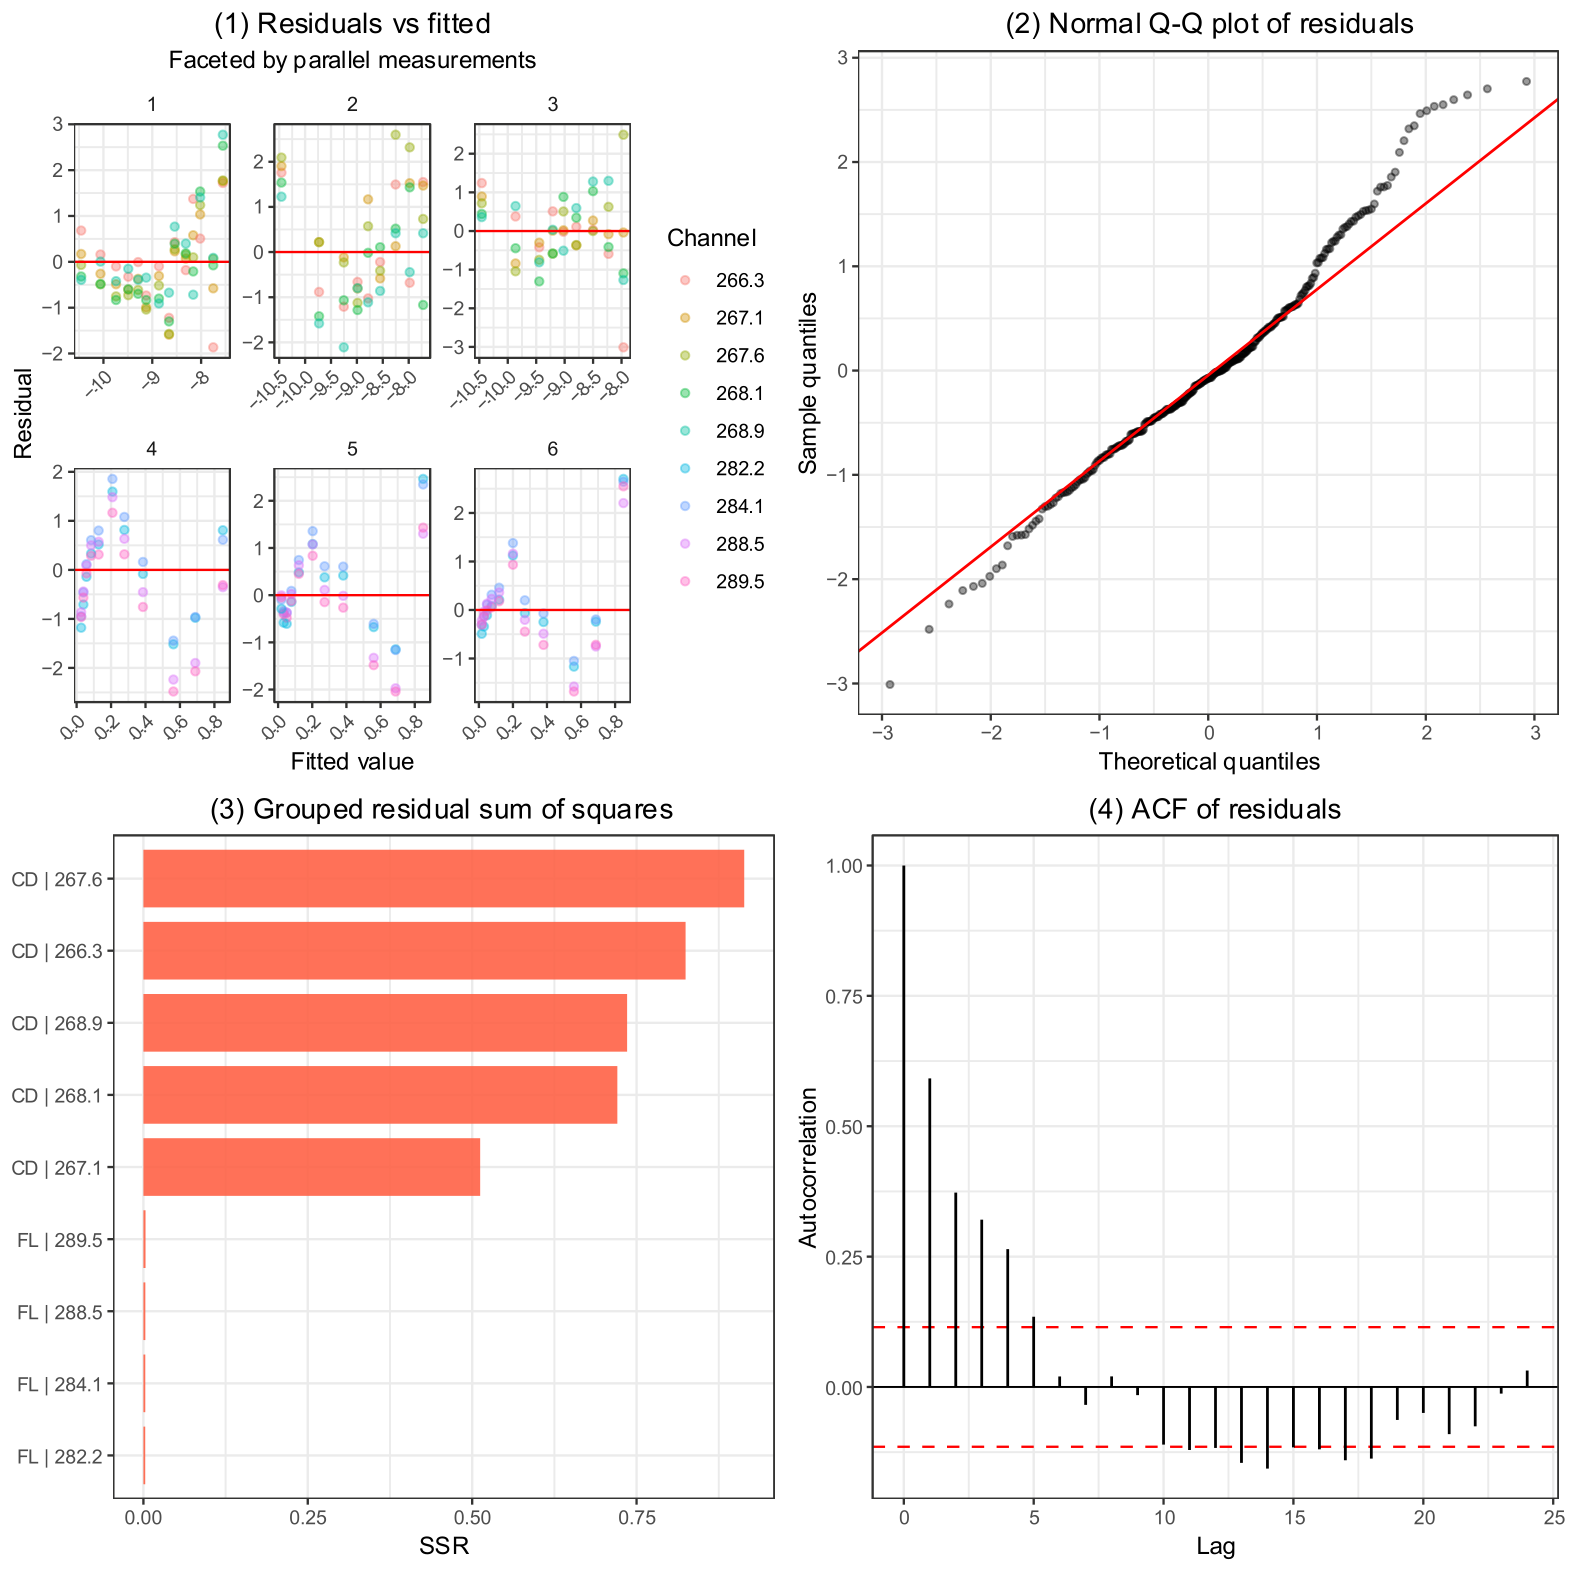
Uncertainty of the binding constants was assessed from the standard errors of the fixed-effect estimates obtained from the nonlinear mixed-effects models. For the combined CD-FL analyses, the estimated association constants were associated with small standard errors (≤0.011), indicating high precision of the parameter estimates. In contrast, CD-only analyses showed substantially larger uncertainties, particularly for tenoxicam and piroxicam, reflecting lower signal-to-noise ratios and reduced information content in the CD data alone. Figure 5 contains the diagnostic plots of the mixed-effects model. Inspection of the estimated random-effects variances indicated moderate between-channel variability in the CD response parameters (ΦH and ΦC), while replicate-to-replicate variability was comparatively small. The residuals-versus-fitted plot, shown separately for the selected CD and FL wavelength channels, did not reveal pronounced systematic trends or strong heteroscedasticity, supporting the assumptions of approximately constant variance and an adequate mean structure. This was further corroborated by the quantile–quantile plot, in which the residuals followed the expected normal pattern reasonably well. At the same time, a slight residual trend remained detectable, suggesting that the adopted 1:1 binding model may not capture all features of the underlying binding process. Thus, although the diagnostics overall support acceptable model performance, they should not be interpreted as definitive proof of the assumed stoichiometry, and the possibility of more complex or partially overlapping binding equilibria cannot be fully excluded. Future work will therefore focus on comprehensive simulation studies to evaluate how reliably binding stoichiometry can be inferred from model assumptions and diagnostic patterns, and to perform sensitivity analyses of the robustness of these conclusions. The wavelength-grouped residual sum of squares additionally demonstrated that the fluorescence data were fitted with substantially smaller error than the CD data, consistent with the higher precision and stronger binding sensitivity of the fluorescence measurements. Finally, the residual autocorrelation function showed that, after inclusion of the selected correlation structures, most autocorrelation values remained below the significance threshold, indicating that serial dependence across titration points had been satisfactorily accounted for.
Figure 5.
Model diagnostic plots for the fitted nonlinear mixed-effects model, epitomized with meloxicam titration results. (1) Residuals versus fitted values, colored by measurement channel and faceted by parallel experiment, used to assess heteroscedasticity, systematic structure, and potential model misspecification; the horizontal line indicates zero residual. (2) Normal Q–Q plot of residuals evaluating the assumption of approximate normality. (3) Grouped residual sum of squares (SSR) across response–channel combinations, highlighting contributions of individual measurement channels or responses to overall lack-of-fit. (4) Autocorrelation function (ACF) of residuals, used to assess temporal correlation; dashed lines indicate approximate 95% confidence limits under the assumption of white noise.
4. Discussion
The present study provides a quantitative characterization of the binding of three oxicam-class non-steroidal anti-inflammatory drugs (NSAIDs): meloxicam, tenoxicam, and piroxicam to rabbit serum albumin (RabSA) using a combined spectroscopic and nonlinear mixed-effects modeling framework. While albumin binding of oxicam derivatives has been extensively studied for human and bovine serum albumin, comparable quantitative data for rabbit albumin have been largely lacking. Given the frequent use of rabbits in pharmacological and toxicological studies, establishing quantitative binding parameters for this species is important for the interpretation of drug distribution and pharmacokinetic behavior in preclinical models. Oxicams bind to the HSA IIA subdomain, also known as the warfarin- or coumarin-binding site [25]. The amino acid sequence between positions 200 and 220 of the binding site is particularly important as it contains tryptophan 214. The amino acid sequence of this protein fragment is identical in HSA and RabSA.
Despite the close structural similarity among the investigated oxicam derivatives, the estimated association constants revealed measurable differences in binding affinity. Tenoxicam exhibited the strongest interaction with RabSA, followed by meloxicam and piroxicam. This affinity order is consistent with reported differences in the physicochemical properties of the three oxicams, particularly their lipophilicity, which is expected to be the main factor influencing albumin binding of similar compounds [26]. Tenoxican possessed the highest lipophilicity (logD at pH 7.4 is 0.3 [27]); meloxicam appears intermediate in this respect (logD 0.12), whereas piroxicam is less lipophilic (logD 0.00 [28]) and correspondingly showed weaker binding. These findings highlight the challenges in predicting albumin binding behavior even within a chemically cohesive class of drugs. Oxicam derivatives share a common heterocyclic scaffold and similar physicochemical properties; nevertheless, relatively small structural differences can influence the balance of hydrophobic interactions, hydrogen bonding, and steric accommodation within albumin binding sites. Consequently, empirical measurement remains essential for accurate characterization of drug–protein interactions even when compounds belong to the same therapeutic class.
The comparative analysis of spectroscopic modalities revealed differences in the reliability of the binding estimates derived from circular dichroism (CD) and fluorescence quenching (FL) data. In all three cases of guest molecules, fluorescence-based analyses yielded association constants closely matching those obtained from the combined CD-FL models and were associated with markedly smaller standard errors. In contrast, CD-only analyses exhibited substantially larger uncertainty. This behavior likely reflects the indirect nature of CD measurements in this context. The CD signal arises from ligand binding induced subtle chiral perturbations inside the protein cavity acting on chromophores, whereas fluorescence quenching directly probes changes in the microenvironment of aromatic residues, most notably tryptophan residues, located near ligand binding sites. As a result, fluorescence quenching typically provides higher signal-to-noise ratios and stronger sensitivity to binding events. At the same time, it should be noted that steady-state fluorescence measurements alone cannot rigorously distinguish static quenching caused by complex formation from possible dynamic contributions; in this respect, the accompanying CD perturbations serve as a minimal independent check that genuine ligand binding is occurring. The weaker CD signal response also underlines the negligible perturbation protein conformational change might have on the fluorescence photophysical phenomenon.
Recent methodological analyses have highlighted substantial limitations in the widespread use of intrinsic fluorescence quenching for protein–ligand binding studies. In particular, van de Weert and Stella [29] and more recently van de Weert and Schönbeck [30] emphasized that many published albumin–ligand investigations rely on simplified empirical relationships, most notably the commonly used double-logarithmic binding equation, that lack rigorous theoretical justification for extracting binding stoichiometry or affinity constants. In the present work, these methodological concerns were addressed by replacing the traditional empirical equations with an explicit statistical model of the fluorescence signal. The approach links the observed intensity directly to the equilibrium distribution of free albumin, ligand, and complex. Within this framework both the free albumin and the albumin–ligand complex was allowed to possess intrinsic fluorescence contributions, while the fluorescence activity of the guest molecule itself was experimentally verified to be negligible under the excitation and emission conditions employed. This formulation therefore accounts for the fact that ligand binding may modulate the microenvironment of the albumin fluorophores rather than simply quenching a single emitting species. A remaining limitation of the model is that it assumes a single binding equilibrium and therefore corresponds to an effective 1:1 stoichiometry. Although this simplification does not capture the full multi-site binding complexity of serum albumins, it provides a statistically identifiable model that avoids the severe parameter non-identifiability often encountered when fitting more complex fluorescence models.
The fluorescence measurements were further complemented by an orthogonal spectroscopic method based on circular dichroism. CD titrations inherently exhibit lower signal-to-noise ratios and are sensitive to small baseline instabilities, particularly in the far-UV spectral region where solvent and instrumental contributions become significant. Consequently, quantitative affinity estimates derived from CD alone showed somewhat larger deviations and uncertainty compared with the fluorescence analysis. In this sense, CD serves primarily as an independent probe of ligand-induced conformational effects rather than a high-precision quantitative binding assay.
The modeling framework used in this study allowed simultaneous integration of spectral data across multiple wavelengths and experimental replicates through nonlinear mixed-effects modeling. By accounting for wavelength-specific variability and replicate-level random effects, the approach provides statistically efficient parameter estimates while explicitly modeling experimental heterogeneity. The benefit of multiple wavelength sampling combined with mixed-effects modeling is evident when comparing meloxicam results to that of classical single-wavelength and simple nonlinear regression fit: the results shown in Table 1 (4.894 ± 0.009, 4.45 ± 0.05, 4.840 ± 0.009 for CD + FL, CD only, and FL only signals, respectively) exhibit lower uncertainty compared to the classical approach 4.90 ± 0.02, 4.3 ± 0.1, 4.91 ± 0.02. The use of autoregressive correlation structures and heteroscedastic variance models further improved model performance, reflecting the non-independent and wavelength-dependent nature of spectroscopic measurement noise. Such modeling strategies may be broadly applicable to other spectroscopic binding studies where multiple correlated signals are available. The current findings indicate that fluorescence spectroscopy offers more robust quantitative data for albumin–drug binding studies, while CD measurements may serve as a supplementary technique for identifying structural perturbations (provided the 180–250 nm spectral region remains relevant), rather than for accurate affinity estimation.
Available literature data provide a useful, although methodologically limited, point of comparison for the present findings. For meloxicam, fluorescence-based binding constants reported from single-wavelength analyses yielded mean values of 5.533 for bovine serum albumin and 6.449 for human serum albumin [16], albeit determined mostly at 37 °C. For piroxicam, fluorescence-based single-wavelength analyses gave 5.185 for bovine serum albumin [31] and 7.093 for human serum albumin [32], while a CD-based study reported 5.972 for human serum albumin [33]. For other species no further literature data were available, and none whatsoever for tenoxicam. In this context, the rabbit serum albumin values obtained here fall within the general range of albumin-binding affinities previously reported for oxicams, but they do not simply interpolate between bovine and human values. This again emphasizes that albumin binding cannot be reliably inferred from either close chemical similarity among ligands or phylogenetic proximity among species alone. At the same time, these comparisons should be interpreted cautiously, because the available literature values were generally derived from single-wavelength fluorescence or CD measurements using Stern–Volmer and/or double-logarithmic analyses, whereas the present study employed multi-wavelength, mixed-effects global fitting. The latter approach is expected to provide greater robustness by integrating replicate structure, wavelength dependence, residual correlation, and heteroscedasticity directly into the estimation procedure.
From a pharmacological perspective, the measured binding constants fall within the range expected for strong albumin-binding drugs, consistent with the high plasma protein binding reported for oxicam derivatives in other species. However, even moderate interspecies differences in albumin binding affinity may have implications for drug distribution, free drug fraction, and pharmacodynamic effects. The present findings therefore contribute an important data point toward understanding species-specific protein binding behavior. Ongoing work in our laboratory aims to place these results into a broader comparative context by examining the binding of oxicam derivatives across multiple serum albumin species, including human, bovine, and rodent albumins. Such comparative studies will help clarify the extent to which albumin binding affinity varies across species and how these differences may influence the interpretation of preclinical pharmacokinetic data. Ultimately, a systematic cross-species analysis may improve the translational relevance of animal models used in drug development.
In summary, this study establishes quantitative binding constants for three oxicam NSAIDs with rabbit serum albumin using a robust statistical modeling approach integrating spectroscopic data from multiple modalities. The results demonstrate measurable differences in binding affinity within a closely related drug class, highlight the superior reliability of fluorescence quenching measurements compared with CD spectroscopy for quantitative affinity estimation, and provide a foundation for future investigations into interspecies variability in albumin–drug interactions.
5. Conclusions
This study provides a quantitative characterization of the binding of three oxicam-class nonsteroidal anti-inflammatory drugs to rabbit serum albumin using spectroscopic measurements and nonlinear mixed-effects modeling. Despite their close structural similarity, meloxicam, tenoxicam, and piroxicam exhibited measurable differences in binding affinity. Methodologically, fluorescence quenching yielded more precise and consistent affinity estimates than circular dichroism. Thus, for quantitative determination of albumin binding constants in these systems, fluorescence spectroscopy, with careful considerations regarding inner-filter effects and intrinsic fluorescence, appears to be the more reliable and informative approach. Future work will extend this framework to additional albumin species to better understand interspecies differences in drug–protein binding and their implications for the interpretation of preclinical pharmacokinetic data.
Supplementary Materials
The following supporting information can be downloaded at: https://www.mdpi.com/article/10.3390/analytica7030048/s1.
Author Contributions
K.M.V.—Data curation, Formal analysis, Investigation, Writing—original draft; E.S.-S.—Data curation, Formal analysis, Investigation, Writing—original draft; A.M.—Formal analysis, Funding acquisition, Software, Visualization, Writing—original draft; P.H.—Conceptualization, Investigation, Methodology, Software, Supervision, Validation, Writing—review and editing; G.T.B.—Conceptualization, Funding acquisition, Supervision, Writing—review and editing; T.P.—Conceptualization, Data curation, Investigation, Methodology, Project administration, Supervision, Validation, Visualization, Writing—original draft, Writing—review and editing. All authors have read and agreed to the published version of the manuscript.
Funding
This study was funded by the grant of the Higher Education Institutional Excellence Programme within the Framework of the Molecular Biology Thematic Programme of Semmelweis University (TKP2021-EGA-24) (A.M.). This work was also supported by the National Research Development and Innovation Office of Hungary (contract FK152458 to G.T.B.).
Data Availability Statement
The data and code for analysis contained within this work is available in the Supplementary Materials. The “/data” subfolder contains all .csv files of the measurements, “/script” contains the .R file necessary for data analysis, “/outputs” contains fitted model parameters.
Conflicts of Interest
The authors declare no conflicts of interest.
References
- Nilsen, O.G. Clinical pharmacokinetics of tenoxicam. Clin. Pharmacokinet. 1994, 26, 16–43. [Google Scholar] [CrossRef] [Scilit] [PubMed]
- Türck, D.; Roth, W.; Busch, U. A review of the clinical pharmacokinetics of meloxicam. Rheumatology 1996, 35, 13–16. [Google Scholar] [CrossRef] [Scilit]
- Busch, U.; Schmid, J.; Heinzel, G.; Schmaus, H.; Baierl, J.; Huber, C.; Roth, W. Pharmacokinetics of meloxicam in animals and the relevance to humans. Drug Metab. Dispos. 1998, 26, 576–584. [Google Scholar] [PubMed]
- Turner, P.V.; Chen, H.C.; Taylor, W.M. Pharmacokinetics of meloxicam in rabbits after single and repeat oral dosing. Comp. Med. 2006, 56, 63. [Google Scholar] [PubMed]
- Fredholm, D.V.; Carpenter, J.W.; KuKanich, B.; Kohles, M. Pharmacokinetics of meloxicam in rabbits after oral administration of single and multiple doses. Am. J. Vet. Res. 2013, 74, 636–641. [Google Scholar] [CrossRef] [Scilit] [PubMed]
- Carpenter, J.W.; Pollock, C.G.; Koch, D.E.; Hunter, R.P. Single and multiple-dose pharmacokinetics of meloxicam after oral administration to the rabbit (Oryctolagus cuniculus). J. Zoo Wildl. Med. 2009, 40, 601–606. [Google Scholar] [CrossRef] [Scilit] [PubMed]
- Tsai, Y.-H.; Hsu, L.-R.; Natio, S.-I. Percutaneous absorption of piroxicam from ointment bases in rabbits. Int. J. Pharm. 1985, 24, 61–78. [Google Scholar] [CrossRef] [Scilit]
- Schiantarelli, P.; Acerbi, D.; Bovis, G. Some pharmacokinetic properties and bioavailability by oral and rectal route of piroxicam in rodents and in man. Arzneim. Forsch. 1981, 31, 92–97. [Google Scholar]
- Joseph, N.; Lakshmi, S.; Jayakrishnan, A. A floating-type oral dosage form for piroxicam based on hollow polycarbonate microspheres: In vitro and in vivo evaluation in rabbits. J. Control. Release 2002, 79, 71–79. [Google Scholar] [CrossRef] [Scilit] [PubMed]
- Del Puppo, M.; Kienle, M.G.; Ratiglia, R.; Galimberti, D.; Acerbi, G.; Boerci, L.; Marabini, L.; Chiesara, E. Intraocular and plasma kinetics of tenoxicam in rabbits. Graefe’s Arch. Clin. Exp. Ophthalmol. 1993, 231, 115–117. [Google Scholar] [CrossRef] [Scilit]
- Saganuwan, S.A.; Orinya, O.A. Toxico-neurological effects of piroxicam in monogastric animals. J. Exp. Neurosci. 2016, 10, 121–128. [Google Scholar] [CrossRef] [Scilit]
- El-Hofy Rashad, H.; Zaglol, N. Biochemical Changes Associated with Administration of Non-Steroidal Anti-Inflammatory Piroxicam in Breeding Rabbit. Assiut Vet. Med. J. 2011, 57, 426–440. [Google Scholar] [CrossRef] [Scilit]
- Sedov, I.; Nikiforova, A.; Khaibrakhmanova, D. Binding constants of clinical drugs and other organic ligands with human and mammalian serum albumins. Biophysica 2021, 1, 344–358. [Google Scholar] [CrossRef] [Scilit]
- Ma, G.J.; Ferhan, A.R.; Sut, T.N.; Jackman, J.A.; Cho, N.-J. Understanding how natural sequence variation in serum albumin proteins affects conformational stability and protein adsorption. Colloids Surf. B Biointerfaces 2020, 194, 111194. [Google Scholar] [CrossRef] [Scilit] [PubMed]
- Trynda-Lemiesz, L.; Wiglusz, K. Interactions of human serum albumin with meloxicam: Characterization of binding site. J. Pharm. Biomed. Anal. 2010, 52, 300–304. [Google Scholar] [CrossRef] [Scilit] [PubMed]
- Seedher, N.; Bhatia, S. Mechanism of interaction of the non-steroidal antiinflammatory drugs meloxicam and nimesulide with serum albumin. J. Pharm. Biomed. Anal. 2005, 39, 257–262. [Google Scholar] [CrossRef] [Scilit] [PubMed]
- Poór, M.; Li, Y.; Matisz, G.; Kiss, L.; Kunsági-Máté, S.; Kőszegi, T. Quantitation of species differences in albumin–ligand interactions for bovine, human and rat serum albumins using fluorescence spectroscopy: A test case with some Sudlow’s site I ligands. J. Lumin. 2014, 145, 767–773. [Google Scholar] [CrossRef] [Scilit]
- Bujacz, A. Structures of bovine, equine and leporine serum albumin. Biol. Crystallogr. 2012, 68, 1278–1289. [Google Scholar] [CrossRef] [Scilit]
- Majorek, K.A.; Porebski, P.J.; Dayal, A.; Zimmerman, M.D.; Jablonska, K.; Stewart, A.J.; Chruszcz, M.; Minor, W. Structural and immunologic characterization of bovine, horse, and rabbit serum albumins. Mol. Immunol. 2012, 52, 174–182. [Google Scholar] [CrossRef] [Scilit] [PubMed]
- Bujacz, A.; Zielinski, K.; Sekula, B. Structural studies of bovine, equine, and leporine serum albumin complexes with naproxen. Proteins Struct. Funct. Bioinform. 2014, 82, 2199–2208. [Google Scholar] [CrossRef] [Scilit]
- Donoho, D.L.; Johnstone, I.M. Ideal spatial adaptation by wavelet shrinkage. Biometrika 1994, 81, 425–455. [Google Scholar] [CrossRef]
- Wahba, G. Spline Models for Observational Data; SIAM: Philadelphia, PA, USA, 1990. [Google Scholar]
- Pinheiro, J.C.; Bates, D.M. Mixed-Effects Models in S and S-PLUS; Springer: Berlin/Heidelberg, Germany, 2000. [Google Scholar]
- Weitner, T.; Friganovic, T.; Šakić, D. Inner filter effect correction for fluorescence measurements in microplates using variable vertical axis focus. Anal. Chem. 2022, 94, 7107–7114. [Google Scholar] [CrossRef] [Scilit] [PubMed]
- Zsila, F. Subdomain IB is the third major drug binding region of human serum albumin: Toward the three-sites model. Mol. Pharm. 2013, 10, 1668–1682. [Google Scholar] [CrossRef] [Scilit] [PubMed]
- Abou-Zied, O.K. Understanding the physical and chemical nature of the warfarin drug binding site in human serum albumin: Experimental and theoretical studies. Curr. Pharm. Des. 2015, 21, 1800–1816. [Google Scholar] [CrossRef] [Scilit] [PubMed]
- Bannwarth, B.; Netter, P.; Lapicque, F.; Mainard, D.; Fener, P.; Gillet, P.; Gaucher, A. Tenoxicam concentrations in synovium and joint cartilage in humans. Agents Actions 1991, 32, 295–298. [Google Scholar] [CrossRef] [Scilit] [PubMed]
- Avdeef, A. Absorption and Drug Development: Solubility, Permeability, and Charge State, 2nd ed.; John Wiley & Sons, Inc.: Hoboken, NJ, USA, 2012. [Google Scholar]
- Van de Weert, M.; Stella, L. Fluorescence quenching and ligand binding: A critical discussion of a popular methodology. J. Mol. Struct. 2011, 998, 144–150. [Google Scholar] [CrossRef] [Scilit]
- van de Weert, M.; Schönbeck, C. Ligand binding to proteins–When flawed fluorescence quenching methodology and interpretation become the new norm. Eur. J. Pharm. Sci. 2024, 203, 106930. [Google Scholar] [CrossRef] [Scilit] [PubMed]
- Aricov, L.; Angelescu, D.G.; Băran, A.; Leontieş, A.R.; Popa, V.T.; Precupaş, A.; Sandu, R.; Stîngă, G.; Anghel, D.-F. Interaction of piroxicam with bovine serum albumin investigated by spectroscopic, calorimetric and computational molecular methods. J. Biomol. Struct. Dyn. 2020, 38, 2659–2671. [Google Scholar] [PubMed]
- Mohammadnia, F.; Fatemi, M.; Taghizadeh, S. Study on the interaction of anti-inflammatory drugs with human serum albumin using molecular docking, quantitative structure–activity relationship, and fluorescence spectroscopy. Luminescence 2020, 35, 266–273. [Google Scholar] [PubMed]
- Russeva, V.; Zhivkova, Z.; Prodanova, K.; Rakovska, R. Protein binding of piroxicam studied by means of affinity chromatography and circular dichroism. J. Pharm. Pharmacol. 1999, 51, 49–52. [Google Scholar] [CrossRef] [Scilit] [PubMed]

Disclaimer/Publisher’s Note: The statements, opinions and data contained in all publications are solely those of the individual author(s) and contributor(s) and not of MDPI and/or the editor(s). MDPI and/or the editor(s) disclaim responsibility for any injury to people or property resulting from any ideas, methods, instructions or products referred to in the content. |
© 2026 by the authors. Licensee MDPI, Basel, Switzerland. This article is an open access article distributed under the terms and conditions of the Creative Commons Attribution (CC BY) license.