


Abstract
Synthetic azo dyes may be fraudulently added to paprika powder to intensify color, creating a need for rapid, at-line screening before confirmatory chromatographic analysis. This study evaluated handheld laser-induced breakdown spectroscopy (LIBS) for the screening of sodium-salt azo dye adulteration represented by Allura Red (E129), Ponceau 4R (E124), and Orange II in paprika powder. Paprika was spiked at 17 levels (0–6% w/w) in three independent batches, mixed with Al2O3 binder, dried, pelletized, and measured with a portable SciAps Z-903 under argon in the broad 190–950 nm region. The calibration models were developed using SNV-pretreated spectra and partial least squares regression with test-set validation based on a 70/30 split by concentration level. The main concentration-related response was increased Na emission, consistent with the sodium-salt form of the dyes, while Al emission showed an inverse matrix-/plasma-coupled trend despite the constant binder fraction. Full-spectrum models gave R2TSV values of 0.845–0.875 and RMSETSV values of 0.638–0.716% (w/w), using 4–5 latent variables. Outlier trimming improved prediction for Allura Red and Orange II, while regression coefficient-uncertainty variable selection reduced model complexity to 2–3 latent variables with dye-dependent effects. Since sodium-salt azo dyes are commonly used as adulterants in paprika powder, the Na-dominated LIBS response demonstrates good potential for rapid at-line screening. Nevertheless, as LIBS does not directly confirm dye identity, complementary confirmatory analysis using spectroscopic or chromatographic methods remains necessary.
1. Introduction
Paprika powder (Capsicum annuum L.) is a high-volume spice used to provide color and flavor in processed foods. Its unit value, frequent trade in milled form, and multi-operator supply chains make paprika vulnerable to economically motivated adulteration and mislabeling [1,2]. Reported fraud includes dilution or substitution with lower-value plant material and fillers (e.g., flours/starches, husk or stalk fractions, and “spent” paprika residues), together with undeclared colorants used to intensify redness and mask quality defects [1,2,3]. Regulatory surveys and literature reviews identify non-declared plant material as the dominant issue in herbs and spices, with non-authorized dyes reported less often but still relevant [2,3,4]. Ground herbs and spices are high-risk commodities for economically motivated adulteration because they can be blended and traded through long, multi-actor supply chains [5]. A paprika-specific review of fingerprinting and chemometric approaches summarizes substitution (including spent paprika), colorant adulteration, and the use of rapid screening methods alongside confirmatory analysis [6].
In practice, paprika quality is strongly linked to color intensity and hue, which are treated as commercial quality attributes in procurement and blending [7,8]. Because color defects can arise from cultivar, processing, storage, and the oxidative degradation of natural pigments, economic pressure exists to “restore” or standardize redness in ground products [9]. This creates a specific fraud niche in which small additions of intensely colored synthetic dyes can shift perceived quality and mask low-grade or diluted material, while being difficult to recognize visually once blended into a complex red matrix [1,10].
Color-related adulteration is relevant because redness is a key quality attribute of paprika powder and directly affects both consumer perception and commercial evaluation. Non-authorized dyes and undeclared dye mixtures also create food-safety and regulatory concerns, which has driven the monitoring of spices in official control and food-industry quality assurance workflows [1,4]. Targeted chromatographic methods (e.g., HPLC/UPLC with UV–Vis, fluorescence, or MS detection) provide high specificity and low detection limits, but extraction, consumables, trained personnel, and laboratory infrastructure limit throughput and on-site use [4,11]. Method development for illicit dyes in spices has focused mainly on Sudan dyes in paprika matrices [1,12], while matched quantitative screening studies for sulfonated azo dyes such as Allura Red (E129) and Ponceau 4R (E124), and for Orange II (Acid Orange 7; non-authorized as a food additive) remain less common, especially for laser-induced breakdown spectroscopy (LIBS) on controlled spiked sample sets [1,11]. In an EU-wide coordinated control plan, 27 of 462 paprika/chili samples (6%) were reported as suspicious, including 10 cases with non-authorized dyes; these findings show that dye cases occur in routine official control [13]. Wide-scope UHPLC–HRMS workflows have been demonstrated for screening large panels of synthetic dyes in spice extracts, including paprika. They also keep chromatography as the confirmatory benchmark for lots flagged by rapid screens [14].
Therefore, effective dye control requires a two-tier workflow, in which fast at line screening is intended to flag suspect lots, and followed by confirmatory chromatography for identification and compliance decisions [15,16]. Spectroscopic screening can be fast and require limited sample preparation, although heterogeneous powders make purely molecular signatures vulnerable to scattering, moisture, and natural pigment variability [17]. UV–Vis spectroscopy combined with multivariate models has already been used for Sudan-dye screening in spices [18]. However, UV–Vis detects broad electronic absorption bands. In paprika/chili matrices, natural carotenoids, degraded pigments, and added synthetic dyes can all contribute in the visible region.
LIBS avoids part of this limitation by recording narrow element emission lines instead of broad molecular absorption. Its response is therefore not directly governed by the visible color of paprika or by overlap between carotenoid and dye absorption bands. For sulfonated azo dyes supplied as sodium salts, LIBS can instead exploit changes in elemental emission, particularly Na lines, together with matrix-/plasma-coupled spectral changes [19,20]. LIBS records atomic emission from a transient microplasma produced by the pulsed-laser ablation of a small amount of sample [19,21,22,23]. Its speed, reagent-free operation, and compatibility with portable instruments make LIBS useful in food authenticity studies where elemental fingerprints complement molecular methods, especially for inorganic fillers or matrix-linked elemental shifts [19,20,21]. Compact lasers, multi-channel spectrometers, and onboard processing now allow transportable and handheld LIBS measurements in food, feed, and agricultural workflows [24]. Measurements can be performed at reception, storage, or processing points after appropriate sample preparation before confirmatory laboratory analysis [24]. Quantitative handheld LIBS still requires controlled sample preparation, sufficient averaging, and careful calibration because sample heterogeneity, ablation variability, and matrix effects strongly affect line intensities [24]. Food-focused LIBS reviews show that quantitative performance in powders depends strongly on matrix effects, sampling heterogeneity, preparation, and normalization [19].
The application of chemometrics can address some of these issues by using the full emission pattern instead of relying on a small number of manually selected lines [20,25]. Multivariate regression can therefore extract concentration-related covariance from several spectral regions, while also reducing sensitivity to shot-to-shot intensity variation. In complex powders, quantitative models usually use composite spectral patterns because matrix effects and ablation/plasma variability dominate absolute line intensities [19,20]. Portable/handheld LIBS has been demonstrated for rapid food authentication tasks using multivariate models in powdered matrices. These reports provide a practical basis for evaluating handheld LIBS as an at-line paprika screening method [25].
Synthetic azo dyes are primarily organic chromophores and, unlike mineral adulterants, lack a unique element that LIBS can target directly. This makes sampling design and multivariate model development more challenging, because the analytical response must be extracted from indirect spectral changes and not from a dye-specific emission line. In the present case, the expected LIBS response is indirect and arises from (i) the salt form of the dye and (ii) matrix- and plasma-coupled intensity changes. Many food azo dyes are sulfonated and are marketed as sodium salts (e.g., Allura Red AC as a disodium salt; Ponceau 4R commonly as a multi-sodium salt; Orange II as a sodium salt), so dye addition can systematically increase Na in the bulk composition [26]. In heterogeneous food powders, absolute line intensities are strongly influenced by ablation behavior, pellet microstructure, residual moisture, and plasma conditions; quantitative LIBS models therefore often use composite spectral patterns with limited reliance on a single analyte-specific line [19]. An apparent “dye signal” may therefore combine counter-ion-related Na emission with correlated changes in other lines and background features driven by matrix effects and sample preparation; this requires multivariate calibration and careful control of pelletization and measurement conditions [19]. This behavior agrees with the broader literature on LIBS of organic compounds, where discrimination commonly relies on indirect markers and composite patterns because specific line identification is usually unavailable [27].
The aim of this study was to evaluate handheld LIBS as an at-line screening approach for sodium-salt azo dye adulteration represented by Allura Red (E129), Ponceau 4R (E124), and Orange II, a non-authorized food additive, in paprika powder. Because these dyes are organic chromophores, the expected LIBS response is indirect and reflects counter-ion emission, particularly Na, together with matrix- and plasma-coupled spectral changes and not a selected dye-specific elemental line. Paprika was spiked at controlled concentration levels, pelletized with an inorganic binder to improve ablation reproducibility, and measured under an argon atmosphere. Quantitative models were built using full-wavelength partial least squares regression (PLS-R), with outlier trimming and coefficient-uncertainty variable selection evaluated as optional refinement steps. Loading interpretation and automated variable selection were used to identify the dominant spectral drivers, assess the role of Na, binder-related Al, and matrix-dependent contributions, and determine whether model simplification could improve interpretability without relying on manual line selection.
2. Materials and Methods
2.1. Samples and Concentration Design
Commercial paprika powder (“Paprika edelsüß spezial”, Kotányi, Wolkersdorf im Weinviertel, Austria) was used. Paprika from three production charges was used (charge numbers: L 419278201034, L 432911131611, and L 432911131603). Measurements were performed in random order according to a randomized measurement plan (not in ascending concentration) and were distributed over approximately three months; the laboratory temperature was typically 25–30 °C. For each dye, seventeen concentration levels between 0 and 6% (w/w) were prepared in three independent batches by weighing paprika and dye into light-protected 50 mL tubes (8 g total mass per tube) and mixing manually. The mixtures were shaken and rolled manually until no visible dye agglomerates remained; the same handling was used for blank samples. A test-set validation (TSV) design with a 70/30 split by concentration level was applied: twelve concentration levels were assigned to calibration and five to validation.
2.2. Colorants and Reagents
Allura Red AC (E129) and Ponceau 4R (E124) were used as authorized food colorants, and Orange II (Acid Orange 7) was included as a representative non-authorized azo dye. All colorants were handled as received in their commercial sodium-salt forms. Allura Red AC (E129; purity grade “purest”, >80%) and Ponceau 4R (E124; purity grade “purest”) were obtained from Carl Roth (Karlsruhe, Germany). Orange II (purity grade “pure, certified”) was obtained from Fisher Scientific/Thermo Scientific. Aluminum oxide (Al2O3; standard grade, Brockmann I; Sigma-Aldrich) was used as an inorganic binder for pellet preparation. Argon (purity 99.99%) was used as purge gas during LIBS measurements.
2.3. Pellet Preparation for LIBS
LIBS requires dry, mechanically stable samples. Dye–paprika mixtures were mixed with aluminum(III) oxide (Al2O3) at 50:50 (w/w) and dried overnight (18–20 h) at 80 °C. Pellets were pressed at 2 tons for 3 min using a handheld hydraulic mini-pellet press. Pellets had 7 mm diameter and approximately 1 mm thickness. Two pellets per concentration level were prepared for each batch and dye, mounted on microscope glass slides with a small amount of adhesive, and analyzed by LIBS. Paprika pellets without binder were tested during method development, but the pellets were fragile, showed poor surface integrity, and gave unstable ablation. Potassium bromide (KBr) was tested as a binder but required very high fractions (up to 95%) and resulted in fragile pellets; paraffin pellets yielded weak signals. Therefore, Al2O3 was used in the final LIBS workflow. Powder pelletization and binder addition are widely used strategies to improve repeatability in LIBS of heterogeneous solids, but they can also introduce additional spectral signatures and matrix effects that must be considered in calibration design [28].
2.4. LIBS Instrumentation and Data Acquisition
Measurements were performed using a handheld SciAps Z-903 (SciAps, Inc., Andover, MA, USA) LIBS analyzer (190–950 nm) equipped with an on-board argon purge (Opti-Purge) to stabilize the plasma and improve signal-to-noise, particularly in the UV range. The instrument uses a solid-state pulsed laser delivering a nominal 5–6 mJ per pulse at a 50 Hz repetition rate. The typical laser beam diameter is approximately 50 μm, corresponding to an approximate single-pulse fluence of 255–306 J cm−2; the precise pulse duration was not available from the instrument output. The time-gating and integration parameters were the manufacturer default values and are not available in the user-accessible method report. The Z-903 uses a three-spectrometer stack design, with an approximate spectral resolution reported for this instrument class of 0.1 nm below 365 nm and 0.3 nm above 365 nm. All measurements were acquired using the same instrument acquisition settings. Measurements were conducted under typical air-conditioned laboratory conditions (24 °C; 25–30% RH). Two pellets were prepared per concentration per batch. Each pellet was measured at three user-defined positions. At each position, 25 laser shots were collected using the instrument rastering routine, which samples several nearby micro-locations within one measurement position; the pellet structure does not require cleaning pulses. With two pellets per concentration per batch this yielded 150 single-shot spectra per concentration per batch. In total, 7650 single-shot spectra were acquired per dye (17 concentrations × 3 batches × 150 spectra).
2.5. Data Analysis
Single-shot spectra were screened for obvious acquisition faults (e.g., saturation, abnormal continuum, misfire-like spectra). Faults were defined as spectra with detector saturation, nearly absent emission after laser firing, or continuum shapes inconsistent with the remaining spectra from the same acquisition block. Retained spectra were averaged at the measurement-position level and then pretreated by standard normal variate (SNV) and mean-centered prior to principal component analysis (PCA) and PLS-R. SNV is widely used in LIBS of heterogeneous solids to reduce global multiplicative and offset variability when coupling dominates absolute line intensities [29], while normalization choices can materially change quantitative LIBS models and should be reported explicitly [30]. No explicit baseline or continuum subtraction was applied before SNV. This kept the reported workflow simple and avoided additional user-defined correction parameters; the remaining continuum contribution is treated below as part of the matrix- and plasma-coupled variance. All spectral preprocessing, exploratory analysis, and chemometric modeling were performed in The Unscrambler X software, version 10.5 (CAMO Software, Oslo, Norway).
PCA was calculated using the nonlinear iterative partial least squares (NIPALS) algorithm. The PCA results were used to inspect dominant variance sources and to support, together with diagnostic statistics and visual spectral inspection, the identification of clearly abnormal acquisitions. For PCA visualization, spectra were averaged at the measurement-position/object level to avoid excessive overplotting of single-shot LIBS data. Each object represents one measurement position, with 25 shots acquired at that position; three positions were measured on each pellet, and two pellets were prepared per concentration level and batch.
PLS-R models were built separately for each dye using the full spectral range and the fixed test-set validation split by concentration level (Table 1). Grouping spectra by concentration level in TSV avoids leakage that would inflate apparent prediction accuracy in repeated-shot LIBS datasets. The number of latent variables was selected by internal cross-validation within the calibration set; TSV was used only for external performance reporting.
Table 1.
Concentration levels used for calibration and validation.
Two controlled processing steps were evaluated: (i) conservative removal of demonstrably faulty acquisition objects using Q-residuals/Hotelling’s T2 statistics together with spectral inspection (10 objects removed from the corresponding dye dataset when trimming was used); and (ii) coefficient-uncertainty variable selection (VarSel; Unscrambler “uncertainty test”), which estimates the uncertainty of PLS-R weights by jackknife resampling [31,32] and is commonly used to simplify models but does not guarantee improved prediction [33]. Line positions from the NIST Atomic Spectra Database [34] were used to annotate Na (sodium) and Al (aluminum) features and potential overlaps that recur in loadings and retained-variable patterns (Table 2 and Table 3; Section 3).
Table 2.
Main LIBS features used for interpretation of dye-related spectral responses.
Table 3.
Selected LIBS lines (NIST) used for peak assignment and interpretation.
3. Results and Discussion
3.1. Characteristic LIBS Responses to Dye Addition
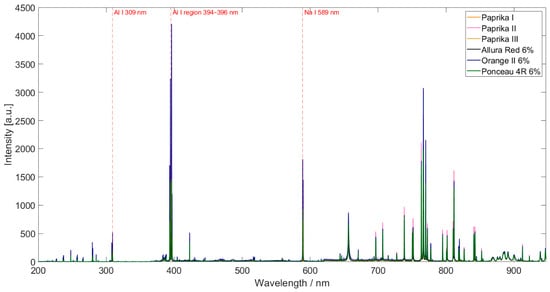
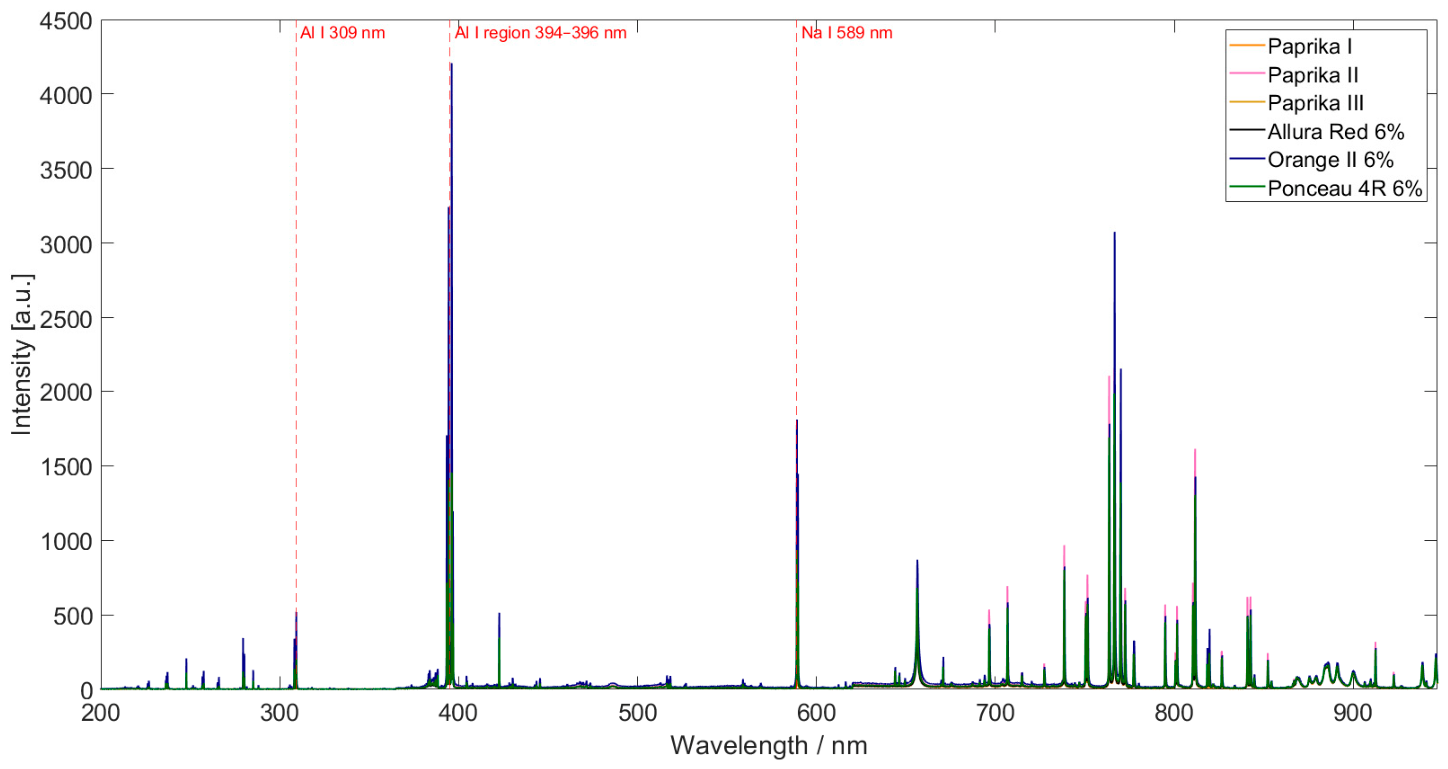
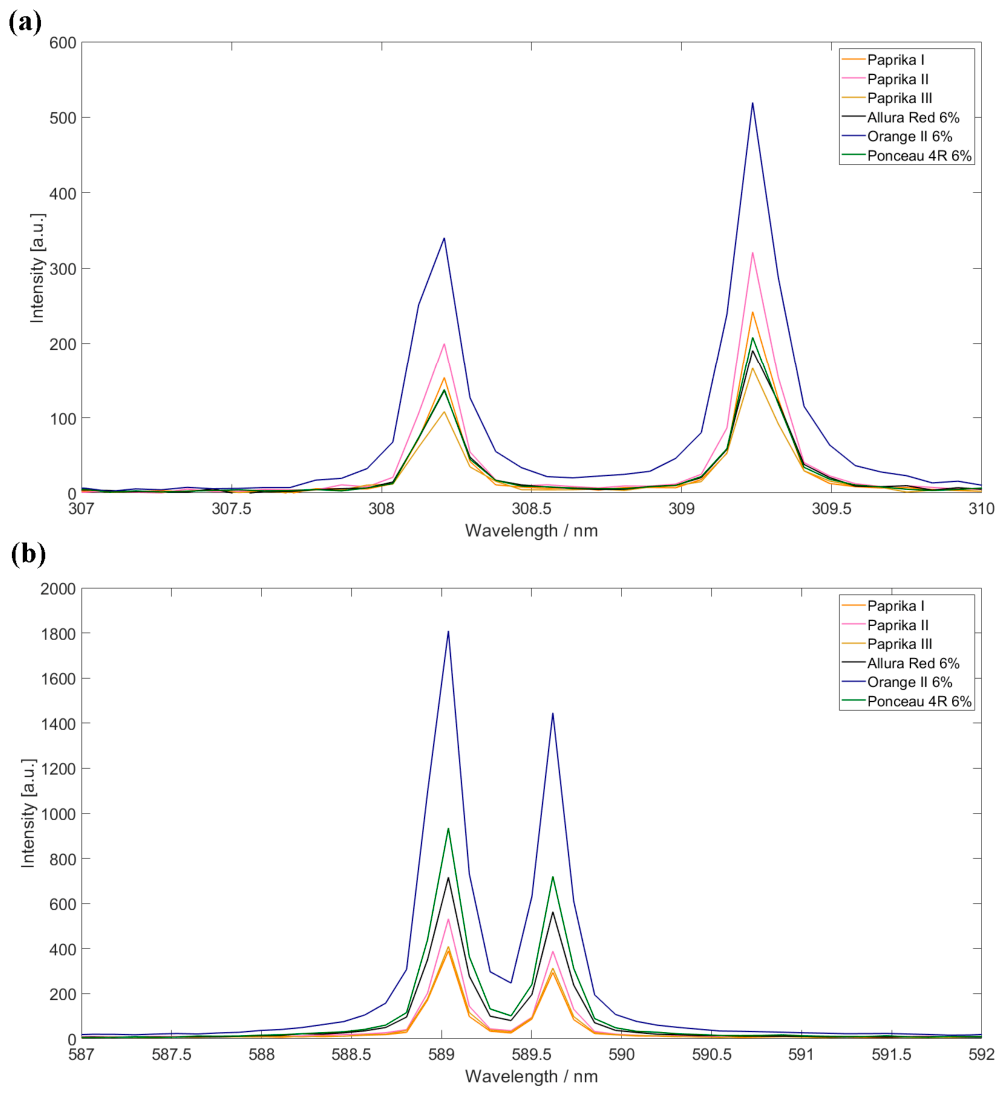
Spectra from the Al2O3-stabilized paprika pellets are dominated by matrix emission and intense binder-derived Al I features (Figure 1). For all three dyes, Na I emission, most clearly the D-lines near 589 nm, is the only reproducible monotonic response to dye addition (Figure 2b; Table 2), consistent with the sodium-salt form of sulfonated azo dyes [26].
Figure 1.
Representative LIBS spectra of pure paprika and paprika spiked with 6% (w/w) dye (example series). The Na I (≈589 nm) and Al I (≈309 and 394–396 nm) emission features are indicated.
Figure 2.
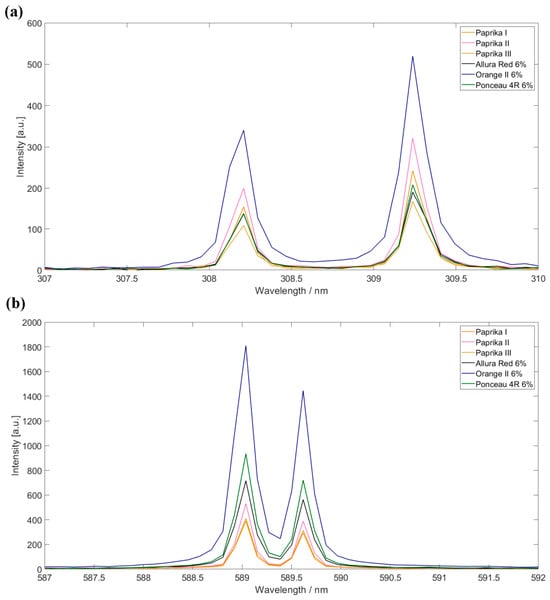
Magnified spectral regions of the vicinity of (a) an Al line near 309 nm and (b) the Na I D-lines near 589 nm.
Several Al I lines (e.g., 309 and 394–396 nm) decrease with rising dye level despite the constant binder fraction (Figure 2a). This pattern points to matrix-/plasma-coupled intensity effects and partial line–region overlap (Table 3); the constant Al2O3 fraction makes a true Al concentration change unlikely. Such matrix effects and sampling heterogeneity are well documented as limiting factors for quantitative LIBS in complex food powders [19,35]. For organic chromophores, the LIBS signature remains indirect and can include counter-ion markers together with correlated matrix/background structure [27].
3.2. PCA and PLS-R Model Performance
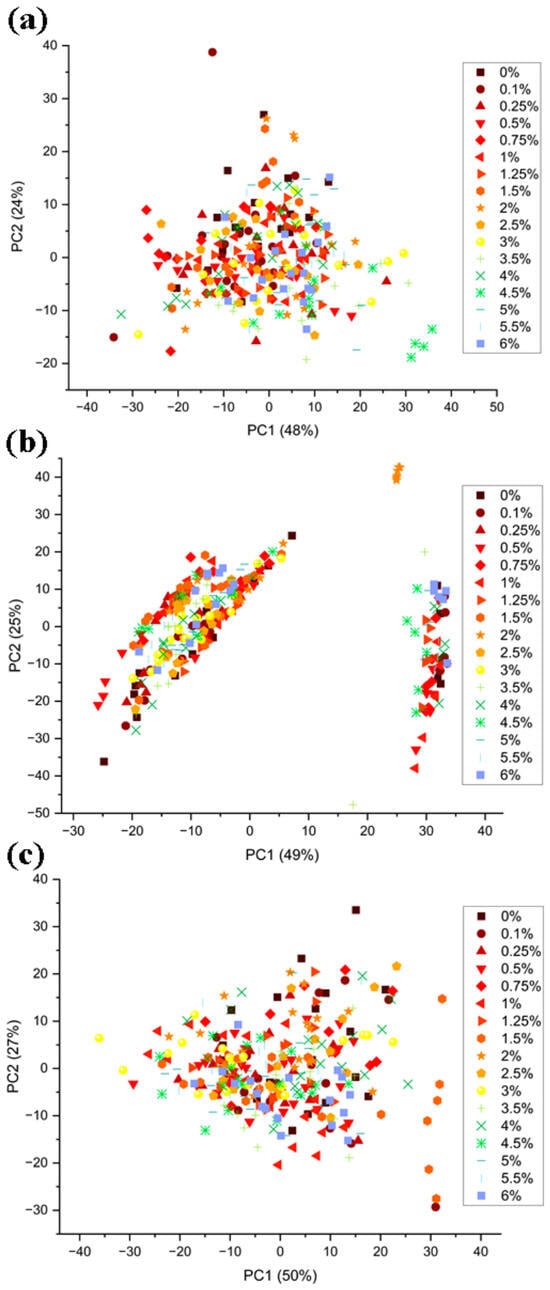
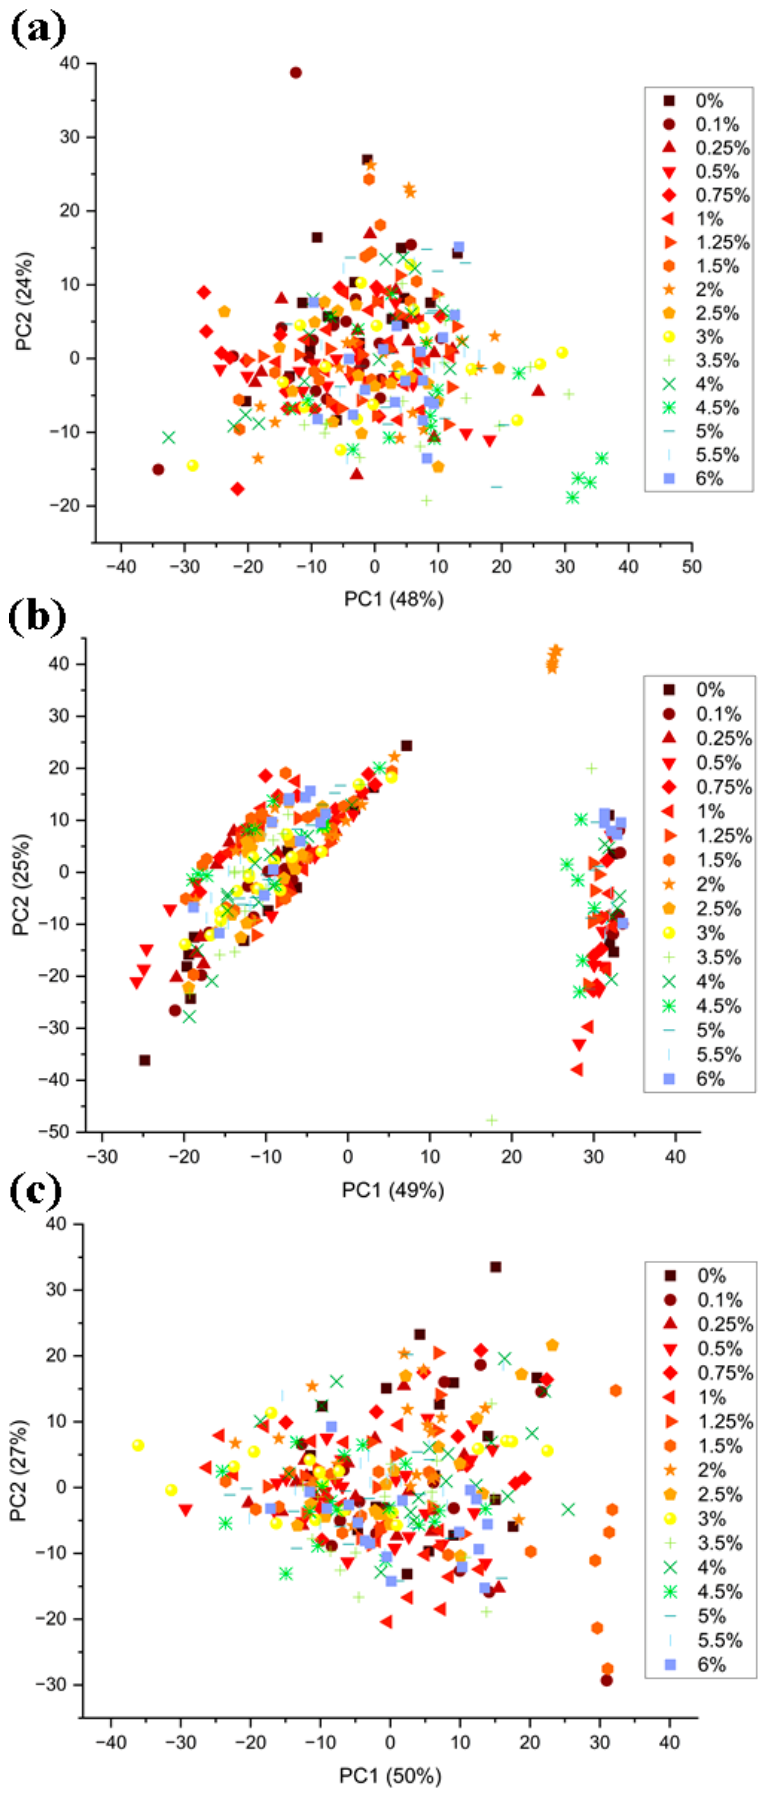
PCA shows that the dominant variance is governed by position-to-position and microstructural effects (continuum level, global scaling, strong matrix/binder lines), and concentration levels therefore overlap substantially in score space (Figure 3). This behavior is typical for LIBS on pressed heterogeneous powders, where local porosity, binder distribution, and ablation yield dominate unsupervised variance and can obscure smaller concentration-linked shifts [19,28].
Figure 3.
PCA score plots of LIBS spectra for paprika powder spiked with (a) Allura Red, (b) Orange II, and (c) Ponceau 4R.
PCA mainly reflected high-variance sources typical of position-level LIBS measurements, including shot-to-shot plasma variability, continuum intensity changes, ablation–yield fluctuations, pellet microstructure, and binder contribution. Higher PCs were also inspected (Figure S1). A secondary concentration-related gradient appeared mainly along PC4 for all three dyes, but concentration levels remained substantially overlapped (with other sources of variability, confirming that concentration effects were confounded by stronger shot-/pellet-/matrix-/plasma-related variation), especially at low adulteration levels. Accordingly, the PC3–PC4 plot reflects some concentration-related variance (Figure S1), but it is not present among the dominant components.
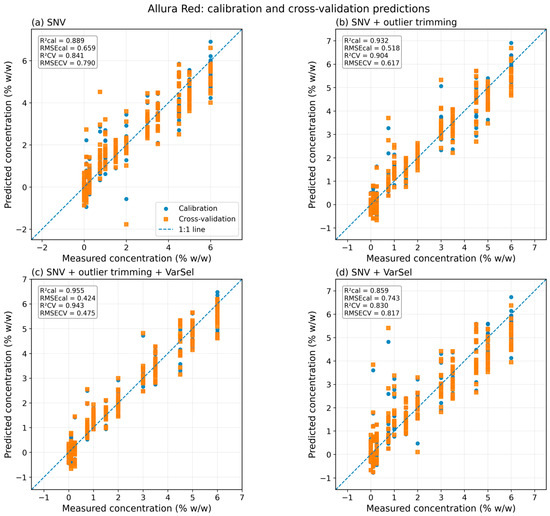
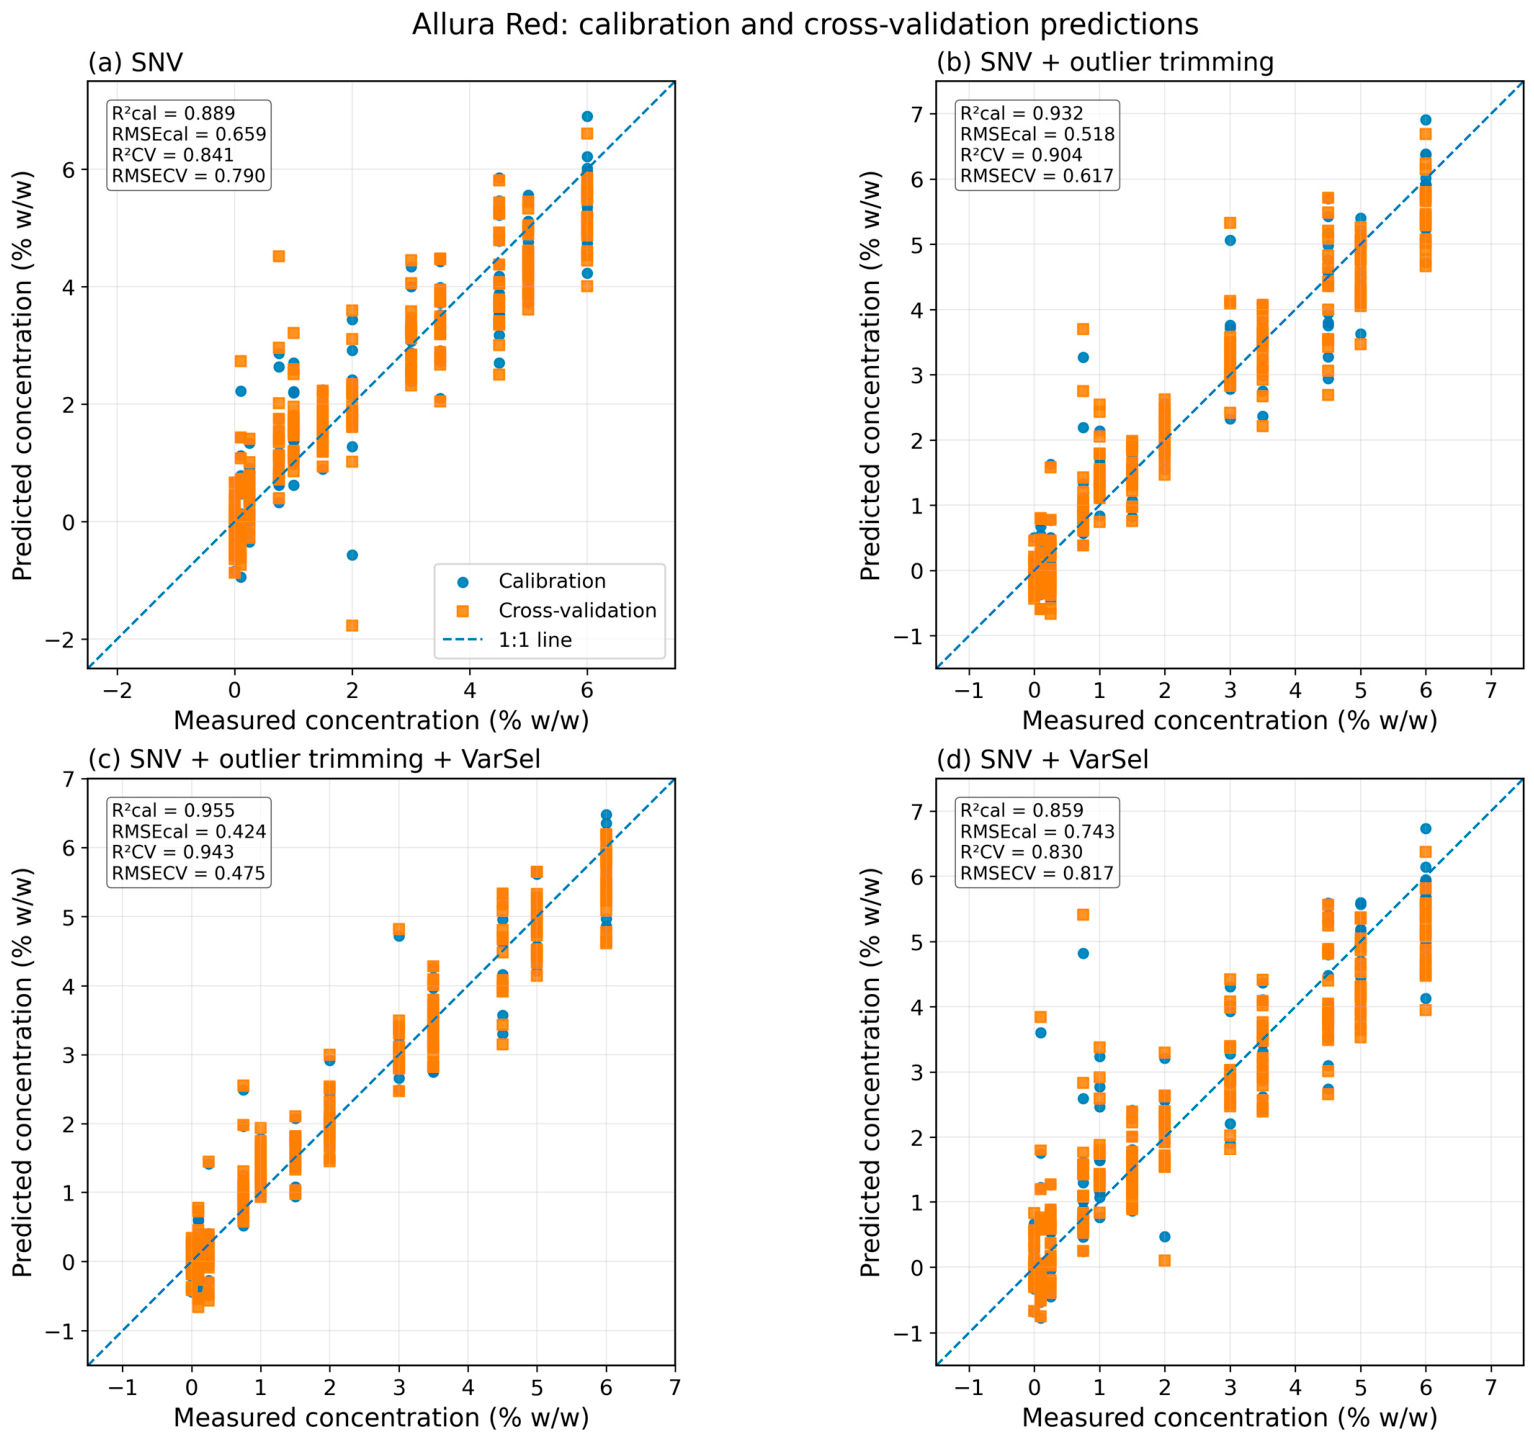
In contrast, PLS-R extracted concentration-related covariance, most clearly the increase in Na emission with dye level, although individual measurement positions can still be shifted by local heterogeneity or plasma variability enough to overlap with neighboring concentration levels. The multi-point raster acquisition of the Z-903 nevertheless provides replicate spectra whose overall prediction trend was approximately linear with dye concentration (Figure 4). For the SNV full-spectrum models, RMSE(TSV) of 0.638–0.716% (w/w) with R2(TSV) of 0.845–0.875 were obtained using 4–5 latent variables (Table 4), consistent with a distributed composite signature controlled by strong matrix effects and limited analyte-specific line information [19,20,25].
Figure 4.
PLS-R calibration and cross-validation predictions for paprika powder with Allura Red: (a) SNV (full spectrum), (b) SNV + outlier trimming, (c) SNV + outlier trimming + VarSel, (d) SNV + VarSel. Blue points show calibration objects and orange points show cross-validation objects.
Table 4.
PLS-R performance for LIBS quantification. RMSE values are in % (w/w). Metrics are reported at the measurement-position/object level. CAL, CV, TSV and LV denote calibration, cross-validation, test-set validation and latent variables, respectively.
Outlier trimming, restricted to demonstrably faulty acquisitions, improved TSV performance for Allura Red and Orange II, with no comparable improvement for Ponceau 4R (Table 4). Removal criteria should therefore be tied to acquisition faults and spectral inspection, since statistical influence alone can remove relevant matrix variability. Coefficient-uncertainty variable selection (VarSel) reduced model rank to 2–3 latent variables in all series, with dye-dependent changes in TSV error; for jackknife-based variable selection, simplification and generalization depend on whether unstable predictors represent noise or legitimate plasma/matrix variability [31,36].
The prediction performance toward low concertation levels was inspected using cross-validated predictions for the calibration levels between 0 and 1.0% w/w. An operational screening threshold was calculated from the blank prediction distribution as the mean predicted blank plus three standard deviations divided by the factor of √6 (which reflects averaging over six acquisition objects, corresponding to two pellets × three measured positions). We report these values as workflow-specific screening thresholds and avoid treating them as formal regulatory LODs. When repeated acquisition averaging was considered, the fitted CV-based operational thresholds were approximately 0.26% w/w for Allura Red, 1.75% w/w for Orange II, and 0.37% w/w for Ponceau 4R. However, because of the design of the calibration concentration levels, empirical separation was first observed at 0.75% w/w for Allura Red, 1.5% w/w for Orange II, and 0.75% w/w for Ponceau 4R.
3.3. Interpretation of PLS-R Model Features and Selected Variables
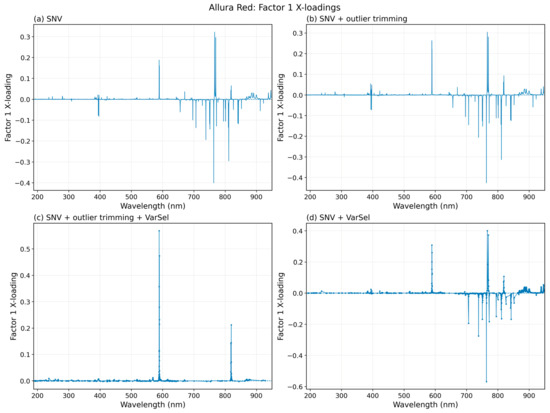
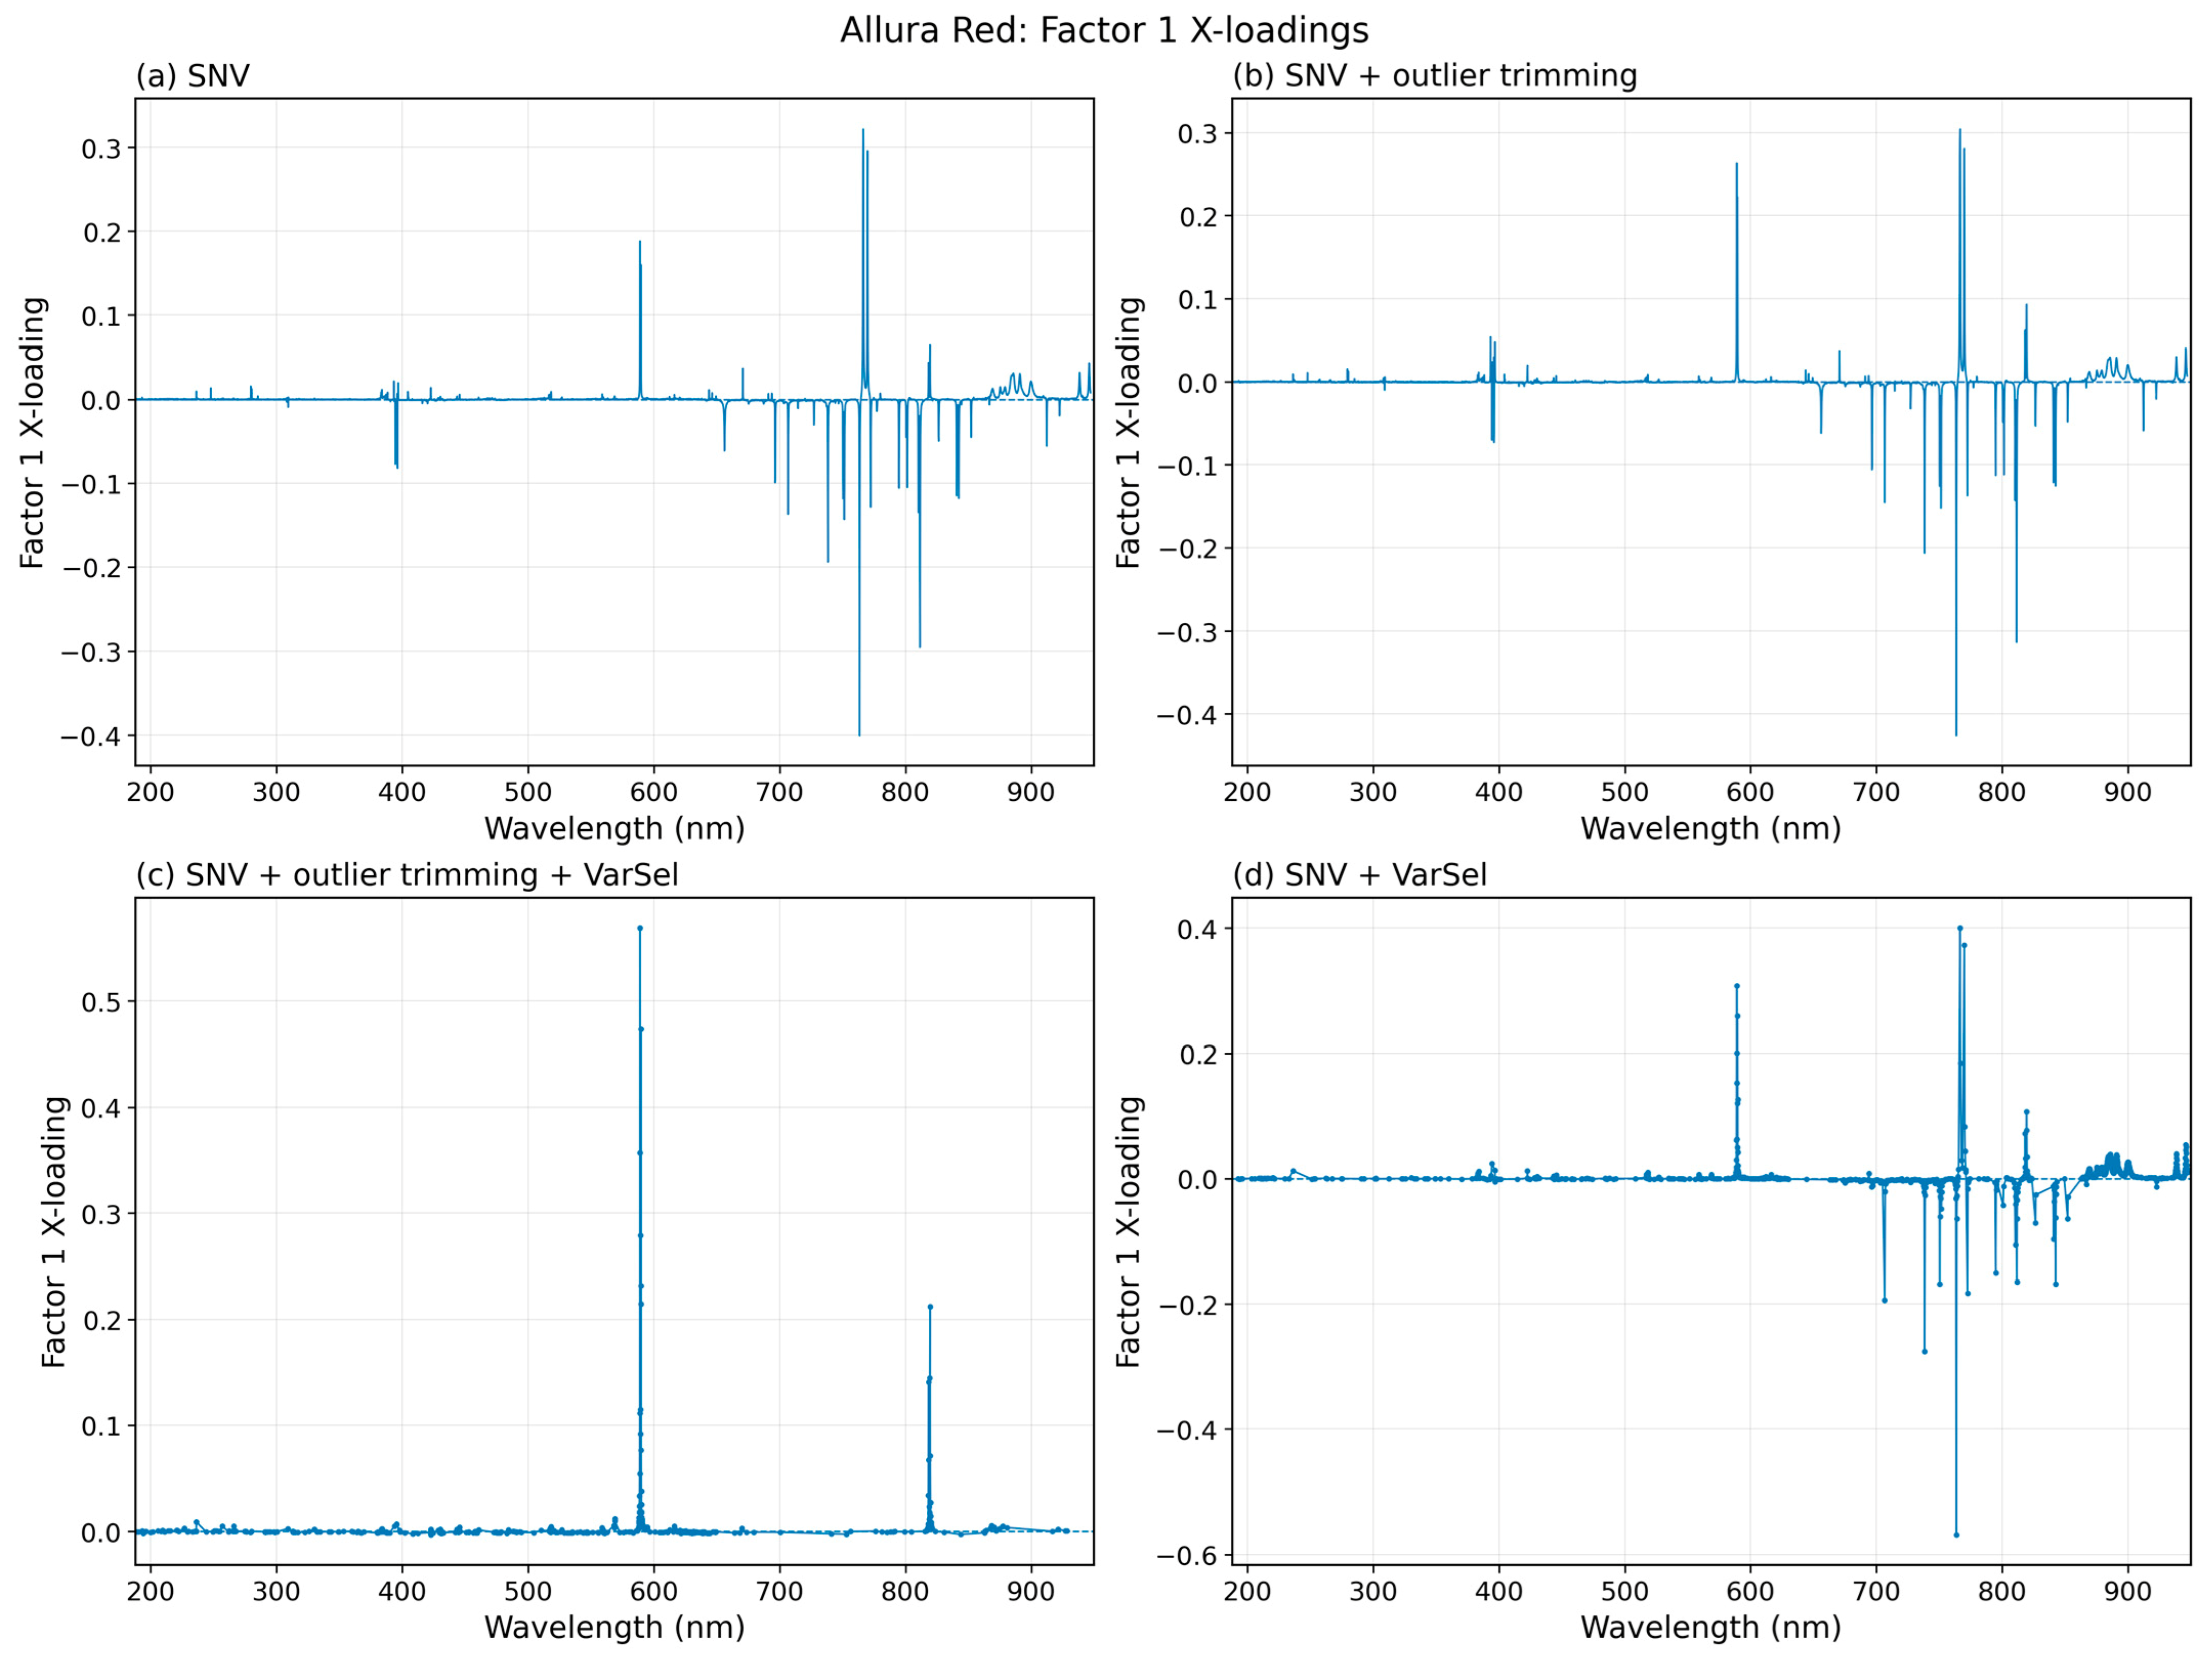
X-loadings and retained-variable patterns show that the PLS-R models exploit Na counter-ion regions together with correlated binder/matrix features. For Allura Red, Factor 1 loadings emphasize Na I at 588.995/589.592 and 818.326/819.482 nm with opposite sign to binder-related Al I regions (Figure 5a; Table 3), matching the univariate trends in Figure 1 and Figure 2.
Figure 5.
Factor 1 X-loadings from PLS-R models for Allura Red: (a) SNV (full spectrum), (b) SNV + outlier trimming, (c) SNV + outlier trimming + VarSel, (d) SNV + VarSel.
Outlier trimming preserved the assignment of Na- and Al-related contributions (Figure 5b) and reduced coefficient distortion from rare abnormal shots, consistent with the sensitivity of high-dimensional regression models to leverage points [35]. After outlier trimming, the uncertainty test simplifies the latent structure and concentrates Factor 1 on Na I regions (Figure 5c; Table 3), aligning the first latent variable with the most chemically transparent marker in this matrix. In the untrimmed model, the same procedure retains broader line-rich windows (Figure 5d), including K I and O I regions (Table 3) that can co-vary with dye level through pellet microstructure and plasma conditions.
The automated variable selection (Table S2) can identify the most reliable regression coefficients, reducing the corresponding retained-variable counts to as low as 10% of that in the original spectrum. This selection is made per-point, and can retain broad spectral regions as well as isolated LIBS lines [31,32]. For Orange II, a Na-dominant Factor 1 loading emerges even without outlier trimming, consistent with the improved TSV performance of SNV + VarSel (Table 4; Figure S2). For Ponceau 4R, Na regions remain prominent, but additional contributions persist and TSV performance changes little (Table 4; Figure S3), suggesting a stronger role of matrix-/plasma-coupled variance in that series. Reviews of PLS variable selection note that this step can improve interpretability but the retained predictors may also arise from matrix or plasma effects instead of a narrowly localized analyte-specific wavelength [33].
Sodium emission is the clearest chemically interpretable marker for dye addition. Binder-related Al and other matrix lines can act as preparation-/plasma-coupled predictors. Figure 5, together with Table 2 and Table 4, therefore provides a practical diagnostic for classifying the model structure as Na-dominant or proxy-dominated, consistent with the general possibility of LIBS of organic compounds relying on indirect markers and composite patterns [20,27].
The final regression vectors contain more structure than the Na lines alone. Their strongest coefficients cluster near Na I 589 and 818–819 nm, while Al/Ca, K, O/N/H, continuum/deep-UV and other spectral regions also contribute. These additional terms are assigned to matrix-, binder-, normalization- and plasma-coupled covariance within the standardized paprika-Al2O3 pellet workflow. They do not provide dye-specific molecular markers, but they are part of the reproducible full-spectrum calibration used here.
The useful LIBS response is governed by Na from the sodium-salt form of the dyes (Figure 1 and Figure 2; Table 2), while the inverse Al response reflects matrix-/plasma-coupled intensity effects and local line–region overlap (Table 3). These indirect signatures are typical for LIBS of organic compounds and for quantitative models in heterogeneous food powders [19,27].
Residual scatter and the need for multiple latent variables (Table 4) are governed mainly by matrix effects: local porosity, binder distribution, and position-to-position ablation yield change continuum level and line ratios at least as strongly as dye-driven Na changes. Sample treatment and pelletization are the main practical routes for improving LIBS repeatability, although binders/diluents can introduce strong spectral features and additional coupling that must be controlled and interpreted [23,28,30,37].
The present results suggest that model refinement requires conservative criteria. The rejection of acquisition objects confirmed by spectral inspection is justified, while trimming based only on influence can remove legitimate variability (Table 4); jackknife-based wavelength (regression coefficient) selection can simplify interpretation and may also stabilize correlated predictors (matrix-dependent) when the sample preparation procedure creates a repeatable relationship between dye level and non-dye spectral features [33,36]. Robustness testing should focus, therefore, on conditional perturbations (pellet-to-pellet and batch-to-batch variability, day-to-day drift, and spatial averaging strategy) and report performance after pellet/sample-level averaging in addition to position-level metrics [35].
4. Conclusions
Handheld LIBS combined with PLS-R produced linear responses for sodium-salt azo dye addition in dry, pelletized paprika powder (R2(CAL) 0.86–0.96; R2(TSV) 0.83–0.92). Coefficient-uncertainty variable selection reduced model complexity to 2–3 latent variables, with dye-dependent effects on prediction and interpretation. The data also show that full-wavelength PLS-R can be used without the manual selection of individual emission lines. This is useful for routine screening, because line relevance can depend on sample type, pellet preparation and measurement conditions. When repeated acquisition averaging was considered, the fitted CV-based operational thresholds were approximately 0.26% w/w for Allura Red, 1.75% w/w for Orange II, and 0.37% w/w for Ponceau 4R. Further optimization of binder selection and pellet preparation, homogenization, and spatial averaging are expected to reduce the dominant uncertainty sources, and improve the quantification limit.
The method is suitable for at-line screening after standardized drying and sample preparation. The preparation/pelletization procedure is fairly straightforward, reproducible, and not overly complex, yielding samples well suited for analysis by portable LIBS. Prediction was driven by a composite LIBS response in which Na emission from dye counter-ions was the dominant chemical marker, with additional matrix-, binder- and plasma-coupled contributions. Other sodium-containing materials could therefore produce false-positive responses, so additional chromatographic confirmation remains necessary for dye-specific identification and regulatory decisions. Overall, the developed LIBS method provides a practical and rapid at-line screening workflow.
Supplementary Materials
The following supporting information can be downloaded at https://www.mdpi.com/article/10.3390/analytica7030047/s1: Figure S1: Relevant example of higher PC score plots (PC3 vs. PC4) of SNV-pretreated LIBS spectra for paprika powder spiked with (a) Allura Red, (b) Orange II, and (c) Ponceau 4R. Scores are shown for measurement-position/object-level spectra; colors indicate nominal dye concentration; Figure S2: Factor 1 X-loadings from PLS models for Orange II: (a) SNV (full spectrum), (b) SNV + outlier trimming, (c) SNV + outlier trim-ming + VarSel, (d) SNV + VarSel; Figure S3: Factor 1 X-loadings from PLS models for Ponceau 4R: (a) SNV (full spectrum), (b) SNV + outlier trimming, (c) SNV + outlier trim-ming + VarSel, (d) SNV + VarSel; Supplementary Note S1: Variable selection behavior for the three dyes; Table S1: Summary of wavelength regions emphasized by coefficient-uncertainty variable selection (VarSel) from PLS X-loadings; Table S2: Number of wavelength variables retained after coefficient-uncertainty variable selection (Unscrambler “uncertainty test”); Table S3: Selected LIBS lines used for peak assignment and interpretation.
Author Contributions
Conceptualization, J.G. and K.B.B.; methodology, J.G. and K.B.B.; validation, J.G., K.B.B. and V.M.; formal analysis, J.G. and K.B.B.; investigation, J.G., K.B.B. and A.F.-L.; resources, C.W.H.; data curation, J.G., K.B.B., V.M. and A.F.-L.; writing—original draft preparation, J.G.; writing—review and editing, J.G., K.B.B., V.M., A.F.-L. and C.W.H.; visualization, J.G.; supervision, C.W.H.; funding acquisition, J.G. All authors have read and agreed to the published version of the manuscript.
Funding
This research was funded in part by the Austrian Science Fund (FWF) 10.55776/V1014. For open access purposes, the author has applied a CC BY public copyright license to any author accepted manuscript version arising from this submission.
Data Availability Statement
Dataset available on request from the authors.
Conflicts of Interest
The authors declare no conflicts of interest.
References
- Galvin-King, P.; Haughey, S.A.; Elliott, C.T. The detection of substitution adulteration of paprika with spent paprika by the application of molecular spectroscopy tools. Foods 2020, 9, 944. [Google Scholar] [CrossRef] [Scilit] [PubMed]
- Velázquez, R.; Rodríguez, A.; Hernández, A.; Casquete, R.; Benito, M.J.; Martín, A. Spice and herb frauds: Types, incidence, and detection: The state of the art. Foods 2023, 12, 3373. [Google Scholar] [CrossRef] [Scilit] [PubMed]
- European Commission. New JRC Research Helps Expose Food Fraud. Available online: https://joint-research-centre.ec.europa.eu/jrc-news-and-updates/new-jrc-research-helps-expose-food-fraud-2024-11-29_en (accessed on 12 November 2025).
- Essuman, E.K.; Teye, E.; Dadzie, R.G.; Sam-Amoah, L.K. Pesticide residues and unauthorized dyes as adulteration markers in chilli pepper and tomato. Int. J. Food Sci. 2023, 2023, 5337150. [Google Scholar] [CrossRef] [Scilit] [PubMed]
- Galvin-King, P.; Haughey, S.A.; Elliott, C.T. Herb and spice fraud; the drivers, challenges and detection. Food Control 2018, 88, 85–97. [Google Scholar] [CrossRef] [Scilit]
- Monago-Maraña, O.; Durán-Merás, I.; La Muñoz de Peña, A.; Galeano-Díaz, T. Analytical techniques and chemometrics approaches in authenticating and identifying adulteration of paprika powder using fingerprints: A review. Microchem. J. 2022, 178, 107382. [Google Scholar] [CrossRef] [Scilit]
- Nieto-Sandoval, J.M.; Fernández-López, J.A.; Almela, L.; Muñoz, J.A. Dependence between apparent color and extractable color in paprika. Color Res. Appl. 1999, 24, 93–97. [Google Scholar] [CrossRef] [Scilit]
- Koncsek, A.; Daood, H.G.; Horváth, Z.H.; Fekete, M.; Véha, A.; Helyes, L. Improvement of antioxidant content and color stability in spice paprika powder by rosemary extract supplementation. J. Food Process. Preserv. 2019, 43, e14000. [Google Scholar] [CrossRef] [Scilit]
- Topuz, A. A novel approach for color degradation kinetics of paprika as a function of water activity. LWT Food Sci. Technol. 2008, 41, 1672–1677. [Google Scholar] [CrossRef] [Scilit]
- Sun, X.; Zhang, M.; Wang, P.; Chen, J.; Yang, S.; Luo, P.; Gao, X. Detection and quantitation of adulterated paprika samples using second-order HPLC-FLD fingerprints and chemometrics. Foods 2022, 11, 2376. [Google Scholar] [CrossRef] [Scilit] [PubMed]
- Park, J.; Cho, Y.S.; Seo, D.W.; Choi, J.Y. An update on the sample preparation and analytical methods for synthetic food colorants in food products. Food Chem. 2024, 459, 140333. [Google Scholar] [CrossRef] [Scilit] [PubMed]
- El-Tahlawy, A.S.; Samkumpim, T.; Wardani, N.I.; Kraiya, C.; Alahmad, W. Analytical advances for detecting illicit dyes in foods: Spectroscopy, chromatography, mass spectrometry, and emerging sensing techniques. Food Chem. Toxicol. 2026, 207, 115843. [Google Scholar] [CrossRef] [Scilit] [PubMed]
- Maquet, A.; Lievens, A.; Paracchini, V.; Kaklamanos, G.; de la Calle Guntiñas, M.B.; Garlant, L.; Papoci, S.; Pietretti, D.; Zdiniakova, T.; Breidbach, A.; et al. Results of an EU Wide Coordinated Control Plan to Establish the Prevalence of Fraudulent Practices in the Marketing of Herbs and Spices. 2021. Available online: https://food.ec.europa.eu/system/files/2021-11/food-fraud_action_herbs-spices_report_jrc126785_0.pdf (accessed on 1 February 2026).
- Périat, A.; Bieri, S.; Mottier, N. SWATH-MS screening strategy for the determination of food dyes in spices by UHPLC-HRMS. Food Chem. X 2019, 1, 100009. [Google Scholar] [CrossRef] [Scilit] [PubMed]
- Black, C.; Haughey, S.A.; Chevallier, O.P.; Galvin-King, P.; Elliott, C.T. A comprehensive strategy to detect the fraudulent adulteration of herbs: The oregano approach. Food Chem. 2016, 210, 551–557. [Google Scholar] [CrossRef] [Scilit] [PubMed]
- Sharma, R.; Nath, P.C.; Lodh, B.K.; Mukherjee, J.; Mahata, N.; Gopikrishna, K.; Tiwari, O.N.; Bhunia, B. Rapid and sensitive approaches for detecting food fraud: A review on prospects and challenges. Food Chem. 2024, 454, 139817. [Google Scholar] [CrossRef] [Scilit] [PubMed]
- Shawky, E.; Nahar, L.; Nassief, S.M.; Sarker, S.D.; Ibrahim, R.S. Spice authentication by near-infrared spectroscopy: Current advances, limitations, and future perspectives. Trends Food Sci. Technol. 2024, 148, 104522. [Google Scholar] [CrossRef] [Scilit]
- Di Anibal, C.V.; Odena, M.; Ruisánchez, I.; Callao, M.P. Determining the adulteration of spices with Sudan I–II–III–IV dyes by UV-visible spectroscopy and multivariate classification techniques. Talanta 2009, 79, 887–892. [Google Scholar] [CrossRef] [Scilit] [PubMed]
- Markiewicz-Keszycka, M.; Cama-Moncunill, X.; Casado-Gavalda, M.P.; Dixit, Y.; Cama-Moncunill, R.; Cullen, P.J.; Sullivan, C. Laser-induced breakdown spectroscopy (LIBS) for food analysis: A review. Trends Food Sci. Technol. 2017, 65, 80–93. [Google Scholar] [CrossRef] [Scilit]
- Shin, S.; Wu, X.; Patsekin, V.; Doh, I.J.; Bae, E.; Robinson, J.P.; Rajwa, B. Analytical approaches for food authentication using LIBS fingerprinting. Spectrochim. Acta Part B At. Spectrosc. 2023, 205, 106693. [Google Scholar] [CrossRef] [Scilit]
- Markiewicz-Keszycka, M.; Cama-Moncunill, R.; Casado-Gavalda, M.P.; Sullivan, C.; Cullen, P.J. Laser-induced breakdown spectroscopy for food authentication. Curr. Opin. Food Sci. 2019, 28, 96–103. [Google Scholar] [CrossRef] [Scilit]
- Thomas, J.; Chandra Joshi, H. Review on laser-induced breakdown spectroscopy: Methodology and technical developments. Appl. Spectrosc. Rev. 2024, 59, 124–155. [Google Scholar] [CrossRef] [Scilit]
- Palleschi, V.; Legnaioli, S.; Poggialini, F.; Bredice, F.O.; Urbina, I.A.; Lellouche, N.; Messaoud Aberkane, S. Laser-induced breakdown spectroscopy. Nat. Rev. Methods Primers 2025, 5, 17. [Google Scholar] [CrossRef] [Scilit]
- Beć, K.B.; Grabska, J.; Huck, C.W. X-ray, LIBS, NMR, and MS applications in food, feed, and agriculture. In Portable Spectroscopy and Spectrometry; Crocombe, R., Leary, P., Kammrath, B., Eds.; Wiley: Hoboken, NJ, USA, 2021; pp. 299–323. [Google Scholar] [CrossRef] [Scilit]
- Wu, X.; Shin, S.; Gondhalekar, C.; Patsekin, V.; Bae, E.; Robinson, J.P.; Rajwa, B. Rapid food authentication using a portable laser-induced breakdown spectroscopy system. Foods 2023, 12, 402. [Google Scholar] [CrossRef] [Scilit] [PubMed]
- Fuh, M.R.; Chia, K.J. Determination of sulphonated azo dyes in food by ion-pair liquid chromatography with photodiode array and electrospray mass spectrometry detection. Talanta 2002, 56, 663–671. [Google Scholar] [CrossRef] [Scilit] [PubMed]
- Moros, J.; Laserna, J. Laser-induced breakdown spectroscopy (LIBS) of organic compounds: A review. Appl. Spectrosc. 2019, 73, 963–1011. [Google Scholar] [CrossRef] [Scilit]
- Jantzi, S.C.; Motto-Ros, V.; Trichard, F.; Markushin, Y.; Melikechi, N.; de Giacomo, A. Sample treatment and preparation for laser-induced breakdown spectroscopy. Spectrochim. Acta Part B At. Spectrosc. 2016, 115, 52–63. [Google Scholar] [CrossRef] [Scilit]
- Syvilay, D.; Wilkie-Chancellier, N.; Trichereau, B.; Texier, A.; Martinez, L.; Serfaty, S.; Detalle, V. Evaluation of the standard normal variate method for laser-induced breakdown spectroscopy data treatment applied to the discrimination of painting layers. Spectrochim. Acta Part B At. Spectrosc. 2015, 114, 38–45. [Google Scholar] [CrossRef] [Scilit]
- Guezenoc, J.; Gallet-Budynek, A.; Bousquet, B. Critical review and advices on spectral-based normalization methods for LIBS quantitative analysis. Spectrochim. Acta Part B At. Spectrosc. 2019, 160, 105688. [Google Scholar] [CrossRef] [Scilit]
- Martens, H.; Martens, M. Modified jack-knife estimation of parameter uncertainty in bilinear modelling by partial least squares regression (PLSR). Food Qual. Prefer. 2000, 11, 5–16. [Google Scholar] [CrossRef] [Scilit]
- Faber, N.M. Uncertainty estimation for multivariate regression coefficients. Chemom. Intell. Lab. Syst. 2002, 64, 169–179. [Google Scholar] [CrossRef] [Scilit]
- Mehmood, T.; Liland, K.H.; Snipen, L.; Sæbø, S. A review of variable selection methods in partial least squares regression. Chemom. Intell. Lab. Syst. 2012, 118, 62–69. [Google Scholar] [CrossRef] [Scilit]
- Kramida, A.; Ralchenko, Y. NIST Atomic Spectra Database, NIST Standard Reference Database 78; National Institute of Standards and Technology: Gaithersburg, MD, USA, 1999.
- Wang, Z.; Afgan, M.S.; Gu, W.; Song, Y.; Wang, Y.; Hou, Z.; Song, W.; Li, Z. Recent advances in laser-induced breakdown spectroscopy quantification: From fundamental understanding to data processing. TrAC Trends Anal. Chem. 2021, 143, 116385. [Google Scholar] [CrossRef] [Scilit]
- Karaman, İ.; Qannari, E.M.; Martens, H.; Hedemann, M.S.; Knudsen, K.E.B.; Kohler, A. Comparison of sparse and jack-knife partial least squares regression methods for variable selection. Chemom. Intell. Lab. Syst. 2013, 122, 65–77. [Google Scholar] [CrossRef] [Scilit]
- Senesi, G.S.; Harmon, R.S.; Hark, R.R. Field-portable and handheld laser-induced breakdown spectroscopy: Historical review, current status and future prospects. Spectrochim. Acta Part B At. Spectrosc. 2021, 175, 106013. [Google Scholar] [CrossRef] [Scilit]

Disclaimer/Publisher’s Note: The statements, opinions and data contained in all publications are solely those of the individual author(s) and contributor(s) and not of MDPI and/or the editor(s). MDPI and/or the editor(s) disclaim responsibility for any injury to people or property resulting from any ideas, methods, instructions or products referred to in the content. |
© 2026 by the authors. Licensee MDPI, Basel, Switzerland. This article is an open access article distributed under the terms and conditions of the Creative Commons Attribution (CC BY) license.