


Abstract
Hot-melt extrusion (HME) is widely used in pharmaceutical manufacturing; however, reliable analytical tools are required to simultaneously monitor drug content and excipient stability under thermal processing. In this study, a selective and robust HPLC–UV method was developed and validated for the concurrent determination of triamcinolone acetonide (TA) and triethyl citrate (TEC) in HME polymeric films and porcine buccal mucosa. Chromatographic separation was achieved on a C18 column using an acetonitrile–water mobile phase (30:70, v/v) at a flow rate of 0.6 mL min−1, with detection at 240 nm for TA and 210 nm for TEC. The method was validated for selectivity, linearity, precision, and accuracy, including selectivity assessment in the presence of mucosal extract and polymeric matrix components, and recovery of TA in porcine buccal mucosa. Excellent linearity was obtained over 0.20–12.5 µg mL−1 for TA and 4.5–30.0 µg mL−1 for TEC (r ≥ 0.998), with precision below 6.3% and TA recovery exceeding 94%. Application to extruded films confirmed uniform analyte distribution and enabled simultaneous monitoring of TA degradation and TEC loss under thermal stress. These results demonstrate that the proposed method is suitable for formulation development, process monitoring, and stability assessment of HME-based pharmaceutical systems.
1. Introduction
Hot-melt extrusion (HME) has emerged as a versatile and solvent-free manufacturing platform for pharmaceutical dosage forms, offering advantages such as continuous processing, scalability, and enhanced control over drug dispersion within polymeric matrices [1,2]. In recent years, HME has been increasingly explored for the development of advanced drug delivery systems, including buccal and mucosal systems [2]. Despite these advantages, the high temperatures and intense shear forces inherent to the extrusion process pose significant analytical challenges, particularly regarding the stability and quantitative determination of both active pharmaceutical ingredients and excipients after processing [3].
Extruded pharmaceutical systems are typically based on thermoplastic polymers (e.g., polyvinyl alcohol, polyvinylpyrrolidone–vinyl acetate copolymers, and cellulose derivatives) and require the incorporation of plasticizers to improve processability and to tailor the mechanical and physicochemical properties of the final product [4,5]. Eudragit® L100 (EL100), an anionic methacrylic acid copolymer, is commonly used as a polymeric matrix in HME systems due to its film-forming properties and suitability for controlled drug release in mucosal environments [6,7,8]. As the polymeric carrier in such systems, EL100 may also contribute to matrix-related analytical interference, reinforcing the need for methods capable of selectively quantifying analytes in its presence.
Triethyl citrate (TEC) is one of the most widely used plasticizers in pharmaceutical formulations due to its biocompatibility, low toxicity, and ability to reduce the polymer’s glass transition temperature, thereby enhancing the flexibility and adhesion of formulations [9,10,11]. However, TEC is a relatively volatile compound and may partially evaporate or redistribute during high-temperature processing, potentially altering formulation performance, mechanical integrity, and drug release behavior [12]. Consequently, monitoring of plasticizer content is as critical as drug quantification in hot-melt extruded systems. Nevertheless, analytical methods reported for TEC determination are scarce and are generally limited to single-analyte quantification [9,13,14].
In parallel, triamcinolone acetonide (TA) is a synthetic corticosteroid commonly incorporated into buccal delivery systems due to its high local anti-inflammatory activity and ability to reduce lesion recurrence in oral mucosal disorders [15,16,17]. However, from an analytical perspective, TA is a challenging compound to monitor in thermally processed systems, as it degrades under elevated temperatures, light exposure, and pH variation [2,12,18]. These factors become particularly relevant in hot-melt extruded formulations, where thermal and mechanical stress may alter drug integrity or alter its distribution within the polymeric matrix. Therefore, methods capable of quantifying TA in the presence of matrix components and excipients, especially when processed under thermal stress, are essential for accurately assessing drug content, stability, and formulation performance. In addition, when evaluated together with volatile excipients such as TEC, TA quantification becomes particularly dependent on methods capable of selectively monitoring compositional changes induced by thermal processing.
Given these complexities, from an analytical perspective, the development of buccal delivery systems based on HME requires robust and selective methods capable of quantifying both the drug and formulation excipients within complex polymeric and biological matrices. In addition, given the intended mucosal application, analytical evaluation in biological matrices becomes relevant, particularly for studies of drug retention, permeation, and local bioavailability. Although analytical methods have been reported for the determination of TA in mucosal tissues [19,20], these approaches are typically limited to single-analyte determination or simple matrices. Moreover, they do not address the analytical challenges associated with thermally processed polymeric systems such as those obtained by HME, nor do they enable the simultaneous evaluation of drug-excipient systems under these conditions. Moreover, no studies have reported the simultaneous determination of TA and TEC in HME-derived systems, nor have they evaluated them across both polymeric and biologically relevant matrices.
Therefore, this study aimed to develop and validate a robust, selective, and reliable HPLC–UV method for the simultaneous quantification of TA and TEC in HME systems. In addition, the method was designed to support TA quantification in mucosal tissue extracts, which are relevant for buccal retention, permeation, and local bioavailability studies. The method was validated according to international guidelines and applied to assess analyte distribution and thermally induced compositional changes under HME-relevant conditions, providing a valuable analytical tool for formulation development, process monitoring, and process-related stability assessment of thermally processed pharmaceutical delivery systems.
2. Materials and Methods
2.1. Materials and Reagents
Triamcinolone acetonide (TA, purity > 99.0%, lot TCA-BL2701/0620) was obtained from Symbiotica Specialty Ingredients Sdn. Bhd (Penang, Malaysia). Eudragit® L100 (EL100; methacrylic acid–methyl methacrylate copolymer, 1:1; lot B160703010) was kindly provided by Evonik Industries (Darmstadt, Germany). Triethyl citrate (TEC; lot S7425151) was purchased from Merck (Darmstadt, Germany). HPLC-grade acetonitrile (ACN) and methanol (MeOH) were obtained from J.T. Baker (Philipsburg, PA, USA). Ultrapure water was produced using a Milli-Q purification system (Millipore, Illkirch Graffenstaden, France). Porcine buccal mucosa was collected from a local slaughterhouse (Via Carnes, Formosa, Brazil) immediately after slaughter and transported to the laboratory under refrigerated conditions.
2.2. Preparation of Mucosa Extract
The adipose tissue layer was carefully removed from the porcine buccal mucosa using surgical scissors and a scalpel. Tissue fragments of approximately 3 cm2 were cut into small pieces and transferred to glass flasks containing 10 mL of ACN. The samples were stirred overnight at room temperature to promote the extraction of endogenous components. Subsequently, the extracts were filtered through 0.22 µm membrane filters and stored at 4 °C until analysis by HPLC–UV.
2.3. Preparation of Stock Solutions
Stock solutions of TA (100 µg mL−1) were prepared by dissolving 2.5 mg of the drug in 25 mL ACN. For TEC, aliquots of the liquid plasticizer were accurately weighed directly into 25 mL volumetric flasks using an analytical balance, and the corresponding masses were recorded prior to dilution to volume with MeOH. Subsequent dilutions were performed using ACN to obtain the desired concentrations. This gravimetric approach was adopted due to the viscous nature of TEC, which limits precise volumetric handling and ensures accurate and traceable concentration determination. A stock solution of EL100 (100 µg mL−1) was prepared by dissolving 2.5 mg of the polymer in 25 mL of MeOH and further diluted as described for TEC. All solutions were prepared in an ultrasonic bath (approximately 15 min of sonication) and used immediately after preparation.
2.4. Instrumentation and Analytical Conditions
Chromatographic analyses were performed using a high-performance liquid chromatography (HPLC) system (LC-20AT, Shimadzu, Kyoto, Japan) equipped with an autosampler (SIL-20AD), a column oven (CTO-20AS), and a diode-array detector (SPD-M20A). Data acquisition and processing were carried out using LabSolutions software (version 5.99, Shimadzu). Separations were achieved on a C18 reversed-phase column (150 × 4.6 mm, 5 µm; Discovery®, Sigma-Aldrich, St. Louis, MO, USA). Detection wavelengths were set at 240 nm for TA and 210 nm for TEC, corresponding to the maximum absorption of each compound in the UV spectrum [13,21].
2.5. Chromatographic Method Validation
The HPLC–UV method was developed and validated for the simultaneous quantification of TA and TEC in the presence of mucosal extract and EL100. Validation parameters included selectivity, linearity, limits of detection (LOD) and quantification (LOQ), precision, and accuracy, in accordance with the International Council for Harmonization (ICH) Q2 (R2) guidelines [22].
2.5.1. System Suitability
System suitability was evaluated to ensure adequate chromatographic performance and reproducibility. Standard solutions containing TA at 7.5 µg mL−1 and TEC at 22.5 µg mL−1 were prepared as previously described and injected in sextuplicate to verify system precision and data integrity [23,24,25,26]. The evaluated parameters included retention time (RT), peak area repeatability (%RSD), tailing factor (TF), resolution (Rs), theoretical plate count (N), and capacity factor (k′) [23,26]. The capacity factor was calculated using the mean retention times and the column hold-up time (t0), which was estimated from column geometry and mobile phase flow rate, assuming a typical porosity factor for packed reversed-phase columns [23,27].
2.5.2. Selectivity
Selectivity was evaluated to assess the proposed HPLC–UV method’s ability to accurately quantify TA and TEC in the presence of potential interferents, including mucosal components and the polymeric matrix. Individual solutions of TA and TEC were prepared at nominal concentrations of 7.5 and 22.5 µg mL−1, respectively. To assess interference from mucosal constituents, the final volume of each solution was completed with mucosa extract. Polymer interference was evaluated by spiking TA or TEC solutions with EL100 at 45 µg mL−1, corresponding to its relative proportion in the TA/TEC/EL100 (10:30:60, m/m) formulation. Additionally, mixed solutions containing TA and TEC at a fixed 1:3 (v/v) ratio were prepared to mimic the formulation composition. All experiments were performed in triplicate, and chromatograms were evaluated for peak purity, retention time reproducibility, and absence of co-eluting peaks. The chromatographic profiles were plotted using OriginPro 2023b software (Origin-LabCorp, Northampton, MA, USA).
2.5.3. Linearity
Linearity was evaluated by constructing calibration curves relating analyte concentration to detector response. Calibration solutions were prepared in triplicate by diluting the stock solutions with ACN, maintaining a fixed TA/TEC ratio of 1:3 (v/v). The evaluated concentration ranges were 0.20–12.5 µg mL−1 for TA and 4.5–30.0 µg mL−1 for TEC. Calibration curves were obtained by plotting peak area versus analyte concentration, and linear regression analysis was performed. The slope and intercept were evaluated using a t-test (α = 0.05). The residues were calculated as the difference between the theoretical and experimental values obtained from the regression curve and were evaluated to verify the absence of systematic deviations throughout the calibration range.
2.5.4. Limit of Detection (LOD) and Limit of Quantification (LOQ)
The limits of detection (LOD) and quantification (LOQ) were determined according to ICH Q2 (R2) guidelines, based on the standard deviation of the response (σ) obtained from the linear calibration curve and the slope (S) of the regression, using Equations (1) and (2).
2.5.5. Precision
Precision was evaluated as repeatability (intra-day precision) and intermediate precision (inter-day precision). Repeatability was assessed using six replicates at the nominal concentrations of TA (7.5 µg mL−1) and TEC (22.5 µg mL−1). Intermediate precision was evaluated on two different days by two independent analysts at three concentration levels (5.0/15.0, 7.5/22.5, and 10.0/30.0 µg mL−1, TA/TEC, 1:3 v/v). Precision results were expressed as the coefficient of variation (CV) [22].
2.5.6. Accuracy
Accuracy was evaluated through recovery studies of TA spiked into porcine buccal mucosa at three concentrations (5.0, 7.5, and 10.0 µg mL−1). Known volumes of TA solutions were added to mucosal tissue fragments, and the solvent was allowed to evaporate overnight. Subsequently, ACN was added to reach the target concentrations, followed by stirring and sonication (≈15 min) to promote extraction. After filtration, samples were analyzed by the validated HPLC–UV method, and recovery percentages were calculated by comparing measured and nominal concentrations [28].
2.5.7. Robustness
Method robustness was evaluated by introducing small deliberate variations in critical chromatographic parameters to assess the reliability of the proposed HPLC–UV method under minor operational changes [22,29]. Standard solutions containing TA (7.5 µg mL−1), TEC (22.5 µg mL−1), and a TA/TEC, 1:3 (v/v), were analyzed in triplicate (n = 3) under modified chromatographic conditions. The evaluated variations included ±1.5% changes in mobile-phase composition and flow rate, and ±1 °C changes in column temperature. The lower condition corresponded to ACN–water (29.5:70.5, v/v), flow rate of 0.59 mL min−1, and column temperature of 34 °C, while the upper condition consisted of ACN–water (30.5:69.5, v/v), flow rate of 0.61 mL min−1, and column temperature of 36 °C. Chromatographic performance was assessed based on retention time (RT), tailing factor (TF), resolution (Rs), theoretical plate count (N), and PDA peak purity analysis [23,26].
2.6. Application of the Developed HPLC-UV Method
The applicability of the validated method was demonstrated using hot-melt extruded samples composed of TA/TEC/EL100 (10:30:60, m/m), processed at 180 °C and 65 rpm. HME samples were accurately weighed, dissolved in MeOH, sonicated (≈15 min), and diluted with ACN before analysis. A forced degradation study was conducted by exposing the samples to thermal stress at 180 °C for predetermined time intervals (0.5–4 h). Following exposure, samples were prepared and analyzed as described above.
3. Results and Discussion
3.1. Optimization of Analytical Conditions
TA is known to be susceptible to photodegradation, particularly in protic organic solvents such as methanol, which may promote hydrogen bonding and accelerate degradation pathways [30,31]. Therefore, an aprotic solvent is recommended to minimize chemical instability during sample preparation. In this study, ACN, an aprotic solvent with low hydrogen-donor capacity and high solubilization efficiency for TA, was selected for the preparation of stock and working solutions. This choice ensured chemical stability of the analyte throughout the analytical procedure. In contrast, stock solutions of TEC were prepared in methanol to facilitate initial solubilization, then diluted with ACN to obtain the desired working concentrations.
As the primary objective of this study was the simultaneous quantification of TA and TEC in hot-melt extruded polymeric samples, initial chromatographic conditions were selected based on previously reported methods for the individual determination of these compounds [32,33]. Preliminary experiments were conducted under isocratic conditions using an ACN–water mobile phase (40:60, v/v). The flow rate was 0.7 mL min−1, with an injection volume of 10 µL and a column temperature of 35 °C.
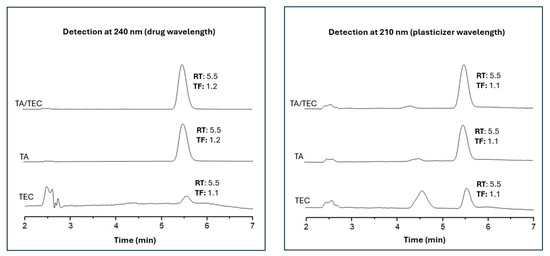
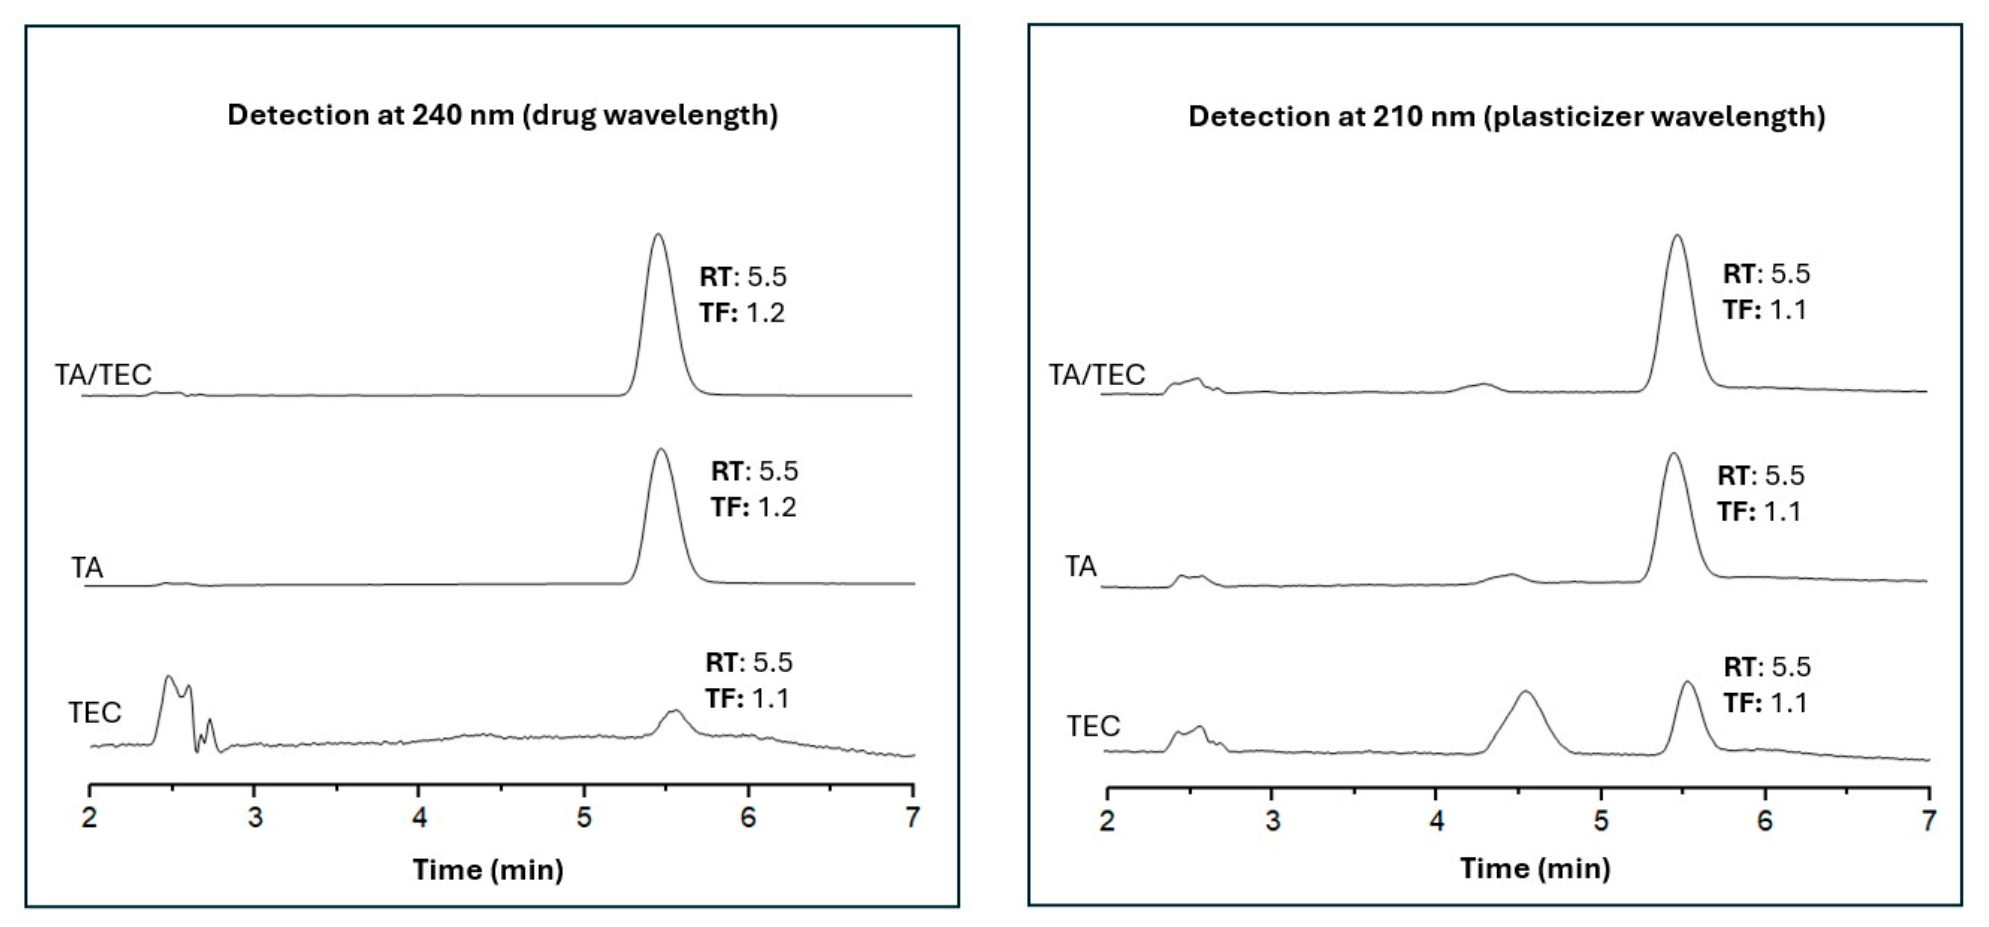
Under these initial conditions, chromatographic separation of TA and TEC was inadequate (Figure 1). When analyzed individually and as a mixture (TA/TEC, 1:3 v/v), both compounds exhibited overlapping or closely eluting peaks at the detection wavelengths of 240 nm and 210 nm. At 240 nm, TEC eluted at a retention time like that of TA. At 210 nm, TA produced a detectable signal that overlapped with the TEC peak. This behavior is attributed to insufficient resolution under the selected mobile phase conditions. In these conditions, analyte retention is strongly influenced by mobile phase strength, which directly affects peak separation and signal intensity in reversed-phase systems [34,35]. As a result, partial coelution was observed. This indicated mutual interference between the analytes and raised concerns regarding selectivity and quantitative reliability. Consequently, further optimization of chromatographic parameters was required to achieve adequate resolution and ensure accurate simultaneous quantification.
Figure 1.
Chromatograms of TEC, TA, and TA/TEC mixture (1:3, v/v) detected at 240 nm (drug wavelength) and 210 nm (plasticizer wavelength) obtained using ACN and water (40:60, v/v), flow rate of 0.7 mL min−1, at 35 °C. The hidden Y-axis represents detector response in arbitrary intensity units (mAU). TA: triamcinolone acetonide; TEC: triethyl citrate; RT: retention time (min); TF: tailing factor.
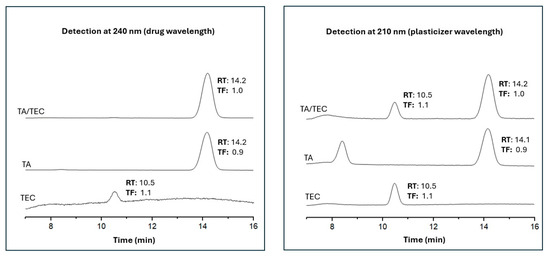
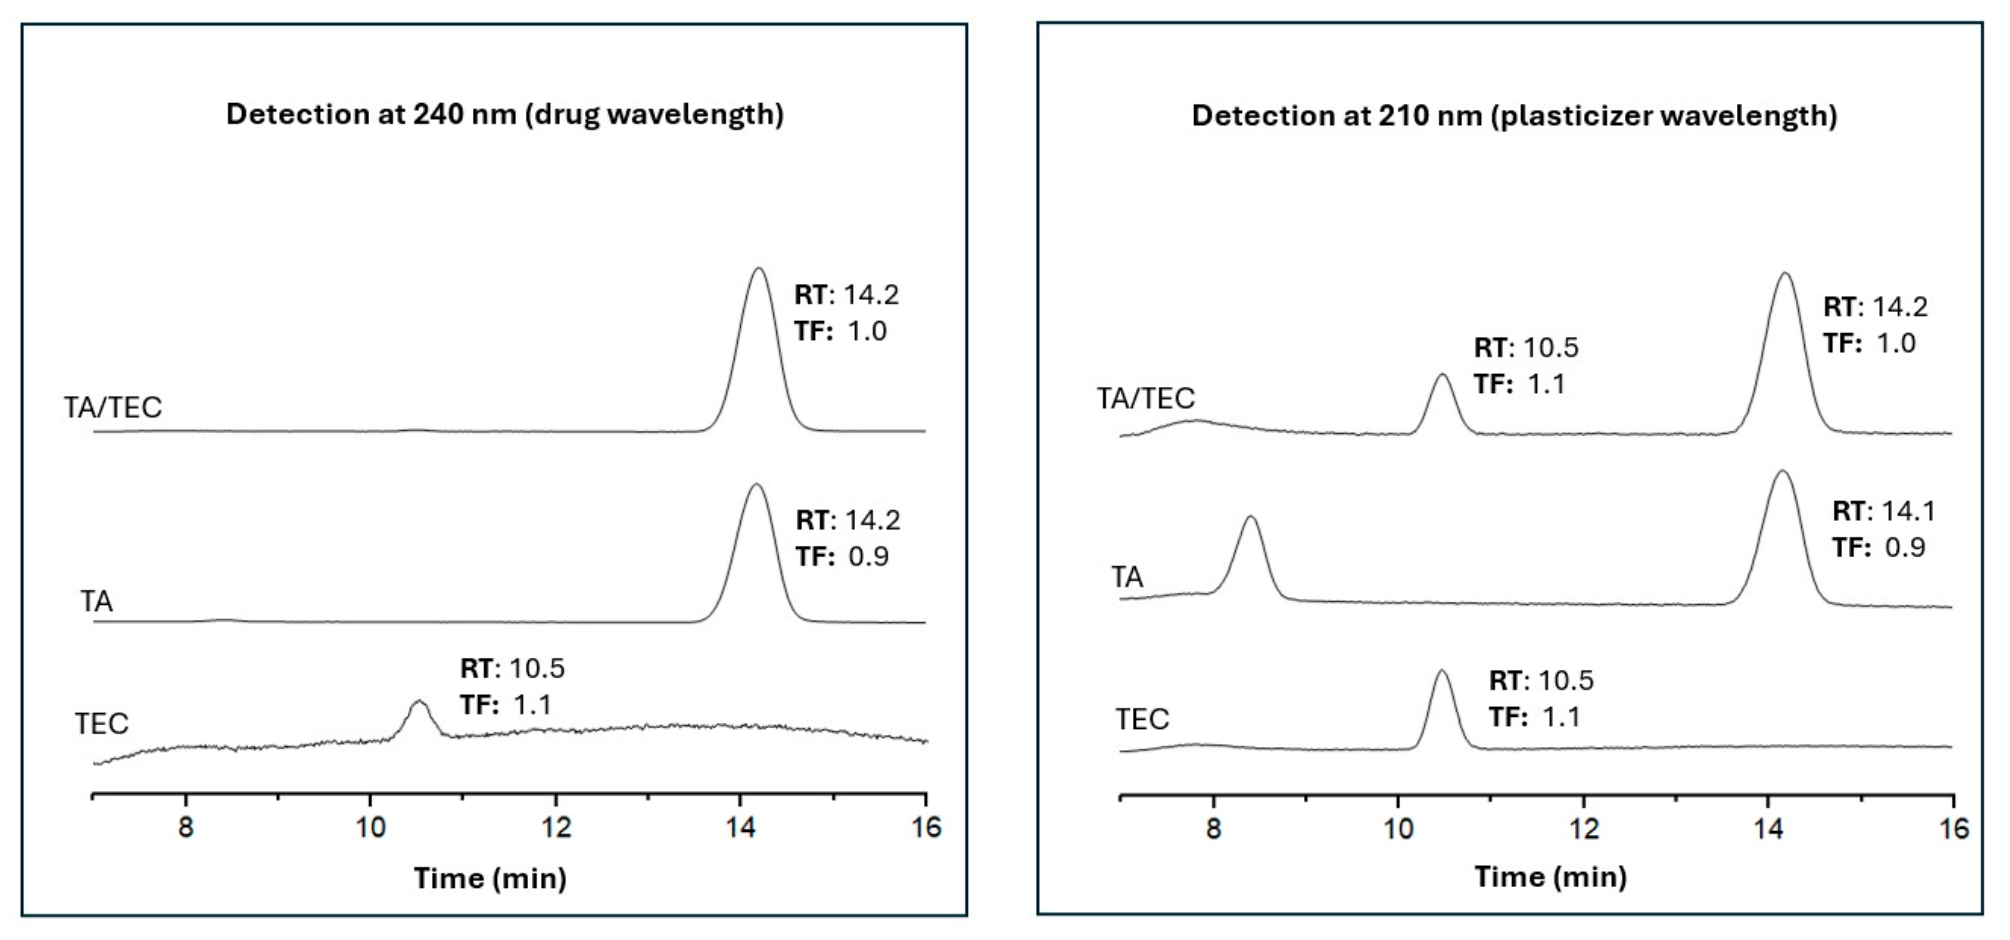
Method optimization focused primarily on adjusting the mobile phase composition and flow rate to improve chromatographic resolution. The optimized conditions consisted of an ACN–water mobile phase (30:70, v/v) delivered at a flow rate of 0.6 mL min−1. Under these conditions, well-resolved and symmetrical peaks were obtained for both analytes, with TEC eluting at 10.5 min and TA at 14.2 min, regardless of the detection wavelength (Figure 2). Although TA exhibited a minor response at 210 nm, its signal intensity was negligible compared to that observed at 240 nm, confirming wavelength selectivity. At 210 nm, additional low-intensity signals associated with nonspecific matrix absorption may be observed due to the reduced spectral selectivity at lower UV wavelengths; however, these signals did not interfere with analyte quantification under the validated chromatographic conditions. In addition, tailing factors for both analytes were below 1.5, indicating satisfactory peak symmetry and column performance [36]. The total runtime was set at 17 min to ensure complete elution of the analytes and adequate column washout. Blank injections (ACN) performed between sample sequences confirmed the absence of carryover and supported the selected runtime.
Figure 2.
Chromatograms of TEC, TA, and TA/TEC mixture (1:3, v/v) detected at 240 nm (drug wavelength) and 210 nm (plasticizer wavelength) obtained using ACN and water (30:70, v/v), flow rate of 0.6 mL min−1, at 35 °C. The hidden Y-axis represents detector response in arbitrary intensity units (mAU). TA: triamcinolone acetonide; TEC: triethyl citrate; RT: retention time (min); TF: tailing factor.
To further support selectivity, peak purity was assessed using PDA detection across representative matrices (standard solutions, HME samples, and mucosa-based samples). For TA, purity index values ranged from 0.001 to 0.115, while TEC values (standard solutions) ranged from 0.004 to 0.739, all below the acceptance threshold of 1.0. These results confirm spectral homogeneity of the analyte peaks and the absence of co-eluting interferences under the optimized conditions [37,38]. These findings demonstrate that the optimized chromatographic conditions were suitable for the selective and reliable simultaneous quantification of TA and TEC.
3.2. System Suitability
System suitability was assessed to confirm adequate chromatographic performance and reproducibility [23,24]. The obtained k′ values were 4.08 for TA and 2.75 for TEC. These values indicate adequate analyte retention and comply with the common criterion of k′ > 2 for robust chromatographic methods [23,26].
Peak symmetry was satisfactory. The tailing factors were close to unity (TA: 0.95 ± 0.01; TEC: 1.09 ± 0.04) and within the acceptance range of 0.9–2.0 [23,24]. High column efficiency was observed, with theoretical plate counts of approximately 4900 for TA and 6300 for TEC. These exceeded the minimum requirement of N > 2000 and more stringent values reported in the literature [25,39].
In addition, resolution values remained consistently above 1.5, confirming effective chromatographic separation for quantitative analysis [23,40]. Injection repeatability demonstrated excellent precision for TA (%RSD = 0.55%) and acceptable precision for TEC (%RSD = 3.14%). The slightly higher variability observed for TEC is likely associated with detection at 210 nm, a wavelength more susceptible to baseline noise and reduced signal stability [26,34].
3.3. Chromatographic Method Validation
3.3.1. Selectivity
Selectivity is a critical parameter in method validation, as it reflects the ability of the analytical method to unequivocally quantify the analyte of interest in the presence of matrix components, excipients, and potential interferents [29]. In this study, selectivity was evaluated not only for the simultaneous determination of TA and TEC but also in the presence of the polymeric matrix (EL100) and mucosal extract. While chromatographic resolution and spectral purity were established during method optimization, this section focuses on confirming method performance under complex sample conditions.
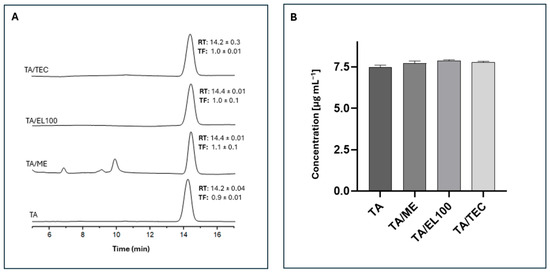
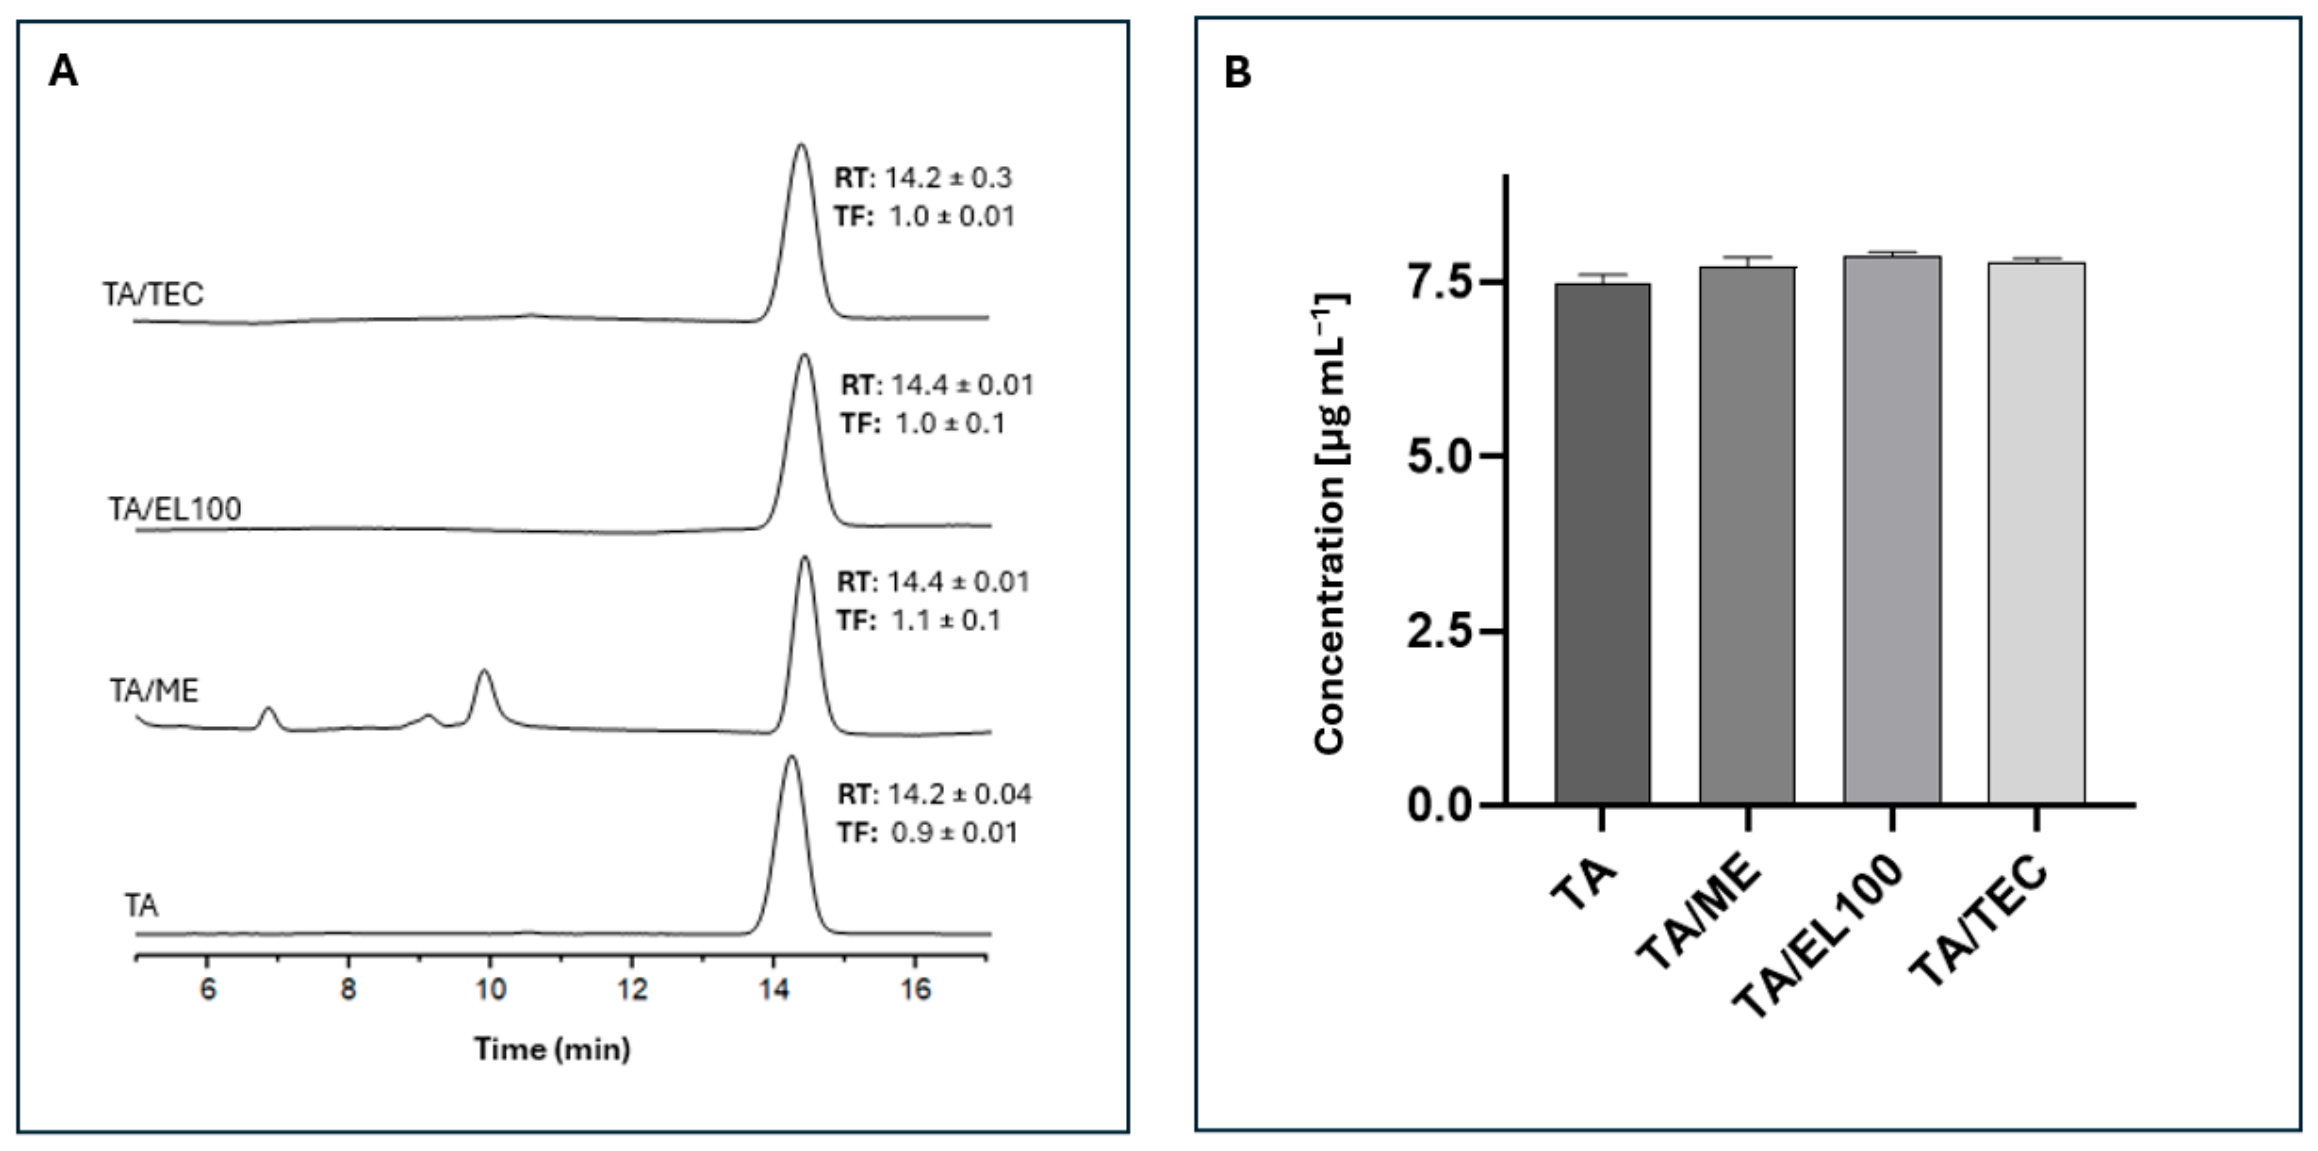
For TA, complete chromatographic separation from TEC, EL100, and mucosal extract components was achieved under the optimized conditions (Figure 3). Endogenous mucosal constituents eluted within the first 10 min of the run. TA showed consistent retention times from 14.2 to 14.4 min across all tested conditions. The measured TA concentrations in samples with potential interferents did not differ significantly from those for TA alone. This confirmed that the analytical response was unaffected by matrix components.
Figure 3.
(A) Representative chromatograms from the selectivity assay for TA at 240 nm, analyzed alone and in the presence of potential interferents, including ME, EL100, and TEC. The hidden Y-axis represents detector response in arbitrary intensity units (mAU). (B) TA concentration in the presence of interferents. TA: triamcinolone acetonide; ME: mucosal extract; EL100: Eudragit® L100; TEC: triethyl citrate; RT: retention time (min); TF: tailing factor. Values are expressed as mean ± standard deviation for each sample.
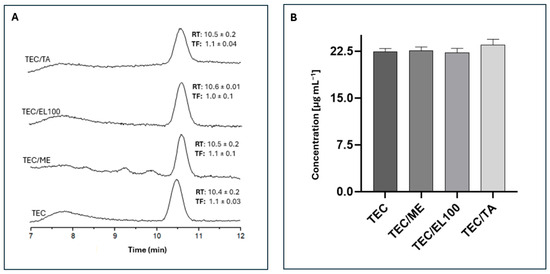
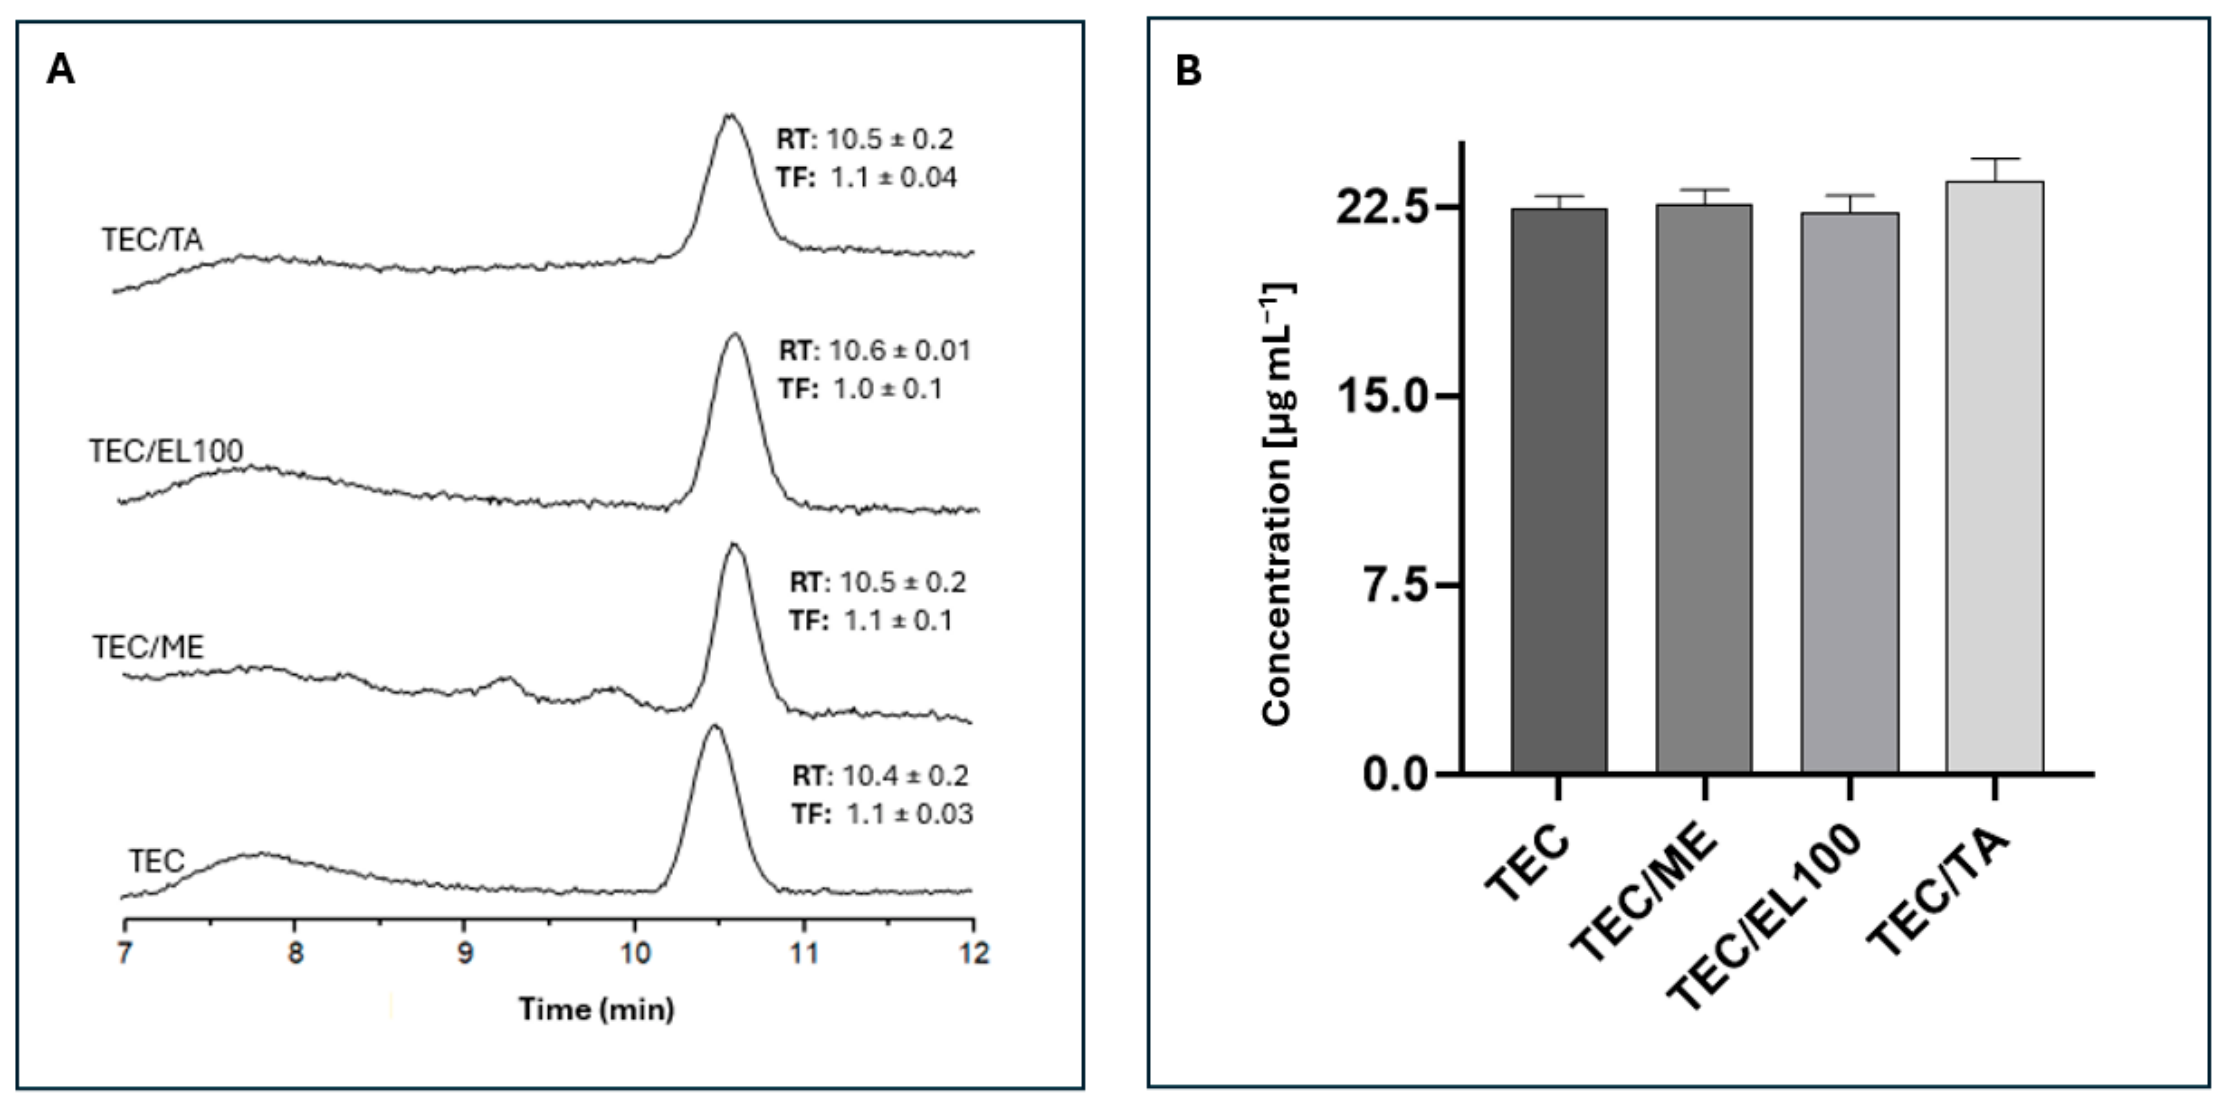
Similarly, the chromatographic selectivity for TEC was confirmed in the presence of TA, EL100, and mucosal extract (Figure 4). TEC exhibited stable retention times of 10.4–10.6 min, with no coeluting peaks or peak distortion. The presence of the drug, polymeric matrix, or biological extract did not affect peak shape or quantitative response. In addition, TEC concentrations measured in the presence of potential interferents were statistically equivalent to those obtained from isolated TEC solutions.
Figure 4.
(A) Representative chromatograms from the selectivity assay for TEC at 210 nm, analyzed alone and in the presence of potential interferents, including ME, EL100, and TA. The hidden Y-axis represents detector response in arbitrary intensity units (mAU). (B) TEC concentration in the presence of interferents. TA: triamcinolone acetonide; ME: mucosal extract; EL100: Eudragit® L100; TEC: triethyl citrate; RT: retention time (min); TF: tailing factor. Values are expressed as mean ± standard deviation for each sample.
Across all chromatograms, tailing factors (TF) for both TA and TEC were within the ideal range of 0.8–1.5 (Figure 3A and Figure 4A). This confirmed the symmetry of analyte peaks and robustness of the system under all tested conditions [36]. With the peak purity results from above, these findings confirm that the method provides selective, interference-free quantification of both analytes in complex polymeric and biological matrices. The absence of significant matrix effects, evidenced by consistent analytical responses and recoveries across matrices, indicates that reliable quantification is possible without an internal standard under the proposed conditions.
3.3.2. Linearity
Excellent linearity was observed for both TA and TEC over the evaluated concentration ranges. Calibration curves for TA (0.20–12.5 µg mL−1) and TEC (4.5–30.0 µg mL−1) had correlation coefficients of 0.999 and 0.998. Both exceeded the minimum criterion of 0.99. Linear regression analysis showed a strong proportional relationship between analyte concentration and detector response. The residuals were randomly distributed, with no evidence of systematic deviation. In both cases, the slopes of the calibration curves differed significantly from zero.
The resulting regression equations were y = 32,708.0 x − 4709.1 for TA and y = 1049.1 x − 1155.3 for TEC, where y represents the detector response and x the analyte concentration in µg mL−1. These results confirm the suitability of the method for quantitative analysis of TA and TEC across the concentration ranges relevant to formulation and stability studies.
3.3.3. LOD and LOQ
The LOD and LOQ obtained for TA (0.05 and 0.16 µg mL−1, respectively) and TEC (0.06 and 0.18 µg mL−1, respectively) demonstrate the high sensitivity of the developed method, enabling the detection and quantification of low analyte levels in polymeric and biological matrices, even under conditions involving partial degradation or excipient loss. The standard deviation of the response (σ) obtained from the linear regression was 403.27 for TA and 472.94 for TEC, supporting a statistically robust estimate of method sensitivity in accordance with ICH recommendations. Indeed, although numerous analytical methods have been reported for TA determination in complex matrices, many remain limited by matrix-induced signal suppression [41]. The sensitivity achieved in the present study is comparable to that reported for conventional HPLC–UV methods for TA determination, while additionally enabling the simultaneous quantification of TEC in thermally processed polymeric systems, which remains scarcely explored in the literature [13,14,41]. No significant matrix effect on analyte sensitivity was observed, as evidenced by consistent quantification performance in the presence of mucosal extract and polymeric components.
For TEC, the low LOQ supports the method’s usefulness during dissolution studies. It allows evaluation of plasticizer leaching from the formulation or interactions with biological substrates, factors that could impact system performance [10]. These findings confirm the method’s sensitivity and robustness for simultaneous quantification of TA and TEC in HME-based pharmaceutical systems.
3.3.4. Precision
The method precision was confirmed through repeatability and intermediate precision studies (Table 1). Repeatability assays conducted at the nominal concentrations of TA and TEC resulted in coefficients of variation below 1.67%, indicating excellent short-term precision. Intermediate precision, evaluated across different days and analysts, yielded CV values below 6.26% for all tested concentration levels. These values are well within the acceptance limits recommended for bioanalytical methods, confirming the method reproducibility and robustness under routine laboratory conditions.
Table 1.
Repeatability and intermediate precision of the developed HPLC-UV method for the simultaneous quantification of triamcinolone acetonide (TA) and triethyl citrate (TEC) (1:3, v/v). TC: theoretical concentration (µg mL−1); EC: experimental concentration (µg mL−1); CV: coefficient of variation (%). Values are expressed as mean ± standard deviation for each sample.
3.3.5. Accuracy
Accuracy was evaluated through recovery studies of TA spiked into porcine buccal mucosa, a complex biological matrix that closely resembles the intended site of application of the formulation. The assessment of accuracy in biological tissues is particularly challenging due to potential analyte–matrix interactions, including adsorption to tissue components, partitioning into lipid domains, and incomplete extraction, which may lead to underestimation of the true analyte concentration [42].
In the present study, the extraction protocol was designed to balance efficient analyte recovery with chemical stability, avoiding harsh conditions that could promote corticosteroid degradation or the co-extraction of interfering endogenous compounds. The combination of mechanical agitation and sonication facilitated solvent penetration into the tissue matrix and enhanced analyte desorption without compromising chromatographic selectivity. Given these constraints, the accuracy assessment focused on TA as the active pharmaceutical ingredient. In contrast, TEC, being a volatile liquid, showed low and inconsistent recovery during method development, attributed to co-evaporation during sample preparation. Therefore, TEC was not included in the accuracy assessment.
Recovery values ranged from 94.2 ± 1.2% to 96.3 ± 0.6% across the evaluated concentration levels, demonstrating both high accuracy and low variability (Table 2). These results indicate that the extraction procedure was sufficiently robust to overcome matrix effects commonly observed in mucosal tissues while preserving analyte integrity. Moreover, the low coefficients of variation observed confirm the reproducibility of the recovery process and the absence of significant systematic bias.
Table 2.
Accuracy of the developed HPLC-UV method for the recovery of triamcinolone acetonide (TA) from porcine mucosal tissue. TC: theoretical concentration (µg mL−1); MC: measured concentration (µg mL−1); CV: coefficient of variation (%). Values are expressed as mean ± standard deviation for each sample.
Overall, the accuracy data demonstrate that the developed HPLC–UV method provides reliable quantification of TA in biological substrates relevant to buccal drug delivery. The high and consistent recovery values, combined with the mild extraction conditions employed, support the suitability of the method for bioanalytical applications involving polymeric formulations and mucosal tissues, including permeation, retention, and stability studies.
3.3.6. Robustness
Robustness evaluation demonstrated that small deliberate variations in mobile phase composition, flow rate, and column temperature did not significantly affect chromatographic performance or analyte selectivity [22,26]. Representative chromatographic parameters obtained under modified conditions are summarized in Table 3.
Table 3.
Robustness evaluation of the proposed HPLC–UV method under deliberate variations in chromatographic conditions (±1.5%). Triamcinolone acetonide (TA, 7.5 µg mL−1) was analyzed at 240 nm, while triethyl citrate (TEC, 22.5 µg mL−1) was analyzed at 210 nm, either individually or as a TA:TEC mixture (1:3, v/v). The evaluated chromatographic variations consisted of ACN–water (29.5:70.5 and 30.5:69.5, v/v), flow rates of 0.59 and 0.61 mL min−1, and column temperatures of 34 and 36 °C. Values are expressed as mean ± standard deviation (n = 3). RT: retention time (min); TF: tailing factor; Rs: resolution; N: theoretical plate count.
As expected for reversed-phase chromatography, slightly longer retention times were observed under the lower chromatographic condition (−1.5%) due to the reduced mobile phase strength and lower flow rate, whereas the upper condition (+1.5%) promoted earlier analyte elution [27,42]. However, these variations did not compromise chromatographic separation or analyte detection. Under all evaluated conditions, tailing factors remained close to unity, indicating preservation of peak symmetry and stable column performance within the recommended acceptance range of 0.9 to 2.0 [23,24,26].
In addition, resolution values consistently remained substantially above the minimum acceptance criterion for quantitative analysis (Rs > 1.5), confirming effective separation between TA and TEC even after deliberate variation of chromatographic parameters [23,26,40]. High column efficiency was also maintained throughout the robustness assay, with theoretical plate counts consistently exceeding 5000 [23,39]. PDA peak purity analysis further confirmed the method’s selectivity under the modified conditions, with all purity indices remaining below the acceptance threshold [18,26]. These results indicate preservation of analyte spectral homogeneity and absence of co-eluting interferences despite the chromatographic variations introduced. Overall, the obtained findings demonstrate that the proposed HPLC–UV method is robust within the evaluated experimental range and suitable for routine simultaneous quantification of TA and TEC in thermally processed polymeric systems.
3.4. Application of the HPLC-UV Method
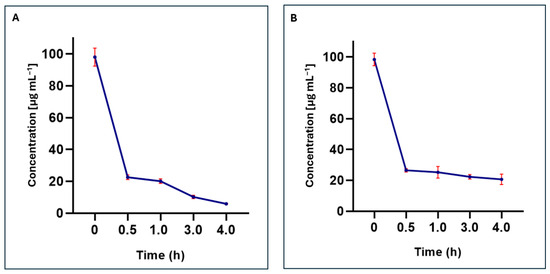
The practical applicability of the validated HPLC–UV method was demonstrated by its use in the quantitative analysis of HME samples containing TA, TEC, and EL100 (10:30:60, m/m). Analysis of freshly extruded samples (time zero) revealed a uniform distribution of both analytes within the polymeric matrix. Measured contents were 98.1 ± 5% for TA and 98.4 ± 11% for TEC, both relative to their theoretical values.
These results indicate efficient dispersion of the drug and plasticizer during extrusion and confirm the suitability of the developed method for the determination of both analytes in thermally processed polymeric systems. Importantly, the method provided consistent quantification of both components despite their differing chemical nature and detection wavelengths.
To further evaluate the method’s performance under stress conditions relevant to pharmaceutical processing, a forced degradation study was conducted. The extruded samples were exposed to thermal treatment at 180 °C for predetermined time intervals. This temperature was selected based on the processing conditions employed during extrusion and the known evaporation range of TEC. Following thermal exposure, a pronounced decrease in peak areas was observed for both analytes. This change corresponded to degradation or loss exceeding 75% after 0.5 h (Figure 5). Although both analytes showed similar reduction profiles over time, the underlying mechanisms are distinct. The reduction for TA is associated with thermal degradation, while loss of TEC is predominantly due to volatilization during prolonged exposure to processing temperature.
Figure 5.
Thermal stress-induced compositional changes in hot-melt extruded samples composed of TA/TEC/EL100 (10:30:60, m/m): (A) degradation profile of triamcinolone acetonide (TA) and (B) loss profile of triethyl citrate (TEC) during prolonged exposure to 180 °C. Detection was performed at 240 nm for TA and 210 nm for TEC. The results demonstrate the applicability of the developed HPLC–UV method for simultaneously monitoring drug degradation and plasticizer loss under thermally relevant HME processing conditions.
These findings reflect the combined effects of TA thermal degradation and TEC volatilization and demonstrate the method’s sensitivity in detecting compositional changes within the formulation.
Notably, the developed HPLC–UV method enabled simultaneous monitoring of drug degradation and plasticizer loss in a single analytical run. This provides valuable insight into formulation stability under thermal stress. The thermal stress study was designed to simulate prolonged exposure to the processing temperature employed during HME. It was not intended to establish comprehensive degradation kinetics or a stability-indicating profile. This capability is relevant for hot-melt extruded delivery systems, where changes in plasticizer content may impact mechanical properties, drug release, and product performance. Therefore, beyond routine quantification, the proposed method is a useful analytical tool for formulation optimization and for assessing process control in HME-based pharmaceutical systems.
4. Conclusions
A selective and reliable chromatographic method was developed and validated for the simultaneous quantification of TA and TEC in hot-melt extruded polymeric samples. The method met the established validation criteria for linearity, precision, accuracy, sensitivity, and selectivity in the presence of polymeric and biological matrices. It enabled the simultaneous determination of both analytes and the monitoring of drug degradation and plasticizer loss under thermally relevant processing conditions. Overall, the proposed method may serve as a useful analytical approach for evaluating analyte stability and compositional changes in hot-melt extruded polymeric systems.
Author Contributions
P.A.G.: Formal analysis, Investigation, Methodology, Writing—Original Draft. L.L.S.-B.: Methodology, Funding acquisition. T.G.: Funding Acquisition, Writing—Review and Editing. G.M.G.: Methodology, Writing—Review and Editing. I.P.G.: Conceptualization, Supervision, Formal analysis. M.C.-F.: Conceptualization, Supervision, Writing—Review and Editing. All authors have read and agreed to the published version of the manuscript.
Funding
Financiadora de Estudos e Projetos (FINEP)—Finance code: 0102/21; Fundação de Apoio à Pesquisa do Distrito Federal (FAPDF)—Finance code: 00193-00001913/2024-72 and Edital 01/2026; and University of Brasilia—Edital nº 001/2026 DPI/BCE/UnB.
Data Availability Statement
The data presented in this study are available in this article.
Acknowledgments
The authors thank the “Via Carnes” slaughterhouse for gently providing porcine skin.
Conflicts of Interest
The authors declare no conflicts of interest.
Abbreviations
The following abbreviations are used in this manuscript:
| HME | Hot-melt extrusion |
| TA | Triamcinolone acetonide |
| TEC | Triethyl citrate |
| EL100 | Eudragit® L100 |
| ACN | Acetonitrile |
| MeOH | Methanol |
| HPLC | High-performance liquid chromatography |
| k′ | Capacity factor |
| %RSD | Peak area repeatability |
| Rs | Resolution |
| N | Theoretical plate count |
| LOD | Limit of detection |
| LOQ | Limit of quantification |
| ICH | International conference of harmonization |
| CV | Coefficient of variation |
| RT | Retention time |
| TF | Tailing factor |
| ME | Mucosal extract |
| TC | Theoretical concentration |
| EC | Experimental concentration |
| MC | Measured concentration |
References
- Malaquias, L.F.B.; Schulte, H.L.; Chaker, J.A.; Karan, K.; Durig, T.; Marreto, R.N.; Gratieri, T.; Gelfuso, G.M.; Cunha-Filho, M. Hot melt extrudates formulated using design space: One simple process for both palatability and dissolution rate improvement. J. Pharm. Sci. 2018, 107, 286–296. [Google Scholar] [CrossRef]
- Patil, H.; Vemula, S.K.; Narala, S.; Lakkala, P.; Munnangi, S.R.; Narala, N.; Jara, M.O.; Williams, R.O.; Terefe, H.; Repka, M.A. Hot-Melt Extrusion: From Theory to Application in Pharmaceutical Formulation—Where Are We Now? AAPS PharmSciTech 2024, 25, 25–37. [Google Scholar] [CrossRef]
- Lima, A.L.; Gross, I.P.; de Sá-Barreto, L.L.; Gratieri, T.; Gelfuso, G.M.; Cunha-Filho, M. Extrusion-based systems for topical and transdermal drug delivery. Expert Opin. Drug Deliv. 2023, 20, 979–992. [Google Scholar] [CrossRef] [PubMed]
- Granados, P.A.; Pinho, L.A.G.; Sa-Barreto, L.L.; Gratieri, T.; Gelfuso, G.M.; Cunha-Filho, M. Application of hot-melt extrusion in the complexation of naringenin with cyclodextrin using hydrophilic polymers. Adv. Powder Technol. 2022, 33, 103380. [Google Scholar] [CrossRef]
- Bedogni, G.R.; Lima, A.L.; Gross, I.P.; Menezes, T.P.; Talvani, A.; Cunha-Filho, M.; Salomon, C.J. 3D-Printed Tablets of Nifurtimox: In Vitro and In Vivo Anti-Trypanosoma cruzi Studies. Pharmaceutics 2025, 17, 80. [Google Scholar] [CrossRef]
- Ao, F.; Shen, W.; Ge, X.; Wang, L.; Ning, Y.; Ren, H.; Fan, G.; Huang, M. Effects of the crystallinity on quercetin loaded the Eudragit L-100 electrospun nanofibers. Colloids Surf. B Biointerfaces 2020, 195, 111264. [Google Scholar] [CrossRef]
- Cardoso, A.M.L.; Oliveira, E.E.; Machado, B.A.S.; Marcelino, H.R. Eudragit®-based nanoparticles for controlled release through topical use. J. Nanoparticle Res. 2023, 25, 32. [Google Scholar] [CrossRef]
- Dos Santos, J.; Da Silva, G.S.; Velho, M.C.; Beck, R.C.R. Eudragit®: A versatile family of polymers for Hot Melt Extrusion and 3D Printing processes in pharmaceutics. Pharmaceutics 2021, 13, 1424. [Google Scholar] [CrossRef]
- Bohorquez, W.F.; Osorio-Pascuas, O.M.; Santaella, M.A.; Orjuela, A. Homogeneous and heterogeneous catalytic kinetics in the production of triethyl citrate. Ind. Eng. Chem. Res. 2020, 59, 19203–19211. [Google Scholar] [CrossRef]
- Bodmeier, R.; Paeratakul, O. Determination of plasticizers commonly used in pharmaceutical dosage forms by High Performance Liquid Chromatography. J. Liq. Chromatogr. 1991, 14, 365–375. [Google Scholar] [CrossRef]
- Panzade, P.; Wang, J.; Wang, Y. A gas chromatographic analysis method development and validation for determination of common plasticizers in delayed release tablet dosage forms. J. Anal. Pharm. Res. 2019, 8, 209–212. [Google Scholar] [CrossRef][Green Version]
- Granados, P.A.; Gross, I.P.; Medeiros-Souza, P.; Sá-Barreto, L.L.; Gelfuso, G.M.; Gratieri, T.; Cunha-Filho, M. Application of Theoretical Solubility Calculations and Thermal and Spectroscopic Measurements to Guide the Processing of Triamcinolone Acetonide by Hot-Melt Extrusion. Pharmaceutics 2025, 17, 586. [Google Scholar] [CrossRef]
- Bruce, L.D.; Shah, N.H.; Waseem Malick, A.; Infeld, M.H.; McGinity, J.W. Properties of hot-melt extruded tablet formulations for the colonic delivery of 5-aminosalicylic acid. Eur. J. Pharm. Biopharm. 2005, 59, 85–97. [Google Scholar] [CrossRef] [PubMed]
- Platzer, D.J.; White, B.A. Development and validation of a gradient HPLC method for the determination of clindamycin and related compounds in a novel tablet formulation. J. Pharm. Biomed. Anal. 2006, 41, 84–88. [Google Scholar] [CrossRef] [PubMed]
- Belenguer-Guallar, I.; Jiménez-Soriano, Y.; Claramunt-Lozano, A. Treatment of recurrent aphthous stomatitis. A literature review. J. Clin. Exp. Dent. 2014, 6, e168. [Google Scholar] [CrossRef]
- Qu, X.; Guo, X.; Zhu, T.; Zhang, Z.; Wang, W.; Hao, Y. Microneedle patches containing mesoporous polydopamine nanoparticles loaded with triamcinolone acetonide for the treatment of oral mucositis. Front. Bioeng. Biotechnol. 2023, 11, 1203709. [Google Scholar] [CrossRef]
- Abbasi, F.; Rasoulzadeh, Z.; Yavari, A. The effect of sage (Salvizan gel) compared to triamcinolone acetonide on the treatment of recurrent aphthous stomatitis: A double-blinded randomized clinical trial. BMC Oral Health 2023, 23, 157. [Google Scholar] [CrossRef] [PubMed]
- Korodi, T.; Lachmann, B.; Kopelent-Frank, H. Evaluation of different preparation methods for a preservative free triamcinolone acetonide preparation for intravitreal administration: A validated stability indicating HPLC-method. Die Pharm. Int. J. Pharm. Sci. 2010, 65, 860–866. [Google Scholar] [CrossRef]
- Shin, S.-C.; Kim, J.-Y. Enhanced permeation of triamcinolone acetonide through the buccal mucosa. Eur. J. Pharm. Biopharm. 2000, 50, 217–220. [Google Scholar] [CrossRef]
- Nicolazzo, J.A.; Reed, B.L.; Finnin, B.C. Enhancing the buccal mucosal uptake and retention of triamcinolone acetonide. J. Control. Release 2005, 105, 240–248. [Google Scholar] [CrossRef]
- Matysová, L.; Hájková, R.; Šícha, J.; Solich, P. Determination of methylparaben, propylparaben, triamcinolone acetonide and its degradation product in a topical cream by RP-HPLC. Anal. Bioanal. Chem. 2003, 376, 440–443. [Google Scholar] [CrossRef] [PubMed]
- ICH. International Council for Harmonization of Technical Requirements for Pharmaceuticals for Human Use (2023). Harmonised Guideline. Validation of Analytical Procedures Q2(R2); Final Version Adopted on 1 November 2023. Available online: https://database.ich.org/sites/default/files/ICH_Q2(R2)_Guideline_2023_1130.pdf (accessed on 3 March 2026).
- Bose, A. HPLC calibration process parameters in terms of system suitability test. Austin Chromatogr. 2014, 1, 1–4. [Google Scholar]
- Kumar, G.T.J.; Andrews, B.S.A.; Abbaraju, V.D.N.K. The significance of system suitability in High Performance Liquid Chromatography (HPLC) analysis: Ensuring accurate and reliable results. Int. J. Res. Appl. Sci. Eng. Technol. 2023, 11, 29–35. [Google Scholar] [CrossRef]
- Kowalska, M.; Wozniak, M.; Kijek, M.; Mitrosz, P.; Szakiel, J.; Turek, P. Management of validation of HPLC method for determination of acetylsalicylic acid impurities in a new pharmaceutical product. Sci. Rep. 2022, 12, 1. [Google Scholar] [CrossRef]
- Mestareehi, A. Comprehensive and robust stability-indicating reversed phase high performance liquid chromatography (RP-HPLC) method for Rivaroxaban: Synergistic integration of infrared spectroscopy and clinical pharmacology insights. Front. Chem. 2025, 13, 1551189. [Google Scholar] [CrossRef]
- Jandera, P.; Hájek, T.; Sromová, Z. Mobile phase effects in reversed-phase and hydrophilic interaction liquid chromatography revisited. J. Chromatogr. A 2018, 1543, 48–57. [Google Scholar] [CrossRef]
- Oliveira, G.S.; Lima, A.L.; Gross, I.P.; Sa-Barreto, L.; Medeiros-Souza, P.; Gratieri, T.; Gelfuso, G.M.; Cunha-Filho, M. Chromatographic Method for Determining 6-Mercaptopurinein Skin Permeation Assays for Assessing Cutaneous Exposure Risk. ACS Omega 2025, 10, 32384–32390. [Google Scholar] [CrossRef]
- Kruve, A.; Rebane, R.; Kipper, K.; Oldekop, M.L.; Evard, H.; Herodes, K.; Ravio, P.; Leito, I. Tutorial review on validation of liquid chromatography–mass spectrometry methods: Part I. Anal. Chim. Acta 2015, 870, 8–28. [Google Scholar] [CrossRef] [PubMed]
- Ricci, A.; Fasani, E.; Mella, M.; Albini, A. Noncommunicating Photoreaction Paths in Some Pregna-1,4-diene-3,20-diones. J. Org. Chem. 2001, 66, 8086–8093. [Google Scholar] [CrossRef] [PubMed]
- Miolo, G.; Ricci, A.; Caffieri, S.; Levorato, L.; Fasani, E.; Albini, A. In Vitro Phototoxic Properties of Triamcinolone 16,17-acetonide and Its Main Photoproducts. Photochem. Photobiol. 2003, 78, 425–430. [Google Scholar] [CrossRef]
- Doty, A.C.; Zhang, Y.; Weinstein, D.G.; Wang, Y.; Choi, S.; Qu, W.; Mittal, S.; Schwendeman, S.P. Mechanistic analysis of triamcinolone acetonide release from PLGA microspheres as a function of varying in vitro release conditions. Eur. J. Pharm. Biopharm. 2017, 113, 24–33. [Google Scholar] [CrossRef]
- Ponsar, H.; Quodbach, J. Customizable 3D Printed Implants Containing Triamcinolone Acetonide: Development, Analysis, Modification, and Modeling of Drug Release. Pharmaceutics 2023, 15, 2097. [Google Scholar] [CrossRef]
- Arrizabalaga-Larrañaga, A.; Juan-de-Juan, P.; Bressan, C.; Vásquez-Espinoza, M.; González-de-Peredo, A.V.; Santos, F.J.; Moyano, E. Ultra-high-performance liquid chromatography-atmospheric pressure ionization-tandem mass spectrometry method for the migration studies of primary aromatic amines from food contact materials. Anal. Bioanal. Chem. 2022, 414, 3137–3151. [Google Scholar] [CrossRef]
- Tamai, Y.; Noda, A.; Yamamoto, E. Estimation of confidence intervals for quantitation of coeluted peaks in liquid chromatography–Photodiode array detection through a combination of multivariate curve resolution-alternating least-square and Bayesian inference techniques. J. Chromatogr. A 2023, 1704, 464136. [Google Scholar] [CrossRef]
- Gomes, P.; Wingert, N.R.; Paim, C.S.; Schapoval, E.S.; Steppe, M. Stress Degradation Studies and Kinetic Determinations of Duloxetine Enteric-Coated Pellets by HPLC. J. AOAC Int. 2010, 93, 1829–1835. [Google Scholar] [CrossRef] [PubMed]
- Oney-Montalvo, J.E.; Morozova, K.; Ramírez-Sucre, M.O.; Scampicchio, M.; Rodríguez-Buenfil, I.M. Determination of peak purity in HPLC by coupling coulometric array detection and two-dimensional correlation analysis. Sensors 2022, 22, 1794. [Google Scholar] [CrossRef]
- Wiberg, K.; Andersson, M.; Hagman, A.; Jacobsson, S.P. Peak purity determination with principal component analysis of high-performance liquid chromatography–diode array detection data. J. Chromatogr. A 2004, 1029, 13–20. [Google Scholar] [CrossRef] [PubMed]
- Sadapha, P.; Dhamak, K. Review article on High-Performance Liquid Chromatography (HPLC) method development and validation. Int. J. Pharm. Sci. Rev. Res. 2022, 74, 23–29. [Google Scholar] [CrossRef]
- Soares, A.A.; Amaral, E.H.; De Sousa, L.A.F.; De Souza, S.V.C.; Junqueira, R.G. In-house method validation and occurrence of alpha-, beta-endosulfan, endosulfan sulphate, lambda-cyhalothrin, procymidone and trifluralin residues in strawberry. Food Sci. Technol. 2013, 33, 765–775. [Google Scholar] [CrossRef][Green Version]
- Oliva, A.; Monzón, C.; Santoveña, A.; Fariña, J.B.; Llabrés, M. Development of an ultra high performance liquid chromatography method for determining triamcinolone acetonide in hydrogels using the design of experiments/design space strategy in combination with process capability index. J. Sep. Sci. 2016, 39, 2689–2701. [Google Scholar] [CrossRef]
- Angelo, T.; Pires, F.Q.; Gelfuso, G.M.; da Silva, J.K.R.; Gratieri, T.; Cunha-Filho, M.S.S. Development and validation of a selective HPLC-UV method for thymol determination in skin permeation experiments. J. Chromatogr. B Anal. Technol. Biomed. Life Sci. 2016, 1022, 81–86. [Google Scholar] [CrossRef]

Disclaimer/Publisher’s Note: The statements, opinions and data contained in all publications are solely those of the individual author(s) and contributor(s) and not of MDPI and/or the editor(s). MDPI and/or the editor(s) disclaim responsibility for any injury to people or property resulting from any ideas, methods, instructions or products referred to in the content. |
© 2026 by the authors. Licensee MDPI, Basel, Switzerland. This article is an open access article distributed under the terms and conditions of the Creative Commons Attribution (CC BY) license.