


Abstract
We studied experimentally and computationally the structures and optical properties of sulfur (S), selenium (Se) and tellurium (Te) ring clusters. We encapsulated S, Se and Te into AFI, MOR, CHA and LTA zeolites via vapor adsorption or high-pressure injection from melt and studied Raman and optical absorption spectra (RS and OAS, respectively) of zeolite single crystals with incorporated S, Se and Te ring clusters. Importantly, strict orientation of the rings in zeolite crystals allowed us to study the polarization/orientation dependency of ring RS and OAS. The obtained experimental spectra are found to be in agreement with density functional theory results (DFT using the PBE0 functional and def2-TZVP basis sets) for S8, Se6, Se8, Se12, Te6 and Te8 ring molecules. The agreement is especially good for Te rings, while for S and Se rings harmonic frequency scaling factors are required. The S and Se rings display light-induced effects, which we attribute to the presence of conical intersections between their ground and excited electronic states, resulting in isomerization and subsequent fragmentation. We consider this effect using the Se6 ring example. This phenomenon is important for understanding photostructural changes not only in chalcogen clusters but also in bulk materials such as amorphous selenium.
1. Introduction
Doubly coordinated atoms of sulfur (S), selenium (Se) and tellurium (Te) form ring or chain structures. The allotropes of elemental sulfur are well characterized and consist predominantly of ring structures. In contrast, elemental tellurium primarily exists in the form of helical chains. In this sense, elemental selenium is a borderline material in the chalcogen group since it can form both rings and chains in the solid state. Selenium has attracted considerable attention since the 19th century when its photoconductivity [1] and photovoltaic [2] effects were discovered. Scientific interest in Se peaked in the mid-20th century, driven by its applications in xerography. Nowadays, S, Se, Te and their compounds are undergoing a research renaissance due to their importance for solar cells [3], topological insulators [4], phase-change materials [5], photodetectors [6], lithium batteries [7], etc. A few years ago, Se nanoparticles were explored as potential antimicrobial agents, anticancer drugs, antioxidants and tunable light-emitting bio-markers [8]. The structure and properties of bulk Se also occupy a borderline position between molecular crystals and traditional semiconductors. Its most intriguing form is amorphous selenium (a-Se), which consists of a variety of Se species including chains and rings. This phase displays photo-induced structural changes [9], including low-temperature photomelting (photofluidity) [10].
Here, we analyze the optical properties of zeolite-confined S, Se and Te ring molecules based on polarized optical absorption and Raman spectra (OAS and RS) of zeolite single crystals containing chalcogen rings, which are examined in this and previous works. The analysis is performed by comparing experimental spectra with density functional theory results obtained using the Turbomole software package, version 7.8.1 [11]. We demonstrate good agreement between experiment and theory. Our results suggest certain structural distortions of the rings in their ground state and conical intersections of their excited states with those of related isomeric molecules. They are important for understanding photoinduced effects in a-Se and chalcogenide glasses.
2. Materials and Methods
We used four different zeolites: LTA, MOR, CHA and AFI for encapsulation of S, Se and Te into their regular pores. Zeolite structures containing ring molecules are schematically shown in Figure 1. The encapsulation was carried out using vapor adsorption with a controlled chalcogen loading density or by high-pressure injection from the melt to achieve maximum loading density. Details of the encapsulation techniques are given in Refs. [12,13,14,15,16,17]. Synthetic LTA (Na12Al12Si12O48), AFI (Al12P12O48) as well as natural CHA (Ca1.6Na0.4Al3.6Si8.5O21.6) and MOR (Ca2Na4Si40Al8O96) zeolites were used in this work.
Figure 1.
(a) Structures of X6, X8 and X12 rings with X = S, Se, Te, r, R, ϕ and τ indicating nearest atom distance, next nearest atom distance, bond angle and dihedral angle, respectively; (b) X8 and Se12 rings in LTA; (c) S8, Se6 and Te6 rings in MOR; (d) Se6, Te6 and Te8 rings in CHA; (e) Se6, Se8 and Te8 rings in AFI. Sizes are shown in pm units.
RS of zeolite single crystals with ring molecules were studied using Raman microscopes manufactured by Renishaw Co. (Wotton-under-Edge, UK), JASCO Co. (Tokyo, Japan) and Tokyo Instruments Inc. (Tokyo, Japan). The 633 nm line of the He-Ne laser as well as the 514.5 nm and 364 nm lines of the Ar+ ion laser were used for the RS excitation. Additional RS experiments were done with the 785 nm diode laser. Micro-objective lenses with 10×–100× magnifications and a numerical aperture of 0.2–0.95 were used for the RS excitation and collection in a back-scattering geometry. RS signals of the zeolite-confined chalcogen species were significantly stronger than those of the zeolite transparent host matrices due to resonant Raman enhancement.
OAS in the visible and near-UV spectral ranges were studied using micro-spectrophotometers with a light probe size of 2–10 μm manufactured by Carl Zeiss Co. (Jena, Germany) and CRAIC Co. (San Dimas, CA, USA). To avoid light scattering from zeolite surfaces and improve transmittance, samples were immersed into glycerol and kept between two quartz cover glasses. In most of cases, single-crystal zeolite samples were intentionally broken to pieces with few-micron or submicron thickness. This enabled reliable spectral measurements up to ~5.15 eV for samples with relatively large planar size and optical densities up to ~2.5.
RS and OAS were simulated using density functional theory (DFT) [18,19,20]. The structure and vibrational frequencies of the ring molecules were computed using the hybrid PBE0 exchange-correlation functional [20] and the resolution-of-identity approximation for the Coulomb part (RI-J) [21]. The def2-TZVP basis sets [22] together with the corresponding auxiliary basis sets [23] were employed for S, Se and Te, and small-core effective core potentials (ECPs) were used for Te [24]. RS intensities were obtained in the double harmonic approximation using analytical derivatives of static electronic polarizabilities [25] and analytical energy Hessians [26,27]. Calculations of static polarizability derivatives used the PBE0 functional and augmented def2-TZVPD basis sets [28]. Additionally, infrared (IR) spectra were computed in the double harmonic approximation using analytical dipole moment derivatives and energy Hessians [26,27]. OAS were simulated by time-dependent DFT (TDDFT) [29] using the PBE0 functional with the RI-J approximation [30] and def2-TZVPD basis sets. All calculations were performed with the Turbomole program package, version 7.8.1 [11,18]. Computed RS and OAS are presented as sums of Lorentz curves with full width at half-maximum (FWHM) of ~6 cm−1 and ~0.35 eV, respectively.
The computed structural parameters (bond lengths r, bond angles ϕ and dihedral angles τ) of the chalcogen rings are shown in Supplementary Materials Table S1. Stable ring structures correspond to the energy minima whereas normal-mode-distorted structures do not. Therefore, the structural parameters of these distorted rings should be interpreted qualitatively rather than quantitatively.
3. Results and Discussion
3.1. S8 and S6 Rings
S8 rings were previously obtained in the LTA large cavities [12,17,31,32,33] and in the MOR channels [34]. RS of LTA-S and MOR-S showed good agreement with the known RS of S8 molecules in solution [35]. Here we present RS and OAS of LTA-S and MOR-S obtained using higher-quality equipment (Figure 2). DFT-computed polarized RS of a single S8 ring is shown in Figure 2a. The resulting frequencies, IR intensities and Raman activities of the S8 ring with D4d symmetry are listed in Supplementary Materials Table S2.
Figure 2.
Raman spectra: (a) DFT calculation for S8 and in inset for S6; (b) experiment for S8 in LTA-S; (c) calculation for S8 in LTA; (d) experiment for S8 and S6 in MOR-S. The axes X, Y, Z correspond to S8, while the axes a, b, c correspond to the zeolites. Mode frequencies and symmetries are indicated.
The experimental RS of LTA-S are displayed in Figure 2b. Assuming orientation of S8 by its four-fold axis along the LTA four-fold axis as in Figure 1b, we simulated LTA-S RS by summing the computed RS of S8 in three possible orientations (Figure 2c). The experiment (Figure 2b) and theory (Figure 2c) are in very good agreement. In particular, the polarization dependencies of RS intensities are nearly perfectly reproduced, which confirms the assumed orientation of S8 in LTA. The agreement between the experimental (75, 153–155, 221 cm−1) and theoretical (73.4, 150, 223 cm−1) bending/torsion mode frequencies is also good. However, it is not the case for the stretching modes. The DFT-computed A1 stretching mode frequency of 499 cm−1 is higher than the experimental value of 479 cm−1. Scaling the computed frequency using the recommended global scaling factor of 0.9591 [36] gives 479 cm−1 in excellent agreement with the experiment. Scaling vibrational frequencies by a global factor accounts for the vibrational mode anharmonicities and basis set incompleteness. The scaling factor depends on the exchange-correlation functional and the basis sets and is transferable across different chemical systems, as evidenced by the good agreement between experimental and scaled computed vibrational frequencies. Importantly, the S8 ring symmetry in LTA is slightly distorted from the perfect D4d, with the E2 modes split off and the previously forbidden B1 and E1 modes observed (Figure 2b).
The Raman bands of the S8 ring are also observed in the RS of MOR-S (Figure 2d). The polarization dependence of the A1 and E2 bending mode band intensities clearly shows that the rings are oriented with their four-fold axes aligned along the b-axis of MOR [Figure 1c]. This indicates that the S8 rings in the MOR channels are compressed along the a-axis, whereas they remain uncompressed along the c-axis of MOR. Therefore, the E2 bending mode splitting in MOR-S (152–158 cm−1) is even larger than that in LTA-S (153–155 cm−1). Interestingly, a few relatively weak bands of the S6 rings are also observed in the RS of MOR-S. The experimental bands at ~206 cm−1 and ~272 cm−1 can be assigned to the theoretical 204 cm−1 Eg and 270.5 cm−1 A1g bond-bending modes of the S6 ring, respectively [(Figure 2a), see also Supplementary Materials Table S3]. The polarization dependence of these band intensities is weaker than that of the S8 ring, indicating a less strict orientation of the S6 rings within the MOR channel.
DFT-computed OAS of single S8 and S6 rings are presented in Figure 3a,b, respectively [see also Supplementary Materials Tables S4 and S5]. The insets in these figures show the ring structures in the XZ plane. An additional inset in Figure 3a illustrates the p-orbital splitting in S, Se and Te rings. The low-energy OAS in all these cases correspond to electronic transitions from the lone-pair (LP) orbitals to anti-bonding σ* states.
Figure 3.
Optical absorption spectra: DFT calculation (a) for S8 with insets showing the S8 ring structure in the XZ plane and electronic structure with the atomic p-orbital splitting to the bonding σ, anti-bonding σ* and nearly non-disturbed lone-pair (LP) orbital states; (b) for S6 with inset showing the S6 structure in the XZ plane; experiment for (c) S8 in LTA-S (E//a); and (d) for MOR-S (E//b) corresponding mainly to S8 (E//Z) with a minor contribution of S6.
For both S8 and S6 rings, in-plane polarized absorption (E//X) is stronger than the out-of-plane absorption (E//Z). Taking into account the orientations of the S8 rings in LTA and MOR, we can conclude that OAS of LTA-S mainly corresponds to E//X absorption with a minor contribution from E//Z absorption of S8. In contrast, OAS of MOR-S for E//b mainly corresponds to E//Z absorption of S8 with a minor contribution from S6 absorption. Both experimental spectra show a single absorption peak at ~4.53 eV for LTA-S (Figure 3c) and ~4.55 eV for MOR-S (E//b) (Figure 3d), respectively. These values are in reasonable agreement with the theoretical peak energies of 4.63 eV for E//X and 4.6 eV for E//Z (Figure 3a).
We should note that in the previously reported LTA-S OAS a peak position at 4.35–4.4 eV [17] was observed for samples with a higher sulfur loading density, corresponding to the significant contribution of two interacting S8 rings per LTA large cavity. In contrast, in this work, we report the OAS of LTA-S with a low sulfur loading density, corresponding to one or zero S8 molecule per cavity. It is likely that intermolecular interactions are responsible for the downshift of the absorption peak from 4.53 eV to 4.35–4.4 eV in the case of two S8 rings per cavity [17].
Experimentally, S8 ring OAS were also studied in solution [37,38]. The reported absorption band energies, 4.49 eV and 4.7 eV [37], and 4.48 eV, 4.66 eV and 5.28 eV [38], are in reasonable agreement with our DFT calculations, which yielded 4.63 eV, 4.83 eV and 5.4 eV for S8 (E//X). Similar to S8 in zeolites, the absorption peaks of S8 in solution are observed at slightly lower photon energies than predicted by DFT. This discrepancy may be explained by solvent effects or by the overestimation of the electronic transition energies in DFT calculations. Furthermore, experimental OAS measurements were conducted at room temperature contrary to the DFT calculations implying T = 0 K, the S8 ring energy gap being larger with a decrease in temperature. Another similarity of S8 OAS in solutions with those in zeolites (Figure 3c,d) is the presence of a low-energy absorption tail extending down to ~3 eV. We attribute this S8 absorption tail to triplet excitations in the 3.66–4.07 eV range [Supplementary Materials Table S4a].
To summarize this section, we conclude that our DFT calculations showed nearly perfect agreement with experimental Raman intensities and bending mode frequencies while they overestimated stretching mode frequencies. Applying harmonic frequency scale factors [36] to stretching mode frequencies improved the agreement. The DFT energies and oscillator strengths of the S8 electronic transitions reasonably reproduced the experimental results. Our DFT-computed r = 205.6 pm, ϕ = 102.7° for S6 and r = 204.7 pm, ϕ = 108.1° for S8 [Supplementary Materials Table S1] show shorter r and nearly same ϕ compared to corresponding DFT-computed 212 pm, 103.1° and 211 pm, 109.5° [39] or 212 pm, 102.5° and 210.8 pm, 108.3° [40].
3.2. Se6 Rings
RS and OAS of Se6 incorporated in the pores of three different zeolites CHA, MOR and AFI (low density—LD), were experimentally studied in Ref. [41]. In some earlier works, Se6 rings were identified in zeolites as well [34,42,43]. Se6 ring molecules are slightly compressed in the CHA cavities possessing a nearly prolate spheroid shape with a length of ~1 nm and a cross-section of 0.67 nm × 0.67 nm. The rings are less compressed in the AFI channel with a cross-section of 0.73 nm × 0.73 nm. The D3d symmetry of the Se6 ring is maintained in both cases and the ring three-fold axis Z is directed along the crystal three-fold axis c. In contrast, the Se6 ring is asymmetrically compressed in the MOR channel with a cross-section of 0.67 nm × 0.7 nm, whereas the ring three-fold axis Z is directed along the MOR b axis. The ring orientations are schematically shown in Figure 1 and the insets of Figure 4. Here, we present a more detailed optical study of Se6 together with corresponding DFT calculations.
Figure 4.
Polarized RS of Se6: (a) DFT calculation; experimental RS at the 632.8 nm wavelength (1.96 eV) excitation: (b) CHA-Se, (c) AFI-Se(LD) and (d) MOR-Se. Insets schematically show Se6 ring in the corresponding cavities and channels, white and black circles representing to upper and lower Se atoms, respectively. The axes X, Y, Z correspond to Se6, while the axes a, b, c correspond to the zeolites.
Figure 4 shows the theoretical and experimental RS of Se6 [see also Supplementary Materials Table S6]. The agreement between DFT results and the experiment is very good for the bond-bending mode frequencies and intensities. However, the discrepancy between the experiment and theory is significant for the bond-stretching mode frequencies. The experimental frequency of 273–274 cm−1 of the A1g bond-stretching mode is 12–13 cm−1 lower than the computed value of 285.7 cm−1, which can again be attributed to the neglect of anharmonic effects in simulations, as the scaled frequency is 274 cm−1, in line with experimental data. The discrepancy between the DFT-computed stretching Eg mode frequency of 271.7 and experimentally observed band frequencies 220–221 cm−1 attributed earlier to Eg [41,44] is very large. Applying the scaling factor yields 260.6 cm−1, which does not fully account for the difference. Therefore, we consider the possibility to assign the observed band to the forbidden A1u mode. This mode can be converted to the active A1 mode under a ring distortion, which reduces its symmetry from D3d to D3 [see Supplementary Materials Table S1 for the structural parameters of the distortion]. The DFT-computed XX-spectrum of such a distorted ring is shown in Supplementary Materials Figure S2a and features a strong 228.8 cm−1 A1 mode band. Assuming that ~10% of Se6 rings are distorted, we obtain the theoretical XX-spectrum shown in Supplementary Materials Figure S2b, which is in good agreement with the experimental RS.
The polarization dependencies of the intensities of both A1g and Eg bending modes show good agreement between the experiment and DFT calculations. Both modes are highly active in the XX polarization configuration and less active in the ZZ configuration, where the Eg mode is formally forbidden by selection rules. The relatively high activity of these modes in the AFI-Se(LD) ZZ spectrum is likely associated with large amplitudes of (1) vibrations along the AFI channels and (2) librations of nearly free Se6 molecules. Due to the ring symmetry distortion in MOR-Se, the Eg mode splits to two components at ~102 cm−1 and ~108 cm−1. Figure 4d suggests a C2h symmetry for the Se6 ring in MOR-Se. Therefore, the Eg bending mode splits to Ag and Bg modes with frequencies of 108 cm−1 and 102 cm−1, respectively. This splitting, with the higher Ag mode frequency and a lower Bg mode frequency, corresponds to the Se6 ring orientation shown in Figure 4d. The actual symmetry of Se6 in MOR-Se may be even lower, specifically, Cs, since the A1g mode at ~134 cm−1 mixes with the originally inactive A2u mode at ~141 cm−1, with both modes being converted to the A’ modes of the Cs point group.
The theoretical and experimental OAS of Se6 are shown in Figure 5 [see also Supplementary Materials Table S7]. DFT-computed OAS (Figure 5a) shows three relatively weak bands at 3.67 eV, 4.06 eV and 4.22 eV and two strong bands at 4.6 eV and 5.1 eV polarized in the molecular plane (E//X). These absorption bands correspond to the transitions of Eu symmetry in the D3d point group of Se6. For the E//Z polarization, three relatively weak absorption bands of A2u symmetry are observed. As in the case of sulfur rings, only dipole-allowed singlet electron transitions are included in the calculations.
Figure 5.
Polarized optical absorption spectra of Se6: (a) DFT calculation with inset showing OAS with forbidden transitions, (b) CHA-Se, (c) AFI-Se(LD) and (d) MOR-Se. The axes X, Y, Z correspond to Se6, while the axes a, b, c correspond to the zeolites.
Experimentally, OAS with both E//X and E//Z polarizations are observed in CHA-Se (Figure 5b). They show rather good agreement with the DFT results. Indeed, the experimental band energies at ~3.65 eV, ~4.4 eV and ~4.63 eV nearly coincide with the computed values. The instrumental limit of ~5.15 eV does not allow the observation of the strong band expected at ~5.1 eV. Interestingly, the experimental CHA-Se OAS clearly shows a band at ~3.2 eV, which is absent in the DFT-computed OAS. We assign the experimental ~3.2 eV band to the DFT-computed forbidden Se6 electronic transitions of Eg (3.13 eV and 3.36 eV), A2g (3.28 eV) and A1g (3.43 eV) symmetry, which are activated due to the inversion symmetry breaking by the antisymmetric vibrational A1u, A2u or Eu modes [Supplementary Materials Table S7b–g]. As a result, weak absorption bands appear in the 3.1–3.4 eV range of the Se6 absorption spectrum. The inset in Figure 5a shows computed Se6 OAS with (dashed lines) and without (solid lines) the contribution of activated forbidden electronic transitions. Agreement with the experiment is improved in the former case.
The anisotropy of CHA-Se OAS appears weaker than that predicted by DFT. However, it is necessary to take into account the sample-surface scattering, which increases with photon energy. OAS measurements of Se6 in AFI-Se(LD) and MOR-Se is available only for one polarization, namely, for E//X in AFI-Se(LD) and for E//Z in MOR-Se. This limitation is associated with the existence of Se chains that strongly absorb light polarized along the AFI and MOR channels. OAS measurements for MOR-Se are not feasible for E//a//Y due to the crystal shape.
The AFI-Se(LD) OAS (Figure 5c) demonstrates good agreement with the DFT E//X spectrum. Indeed, a weak experimental band at ~3.65 eV is in good agreement with the theoretical band at ~3.67 eV, whereas a strong experimental band at ~4.65 eV is close to the ~4.6 eV theoretical value. MOR-Se OAS (Figure 5d) agrees well with the computed E//Z spectrum of Se6 (Figure 5a). Stronger and weaker experimental bands at ~3.55 eV and ~4.5 eV can be assigned to the theoretical electronic transitions at ~3.66 eV and ~4.45 eV [Figure 5a]. The ~3.2 eV band, which is clearly observed in the CHA-Se spectrum, is likely obscured in the low-energy shoulder of the ~3.55 eV band.
To summarize this section, we state that the DFT calculations demonstrate very good agreement with the experimental Raman intensities and bending mode frequencies while they have a tendency to overestimate stretching mode frequencies. Scaling factors [36] improve the agreement. The computed energies and oscillator strengths of the electronic transitions are in satisfactory agreement with the experimental ones. We hypothesize that Se6 undergoes antisymmetric mode distortion, which leads to better agreement of computed OAS with experiment and suggests that the experimental 220–221 cm−1 Raman band corresponds to the inactive A1u mode of the undistorted Se6(D3d), which becomes active for distorted Se6(D3). Our DFT-computed r = 233.6 pm, ϕ = 101.4° for Se6 are in agreement with other DFT results: r = 234 pm, ϕ = 101° [45] and r = 233 pm, ϕ = 99.4° [46] and rather close to r = 232 pm [47].
3.3. Se8 and Se12 Rings
There are several zeolites suitable for accommodating Se8 rings in their cavities, namely, LTA, AFI, CaY, SrY, RbY [15,16,32,33,48,49,50,51] and some others. However, the Se8 rings are typically accompanied by other Se species, in particular, by Se12 rings in LTA and by Se chains in AFI at high Se loading densities (AFI-Se(HD)). Using polarized RS of LTA-Se single crystals, we showed that single and double Se8 rings can be formed in the large LTA cavities with their four-fold axes oriented along the LTA four-fold axes. Simultaneously, Se12 rings can be formed in other large cavities of the same LTA crystal with their three-fold axes oriented along the LTA three-fold axes. The Se12 rings were clearly identified in the RS of LTA-Se [15,16,32,33], thereby correcting earlier interpretations [52,53].
Here, we present DFT-computed RS and OAS of Se8 and Se12 rings, provide additional details on the experimental RS of LTA-Se, demonstrate the OAS of LTA-Se over a wide spectral region and extract the corresponding Se12 OAS. We also present AFI-Se(HD) RS and wide-spectral-range OAS dominated by Se8 rings (E//X). DFT-computed RS of the Se8 ring with D4d symmetry are shown in Figure 6a [see also Supplementary Materials Table S8]. They are very similar to those of S8 (Figure 2a). Both A1 modes bond-stretching at 279.3 cm−1 and bond-bending at 110 cm−1 are highly active in the XX polarization configuration while only the former is active in the ZZ configuration. All E2 modes exhibit only XX and XY Raman activity due to the selection rules of the D4d point group. Figure 6b demonstrates calculated RS of LTA-Se with Se8 in three possible orientations with their four-fold axes along the LTA four-fold axes in accordance with our previous observations [15,16,32]. Importantly, the nearly purely XX-active 110 cm−1 A1 bond-bending mode appears to be strongly suppressed in the ab polarization configuration.
Figure 6.
Raman spectra: (a) DFT calculation for Se8; (b) calculation for Se8 in LTA with the inset showing possible ring orientations in LTA; (c) DFT calculation for Se12; (d) calculation for Se12 in LTA with the inset showing possible ring orientations in LTA. Optical absorption spectra: (e) DFT calculation for Se8; (f) DFT calculation for Se12. The axes X, Y, Z correspond to Se8 and Se12, while the axes a, b, c correspond to the zeolite.
DFT-computed RS of the Se12 ring with D3d symmetry are shown in Figure 6c [see also Supplementary Materials Table S9]. Similar to the Se8 ring, the symmetric bond-stretching mode (272.7 cm−1 A1g in this case) is active in both XX and ZZ polarization configurations. In contrast to Se8, Se12 displays two symmetric bond-bending modes: the 52.9 cm−1 mode is XX-active while the 147.8 cm−1 mode is ZZ-active. Figure 6d demonstrates calculated RS of LTA-Se with Se12 in four possible orientations, with their three-fold axes along the LTA three-fold axes. The XX-active 52.9 cm−1 A1g bond-bending mode is suppressed in the cd polarization configuration. The computed optical energy gap for the dipole-allowed electron transitions of Se8 ring EG(Se8) ~3.67 eV [(Figure 6e), see also Supplementary Materials Table S10] coincides with that for the dipole-allowed electron transitions of Se6 [Figure 5a]. In contrast, the computed EG(Se12)~3.25 eV is noticeably reduced [(Figure 6f), see also Supplementary Materials Table S11].
Experimental RS of LTA-Se single crystals with the maximum possible Se loading density are shown in Figure 7a–d. The polarization configurations aa, ab, cc and cd are the same as those for LTA-S RS [Figure 2b]. Importantly, the RS of LTA-Se varies with the excitation wavelength. Due to the smaller energy gap of Se12 compared to Se8, the Se12 Raman bands are resonantly enhanced at λ = 514.5 nm. Therefore, both Se8 and Se12 roughly equally contribute to the LTA-Se RS at λ = 785 nm (Figure 7a–d, black curves) well below the energy gap while resonantly enhanced Se12 bands dominate at λ = 514.5 nm (Figure 7a–d, red curves). Indeed, the experimental LTA-Se red-curve bands at ~56 cm−1, ~88–89 cm−1, ~125 cm−1, ~144 cm−1 and ~258 cm−1 can be assigned to the DFT-computed vibrational modes of Se12 at 52.9 cm−1 (A1g), 89.2 cm−1 (Eg), 122.2 cm−1 (Eg), 147 cm−1 (A1g) and 272.7 cm−1 (A1g), respectively. The symmetric XX-active A1g bond-bending mode band at ~56 cm−1 is nearly completely suppressed in the cd- polarization configuration as expected for Se12 rings oriented by their three-fold axes along the LTA three-fold axes.
Figure 7.
Experimental Raman spectra of LTA-Se(8) in aa- (a), ab- (b), cc- (c) and cd- (d) configurations taken with the 785 nm (black) and 514.5 nm (red) excitation wavelengths; (e) Raman spectra of AFI-Se(HD) in cc- (black) and aa- (red) configurations excited with the 633 nm wavelength; (f) Experimental optical absorption spectra of LTA-Se(1)(black), LTA-Se(8)(red), AFI-Se(HD) E⊥c (green) and the absorption spectrum of Se12 ring (blue) extracted from the spectra of LTA-Se(1) and LTA-Se(8). The axes X, Y, Z correspond to Se8 and Se12, while the axes a, b, c correspond to zeolites.
Se8 experimental Raman bands are observed at ~78–79 cm−1, ~113 cm−1, ~121 cm−1 and ~268 cm−1 in the LTA-Se RS excited with a 785 nm wavelength [Figure 7a–d, black curves]. They are analogous to the DFT-computed ones at 74.1 cm−1 (E2), 110 cm−1 (A1), 124 cm−1 (E3) and 279.3 cm−1 (A1). The suppression of the XX-active A1 bond-bending mode band at ~113 cm−1 in the ab- polarization configuration is a clear indication of the Se8 ring orientation with its four-fold axis along the LTA four-fold axis similar to the S8 ring. Se8 bands are also observed in the RS of AFI-Se(HD) (Figure 7e), which refers to AFI-Se with a high Se loading density. The bands at ~42 cm−1, ~75 cm−1, ~114 cm−1 and ~269 cm−1 are similar to the DFT-computed bands of Se8 at 36.4 cm−1 (E2), 74.1 cm−1 (E2), 110 cm−1 (A1) and 279.3 cm−1 (A1). High activity of the XX-active modes in the aa-polarization configuration and their low-activity in the cc-configuration suggest the orientation of the four-fold axis of Se8 along the c-axis of AFI.
Figure 7f shows the experimental OAS of LTA-Se and AFI-Se(HD). LTA-Se(1) and LTA-Se(8) correspond to Se loading densities of ~one Se atom and eight Se atoms per LTA large cavity, respectively. As we showed earlier [15], LTA-Se(8) displays a much higher Se12/Se8 concentration ratio than LTA-Se(1). Therefore, Se12 OAS can be extracted using the procedure described in Ref. [15]. Here, we extend this analysis to a wider spectral range up to ~5.15 eV. DFT predicts relatively strong absorption for E//X and weaker absorption for E//Z for both Se8 and Se12 (Figure 6e,f).
Theoretical bands of Se8 at 3.67–3.88 eV and 4.82 eV can be associated with the experimental bands of LTA-Se(1) at ~3.85 eV and ~4.85 eV (black) and with those of AFI-Se(HD) at ~3.75 eV and ~4.75 eV (green). Theoretical bands of Se12 at 3.25 eV, 3.87 eV, 4.46 eV and 5.09 eV can be associated with the corresponding experimental bands at 3.0–3.3 eV, ~3.7 eV, ~4.5 eV and ~5.1 eV (blue). The doublet at 3.0–3.3 eV can result from the splitting of the 3.25 eV Eu-symmetry transition.
To summarize this section, Se8 and Se12 rings form in the LTA large cavities. The Se8 rings are oriented with their four-fold axes along the LTA four-fold axes. The Se12 rings are oriented with their three-fold axes along the LTA three-fold axes. Experimental Raman frequencies and intensities agree well with DFT-computed values for bond-bending modes of both Se8 and Se12 rings. DFT overestimates bond-stretching mode frequencies are due to neglecting anharmonic effects. Applying harmonic scaling factors [36] improves the agreement, yielding 268 cm−1 for the Se8 A1 mode in line with experiment and 261.5 cm−1 for the Se12 A1g mode close to experimental 258 cm−1. Experimental OAS of Se8 and Se12 are in reasonable agreement with the DFT-computed spectra, and the energy gap of Se12 is smaller than that of Se8. Our DFT-computed structural parameters of Se8 r = 233.6 pm, ϕ = 101.4° are close to r = 233 pm, ϕ = 100° [46] but differ from r = 236 pm, ϕ = 108.65° [54]. Our parameters of Se12 r = 232.9 pm, ϕ = 105.5; 106.1° differ from the reported DFT results r = 236 pm, ϕ = 107.17–108.74° [54] and r = 237.7 pm [55]. For both Se8 and Se12 r = 231 pm was reported in Ref. [47].
3.4. Te8 and Te6 Rings
In contrast to sulfur and selenium, which form rather stable ring molecules, tellurium rings are very exotic clusters requiring specific conditions for their stabilization. Bulk crystalline Te and amorphous Te consist of chains. However, as we recently showed, space restriction in the LTA cavities makes the formation of Te8 rings realistic. LTA-Te was found to be an example of a uniform regular array of Te8 rings [56]. Te8 rings were also found in AFI-Te with a high Te loading density [14]. Te6 rings exhibited their signatures in the RS of MOR-Te [14,34]. In both cases, Te rings coexist with Te chains in the zeolite channels.
DFT-computed RS of Te6 and Te8 rings are shown in Figure 8a,b [see also Supplementary Materials Tables S12 and S13]. They are rather similar to those of S6/Se6 and S8/Se8, respectively. Symmetric bond-bending modes at 80 cm−1 (Te6 A1g) and 65.4 cm−1 (Te8 A1) show high Raman activity in the XX polarization configuration and low activity in the ZZ configuration. In contrast, symmetric bond-stretching modes at 192.7 cm−1 (Te6 A1g) and 186.9 cm−1 (Te8 A1) show comparable Raman activities in the XX and ZZ configurations. DFT-computed OAS of Te6 and Te8 [(Figure 8c,d), see also Supplementary Materials Tables S14 and S15] show smaller optical energy gaps compared to S6/Se6 and S8/Se8. Rather strong absorption bands are observed in the violet spectral range of Te6 and Te8 at energies around 3 eV. The E//X absorption dominates over the E//Z absorption for both rings.
Figure 8.
DFT-computed RS of Te6 (a) and Te8 (b); DFT-computed OAS of Te6 (c) and Te8 (d).
Theoretical RS of Te8 in LTA for the aa, cc, ab and cd polarization configurations were obtained by summing of the Raman responses of three Te8 rings in their three possible orientations in the LTA crystal (Figure 9a). They are qualitatively similar to the theoretical RS of S8 in LTA (Figure 2c) and Se8 in LTA (Figure 6b). Corresponding experimental polarization dependencies of the LTA-Te bands in the Te8 bond-bending mode region (Figure 9b) appear to be in good agreement with the theoretical ones (Figure 9a). The experimental frequency of 64 cm−1 is very close to the calculated frequency 65.4 cm−1 of the Te8 A1 bond-bending mode. The experimental 64 cm−1 band is rather strong in the aa and cc polarization configurations and it is still not weak in the cd configuration while the band completely disappears in the ab configuration. This is a consequence of the two-dimensional character of the Raman tensor of this mode [Supplementary Materials Table S13] with only two strong diagonal tensor components. In contrast, the Raman tensor of the Te8 A1 bond-stretching mode is rather three-dimensional [Supplementary Materials Table S13]. The observed polarization dependence of the Te8 A1 bond-bending mode intensity is a clear indication of the orientation of the Te8 fourfold axis along the fourfold axis of LTA.
Figure 9.
Theoretical RS of Te8 in LTA for different polarization configurations (a); experimental RS of LTA-Te at T ~77 K and λ = 633 nm (b); experimental RS of AFI-Te with high Te loading density for aa-configuration at T ~300 K and λ = 785 nm (c); experimental OAS of LTA-Te with ~three Te atoms per cavity (d).
The calculated Te8 E2 bond-bending mode frequency of 43.8 cm−1 is in good agreement with the observed 46–50 cm−1 band frequencies of LTA-Te. The splitting of the degenerate E2 mode indicates a structural distortion of Te8 in LTA and, therefore a reduced symmetry compared to the initial D4d symmetry of the ring. Interestingly, the splitting of the Te8 E2 mode by 8.3% in LTA is very strong, in contrast to the weaker splitting by ~1.3% for the corresponding E2 mode at 153–155 cm−1 of S8 and 78–79 cm−1 of Se8.
Bond-stretching-mode bands of Te8 are rather broad and overlap with each other. For band sharpening, we took the RS measurement of LTA-Te at a temperature T ~77 K [Figure 9b]. Assuming structural distortion in Te8, we can conclude that the Raman bands in the Te8 bond-stretching-mode region at 162–163 cm−1 and 171–173 cm−1 likely originate from the E3 mode and the formerly inactive B1 mode, respectively, while the 182–183 cm−1 and 186 cm−1 bands correspond to the A1 and E2 modes of Te8. The originally inactive E1 bond-stretching mode may also contribute to the observed Raman bands.
Interestingly, in contrast to S8 and Se8, the experimental symmetric bond-stretching mode frequency of Te8 (182–183 cm−1) lies between the unscaled computed frequency of 186.7 cm−1 and the scaled frequency of 179 cm−1. This result may reflect the more accurate DFT prediction of bond lengths in case of Te8. Moreover, effective core potentials (ECPs) are used to describe the inner shells of Te, which alters the basis set incompleteness and may reduce the need for frequency scaling.
Another example of Te8 formation in zeolites is AFI-Te. As shown in Ref. [14], Te8 bands can be observed in the AFI-Te RS recorded in the aa polarization configuration. We show such a spectrum in greater detail in Figure 9c. The dominant band at ~184 cm−1 is attributed to the A1 bond-stretching mode of Te8. The bands at ~64 cm−1 and ~80 cm−1 are assigned to the A1 and E3 bond-bending modes, respectively. The doublet at 41–47 cm−1 is attributed to the E2 bond-bending mode.
Importantly, the experimental LTA-Te(3) OAS (Figure 9d) shows nearly perfect agreement with the computed OAS of Te8 (Figure 8d). Similarly to the bond-stretching mode frequencies, this result may reflect the more accurate DFT prediction of bond lengths in Te8.
As shown above, MOR channels accommodate Se helical chains and Se6 rings. The rings are oriented with the three-fold axis along the b-axis of MOR. The actual symmetry of the Se6 ring in the MOR channel is lower than the D3d symmetry suggested by theory. Splitting of the Eg bond-bending mode as well as the mixture of the A1g and A2u bond-bending modes of Se6 in MOR confirm its structural distortion. Figure 10a shows MOR-Te RS, which has many similarities to the MOR-Se RS. Indeed, a strong cc-active band at ~168 cm−1 undoubtedly corresponds to Te helical chains. The rest of the MOR-Te bands can be attributed to Te6. The 63 cm−1 and 68 cm−1 bands most likely originate from the Eg bond-bending mode of Te6 similar to the 102–108 cm−1 bands of Se6 in the MOR-Se RS. The 83–89 cm−1 doublet in the MOR-Te RS is similar to the 134–141 cm−1 one in the MOR-Se RS. It can be assigned to the mixed A1g and A2u bond-bending modes of Te6. The bond-bending modes of Te6 are active in the aa- and cc- polarization configurations, while they are inactive in the bb-configuration, which proves the orientation of the rings with their three-fold axes along the b-axis of MOR. The DFT-computed frequencies of the Te6 bond-bending modes 58.7 cm−1 (Eg), 80 cm−1 (A1g) and 90.9 cm−1 (A2u) are in good agreement with the experimental values.
Figure 10.
Experimental RS of MOR-Te (a) and CHA-Te (b) for different polarization configurations; experimental OAS of MOR-Te for E//b (c) and CHA-Te for E//a (black) and E//c (red) (d).
The A1g bond-stretching mode band of Te6 at ~196 cm−1 in the MOR-Te RS is similar to the analogous band of Se6 at ~274 cm−1 in the MOR-Se RS. It is active in the aa-, bb- and cc- polarization configurations. The DFT-computed unscaled frequency 192.7 cm−1 of this mode nearly coincides with the experimental value. Another bond-stretching mode band of Te6 at ~164 cm−1 is observed in the aa-spectrum of MOR-Te. The band is also active in the cc-configuration, but it is overshadowed by the strong Te chain band at ~168 cm−1. The asymmetry of the ~168 cm−1 band, with a low-frequency shoulder, supports this assignment. The 164 cm−1 band can be attributed to the Eg or A1u modes of Te6. The DFT-computed frequencies of the corresponding modes are 186.7 cm−1 and 168.5 cm−1. The experimental polarization dependence of the 164 cm−1 band intensity is in good agreement with the theoretical Eg mode, while its frequency better matches the theoretical A1u mode.
One may assume that Te6 rings can be formed in CHA cavities similar to Se6 rings. Indeed, we observe several bands in the RS aa spectrum of CHA-Te (Figure 10b), which can be attributed to Te6. The 83–91 cm−1 doublet can be assigned to the mixed A1g and A2u bond-bending modes of Te6. The strong 203 cm−1 band most likely originates from the A1g bond-stretching mode, while the 164 cm−1 and 180 cm−1 bands can be assigned to the A1u and Eg bond-stretching modes, respectively. The high frequency of the 203 cm−1 band is associated with significant compression of the ring in the CHA cavity. In contrast to the Se6 ring in the CHA cavity, the Te6 ring clearly demonstrates its structural distortion with its symmetry reduction. The bond-bending-mode mixing reveals this. The corresponding 83–91 cm−1 doublet is inactive in the cc spectrum, indicating that the ring is oriented with its three-fold axis along the c-axis of CHA. The A1g bond-stretching-mode band at ~203 cm−1 weakens in the cc spectrum compared to the aa spectrum but remains observable. This observation is also compatible with the Te6 ring orientation with its major axis along the c-axis of CHA.
Two distinct bands at ~45 cm−1 and ~63 cm−1 are observed in the cc and ca spectra of CHA-Te. Their frequencies suggest that the bands can be assigned to the Eu and Eg bond-bending modes of Te6, respectively. However, their polarization dependencies are challenging to interpret. Theoretically, the Eg mode should be active in the aa spectrum and inactive in the cc spectrum. We assume that the structural distortion is significant. Therefore, the selection rules can be strongly affected. However, we can also consider another possibility. The CHA cavity is able to accommodate a Te8 ring with its XY plane in the ac plane of the zeolite. In this case, the ~45 cm−1 and ~63 cm−1 bands may originate from the E2 and A1 bond-bending modes of Te8.
OAS of MOR-Te E//b (Figure 10c) and CHA-Te (Figure 10d) display features of Te6. The MOR-Te OAS shows three bands at ~2.7 eV, ~3.6 eV and ~4.9 eV. Theoretical calculations suggest E//Z allowed transitions at 2.91 eV, 3.2 eV, 3.54 eV and 5.14 eV. The 2.91 eV and 5.14 eV bands are clearly seen in the DFT-computed E//Z OAS of Te6 (Figure 8c). We attribute the experimental ~2.7 eV and ~4.9 eV bands to the 2.91 eV and 5.14 eV transitions of Te6, respectively. The 3.2 eV and 3.54 eV E//Z allowed electron transitions have lower oscillator strengths and are not seen in the theoretical spectrum. However, they may be enhanced due to structural distortions of Te6. Therefore, we tentatively assign the observed ~3.6 eV band to the enhanced 3.54 eV transition. On the other hand, the E//X-allowed transitions at 3.72 eV can also contribute to the observed ~3.6 eV band of MOR-Te because the selection rules of Te6 can be strongly disturbed.
CHA-Te OAS display features at ~2.45 eV, ~2.9 eV and 3.5 eV, which can be attributed to Te6. Indeed, the ~2.45 eV band energy is in good agreement with the lowest-energy forbidden transitions of Te6 at 2.56 eV (Eg) and 2.62 eV (A2g). These transitions can be activated by antisymmetric ring vibrations, similar to those of Se6 considered in the previous sections. Additionally, as mentioned above, the Te6 ring in CHA-Te is strongly compressed, which may lead to noticeable shifts of the low-energy electron transitions. Both allowed 2.96 eV E//X and 2.91 eV E//Z transitions of Te6 can contribute to the experimentally observed feature of CHA-Te at ~2.9 eV. The third band at ~3.5 eV, clearly observed in the E//a spectrum of CHA-Te, can be associated with the allowed 3.72 eV E//X transition.
Interestingly, the E//c absorption of CHA-Te becomes stronger than the E//a absorption at energies above 3.7 eV. One possible explanation is a strong in-plane compression of Te6, which may enhance the E//Z absorption of the molecule. Indeed, a very much anisotropic 2D-like Te6 ring can convert into more or less 3D-like cluster due to the compression. Another possibility is a contribution from Te8 absorption. As mentioned above, if Te8 exists in CHA-Te, the molecule is most likely oriented in the ac plane of CHA. Therefore, the E//X absorption of Te8, which dominates over its E//Z absorption, likely contributes to the E//c absorption of CHA-Te.
To summarize this section, Te8 rings are formed in the LTA large cavities. The Te8 rings are oriented such that their four-fold axes align with the LTA four-fold axes. Experimental Raman frequencies and intensities are found to be in good agreement with DFT-computed ones for both bond-bending and bond-stretching modes of Te8 rings. The observed splitting of the Te8 bond-bending modes suggests the reduction of the ring D4d symmetry in the LTA cavity. The bond-stretching modes exhibit mixing due to the reduced symmetry of the rings and the essential anharmonicity of their vibrations. The DFT-computed OAS of Te8 shows remarkably good agreement with the experimental OAS of LTA-Te. Te8 rings are also formed in the AFI channels, with their four-fold axes oriented along the channel. Te6 rings are formed in MOR channels and CHA cavities. Their experimental RS and OAS show good agreement with DFT-computed ones. CHA-Te RS and OAS suggest the existence of some amount of Te8 rings in CHA cavities. The structural parameters obtained from our DFT calculations: Te6 r = 272 pm, ϕ = 100.5° and those of Te8 r = 271 pm, ϕ = 105.8°. These values differ from previously reported DFT results: Te6 r = 275 pm, ϕ = 101° and Te8 r = 274–275 pm, ϕ = 106.3° [54]; Te8 r = 274–275 pm, ϕ = 106.3° [57].
3.5. Interaction of the Chalcogen Rings with Light and Photostructural Effects
All chalcogen ring molecules considered above display strong absorption bands in the UV. Therefore, one can expect photo-induced effects when the molecules are irradiated with UV light. A number of studies have reported the UV-light-induced conversion of S8 rings to sulfur chains in liquid sulfur [58,59,60]. Pulsed laser light with a wavelength of 355 nm was used in the experiment [58] and produced photo-induced polymerization of liquid sulfur. An ab initio molecular dynamics simulation suggested rapid ring opening due to a photo-induced electronic transition [59]. A more comprehensive study using a combination of time-dependent DFT and the similarity-transformed equation-of-motion coupled cluster (STEOM-CCSD) method [60] showed the importance of triplet states in the photo-induced S8 bond breaking.
Figure 11 demonstrates photo-induced effects in the RS of several our samples, which were recorded with continuous laser excitation at a wavelength of 364 nm. Figure 11a shows the bb-spectrum of MOR-S. In addition to the S8 and S6 bands analogous to those observed in the bb-spectrum excited with λ = 514.5 nm [Figure 2d], one can see the bands at ~582 cm−1 and ~1164 cm−1. We assign the ~582 cm−1 band to the S2− fundamental while the ~1164 cm−1 band to its overtone. For reference, see, for example the work in [61], where S2− fundamentals in ultramarine were observed at 586–590 cm−1 at room temperature. The S2− bands appear in the MOR-S RS as a result of the S8 and S6 ring breaking under 364 nm light irradiation.
Figure 11.
Experimental RS obtained with the 364 nm wavelength excitation of MOR-S (a), LTA-S (b), AFI-Se(HD) (c) and LTA-Se (d).
Similar bands are observed in the LTA-S RS at ~583 cm−1 and ~1165 cm−1 [Figure 11b]. Additionally, a broad S42− band at ~446 cm−1, similar to the 454 cm−1 band of S42− [62], is observed in the LTA-S RS excited with 364 nm light. The S8 ring-breaking mechanism is likely the same as that proposed for liquid sulfur polymerization. The difference in the final result is associated with spatial restriction and the zeolite environment, which provides extra electrons. Therefore, S2− and S42− anions are formed in the zeolites.
We should note that the S8 absorption at the 364 nm wavelength in both MOR-S and LTA-S is rather weak since the corresponding photon energy of 3.41 eV is well below the first allowed absorption band of S8 or S6 (Figure 3). The 364 nm absorption in fact corresponds to the absorption tails of S rings that arise from forbidden electronic transitions, in particular triplet excitations. In contrast, the Se8 and Se12 rings show absorption at this wavelength due to relatively strong allowed electronic transitions. These rings also display fragmentation effects under 364 nm light irradiation. The neutral Se2 band at ~382 cm−1 and its overtone at ~762 cm−1 are observed in the AFI-Se(HD) aa spectrum excited with 364 nm light (Figure 11c). Similar bands at lower frequencies ~377 cm−1 and ~750 cm−1 are present in the RS of LTA-Se [Figure 11d]. Both ~382 cm−1 and ~377 cm−1 frequencies are close to the ~386 cm−1 fundamental frequency of neutral Se2 [63]. One can expect that Se2− anions rather than neutral Se2 molecules, to be stabilized in the zeolites. However, with this assumption, we should expect the same effect as was observed in sodalite with selenium (SOD-Se) under 364 nm irradiation [63], where Se2− anions with the absorption band at ~3.4 eV [64] were photo-ionized due to perfect resonance with 364 nm light. Thus, neutral Se2 molecules were formed. In fact, LTA-Se with 17 Se atoms per simplified unit cell case [16] is very similar to the SOD-Se case since both samples initially contain Se2− anions.
Let us consider photoinduced effects on chalcogen rings under visible light irradiation. Importantly, Se6 interacts strongly with light at photon energies much lower than its formal electronic energy gap of ~3.2 eV since the absorption bands are rather broad and triplet excitations [Supplementary Materials Table S7a] may contribute.
Figure 12a clearly demonstrates a laser-induced heating effect on Se6 in CHA-Se at the laser excitation wavelength of 514.5 nm, corresponding to a photon energy of ~2.41 eV. Indeed, the A1g bond-stretching mode frequency decreases from ~272.5 cm−1 to ~268.5 cm−1 as the excitation laser power (P) increases from ~0.25 mW to ~1.5 mW. The heating effect causes even stronger frequency decrease of the Eg (or maybe A1u) bond-stretching mode from ~219.5 cm−1 to ~211.5 cm−1 over the same increase in laser power (Figure 12b). The laser-induced heating depends on the light polarization. The heating is stronger for the E//X than for E//Z polarization (Figure 12a, black and violet curves).
Figure 12.
(a) RS of CHA-Se at λ = 514.5 nm at different excitation powers (P) for aa-configuration (black, red, blue and green curves) and for cc-configuration at P ~1.5 mW (violet curve); (b) A1g bond-stretching-mode Raman band position dependency on P; (c) CHA-Se RS at T ~77 K (black curve) and at T ~300 K at P ~0.5 mW (red curve); (d) RS of AFI-Se(LD) in the aa-configuration at λ = 633 nm at T ~77 K with P ~1 mW (black curve), P ~0.25 mW (red curve) and their difference (blue curve), dashed line showing corresponding T ~300 K spectrum for reference.
Surprisingly, the bond-bending mode frequencies slightly increase as the laser power increases up to ~0.5 mW, then slowly decrease with a further increase in power (Figure 12b). The effect may be associated with the Se6 ring confinement in the CHA cavity, which causes bond angle contraction and an increase of the corresponding frequencies with a slight heating, when the bond lengths become larger. A similar effect is observed upon decreasing the temperature to T ~77 K [Figure 12c]. The bond-bending mode frequencies of ~103 cm−1 and ~136 cm−1 at T ~77 K are lower than those of ~105 cm−1 and ~137 cm−1 at an ambient temperature of ~300 K. (In this case, the ring temperature is slightly higher due to laser-induced heating). We also observe a non-thermal photoinduced effect in the low-temperature RS of CHA-Se, namely, the band at ~309 cm−1 and its overtone at ~617 cm−1 appear in the CHA-Se spectrum at T ~77 K. Most likely, the bands belong to Se2− anions. This may be associated with photoinduced fragmentation of Se6 to three Se2 molecules trapped in chabazite in the form of Se2− anions.
Figure 12d demonstrates a photoinduced effect with an even lower photon energy of ~1.96 eV corresponding to a 633 nm laser line. AFI-Se(LD) Raman aa-spectra were recorded at T ~77 K with excitation laser powers of ~0.25 mW (red curve) and ~1 mW (black curve). Both spectra display additional bands compared to the room-temperature spectrum, which contains nearly exclusively Se6 bands [dashed curve, see also Figure 4c]. The additional bands are more pronounced in the spectrum recorded with the ~1 mW laser power. The differential spectrum between the normalized ~1 mW and ~0.25 mW spectra is shown as a blue curve in Figure 12d. Three characteristic bands of the Se8 ring at frequencies of ~76, ~114 and ~269 cm−1 are clearly recognized. Thus, in the relatively large space of the AFI channels, more stable Se8 rings are formed at the expense of the less stable Se6 rings due to photoinduced fragmentation of Se6. We should note that prolonged illumination of AFI-Se(LD) with ~0.25 mW 633 nm light causes the same effect as the increase in the laser power.
Interestingly, we do not observe any photostructural effects for Se8 and Se12 in LTA-Se at the low-power excitations P ≤ 1 mW with the laser wavelengths of 514.5 nm or 633 nm, either at T ~300 K or T ~77 K. (We do not consider here the thermal destruction of Se12 due to photoinduced heating at higher 514.5 nm laser powers [33]). One reason for this is the higher absorption of Se6 compared to Se8 and Se12 within the 1.96–2.41 eV photon energy range. This is confirmed by the DFT-computed energy gaps of Se6, Se8 and Se12 [Figure 13a] taking into account allowed and forbidden singlet excitations [Supplementary Materials Tables S7, S10 and S11] as well as triplet excitations [Supplementary Materials Tables S7a, S10a and S11a]. We observe that the Se6 energy gap is smaller than those of Se8 and Se12. The computed energy gap of ~2.67 eV for Se6 triplet excitations is rather close to the 1.96–2.41 eV photon energy range, where the photostructural effects for Se6 are observed. Another contributing factor is the low stability of Se6 in the excited state.
Figure 13.
(a) DFT-computed energy gaps of Se rings vs. the number of Se atoms in the ring for triplet excitations (black squares), for all singlet excitations (red circles) and only allowed singlet excitations (blue triangles); (b) schematical representation of potential energy surfaces of the ground state (GS, S0) and the lowest singlet excited state (ES, S1) of the Se6 ring from DFT calculations. The approximate conical intersection (CI, S0/S1) lies about 1.73 eV above the S0 minimum. The horizontal axis denotes schematically the configuration coordinate for CI–S0 relaxation. The S0 minimum energy structure (D3d) and the approximate CI (Cs) are annotated with their bond lengths.
Let us consider possible structural effects for Se6 in its excited state. While our methods do not allow the calculation of relativistic effects required for accurate simulation of the intensities of triplet excitations, such as the ~2.67 eV excitation, we consider the lowest forbidden singlet transition at ~3.13 eV (Figure 13b), which can be activated via electron-vibration coupling. The important point is that the excited states of the Se6(D3d) are energetically very close to those of some other, less-stable forms of Se6.
Figure 13b demonstrates a conical intersection (CI) between the potential energy surfaces of the ground state (GS, S0) and the lowest singlet excited state (ES, S1) of the Se6 molecule. The DFT calculations were performed using the PBE0 functional [20] and the def2-TZVP basis set [22]. The approximate conical intersection (CI, S0/S1) was obtained by minimizing the S0–S1 energy gap. The computed energy differences do not include zero-point vibrational corrections. Se6 with the Cs structure, corresponding to CI, is shown in Figure 13b inset.
The Se6(Cs) structure is unstable. It can disintegrate, for example, into Se4 + Se2. The appearance of Se2− in CHA-Se after 514.5 nm light irradiation and an increase in amount of Se8 in AFI-Se(LD) due to 633 nm light exposure confirm this. Importantly, we observe these effects at T ~77 K and do not observe them at T ~300 K. Most likely, relaxation of the photo-excited Se6(D3d) to its ground state at T ~300 K occurs via vibrations without conversion to unstable forms of Se6. However, at T ~77 K, vibrational relaxation is not sufficiently effective. Conversion of Se6(D3d) into unstable forms, such as Se6(Cs), followed by disintegration, becomes much more likely. This is why we observe formation of Se2− in irradiated CHA-Se and increase of amount of Se8 in irradiated AFI-Se(LD) at T ~77 K.
To summarize this section, we observe a rather strong interaction of the zeolite-confined chalcogen rings with light. The interaction is very strong in case of the UV light exposure. Under the 364 nm wavelength light irradiation, S8 and Se8/Se12 rings disintegrate producing mainly diatomic molecules, S42− also being identified in case of LTA-S. Under normal conditions, at room temperature and with low-power visible light excitation, all chalcogen rings exhibit ordinary heating depending on their absorbance. A peculiarity of heating a molecule in the restricted space of a zeolite cavity is that the molecule bond lengths increase while bond angles decrease. Correspondingly, the molecule bond-stretching mode frequencies decrease while the bond-bending mode frequencies increase. Se6 rings in CHA-Se clearly demonstrate this. At T ~77 K with no heating effect, the Se6 rings disintegrate under rather low photon energy (~1.96 eV and ~2.41 eV) light irradiation. This is associated with (1) their non-zero absorption of Se6 in this spectral range due to their triplet excitations, and (2) conversion of the stable form of Se6(D3d) in the excited state to unstable ones. An example of conical intersection producing Se6(Cs) is also presented.
4. Conclusions
S, Se and Te ring clusters were examined experimentally using RS and OAS as well as theoretically using DFT. Incorporation of the rings into free spaces of zeolite single crystals (LTA, MOR, AFI, CHA) allowed us to study the polarized RS and OAS of oriented rings and compare them with the corresponding spectra computed using DFT. Firstly, we determined structural parameters of the rings [Supplementary Materials Table S1], which appeared to be close to the known experimental values for S8 (our r = 204.7 pm, ϕ = 108.4° vs. r = 204.6 pm, ϕ = 108.2° [65]), Se6 [our r = 233.6 pm, ϕ = 101.4° vs. r = 238 pm, ϕ = 101.1° [44] (the experimental value of 238 pm in rhombohedral crystal is slightly larger than that of individual Se6)] and Se8 (our r = 232.7 pm, ϕ = 106.9° vs. r = 233.4 pm, ϕ = 105.8° [66]). Regarding RS and OAS, we have found a very reasonable agreement between the experimental and theoretical spectra of S8, Se6, Se8, Se12, Te6 and Te8 rings. The agreement is nearly perfect for the bond-bending mode Raman frequencies and intensities. However, the computed bond-stretching mode frequencies of S and Se rings are overestimated compared with the experimental values because of the absence of anharmonic effects. Scaling factors [36] improve the agreement. No significant discrepancy occurs for Te rings. DFT-computed OAS of the S8, Se6, Se8, Se12, Te6 and Te8 rings generally show good agreement with experimental results. However, experimental OAS show some features with photon energies lower than those of the computed allowed singlet electron transitions. We demonstrate activation of the low-energy forbidden singlet electron transitions of Se6 at 3.1–3.4 eV due to interaction of electrons with antisymmetric vibrational modes, the energy of the first allowed singlet transition being ~3.66 eV. Even a lower energy of ~2.67 eV is suggested by the DFT-computed triplet electron excitation of Se6. Experimentally, no distinct Se6 absorption band was observed; only a tail appeared in this spectral range. Photostructural effects due to the exposure of Se6 to ~1.96 eV and ~2.41 eV light at T ~77 K are observed. Conversion of the stable form of Se6(D3d) in the excited state to unstable ones likely follows a complex mechanism. An example of a conical intersection producing Se6(Cs) is considered. Importantly, at the same conditions, no such effect is observed for Se8, which possesses a larger triplet and singlet energy gap than Se6. Since Se8 is a building block of a-Se [67], we can conclude that the photostructural effects in this material, induced by the 1.96–2.41 eV light, are not related to individual Se8 rings, although rings interacting with neighboring rings or chains, and thus exhibiting a reduced energy gap, may be responsible for these effects. In contrast, individual Se8 and S8 rings display fragmentation due to exposure to 364 nm (3.41 eV) UV light at room temperature. This photon energy corresponds to the Se8 singlet excitations and S8 triplet excitations below the singlet electron transition energies. Conical intersections can be responsible for the effects.
Taking into account recent publications on intramolecular dispersion forces in large chalcogen rings [68], infrared spectra of sulfur allotropes, their fragmentation and presence in the interstellar space and atmosphere of planets [69], lone-pair-enabled polymorphism and photostructural changes in chalcogenide glasses [70], structural and optical properties of chalcogen chains and nanowires [71,72,73,74,75,76,77], etc., we consider our work as an important contribution to this rapidly developing field of science. Applications in medicine hold particular promise for novel materials like MXenes [78] and Se nanoparticles [79] due to their antibacterial properties.
Supplementary Materials
The following supporting information can be downloaded at: https://www.mdpi.com/article/10.3390/analytica7020032/s1.
Author Contributions
Conceptualization, V.V.P. and D.R.; methodology, V.V.P. and D.R.; software, D.R.; validation, V.V.P. and D.R.; formal analysis, V.V.P. and D.R. investigation, V.V.P. and D.R.; resources, V.V.P.; data curation, V.V.P.; writing—original draft preparation, V.V.P.; writing—review and editing, V.V.P. and D.R.; visualization, V.V.P. and D.R.; supervision, V.V.P.; project administration, V.V.P. All authors have read and agreed to the published version of the manuscript.
Funding
This research received no external funding.
Data Availability Statement
The data are available on request.
Acknowledgments
We thank V.P. Petranovskii, S.G. Romanov, S.V. Kholodkevich, V.V. Zhuravlev, Y.A. Barnakov and A.V. Fokin for sample preparation.
Conflicts of Interest
D.R. is an employee of Dayhoff Labs Inc., 1 Mifflin Place, Suite 419, Cambridge, MA 02138, USA.
Abbreviations
The following abbreviations are used in this manuscript:
| RS | Raman spectra |
| OAS | Optical absorption spectra |
| LTA | Linde type zeolite A |
| MOR | Mordenite |
| CHA | Chabazite |
| AFI | AlPO4-5 |
| DFT | Density functional theory |
| CI | Conical intersection |
References
- Smith, W. Effect of light on selenium during the passage of electric current. Nature 1873, 7, 303. [Google Scholar] [CrossRef]
- Adams, W.G.; Day, R.E. The action of light on selenium. Proc. R. Soc. 1876, 25, 113. [Google Scholar] [CrossRef]
- Hadar, I.; Song, T.-B.; Ke, W.; Kanatzidis, M.G. Modern Processing and Insights on Selenium Solar Cells: The World’s First Photovoltaic Device. Adv. Energy Mater. 2019, 9, 1802766. [Google Scholar] [CrossRef]
- Zhang, H.; Liu, C.-X.; Qi, X.-L.; Dai, X.; Fang, Z.; Zhang, S.-C. Topological insulators in Bi2Se3, Bi2Te3 and Sb2Te3 with a single Dirac cone on the surface. Nat. Phys. 2009, 5, 438–442. [Google Scholar] [CrossRef]
- Cao, T.; Wang, R.; Simpson, R.E.; Li, G. Photonic Ge-Sb-Te phase change metamaterials and their applications. Prog. Quantum Electron. 2020, 74, 100299. [Google Scholar] [CrossRef]
- Reznik, A.; Baranovskii, S.D.; Rubel, O.; Juska, G.; Kasap, S.O.; Ohkawa, Y.; Tanioka, K.; Rowlands, J.A. Avalanche multiplication phenomenon in amorphous semiconductors: Amorphous selenium versus hydrogenated amorphous silicon. J. Appl. Phys. 2007, 102, 053711. [Google Scholar] [CrossRef]
- Mendes, T.C.; Nguyen, C.; Barlow, A.J.; Cherepanov, P.; Forsyth, M.; Howlett, P.C.; MacFarlane, D.R. A safe Li-Se battery in an ionic liquid-based electrolyte operating at 25–70 °C by using a N,S,O tri-doped mesoporous carbon host material. Sustain. Energy Fuels 2020, 4, 2322–2332. [Google Scholar] [CrossRef]
- Mal, J.; Veneman, W.J.; Nancharaiah, Y.V.; van Hullebusch, E.D.; Peijnenburg, W.J.G.M.; Vijver, M.G.; Lens, P.N.L. A comparison of fate and toxicity of selenite, biogenically and chemically synthesized selenium nanoparticles to zebrafish (Danio rerio) embryogenesis. Nanotoxicology 2017, 11, 87–97. [Google Scholar] [CrossRef] [PubMed]
- Elliott, S.R. Aunified model for reversible photostructural effects in chalcogenide glasses. J. Non-Cryst. Sol. 1986, 81, 71–98. [Google Scholar] [CrossRef]
- Poborchii, V.V.; Kolobov, A.V.; Tanaka, K. Photomelting of selenium at low temperature. Appl. Phys. Lett. 1999, 74, 215–217. [Google Scholar] [CrossRef]
- Franzke, Y.J.; Holzer, C.; Andersen, J.H.; Begušić, T.; Bruder, F.; Coriani, S.; Sala, F.D.; Fabiano, E.; Fedotov, D.A.; Fürst, S.; et al. TURBOMOLE: Today and Tomorrow. J. Chem. Theory Comput. 2023, 19, 6859–6890. [Google Scholar] [CrossRef] [PubMed]
- Seff, K. The Crystal Structure of a Sulfur Sorption Complex of Zeolite 4A. J. Phys. Chem. 1972, 76, 2601–2605. [Google Scholar] [CrossRef]
- Bogomolov, V.N. Liquids in ultrathin channels (Filament and cluster crystals). Usp. Fiz. Nauk. 1978, 124, 171–182. [Google Scholar] [CrossRef]
- Poborchii, V.V.; Fokin, A.V.; Shklyaev, A.A. Optical properties of extreme tellurium nanowires formed in subnanometer-diameter channels. Nanoscale Adv. 2023, 5, 220–227. [Google Scholar] [CrossRef]
- Poborchii, V.V.; Fokin, A.V. Raman and optical absorption spectra of oriented Se8 and Se12 rings formed in zeolites: Dependence on the Se loading density. Microporous Mesoporous Mater. 2022, 338, 111954. [Google Scholar] [CrossRef]
- Poborchii, V.V.; Petranovskii, V.P.; Glukhov, I.A.; Fotiadi, A.A. Optical study of oriented double-Se8-ring clusters and luminescent Se2− anions in LTA at extremely high selenium loading density. Microporous Mesoporous Mater. 2023, 348, 112395. [Google Scholar] [CrossRef]
- Poborchii, V.V.; Petranovskii, V.; Glukhov, I.A.; Fotiadi, A.A. Single crystal polarization-orientation Raman spectroscopy of zeolite LTA with confined S3− anions—High dielectric constant nanoporous material. Mater. Chem. Phys. 2024, 316, 129103. [Google Scholar] [CrossRef]
- Balasubramani, S.G.; Chen, G.P.; Coriani, S.; Diedenhofen, M.; Frank, M.S.; Franzke, Y.J.; Furche, F.; Grotjahn, R.; Harding, M.E.; Hättig, C.; et al. TURBOMOLE: Modular program suite for ab initio quantum-chemical and condensed matter simulations. J. Chem. Phys. 2020, 152, 184107. [Google Scholar] [CrossRef]
- Perdew, J.P.; Burke, K.; Ernzerhof, M. Generalized Gradient Approximation Made Simple. Phys. Rev. Lett. 1996, 77, 3865–3868. [Google Scholar] [CrossRef]
- Perdew, J.P.; Ernzerhof, M.; Burke, K. Rationale for mixing exact exchange with density functional approximations. J. Chem. Phys. 1996, 105, 9982–9985. [Google Scholar] [CrossRef]
- Eichkorn, K.; Treutler, O.; Öhm, H.; Häser, M.; Ahlrichs, R. Auxiliary Basis Sets to Approximate Coulomb Potentials. Chem. Phys. Lett. 1995, 240, 283–290, Erratum in Chem. Phys. Lett. 1995, 242, 652–660. [Google Scholar] [CrossRef]
- Weigend, F.; Ahlrichs, R. Balanced Basis Sets of Split Valence, Triple Zeta Valence and Quadruple Zeta Valence Quality for H to Rn: Design and Assessment of Accuracy. Phys. Chem. Chem. Phys. 2005, 7, 3297–3305. [Google Scholar] [CrossRef]
- Weigend, F. Accurate Coulomb-fitting basis sets for H to Rn. Phys. Chem. Chem. Phys. 2006, 8, 1057–1065. [Google Scholar] [CrossRef]
- Peterson, K.A.; Figgen, D.; Goll, E.; Stoll, H.; Dolg, M. Systematically Convergent Basis Sets with Relativistic Pseudopotentials, II. Small-Core Pseudopotentials and Correlation Consistent Basis Sets for the Post- d Group 16–18 Elements. J. Chem. Phys. 2003, 119, 11113–11123. [Google Scholar] [CrossRef]
- Rappoport, D.; Furche, F. Lagrangian Approach to Molecular Vibrational Raman Intensities Using Time-Dependent Hybrid Density Functional Theory. J. Chem. Phys. 2007, 126, 201104. [Google Scholar] [CrossRef]
- Deglmann, P.; Furche, F.; Ahlrichs, R. An Efficient Implementation of Second Analytical Derivatives for Density Functional Methods. Chem. Phys. Lett. 2002, 362, 511–518. [Google Scholar] [CrossRef]
- Deglmann, P.; May, K.; Furche, F.; Ahlrichs, R. Nuclear Second Analytical Derivative Calculations Using Auxiliary Basis Set Expansions. Chem. Phys. Lett. 2004, 384, 103–107. [Google Scholar] [CrossRef]
- Rappoport, D.; Furche, F. Property-Optimized Gaussian Basis Sets for Molecular Response Calculations. J. Chem. Phys. 2010, 133, 134105. [Google Scholar] [CrossRef]
- Bauernschmitt, R.; Ahlrichs, R. Treatment of Electronic Excitations within the Adiabatic Approximation of Time Dependent Density Functional Theory. Chem. Phys. Lett. 1996, 256, 454–464. [Google Scholar] [CrossRef]
- Bauernschmitt, R.; Häser, M.; Treutler, O.; Ahlrichs, R. Calculation of Excitation Energies within Time-Dependent Density Functional Theory Using Auxiliary Basis Set Expansions. Chem. Phys. Lett. 1997, 264, 573–578. [Google Scholar] [CrossRef]
- Bogomolov, V.N.; Petranovskii, V.P.; Poborchii, V.V.; Kholodkevich, S.V. Absorption, Raman and ESR spectra and the dielectric permittivity of NaA-S cluster crystals. Sov. Phys. Solid State 1983, 25, 1415–1417, Fiz. Tverd. Tela, 1983, 25, 2466–2470. [Google Scholar]
- Poborchii, V.V. Raman microprobe polarization measurements as a tool for studying the structure and orientation of molecules and clusters incorporated into cubic zeolites: S8 and Se12rings in zeolite A. J. Chem. Phys. 2001, 114, 2707–2717. [Google Scholar] [CrossRef]
- Poborchii, V.V. Raman spectra of sulfur, selenium or tellurium clusters confined in nano-cavities of zeolite A. Solid State Commun. 1998, 107, 513–518. [Google Scholar] [CrossRef]
- Poborchii, V.V. Polarized Raman and optical absorption spectra of the mordenite single crystals containing sulphur, selenium or tellurium confined in the one-dimensional nanochannels. Chem. Phys. Lett. 1996, 251, 230–234. [Google Scholar] [CrossRef]
- Scott, D.W.; McCollough, J.P.; Kruse, F.H. Vibrational Assignment and Force Constants of S8 from a Normal-Coordinate Treatment. J. Mol. Spec. 1964, 13, 313–320. [Google Scholar] [CrossRef]
- Tikhonov, D.S.; Gordiy, I.; Iakovlev, D.A.; Gorislav, A.A.; Kalinin, M.A.; Nikolenko, S.A.; Malaskeevich, K.M.; Yureva, K.; Matsokin, N.A.; Schnell, M. Harmonic scale factors of fundamental transitions for dispersion-corrected quantum chemical methods. Chem. Phys. Chem. 2024, 25, e202400547. [Google Scholar] [CrossRef]
- Steudel, R.; Jensen, D.; Gobel, P. Optical Absorption Spectra of the Homocyclic Sulfur Molecules Sn (n = 6, 7, 8, 9, 10, 12, 15, 20) in Solution. Ber. Bunsenges. Phys. Chern. 1988, 92, 118–122. [Google Scholar] [CrossRef]
- Datta, A. ACNDO/2 calculation of the electronic states of S8, Se4S4 and Se8. J. Mol. Struct. 1983, 92, 93–102. [Google Scholar] [CrossRef]
- Jones, R.O.; Ballone, P. Density functional and Monte Carlo studies of sulfur. I. Structure and bonding in Sn rings and chains (n=2–18). J. Chem. Phys. 2003, 118, 9257–9265. [Google Scholar] [CrossRef]
- Millefiore, S.; Alparone, A. Ab initio study of the structure and polarizability of sulfur clusters, Sn (n=2–12). J. Phys. Chem. A 2001, 105, 9489–9497. [Google Scholar] [CrossRef]
- Poborchii, V.V. Oriented Se6 ring clusters in zeolite single crystals: Polarized Raman microscopy, optical absorption spectra and photo-induced effects. Microporous Mesoporous Mater. 2020, 308, 110559. [Google Scholar] [CrossRef]
- Poborchii, V.V.; Kolobov, A.V.; Oyanagi, H.; Romanov, S.G.; Tanaka, K. Structure of selenium incorporated into nanochannels of mordenite: Dependence on ion exchange and method of incorporation. Chem. Phys. Lett. 1997, 280, 10–16. [Google Scholar] [CrossRef]
- Wirnsberger, G.; Fritzer, H.P.; Zink, R.; Popitsch, A.; Pillep, B.; Behrens, P. Isolated Se6 Rings in the Voids of a Weakly Interacting, Electroneutral, and Crystalline SiO2 Matrix: Combined Experimental and Theoretical Study. J. Phys. Chem. B 1999, 103, 5797–5801. [Google Scholar] [CrossRef]
- Nagata, K.; Ishibashi, K.; Miyamoto, Y. Raman and infrared spectra of rhombohedral selenium. Jap. J. Appl. Phys. 1981, 20, 463–469. [Google Scholar] [CrossRef]
- Hohl, D.; Jones, R.O.; Car, R.; Parrinello, M. The structure of selenium clusters—Se3 to Se8. Chem. Phys. Lett. 1987, 139, 540–545. [Google Scholar] [CrossRef]
- Oligschleger, C.; Jones, R.O.; Reimann, S.M.; Schober, H.R. Model interatomic potential for simulations in selenium. Phys. Rev. B 1996, 53, 6165–6173. [Google Scholar] [CrossRef]
- Demkov, A.A.; Sankey, O.F. Theory of zeolite supralattices: Se in zeolite Linde type A. J. Phys. Condens. Matter 2001, 13, 10433–10457. [Google Scholar] [CrossRef]
- Goldbach, A.; Saboungi, M.-L. Selenium/zeolite Y nanocomposites. Acc. Chem. Res. 2005, 38, 705–712. [Google Scholar] [CrossRef] [PubMed]
- Goldbach, A.; Iton, L.; Saboungi, M.-L. On the formation of isolated Se8 rings in zeolites. Chem. Phys. Lett. 1997, 281, 69–73. [Google Scholar] [CrossRef]
- Poborchii, V.V.; Kolobov, A.V.; Caro, J.; Zhuravlev, V.V.; Tanaka, K. Polarized Raman spectra of selenium species confined in nanochannels of AlPO4 -5 single crystals. Chem. Phys. Lett. 1997, 280, 17–23. [Google Scholar] [CrossRef]
- Poborchii, V.V.; Kolobov, A.V.; Caro, J.; Zhuravlev, V.V.; Tanaka, K. Dynamics of Single Selenium Chains Confined in One-Dimensional Nanochannels of AlPO4-5: Temperature Dependencies of the First- and Second-Order Raman Spectra. Phys. Rev. Lett. 1999, 82, 1955–1958. [Google Scholar] [CrossRef]
- Bogomolov, V.N.; Poborchii, V.V.; Kholodkevich, S.V.; Shagin, S.I. Electronic and vibrational spectra of 10-Å selenium clusters; cluster model of amorphous selenium. JETP Lett. 1983, 38, 532–535, Pis’ma Zh. Eksp. Teor. Fiz. 1983, 38, 439–441. [Google Scholar]
- Bogomolov, V.N.; Poborchii, V.V.; Kholodkevich, S.V. Size effects in the vibrational spectrum of 10-A selenium particles. JETP Lett. 1985, 42, 517–520, Pis’ma Zh. Eksp. Teor. Fiz. 1985, 42, 419–421. [Google Scholar]
- Sharma, T.; Sharma, R.; Tamboli, R.A.; Kanhere, D.G. Ab initio investigation of structural and electronic properties of selenium and tellurium clusters. Eur. Phys. J. B 2019, 92, 51. [Google Scholar] [CrossRef]
- Alparone, A. Structural, energetic and response electric properties of cyclic selenium clusters: An ab initio and density functional theory study. Theor. Chem. Acc. 2012, 131, 1239–1252. [Google Scholar] [CrossRef]
- Poborchii, V.V.; Rappoport, D. Optical study of Te8 ring clusters: Comparison with density functional theory and a step towards materials design using nanoporous zeolite space. Nanoscale 2024, 16, 9436. [Google Scholar] [CrossRef] [PubMed]
- Akola, J.; Jones, R.O. Structure and dynamics in amorphous tellurium and Ten clusters: A density functional study. Phys. Rev. B 2012, 85, 134103. [Google Scholar] [CrossRef]
- Sakaguchi, Y.; Tamura, K. Photoinduced polymerization and relaxation in liquid sulphur. J. Phys. Condens. Matter 1995, 7, 4787–4801. [Google Scholar] [CrossRef]
- Shimojo, F.; Hoshino, K.; Zempo, Y. Photo-induced bond breaking in the S8 ring: An ab initio molecular-dynamics simulation. J. Phys. Condens. Matter. 1998, 10, L177–L182. [Google Scholar] [CrossRef]
- Cho, E.; Pratik, S.M.; Pyun, J.; Coropceanu, V.; Bredas, J.-L. Ring-to-Chain Structural Relaxation of Elemental Sulfur upon Photoexcitation. ACS Mater. Lett. 2022, 4, 2362–2367. [Google Scholar] [CrossRef]
- Clark, R.J.H.; Cobbold, D.G. Characterization of sulfur radical anions in solutions of alkali polysulfides in dimethylformamide and hexamethylphosphoramide and in the solid state in ultramarine blue, green, and red. Inorg. Chem. 1978, 17, 3169–3174. [Google Scholar] [CrossRef]
- Ward, A.T. Raman spectrum and force constants of S42−. Mater. Res. Bull. 1969, 4, 581–590. [Google Scholar] [CrossRef]
- Schlaich, H.; Lindner, G.-G.; Feldmann, J.; Golbel, E.O.; Reinen, D. Optical Properties of Se2− and Se2 Color Centers in the Red Selenium Ultramarine with the Sodalite Structure. Inorg. Chem. 2000, 39, 2740–2746. [Google Scholar] [CrossRef] [PubMed]
- Poborchii, V.V.; Lindner, G.-G.; Sato, M. Selenium dimers and linear chains in one-dimensional cancrinite nanochannels: Structure, dynamics, and optical properties. J. Chem. Phys. 2002, 116, 2609–2617. [Google Scholar] [CrossRef]
- Rettig, S.J.; Trotter, J. Refinement of the structure of orthorhombic sulfur, α-S8. Acta Cryst. 1987, C43, 2260–2262. [Google Scholar] [CrossRef]
- Foss, O.; Janickis, V. Crystal structure of γ-monoclinic selenium. J. Chem. Soc. Dalton Trans. 1980, 4, 624–627. [Google Scholar] [CrossRef]
- Lu, W.; Li, Z.; Feng, M.; Zheng, L.; Liu, S.; Yan, B.; Hu, J.-S.; Xue, D.-J. Structure of amorphous selenium: Small ring big controversy. J. Am. Chem. Soc. 2024, 146, 6345–6351. [Google Scholar] [CrossRef] [PubMed]
- Gleiter, R.; Haberhauer, G.; Rominger, F. A new look on larger sulfur and selenium rings—Dispersion forces and shapes of larger cycles. Eur. J. Inorg. Chem. 2019, 34, 3846–3853. [Google Scholar] [CrossRef]
- Ferrari, P.; Berden, G.; Redlich, B.; Waters, L.B.F.M.; Bakker, J.M. Laboratory infrared spectra and fragmentation chemistry of sulfur allotropes. Nat. Commun. 2024, 15, 5928. [Google Scholar] [CrossRef]
- Kolobov, A.V.; Kuznetsov, V.G.; Krbal, M.; Zabotnov, V. Lone-pair-enabled polymorphism and photostructural changes in chalcogenide glasses. Materials 2023, 16, 6602. [Google Scholar] [CrossRef]
- Tanaka, K.; Saitoh, A. Photoluminescence in sulfur and selenium chains: Polaronic exciton dynamics. Comput. Mater. Sci. 2026, 263, 114403. [Google Scholar] [CrossRef]
- Kirczenow, G. Novel low-energy geometries of single double and triple tellurium atomic helices. J. Phys. Condens. Matter. 2025, 37, 135302. [Google Scholar] [CrossRef] [PubMed]
- Evarestov, R.A.; Porsev, V.V.; Kuruch, D.D.; Cherezova, P.Y. Torsion and axial deformations of chalcogen helical chains (S, Se, Te): First principles calculations using line symmetry groups. Nanomaterials 2025, 15, 505. [Google Scholar] [CrossRef] [PubMed]
- Cull, W.J.; Ramasse, Q.M.; Biskupek, J.; Rance, G.A.; Cardillo-Zallo, I.; Weare, B.L.; Fay, M.W.; Whitney, R.R.; Scammell, L.R.; Fernandes, J.A.; et al. Flexible selenium nanowires with tunable electronic bandgaps. Adv. Mater. 2025, 37, 2501821. [Google Scholar] [CrossRef]
- Qin, J.K.; Liao, P.Y.; Si, M.; Gao, S.; Qiu, G.; Jian, J.; Wang, Q.; Zhang, S.Q.; Huang, S.; Charnas, A.; et al. Raman Response and Transport Properties of Tellurium Atomic Chains Encapsulated in Nanotubes. Nat. Electron. 2020, 3, 141–147. [Google Scholar] [CrossRef]
- Poborchii, V.V.; Sachkov, V.A.; Shklyaev, A.A.; Fokin, A.V.; Geshev, P.I. Photonic and phononic properties of oriented 5 nm diameter tellurium nanowires. J. Phys. Chem. Sol. 2024, 185, 111806. [Google Scholar] [CrossRef]
- Poborchii, V.V.; Sachkov, V.A.; Shklyaev, A.A.; Geshev, P.I. Nano-channel anisotropic optical material containing ~5 nm diameter aligned Se nanowires with enhanced photo-structural effects and unique photonic, electronic, phononic and thermal properties. Opt. Mater. 2026, 169, 117712. [Google Scholar] [CrossRef]
- Ajmal, Z.; Qadeer, A.; Singh, K.; Al Mahmud, A.; Lakhan, M.N.; Prodeep, H.; Hussain, B.; Ullah, A.; Khan, H.R.; Ibrahim, E.H.; et al. A comprehensive review on MXenes for various applications. Appl. Energy 2025, 397, 126136. [Google Scholar] [CrossRef]
- Salah, M.; Elkabbany, N.A.S.; Partila, A.M. Evaluation of the cytotoxicity and antibacterial activity of nano-selenium prepared via gamma irradiation against cancer cell lines and bacterial species. Sci. Rep. 2024, 14, 20523. [Google Scholar] [CrossRef]
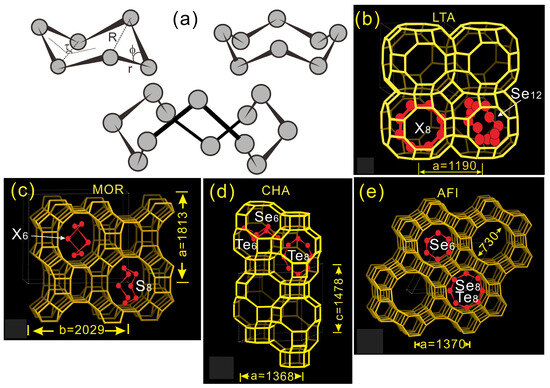
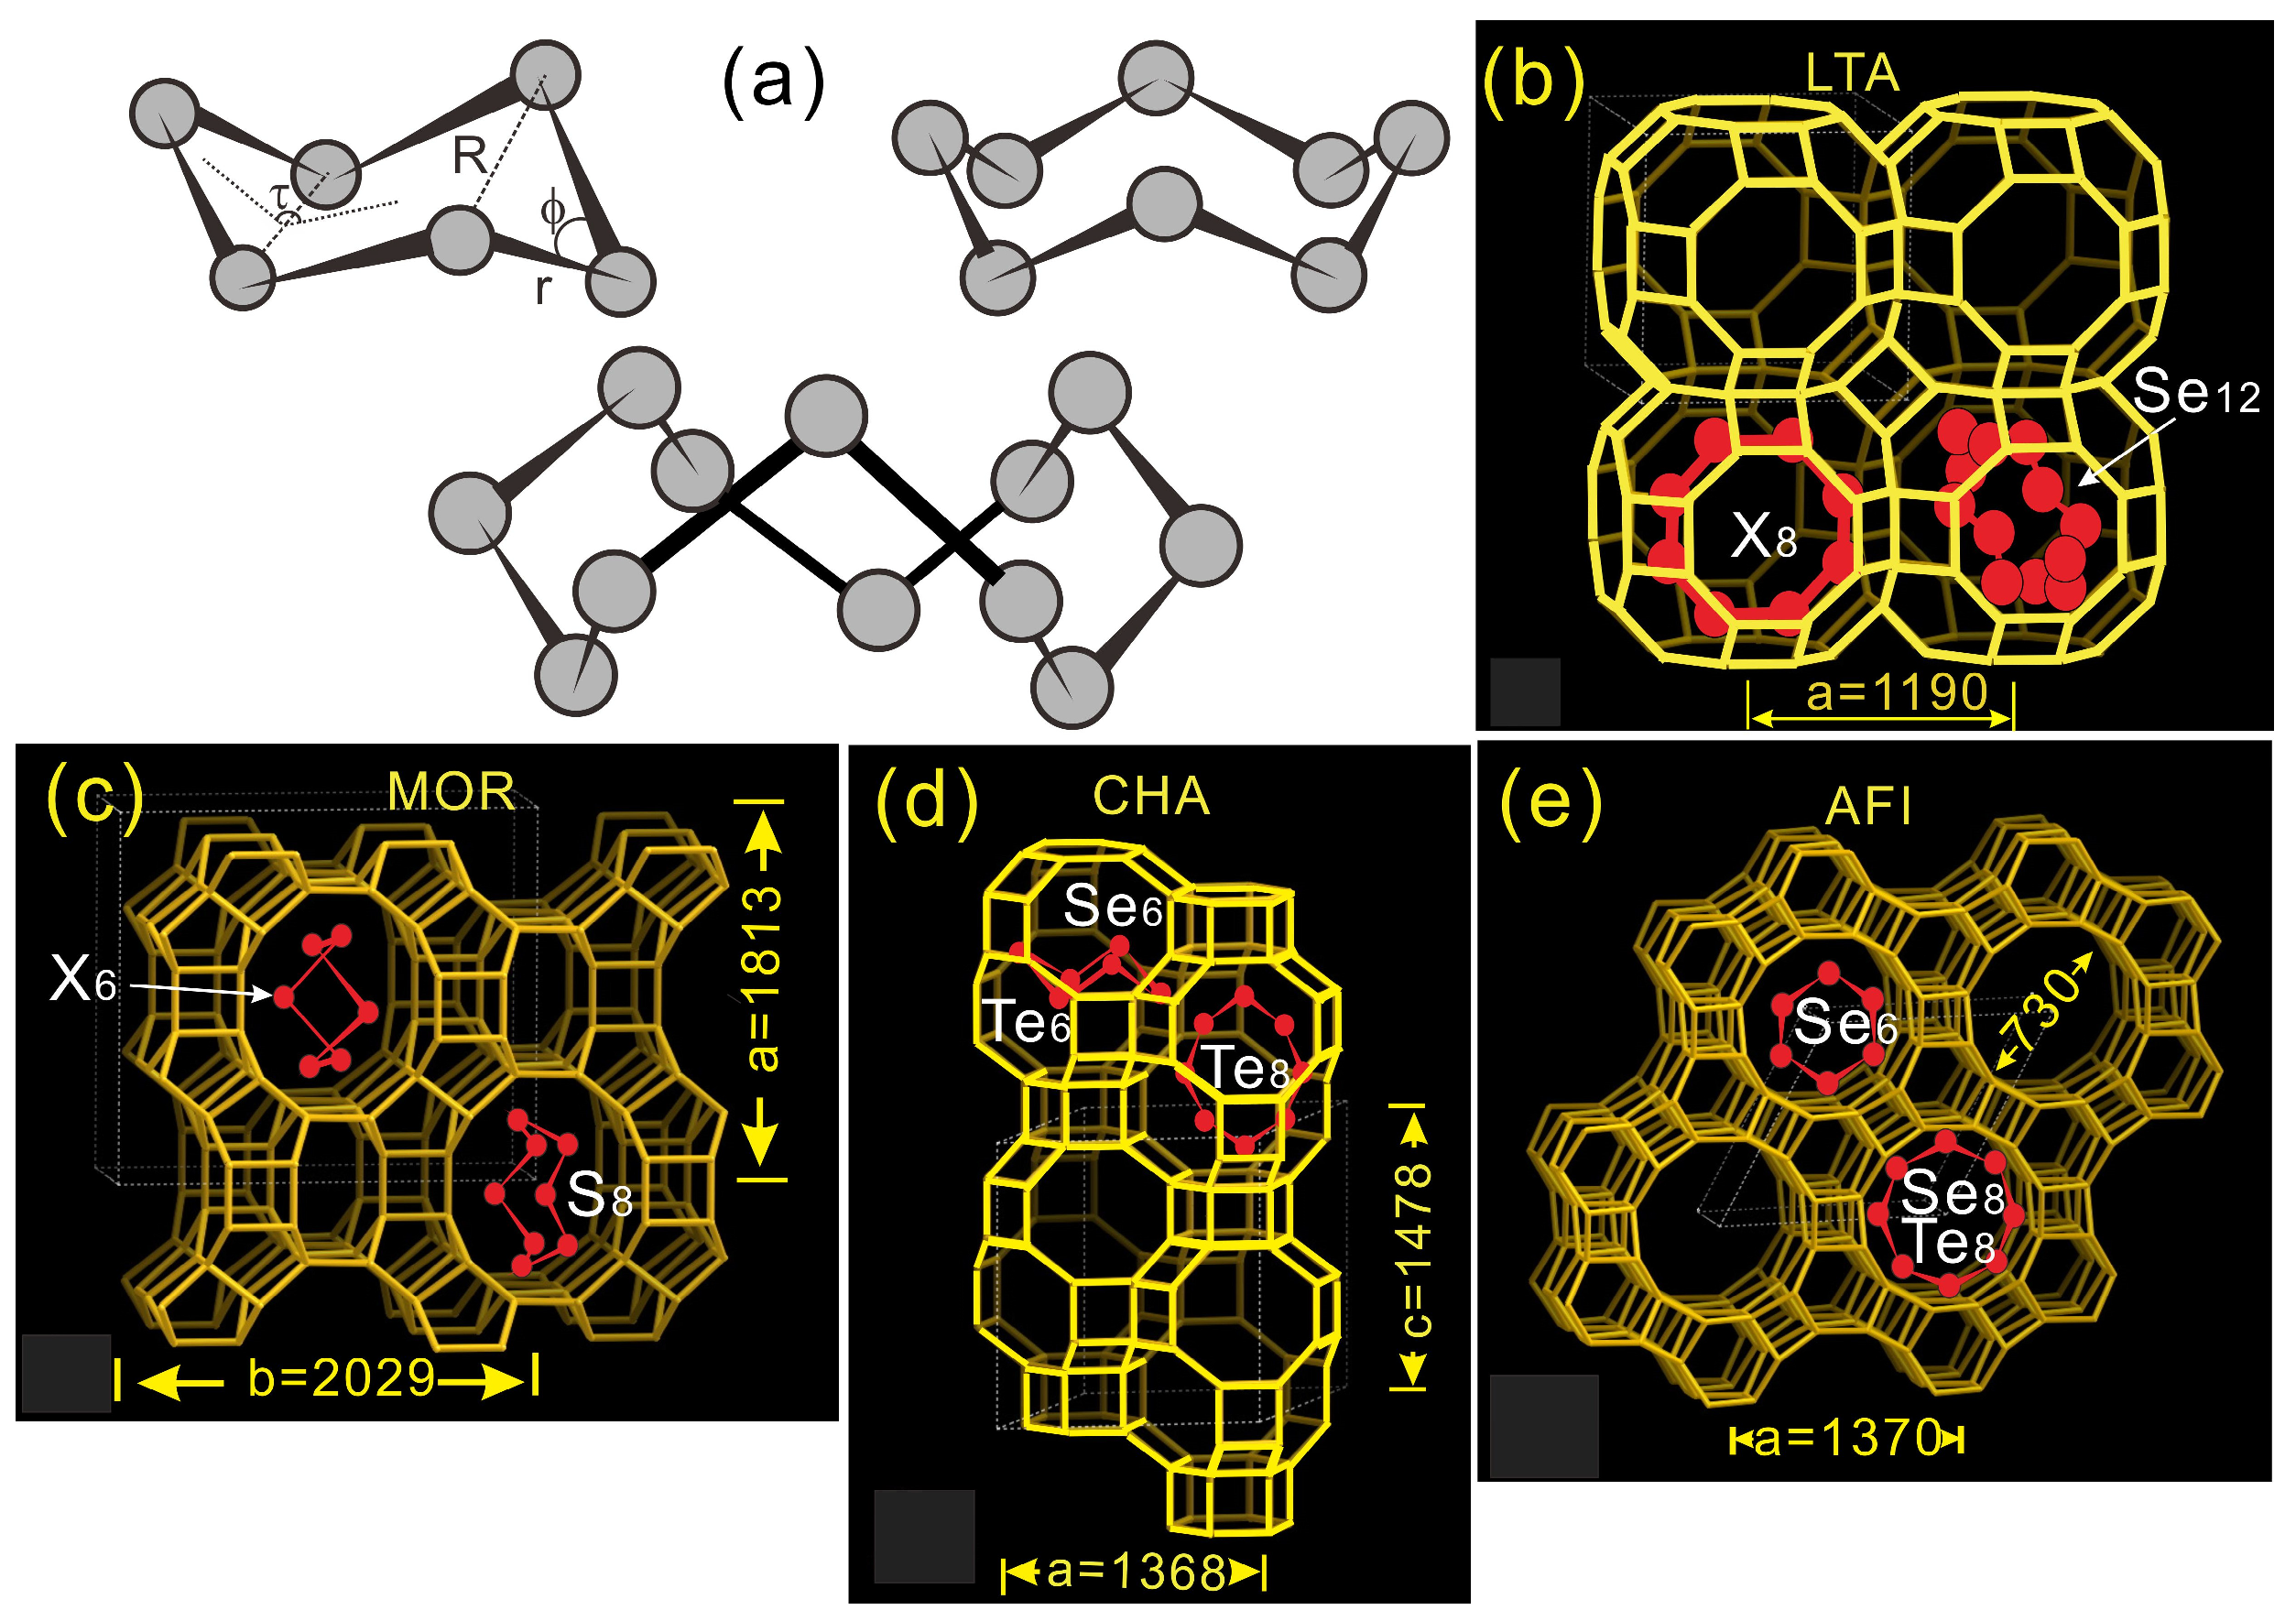
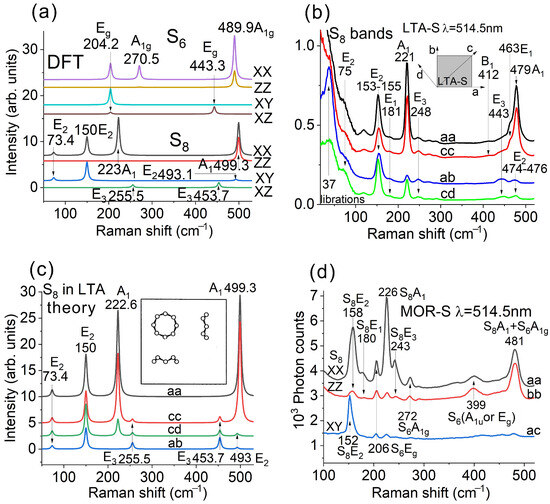
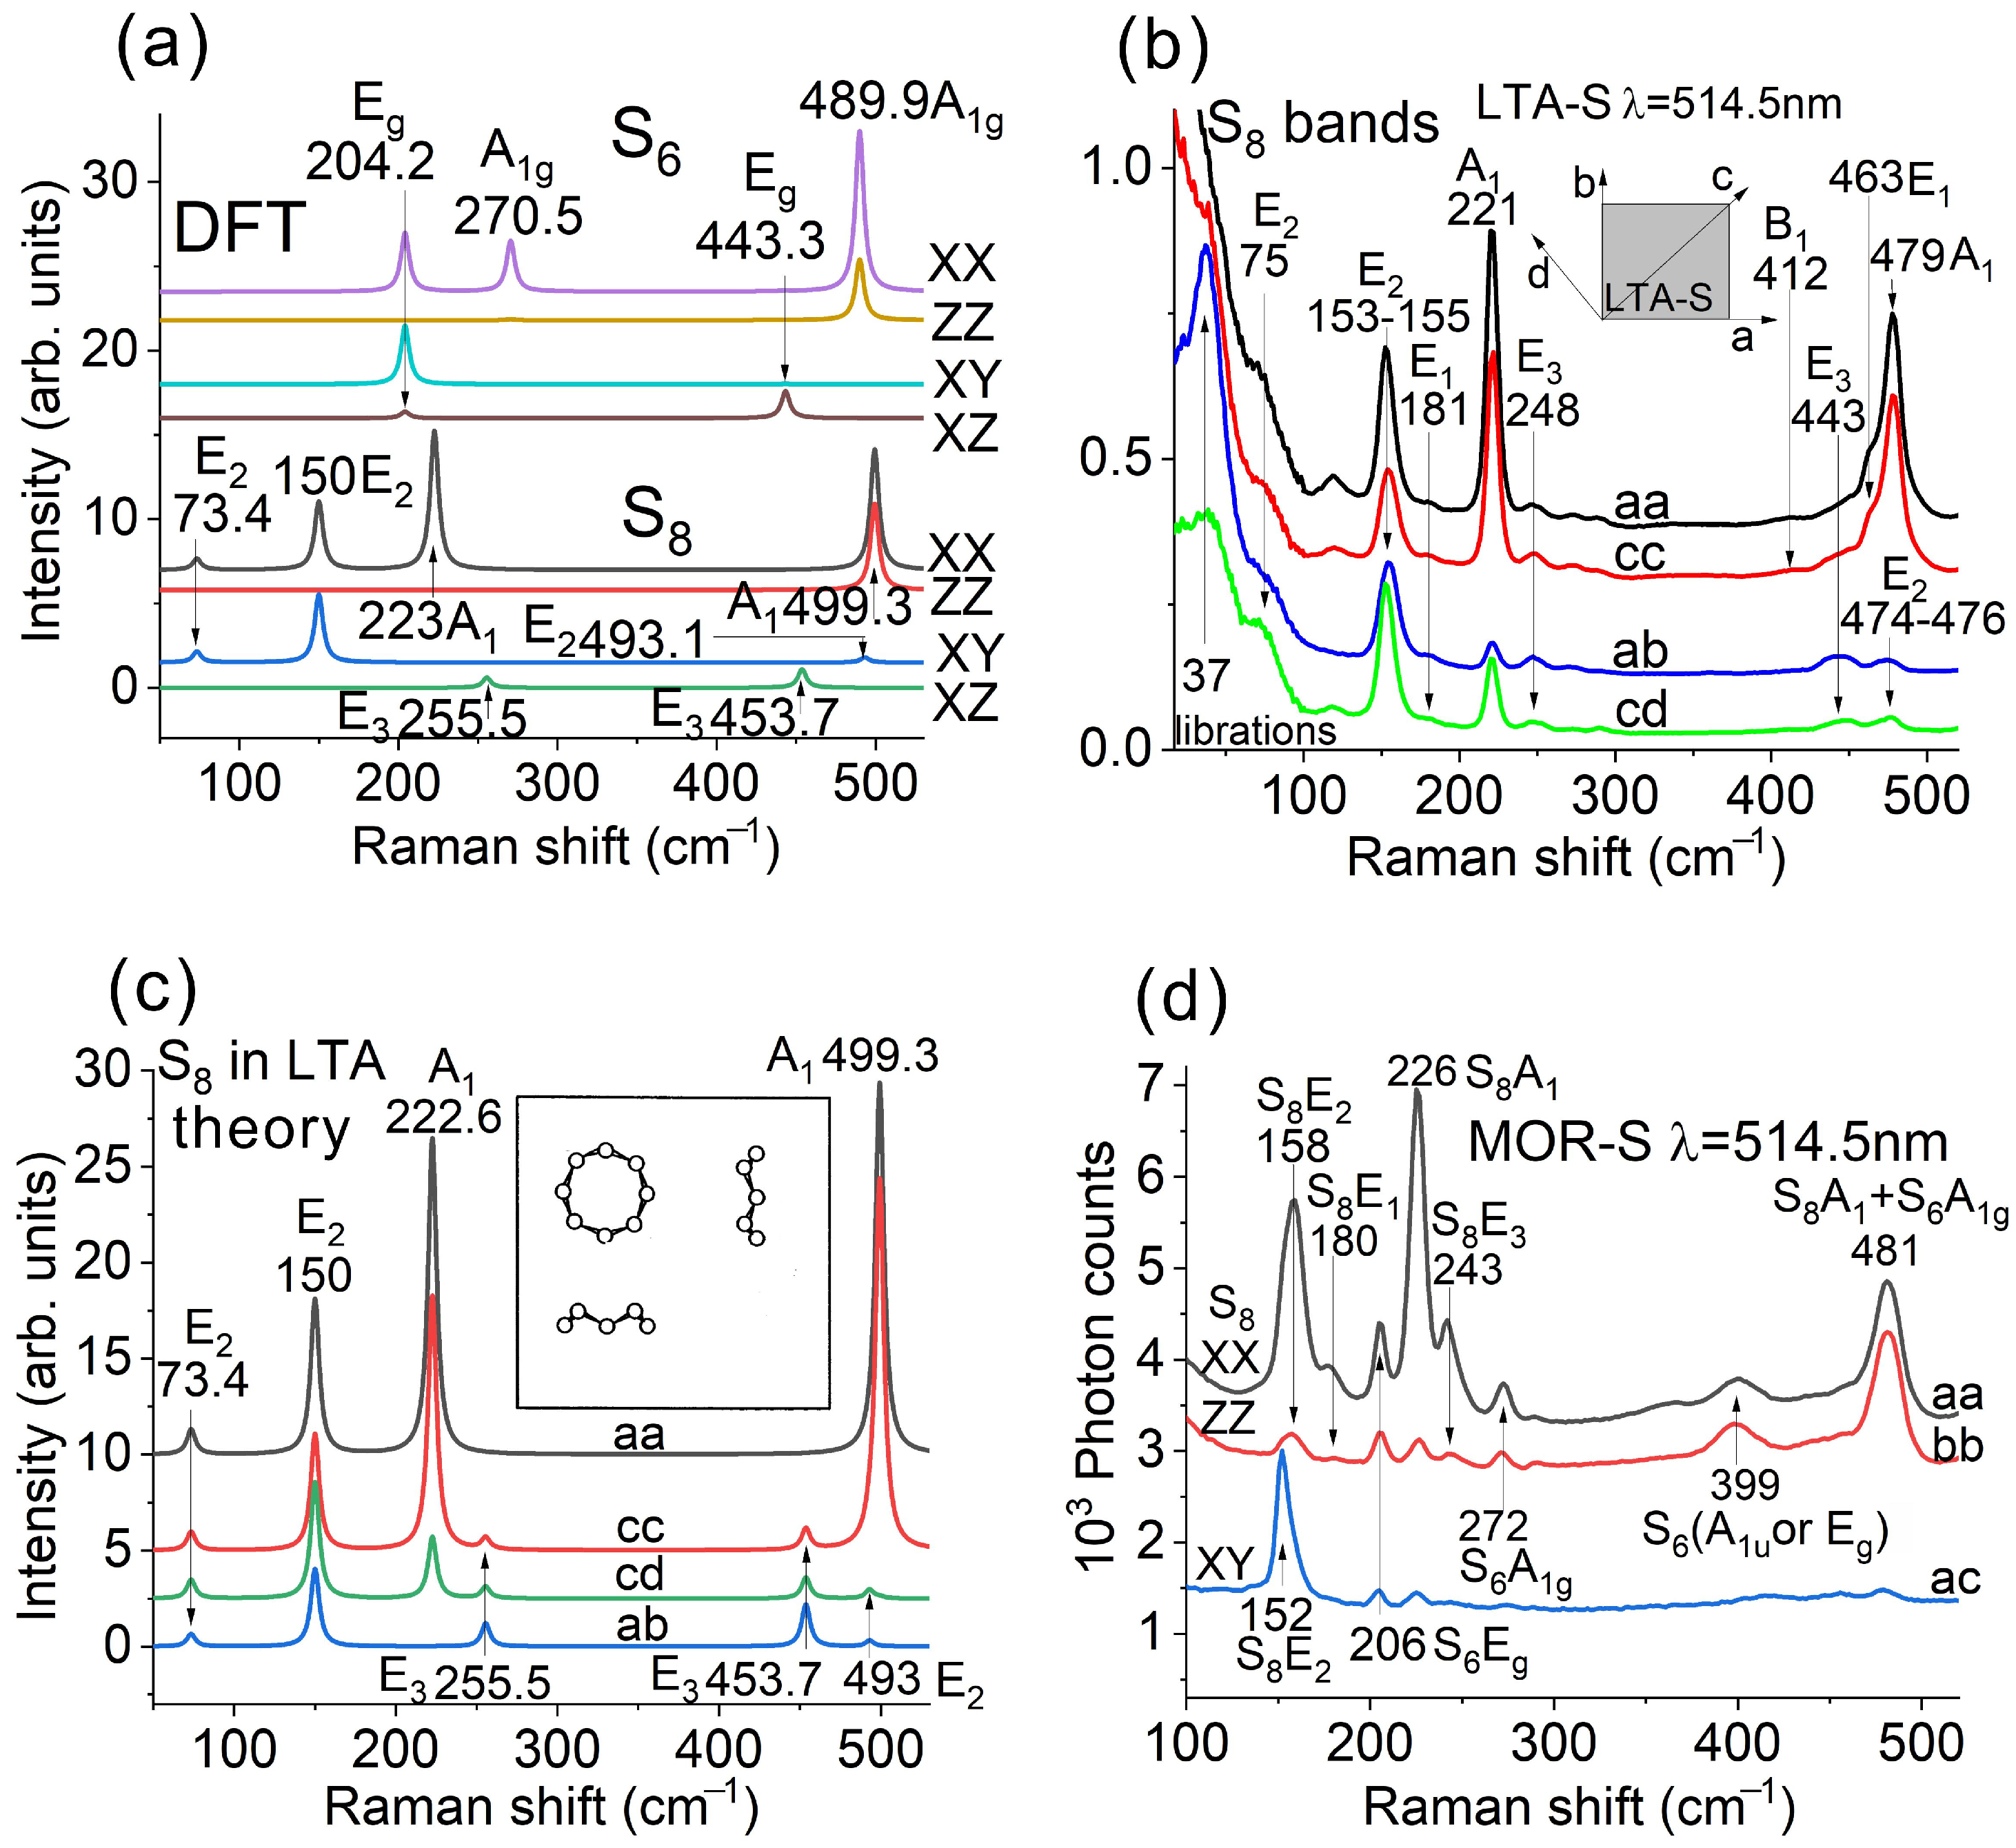
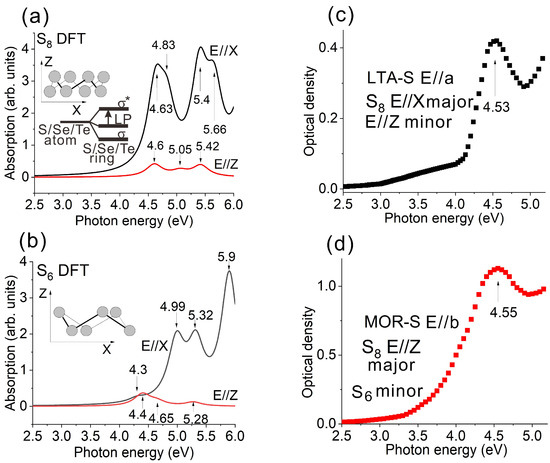
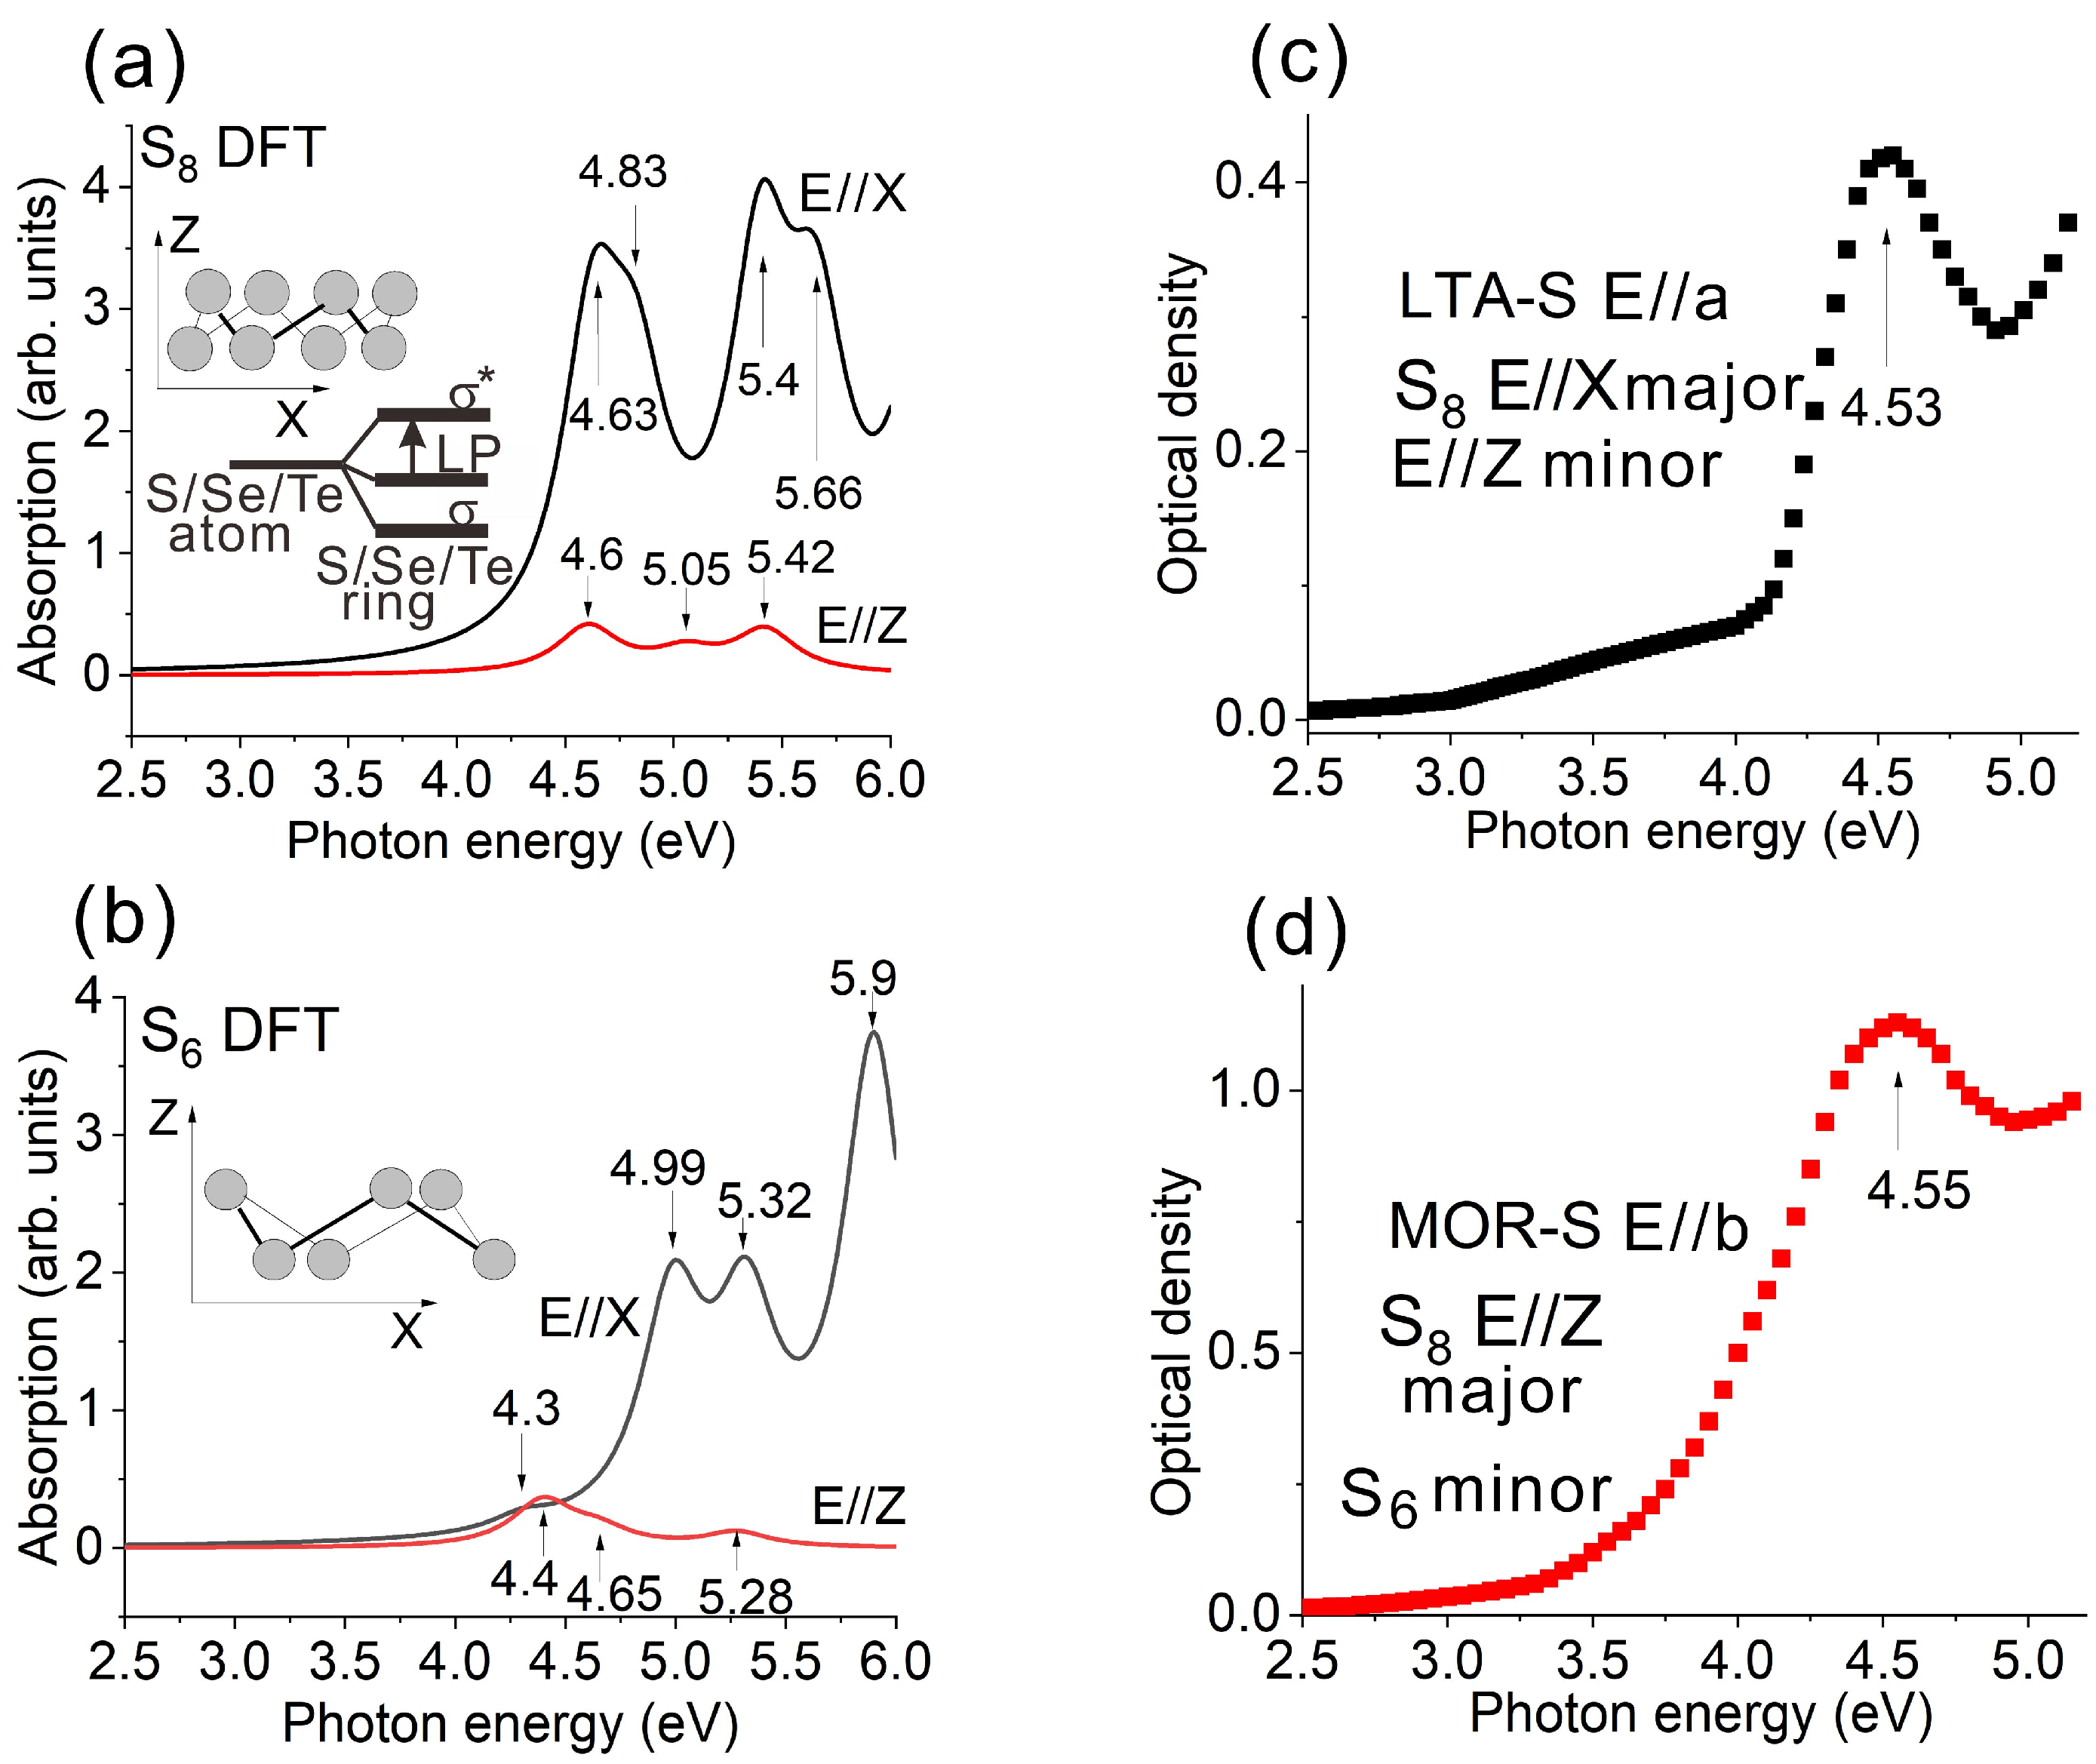
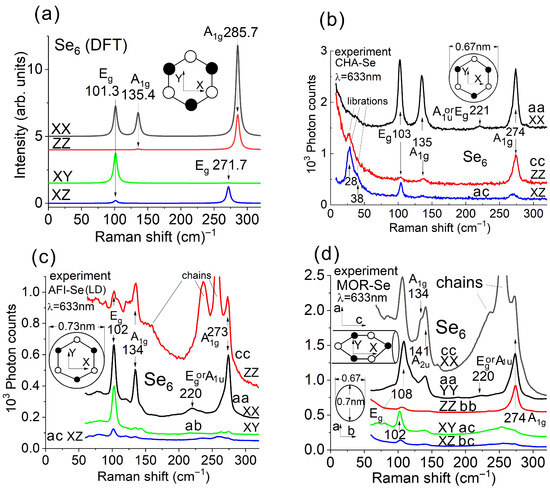
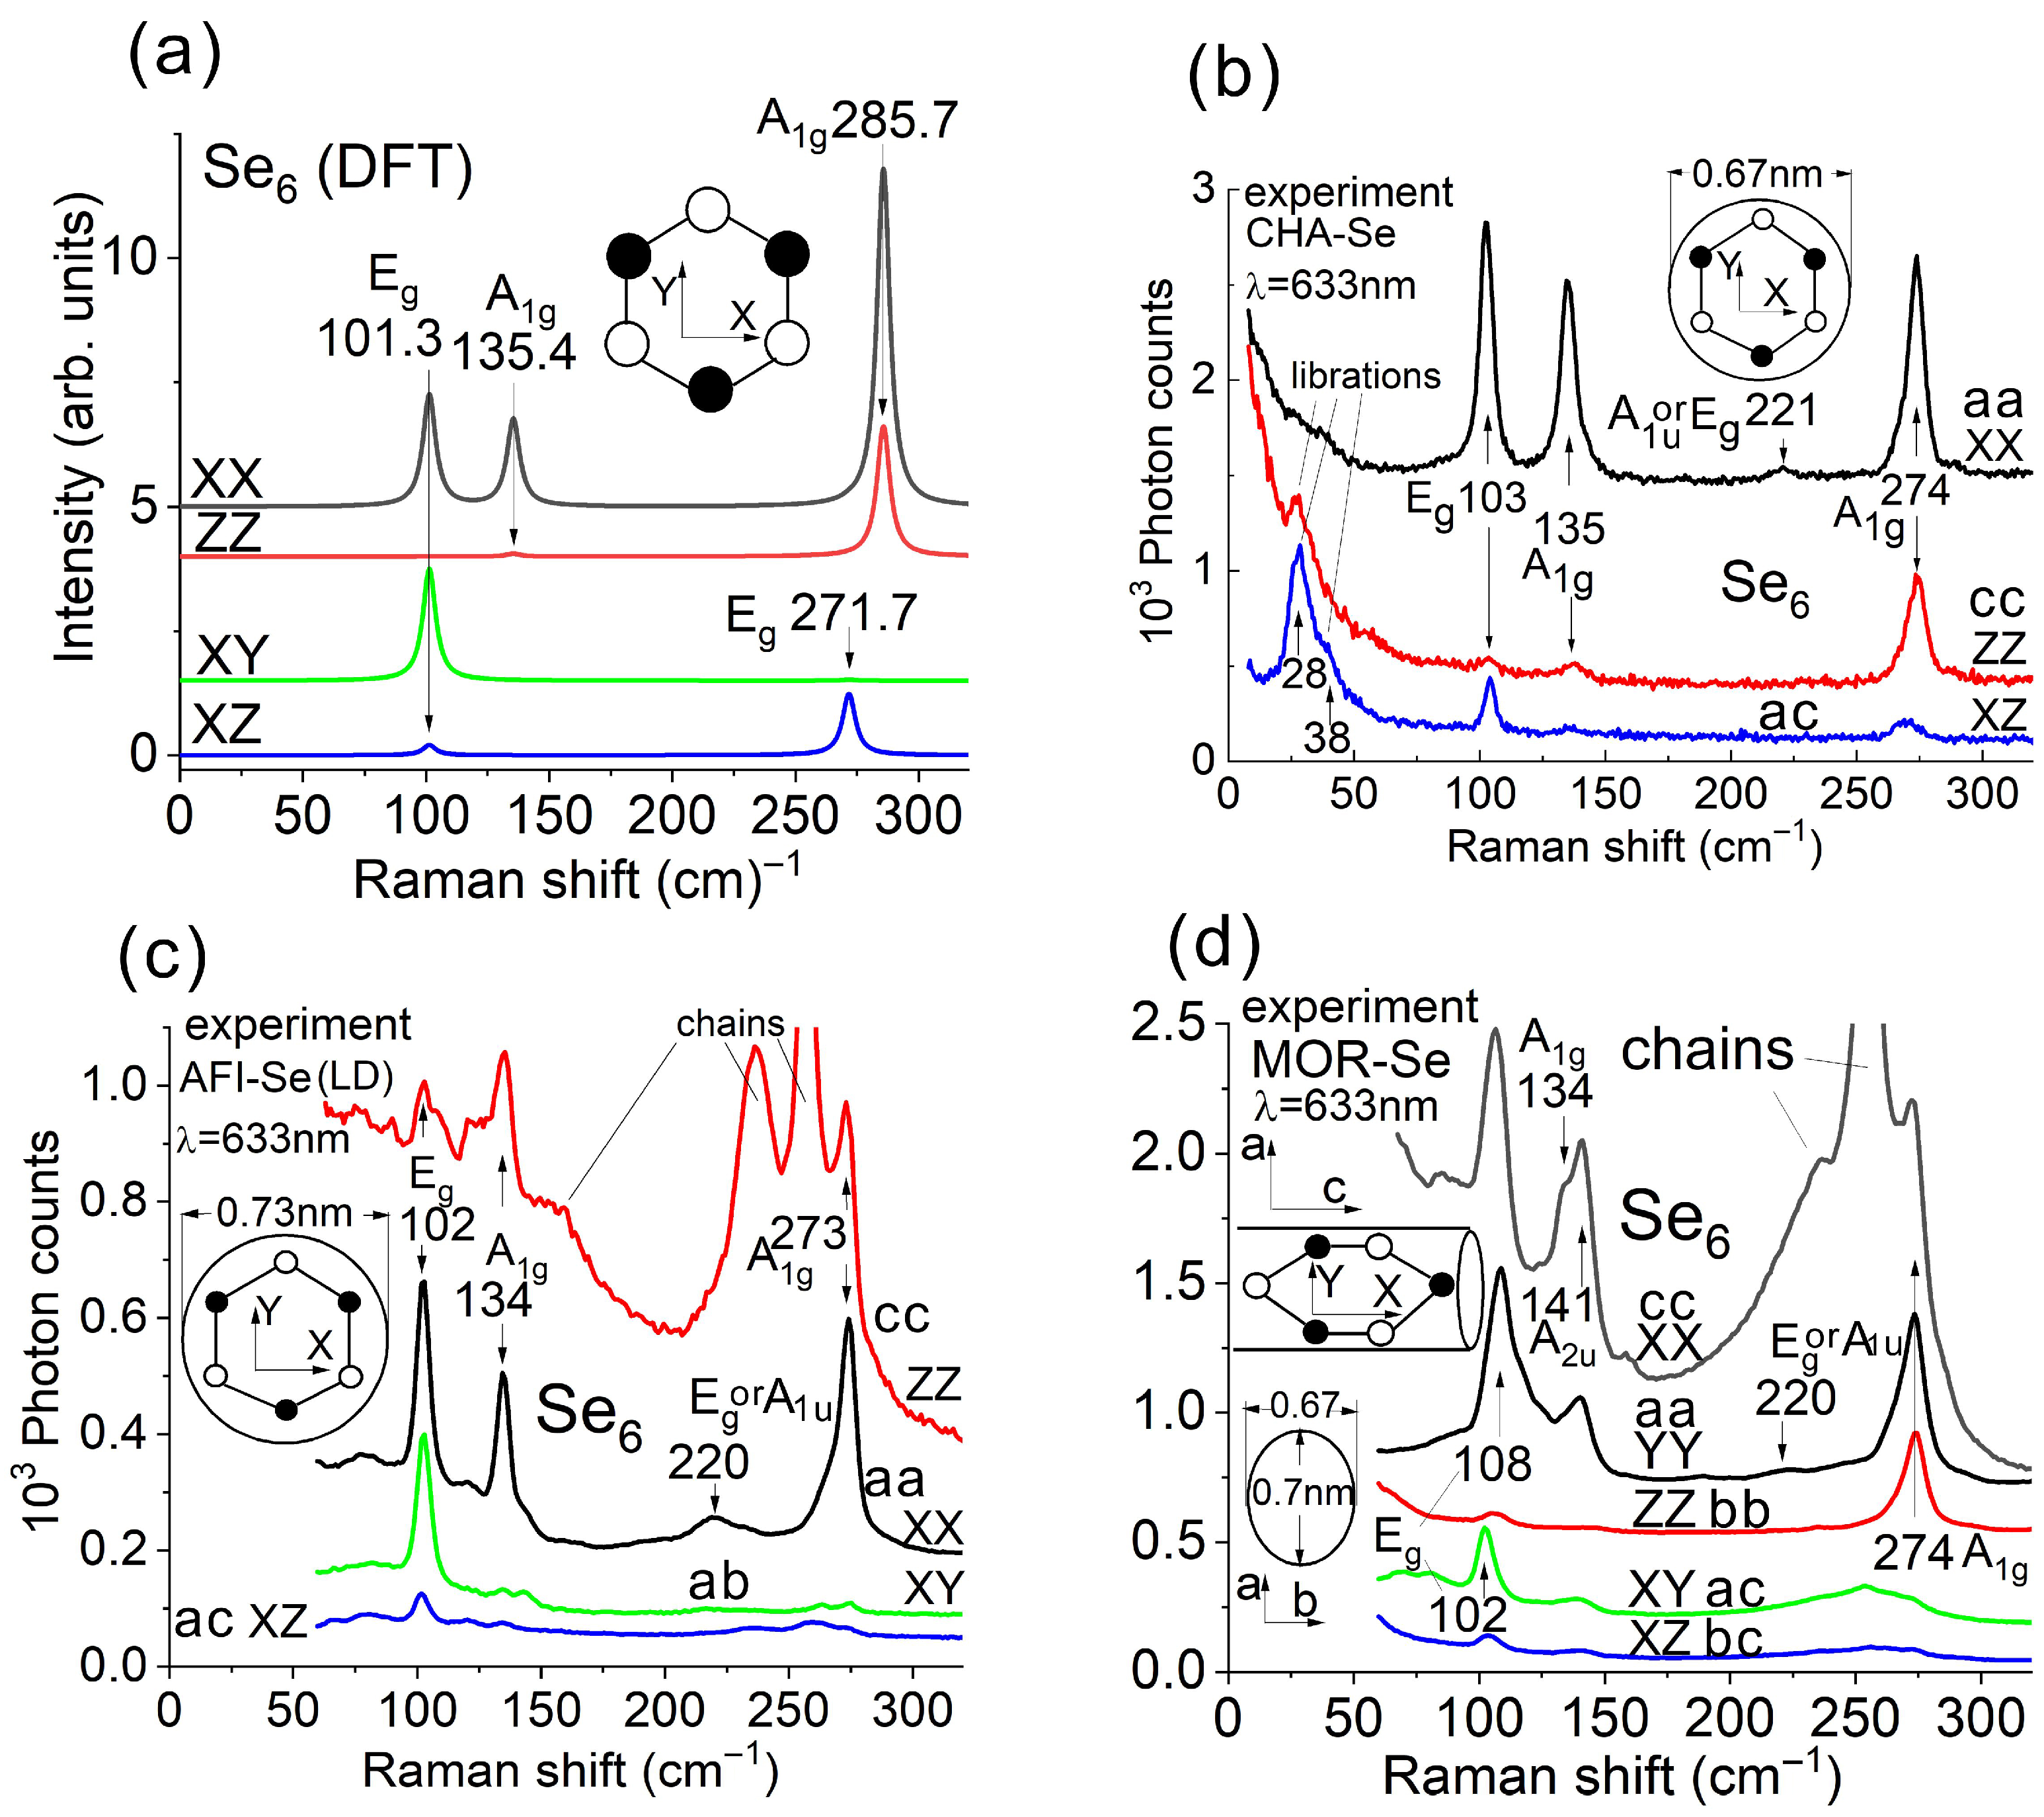
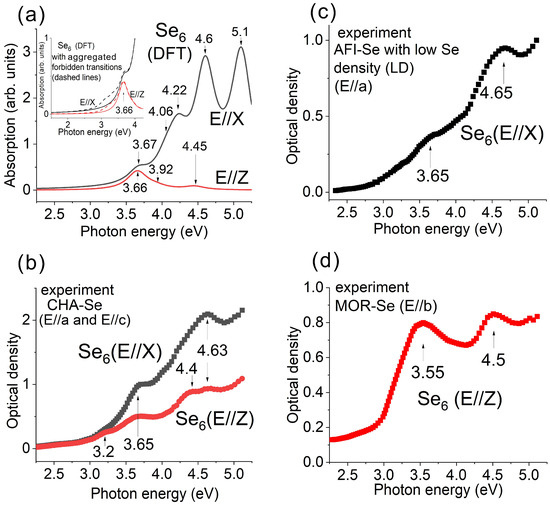
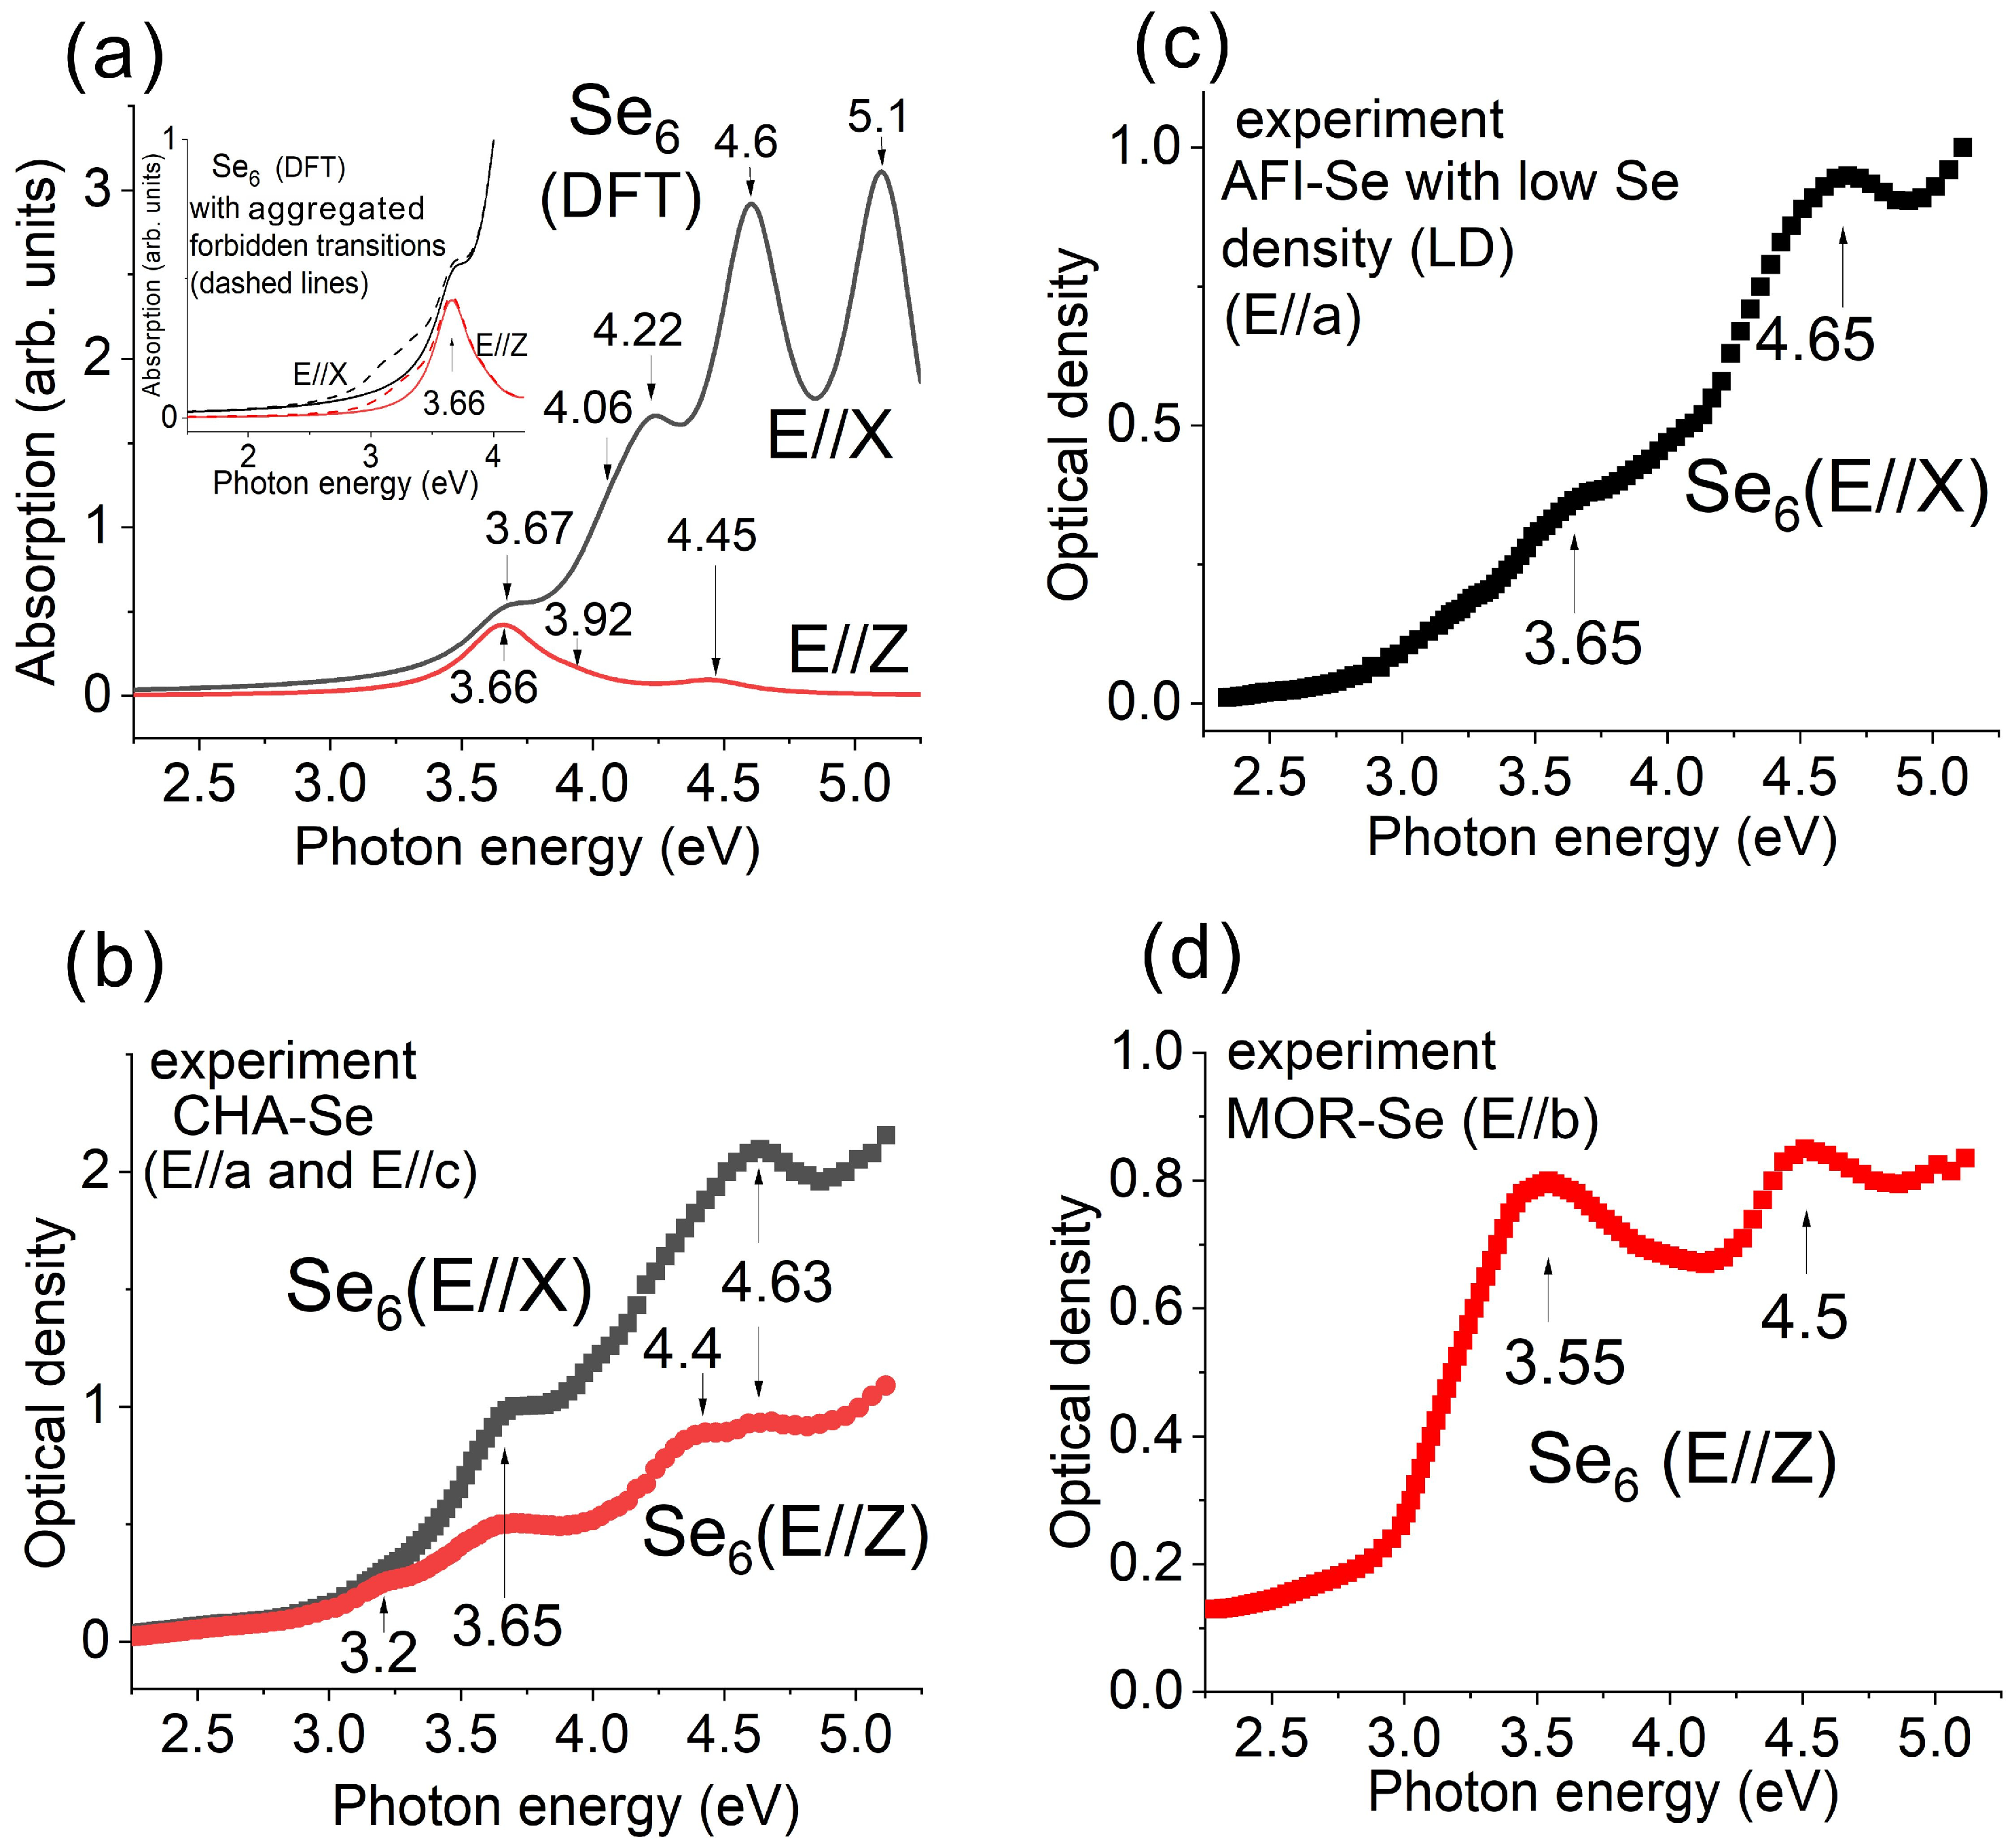
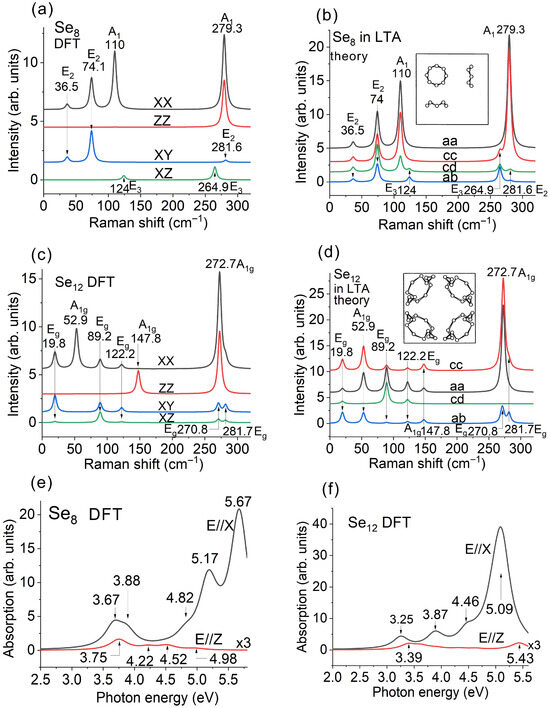
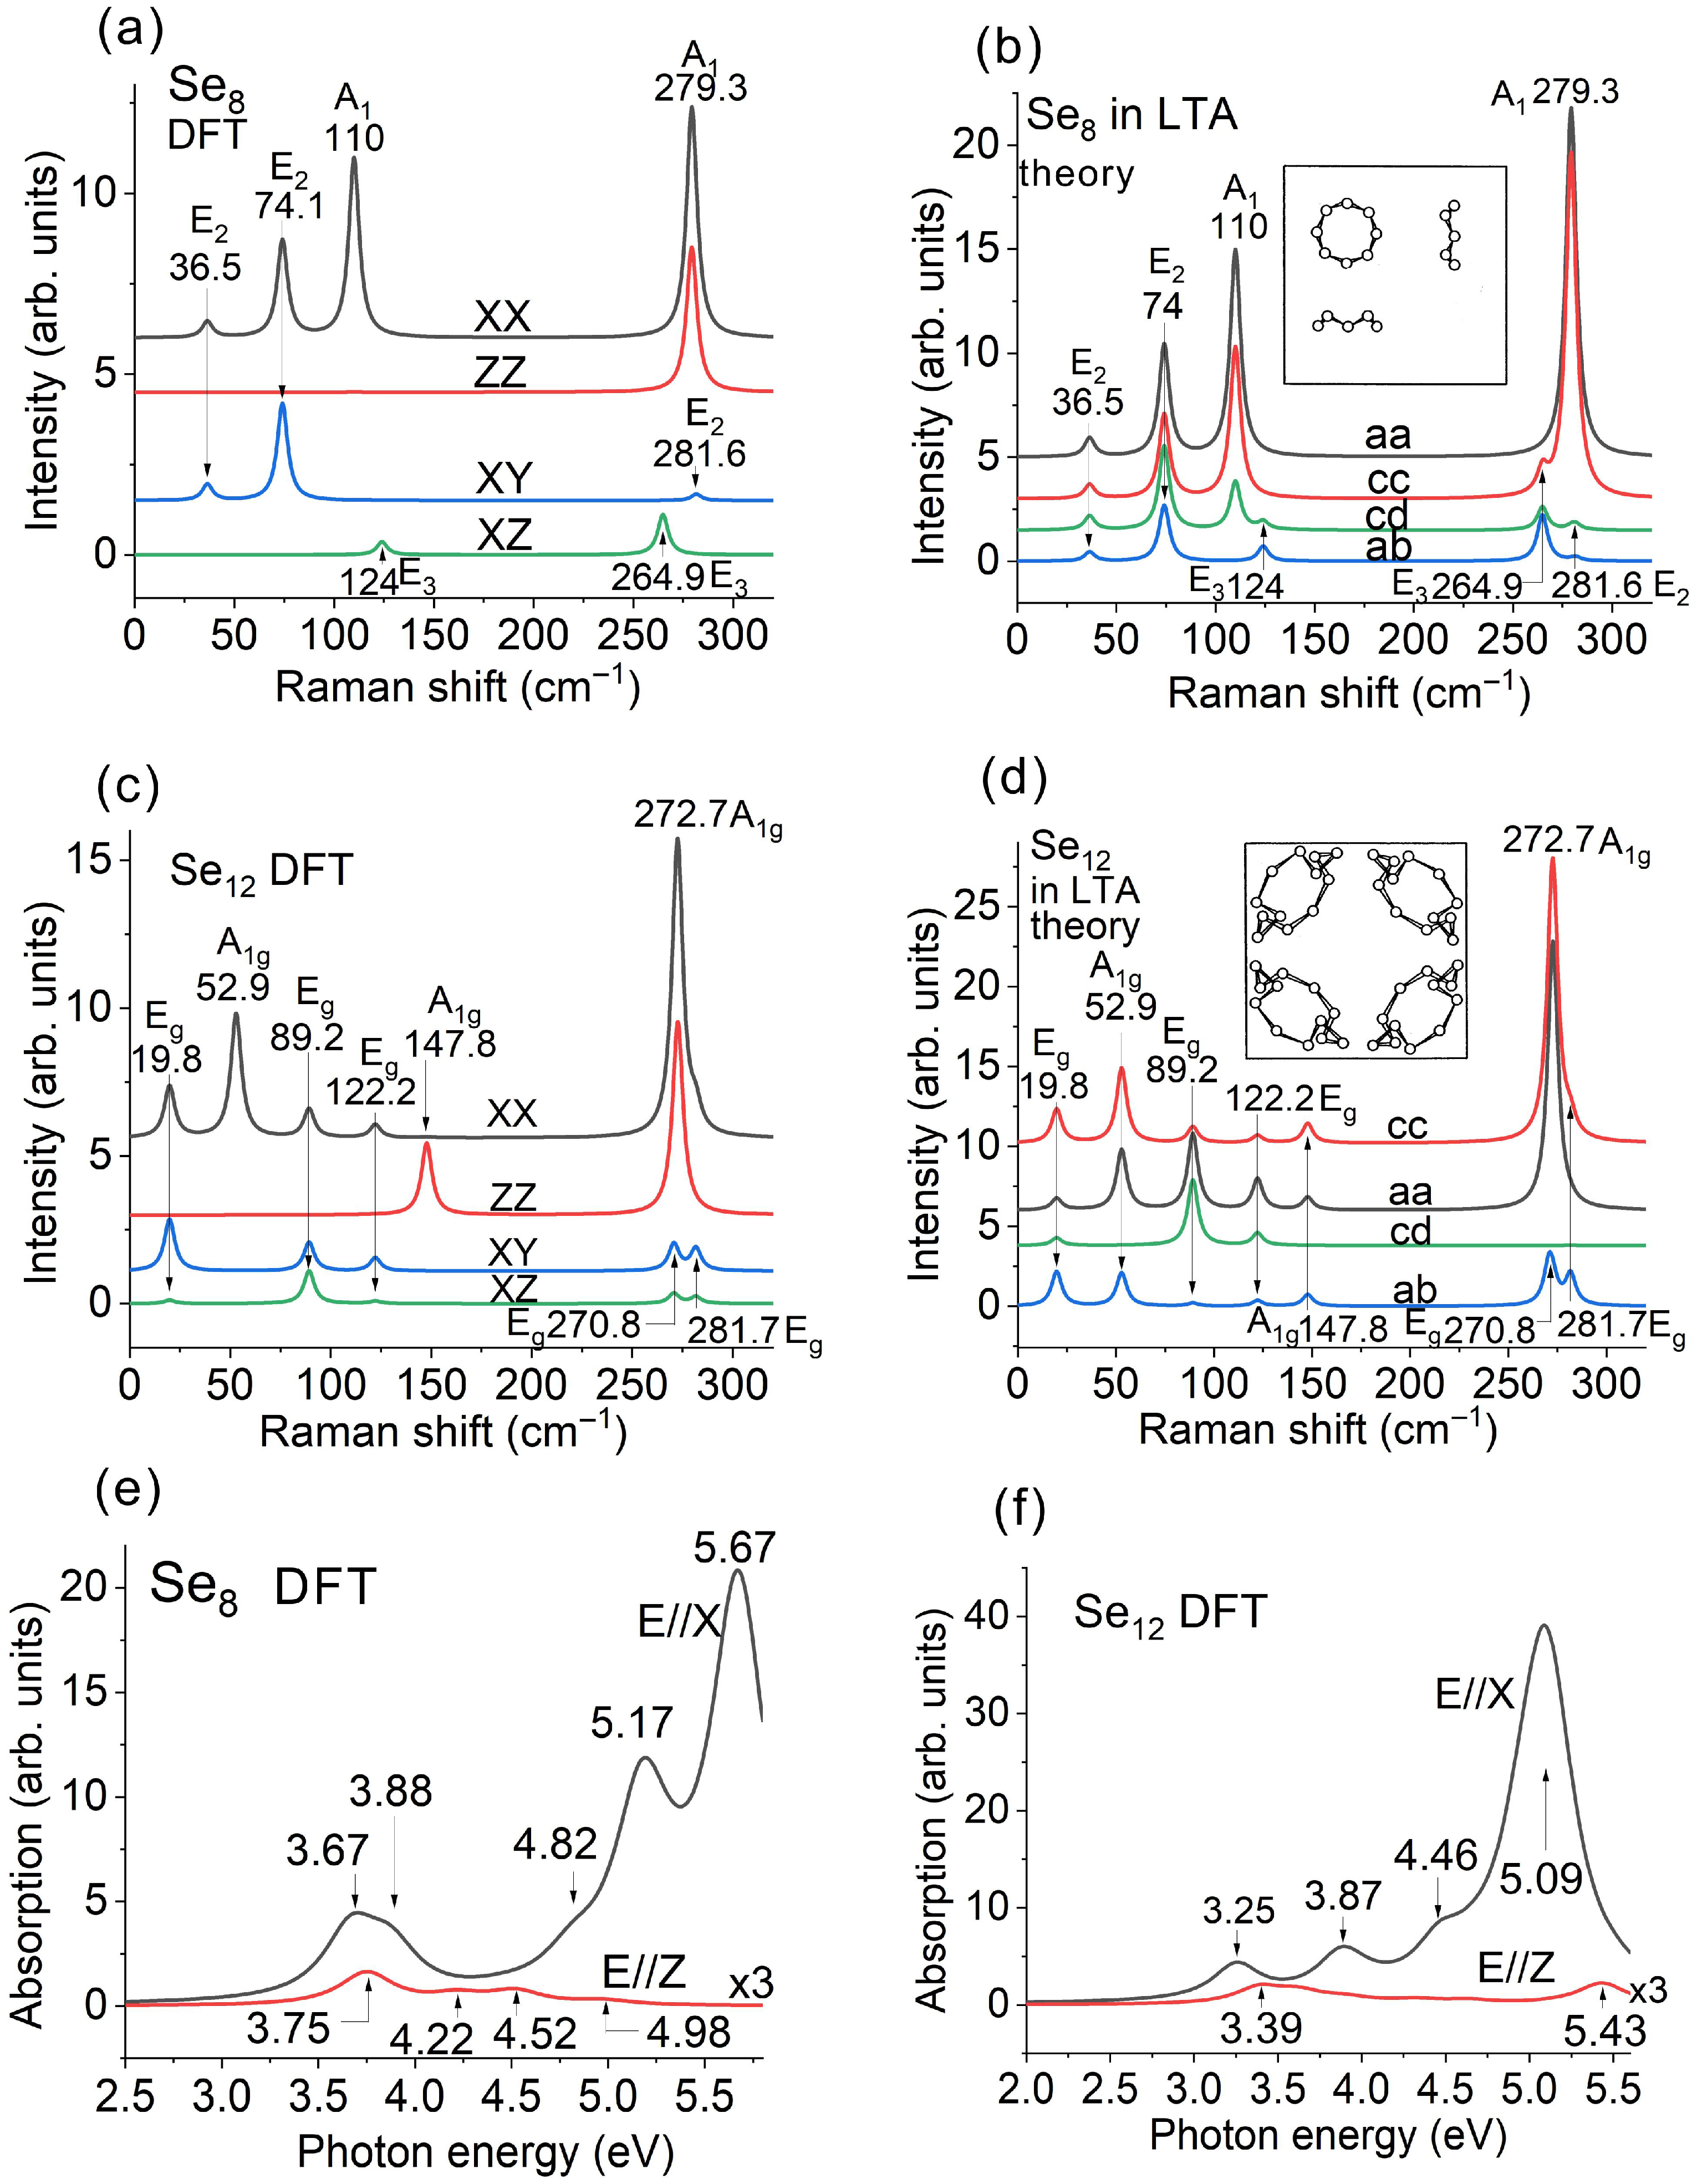
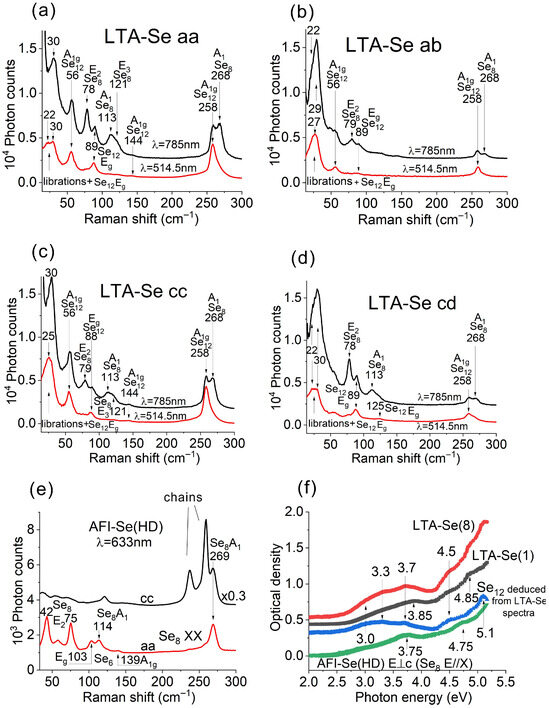
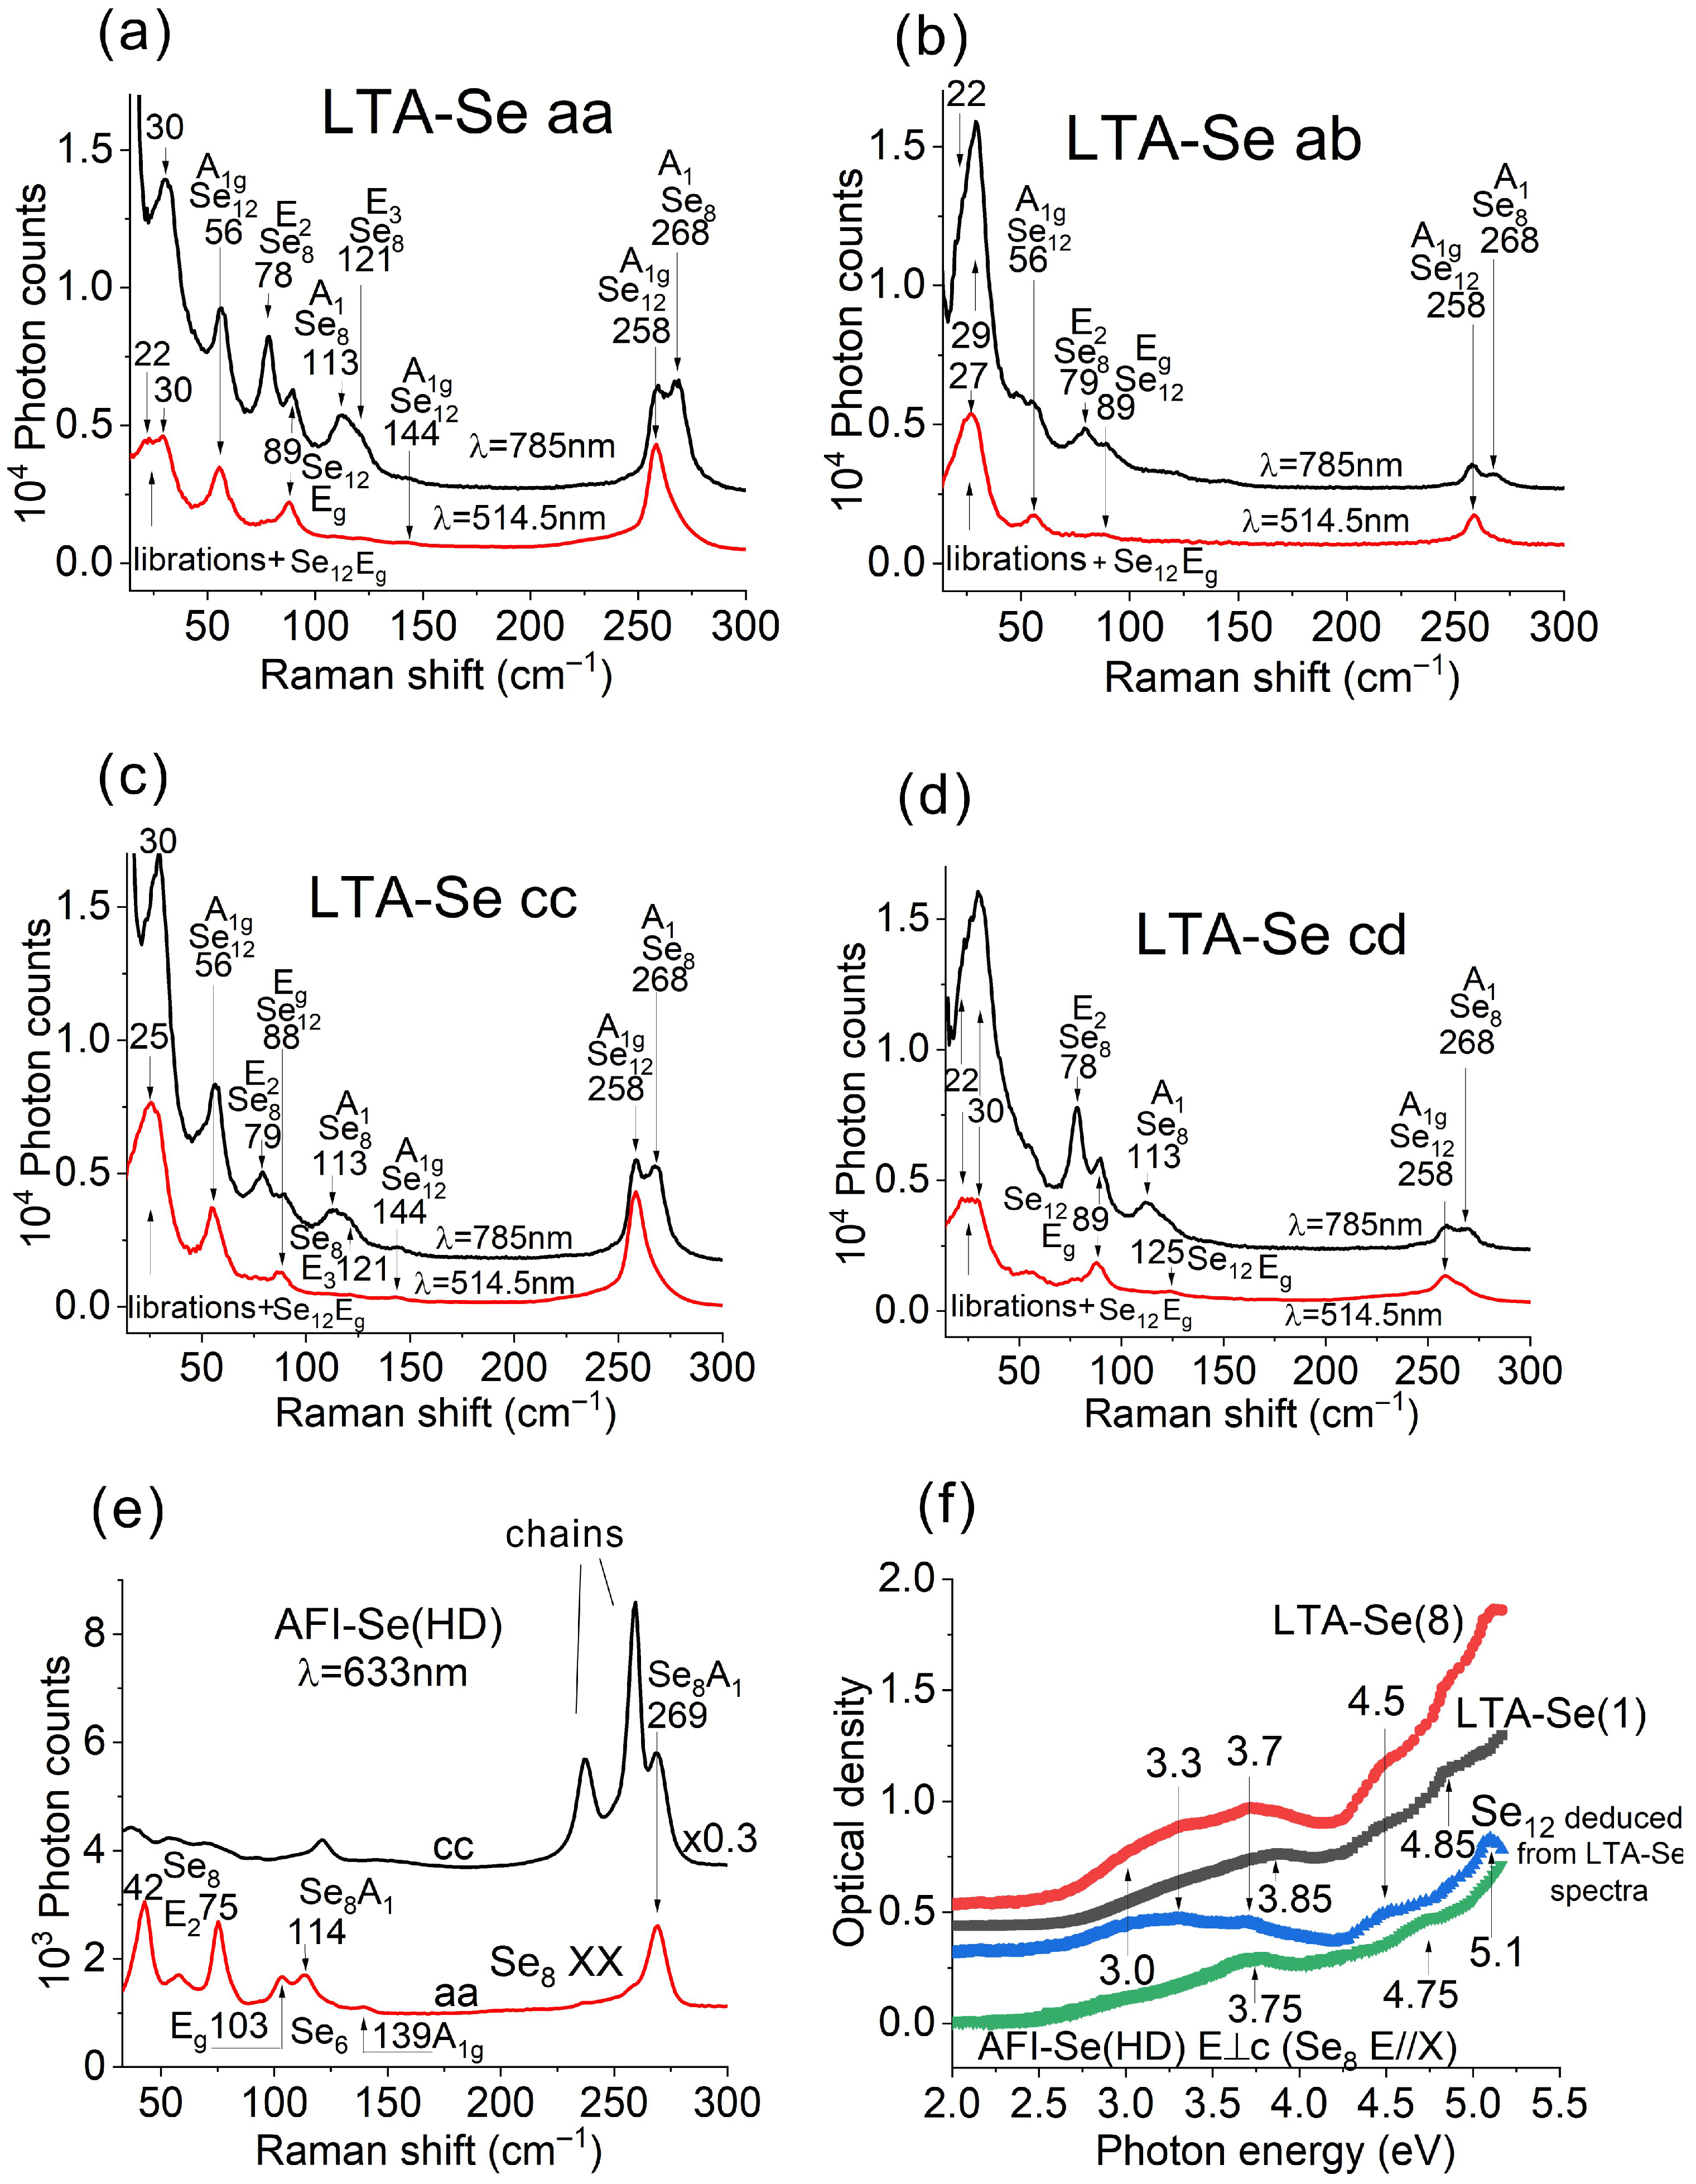
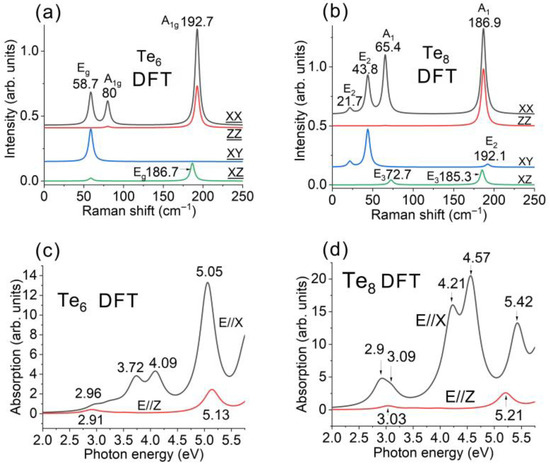
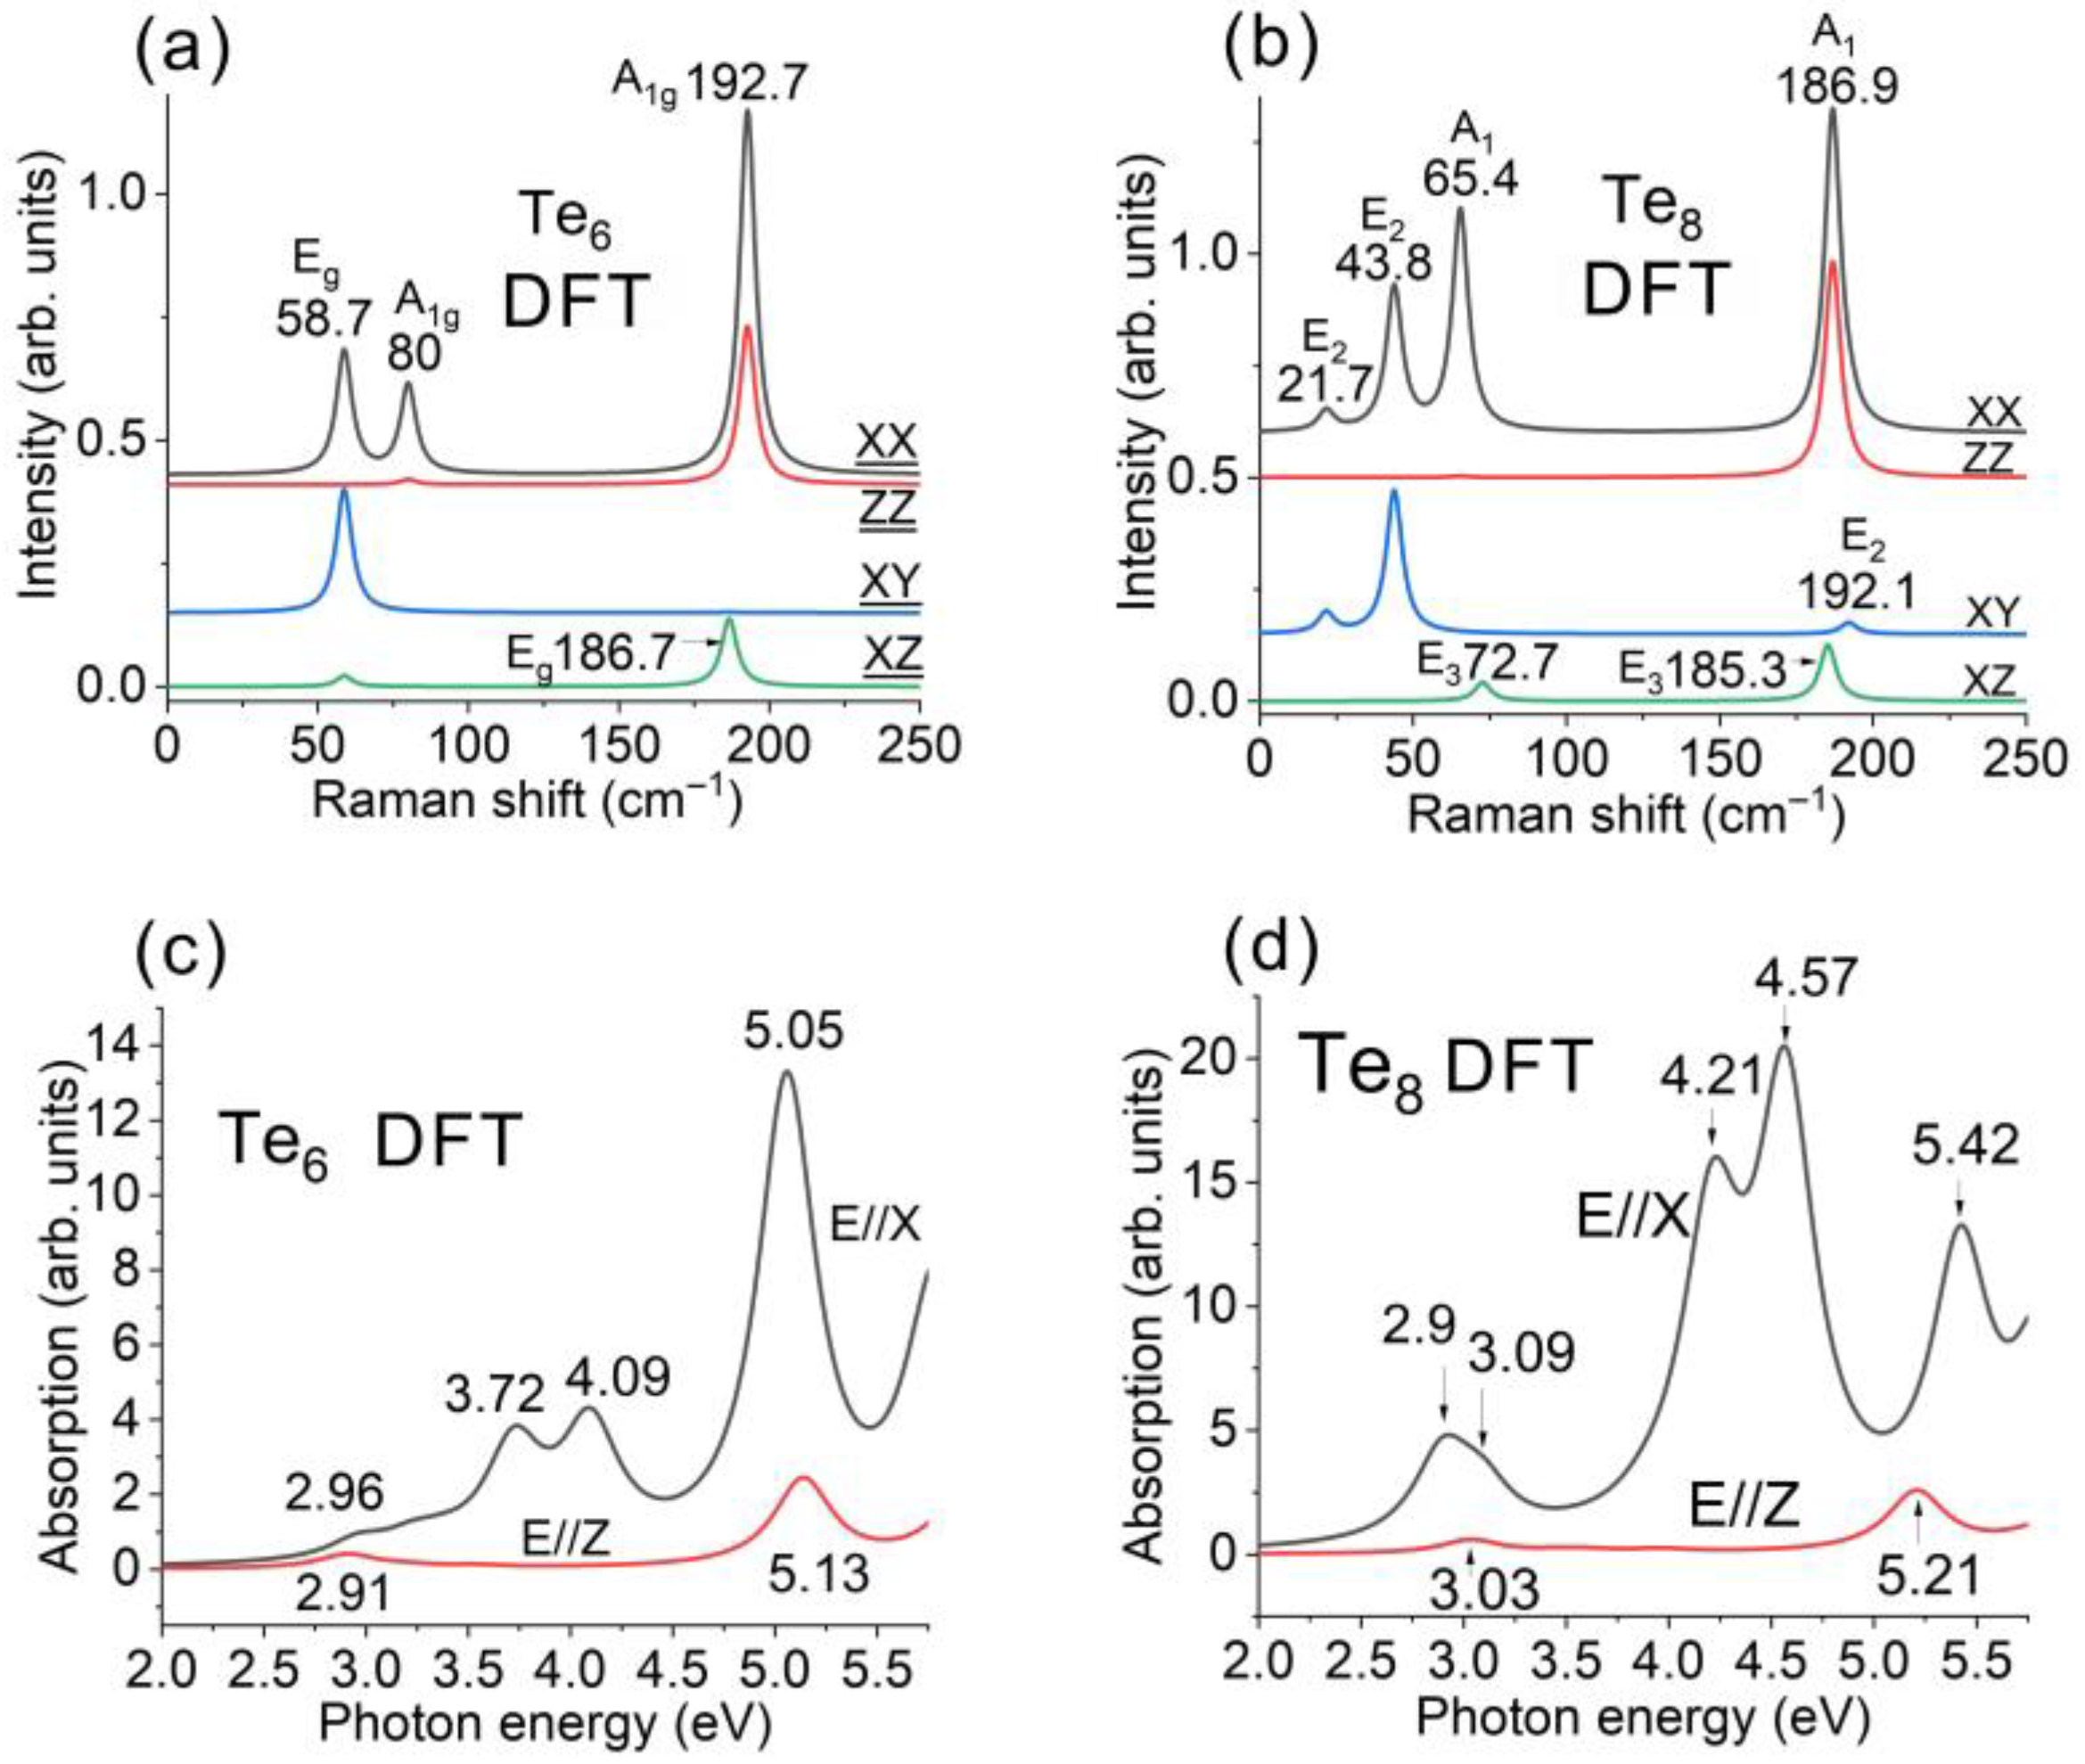
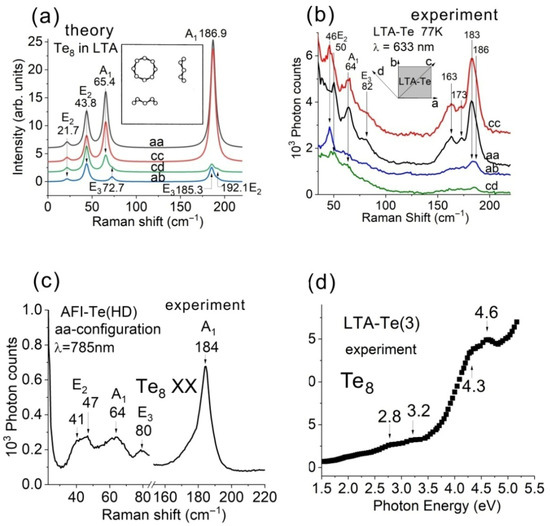
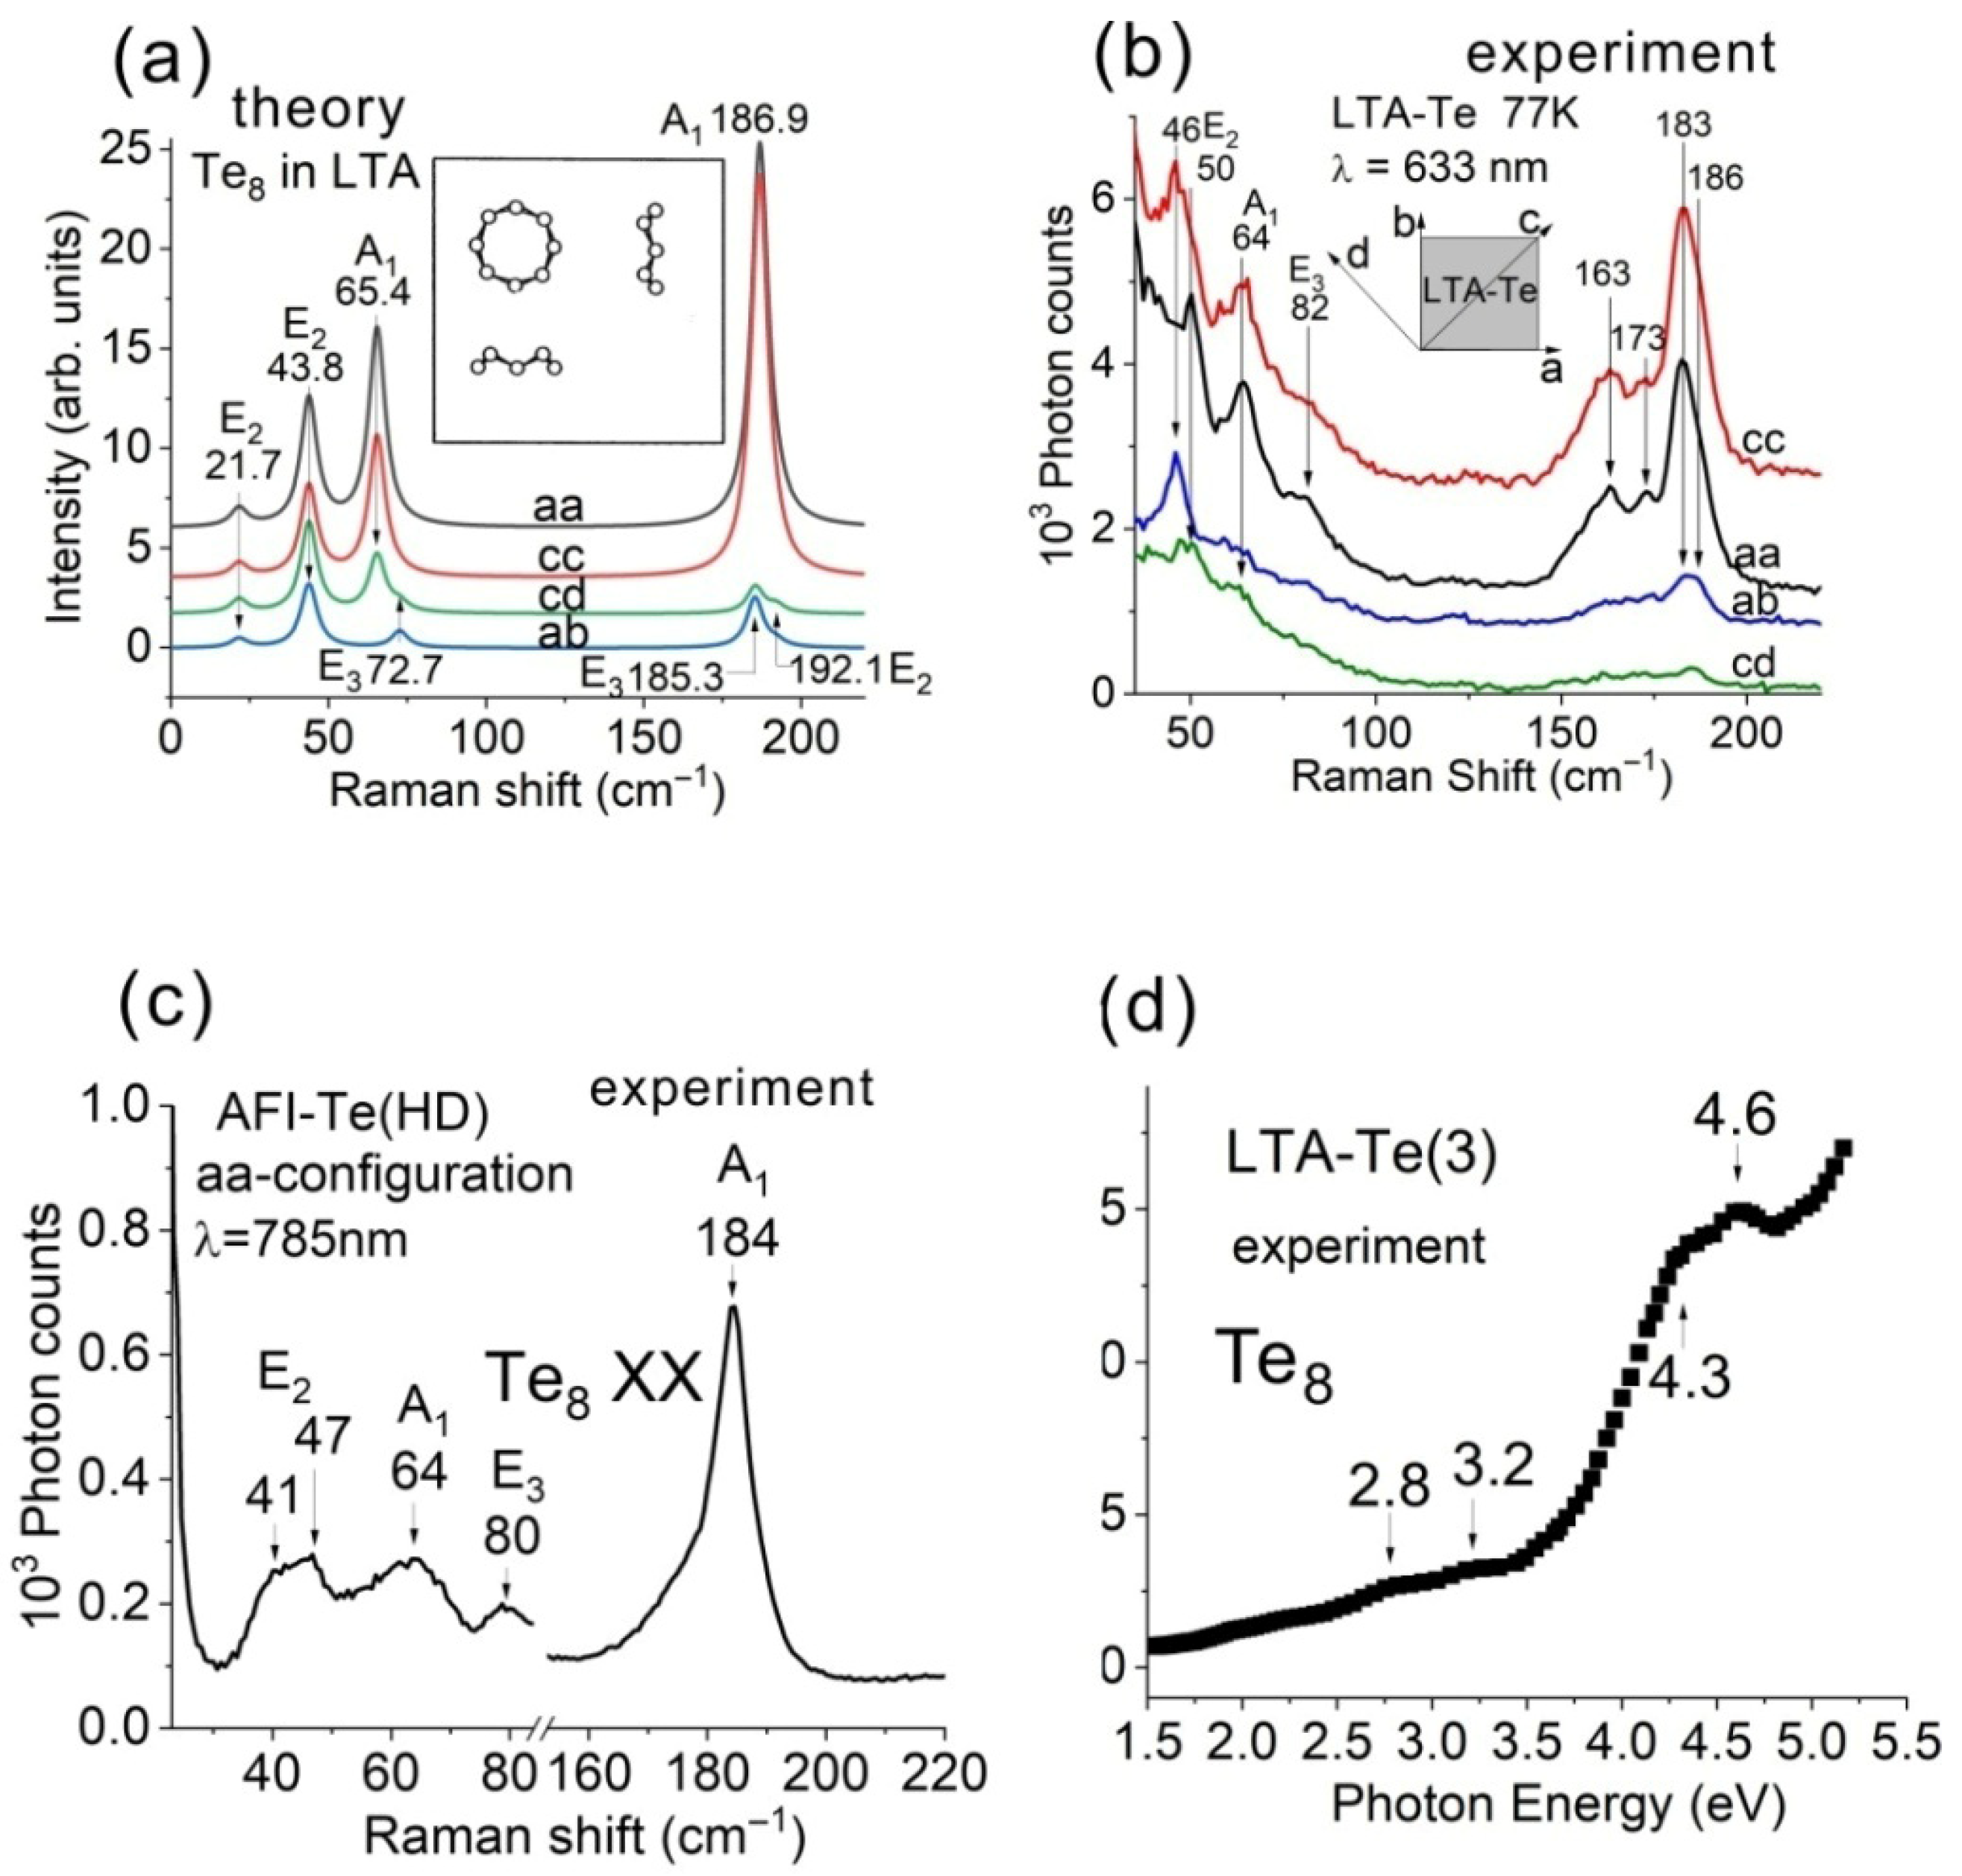
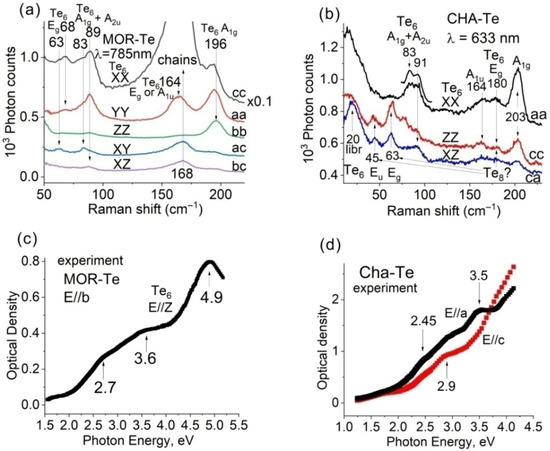
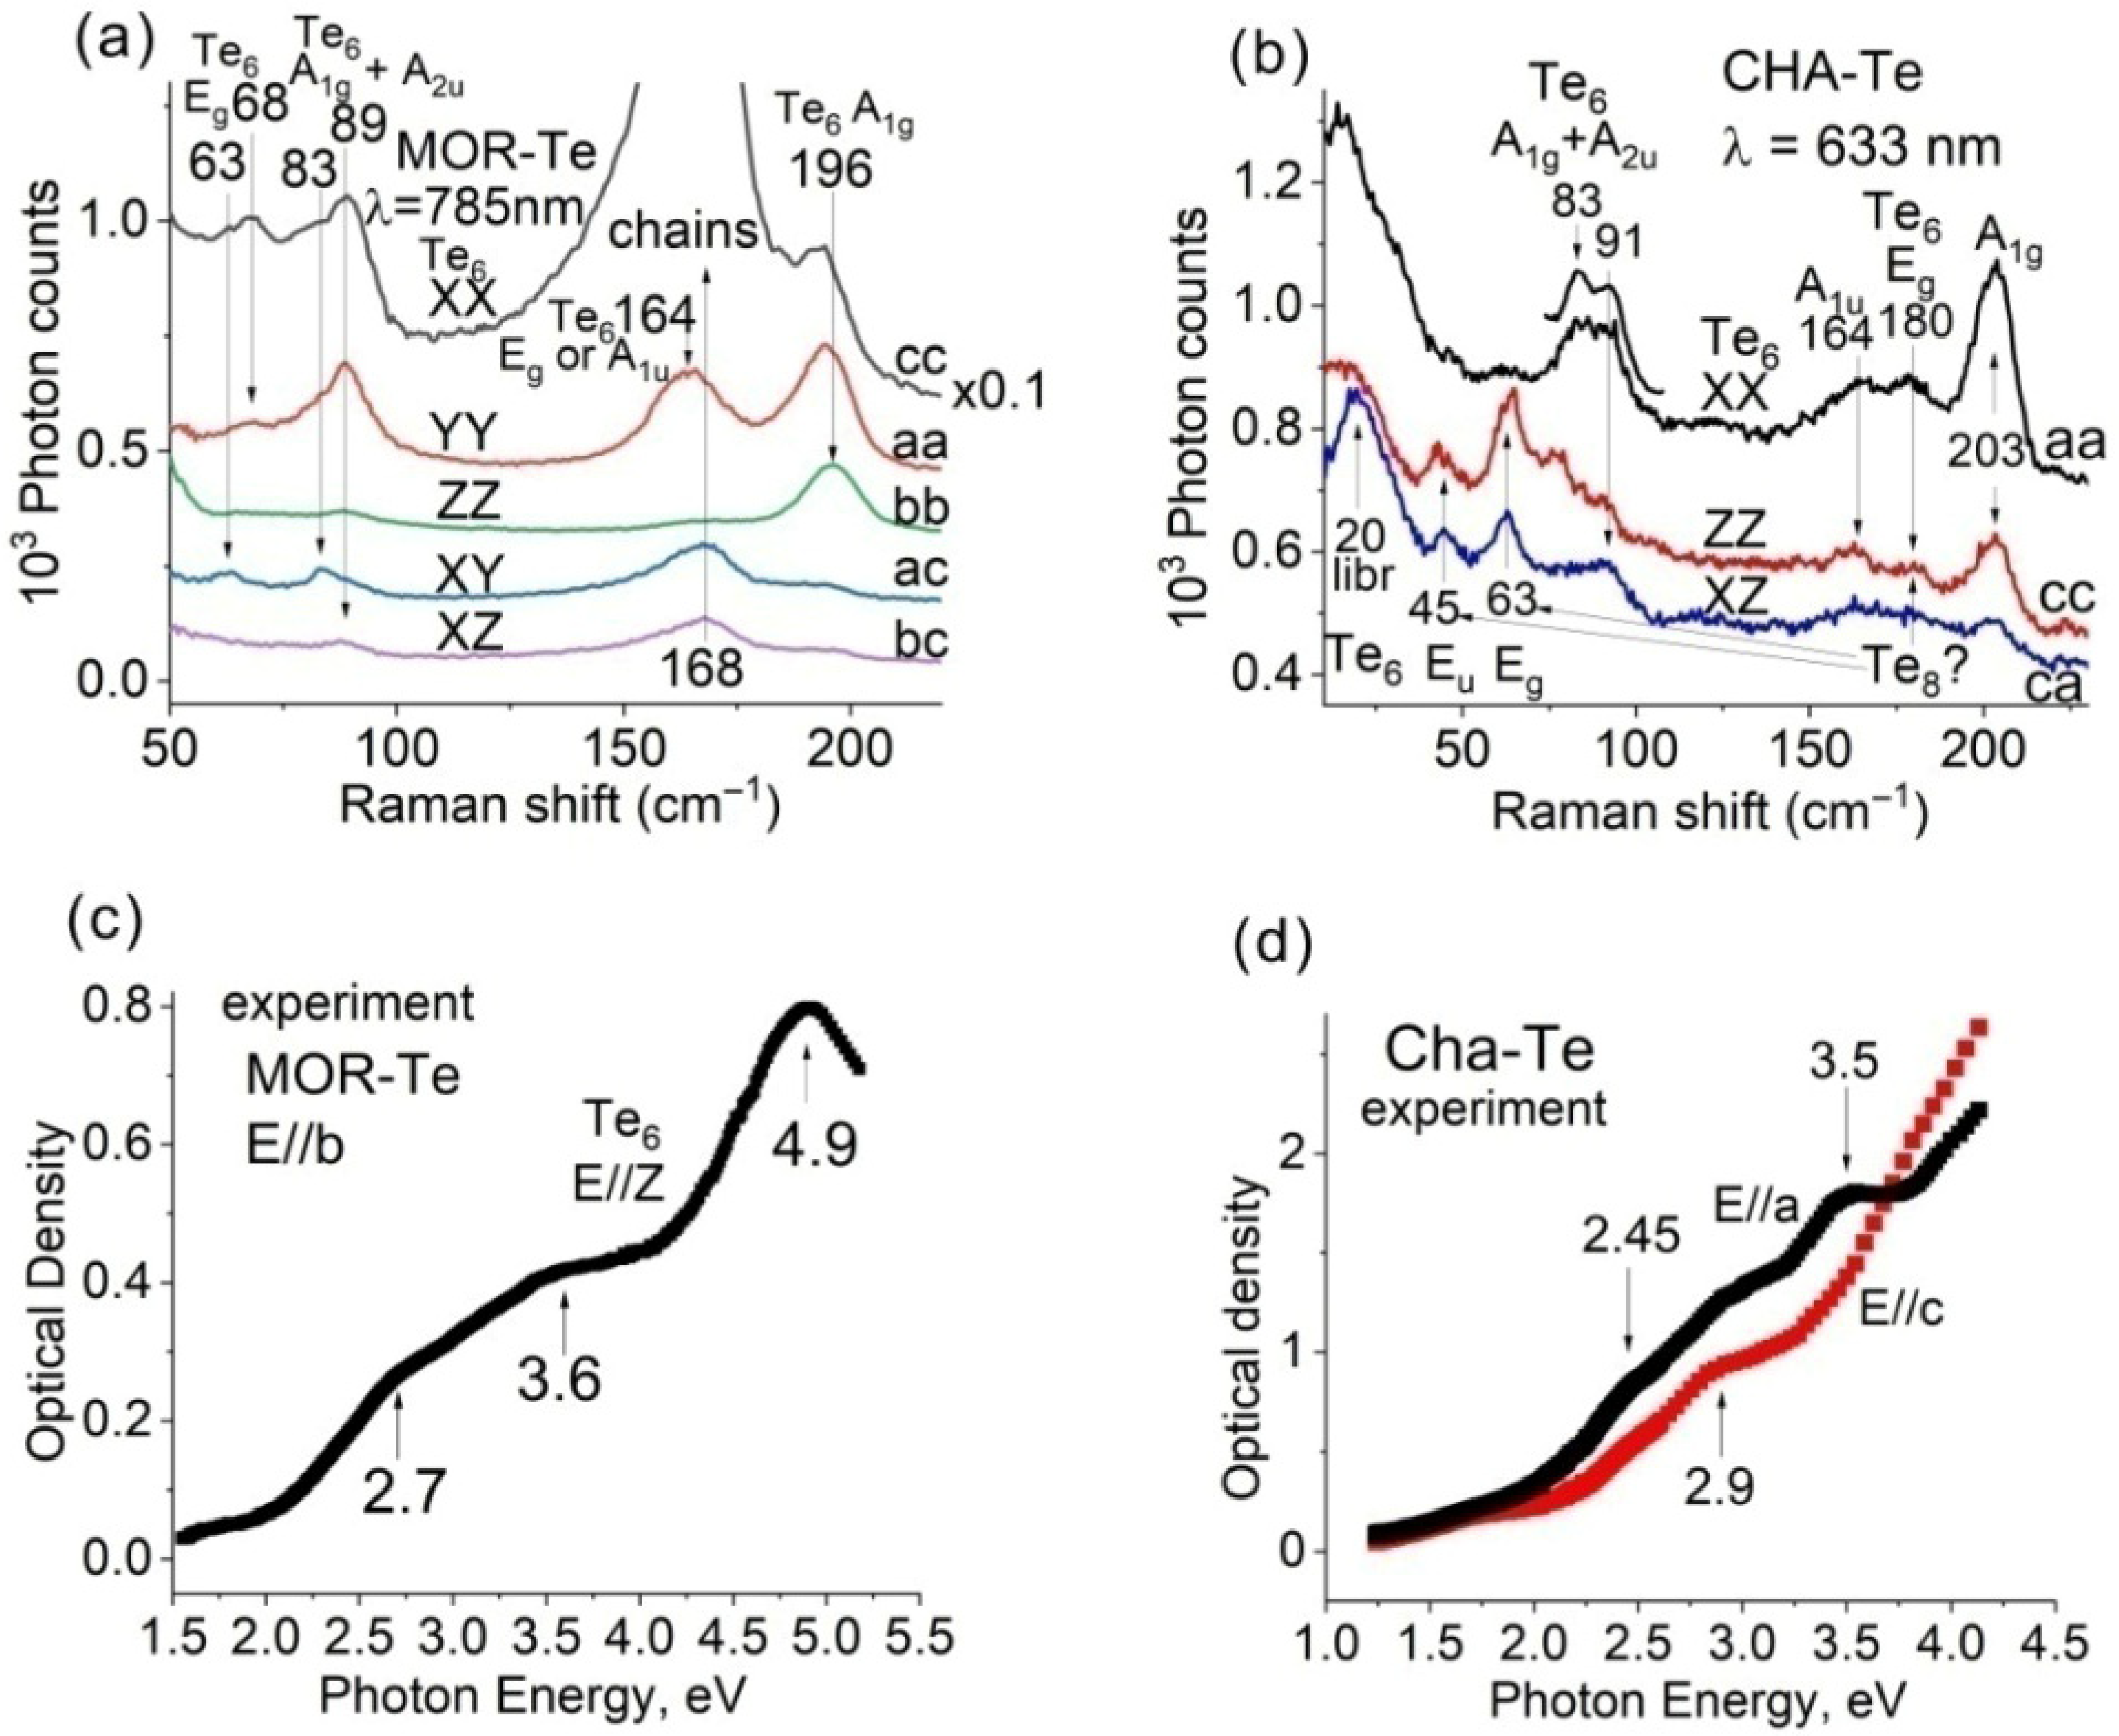
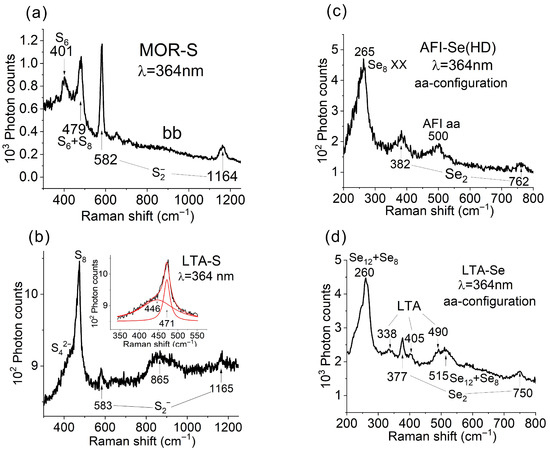
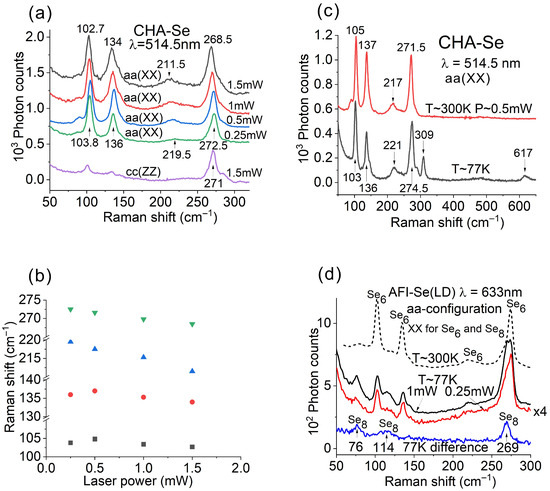
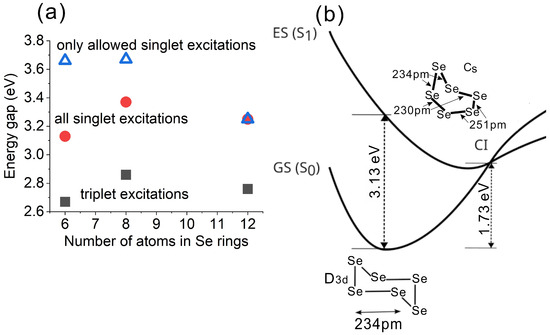
Disclaimer/Publisher’s Note: The statements, opinions and data contained in all publications are solely those of the individual author(s) and contributor(s) and not of MDPI and/or the editor(s). MDPI and/or the editor(s) disclaim responsibility for any injury to people or property resulting from any ideas, methods, instructions or products referred to in the content. |
© 2026 by the authors. Licensee MDPI, Basel, Switzerland. This article is an open access article distributed under the terms and conditions of the Creative Commons Attribution (CC BY) license.