


Abstract
The quantitative measurement of nuclear material hold-up in the process equipment is one of the technical challenges in nuclear material measurement for nuclear facilities. Its results are directly related to the optimization of radiation protection, the criticality safety control of nuclear materials, and the accurate accounting of nuclear material. As a key core equipment in the nuclear material reprocessing process, the precipitation reactor is restricted by the complex on-site environment, compact spatial layout, and continuous operation process, making it difficult for traditional measurement technologies to conduct accurate quantitative analysis of the internal hold-up. To address this issue, this paper proposes a method for measuring and analyzing the hold-up in the precipitation reactor based on the passive neutron counting method. A laboratory model of the precipitation reactor is constructed, and a multi-detector neutron measurement system is developed in this work. By combining Monte Carlo (MC) simulation with experimental calibration of standard point sources, a mathematical model suitable for hold-up measurement of the precipitation reactor is established. Meanwhile, uncertainty analysis of key data was carried out, and the accuracy of the model was verified by operational Pu samples of various masses, effectively reducing the measurement deviation caused by the uneven distribution of hold-up in the equipment and model assumptions. This research provides a more reliable technical reserve and reference paradigm for the measurement of nuclear material hold-up in nuclear facilities.
1. Introduction
The accurate measurement of nuclear material hold-up is a key link in the nuclear safeguard supervision system and nuclear material accounting [1,2]. It directly affects the operational safety of nuclear facilities, the effectiveness of nuclear material control, and the implementation of nuclear non-proliferation mechanisms [3].
The precipitation reactor is a core and key equipment in the nuclear material reprocessing process system, which is primarily responsible for the technological functions of nuclear material separation and purification. Its operational stability and nuclear material processing accuracy are directly related to the overall efficiency of the reprocessing process and the quality of nuclear material control [4,5]. To meet the requirements of criticality safety, the currently applied precipitation reactors generally adopt an annular cavity structure with an upper cylindrical and lower conical design. Although this structure can effectively avoid the risk of nuclear criticality, it results in a complex internal flow channel of the equipment. Meanwhile, as a core unit of the reprocessing process, the precipitation reactor is required to operate continuously for a long time with a compact external layout. The superposition of multiple factors leads to the easy adsorption and deposition of nuclear materials on the wall surface of the annular cavity, forming intractable nuclear material holdup. Affected by both process conditions and equipment structure, the holdup nuclear materials exhibit the characteristic of uneven spatial distribution in the radial and axial directions inside the reactor. Restricted by detection accuracy, spatial resolution and equipment adaptability, traditional measurement technologies (e.g., gamma spectrometry) are difficult to achieve accurate quantitative detection of nuclear material holdup in such complex structures, which has become a critical issue in nuclear material accounting and control.
In the field of nuclear material holdup detection, the γ-ray spectroscopy method is one of the widely applied detection techniques today [6,7]. However, this method has an inherent defect of insufficient ray penetration, making it difficult to effectively detect the main nuclear material holdup areas inside the annular cavity of the precipitation reactor, and the accuracy and integrity of the detection results cannot meet the actual demands. As a classic method in the field of non-destructive analysis of nuclear materials, the passive neutron counting method relies on the neutron emission characteristics of nuclear materials. Neutrons, if compared with low energy gamma-rays emitted by nuclear materials, penetrate the hold-up deposits and metal structures of the precipitation reactor easily, making spontaneous neutrons a suitable source term to perform accurate measurements and nuclear materials quantification. Combined with the structural and process characteristics of the measured object, passive neutron counting can realize the quantitative characterization of nuclear material content in the measured object by detecting and analyzing the neutron count rate generated by nuclear materials. Its technical advantages such as strong detection penetration, no need for an external radioactive source and convenient operation make it a potential optimal method for the detection of nuclear material holdup in precipitation reactors.
Taking the accurate detection of nuclear material holdup in precipitation reactors as the research objective, this study aims at the characteristics of the complex upper cylindrical and lower conical annular cavity structure and the uneven spatial distribution of nuclear material holdup in precipitation reactors. Adopting a research method combining simulation and experimental verification, the research on the detection of nuclear material holdup in precipitation reactors under laboratory conditions is carried out by optimizing the spatial layout of neutron detectors. This study is intended to develop a set of high-accuracy and easy-to-deploy non-destructive detection methods for nuclear material holdup that adapt to the structural characteristics of precipitation reactors. It can provide technical support for the decommissioning verification of nuclear facilities and the daily control of nuclear materials in in-service nuclear facilities, and supplement key detection data for the realization of the full-process accurate accounting of nuclear materials, thus helping to improve the integrity and effectiveness of the nuclear material safeguards supervision system.
2. Measurement Principle
Extensive research has been conducted on γ-ray-based nuclear material hold-up measurement techniques, leading to the development of a mature methodological system centered on energy spectrum analysis and passive efficiency calibration, which is suitable for scenarios involving conventional shielding and small-scale precise measurement [8,9,10,11]. Compared with γ-rays, neutrons possess stronger penetration capability and significant scattering effects, making them more suitable for the measurement of nuclear material hold-up in thick-shielded environments, large-scale and multi-region scenarios, as well as for the “surface coverage” measurement and monitoring of specific process equipment [12,13]. Owing to its simple equipment structure and fast response speed, the total neutron counting method is more applicable for the quantitative measurement of hold-up in precipitation reactor. The key parameter affecting the accuracy of total neutron measurement is detection efficiency, which can be obtained by experimental measurement and Monte Carlo simulation.
In this work, the total neutron counting method is used to measure the spontaneous fission neutrons of Pu isotopes and the (α, n) neutrons from Pu oxide in the precipitation reactor [14]. Based on the weight fractions of Pu materials, combined with the spontaneous fission neutron yield and (α, n) neutron yield parameters of Pu isotopes, the neutron emission rate per unit mass of Pu materials can be calculated, as shown in Equation (1). Since the measurement duration is much shorter than the half-life time of Pu isotopes, the isotopic composition can be regarded as constant.
where [g−1·s−1] is the neutron emission rate of 1 g of Pu material, [s−1]– [s−1] are the spontaneous fission neutron yield of 238Pu–242Pu, [s−1]– [s−1] are the reaction neutron yield of 238Pu–242Pu, are the weight fractions of 238Pu–242Pu. The spontaneous fission neutron yields of Pu isotopes are listed in Table 1.
Table 1.
The spontaneous fission neutron yields of the Pu isotopes [15].
The measured mass of the Pu sample is calculated according to Equation (2). The core of realizing the measurement of Pu nuclear materials lies in determining the detection efficiency of the device.
where [g] is the measured mass of the Pu sample, [s−1] is the measured net total neutron count rate, is the detection efficiency.
From Equations (1) and (2), it can be concluded that the detection efficiency of the measurement system is the key parameter that determines the accuracy of nuclear material hold-up measurement. In this work, the detection efficiency of the system is accurately determined by combining Monte Carlo simulation and standard source measurement.
3. Design and Optimization of Precipitation Reactor and Measurement System
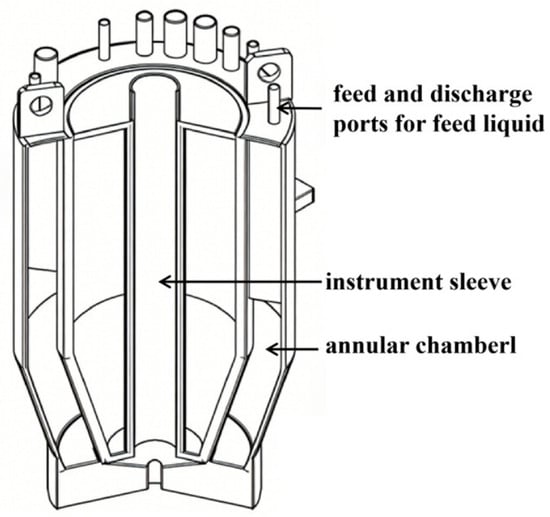
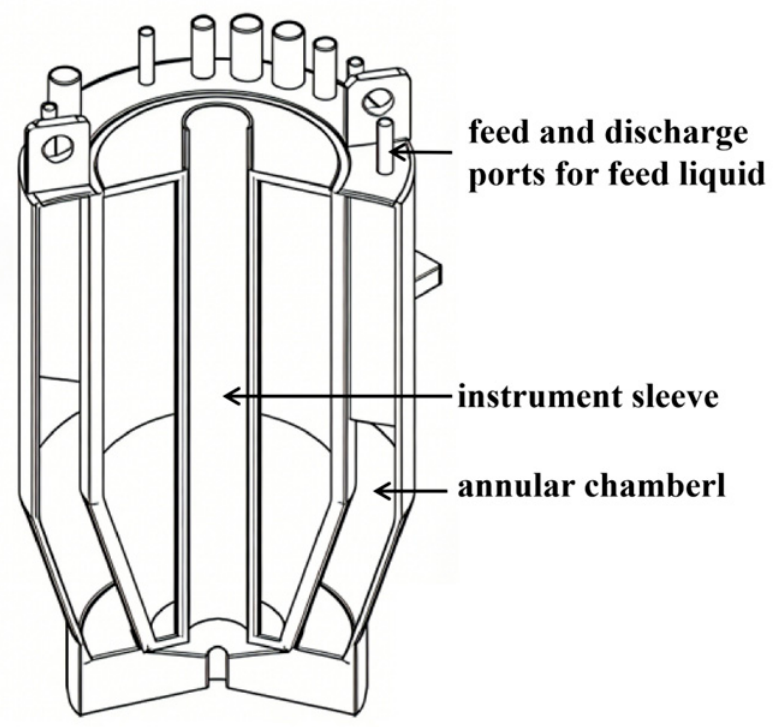
As a key process equipment in nuclear material reprocessing, the precipitation reactor features a large scale and is typically installed at elevated positions [16,17]. The primary functions of the precipitation reactor are to accomplish the precipitation reaction of nuclear materials and ensure criticality safety control. Its structure mainly consists of an annular precipitation reaction chamber (with an upper cylindrical section and a lower conical section), monitoring instruments, and internal neutron poisons, as illustrated in Figure 1.
Figure 1.
Schematic diagram of the internal structure of the precipitation reactor (internal neutron poisons are not shown).
3.1. Design of the Experimental Model
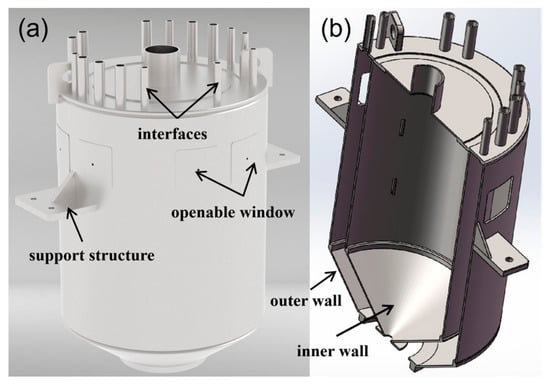
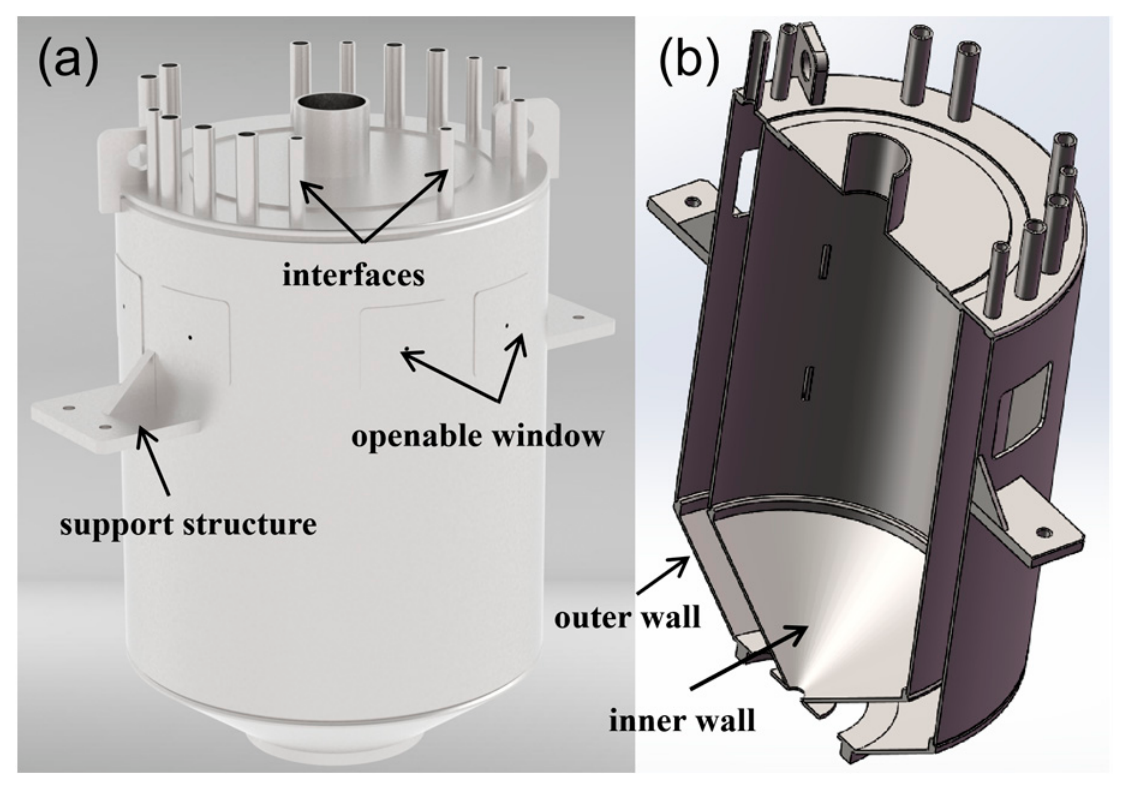
To investigate the hold-up measurement method of the precipitation reactor in detail, a scaled-down experimental model of the precipitation reactor was developed while preserving its overall configuration (upper cylindrical, lower conical). Considering the limitations of experimental space, the reduced dimensions were set to a diameter of 320 mm and a height of 450 mm. Key components were retained to simulate the actual process, including the annular reaction chamber, the casing for detection instruments, and the interfaces for inlet and outlet pipelines of feed liquid. Eight evenly distributed openable windows were arranged slightly above the mid-height of the outer shell of the annular chamber. This design allows radioactive standard samples to be placed at various positions inside the chamber to simulate the spatial distribution of hold-up. The structure of the experimental model is illustrated in Figure 2.
Figure 2.
Schematic diagram of the precipitation reactor laboratory model ((a): shell; (b): 3D cross-sectional view).
Considering the environmental constraints and measurement requirements, and abiding by the design principles of lightweight structure, collaborative detection, and antifouling performance for the integrated detection system, a suspension mounting scheme was adopted. The measurement assembly was installed from the top of the precipitation reactor to avoid occupying internal space of the equipment. The combined application of multiple detector groups allows full coverage of the radial and axial regions of the annular chamber, thus enhancing the response performance to non-uniformly distributed hold-up.
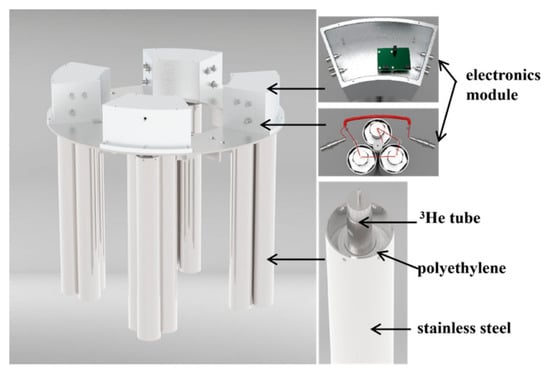
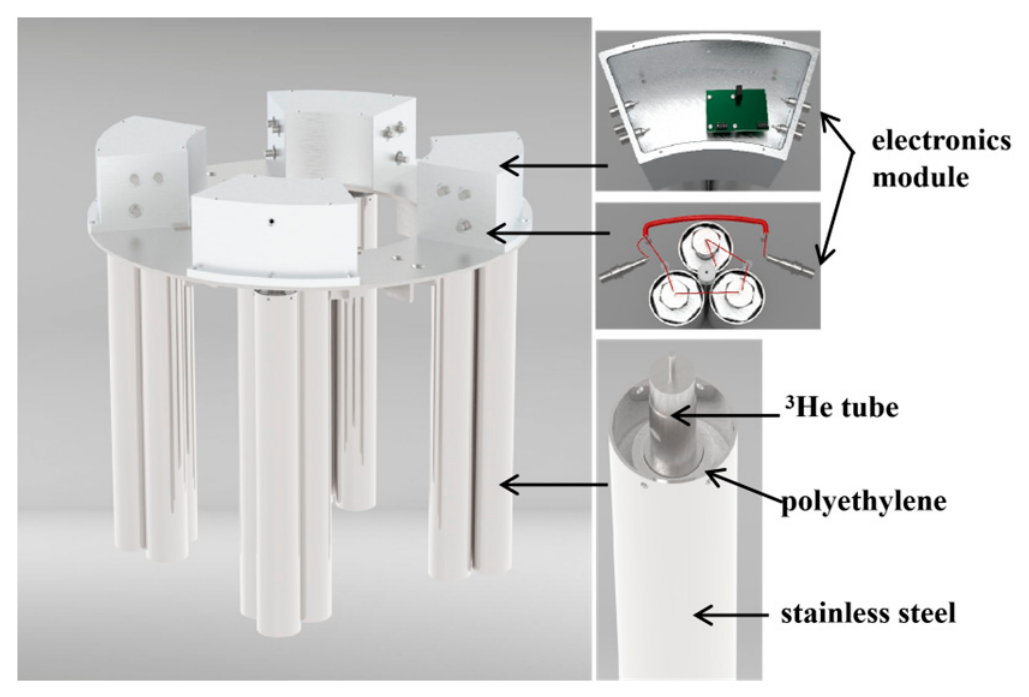
The detection system for the precipitation reactor comprises three components: the detector subsystem, the electronics module, and the data processing system, as shown in Figure 3. The detector subsystem adopts 3He neutron detectors (Model SK03218, manufactured by LND, Incorporated (Oceanside, NY, USA), with an effective operating length of 400 mm). The exterior of each detector is equipped with a 1.3 cm-thick high-density polyethylene layer and a replaceable stainless steel shell, which are intended to improve detection efficiency and mitigate radioactive contamination. The electronics module performs signal acquisition and processing based on the fundamental principle of charge-sensitive preamplification, using the A111 chip produced by AMPTEK, Inc. (Bedford, MA, USA) as the main chip. A Schmitt trigger is employed at the backend to widen and adjust the pulse width, followed by a gate circuit for shaping the output waveform. This electronics module can achieve signal acquisition and processing at a maximum frequency of 2.5 MHz, which can effectively satisfy the signal processing requirements of the 3He detectors and the counting system.
Figure 3.
Schematic diagram of the detection system for the precipitation reactor.
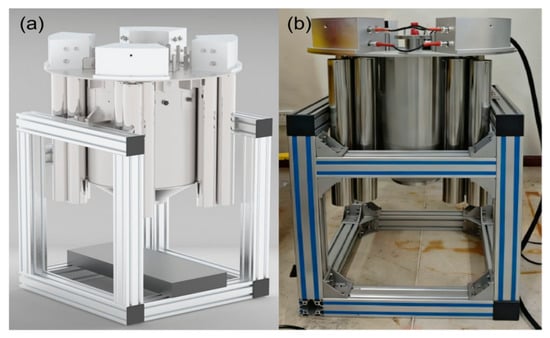
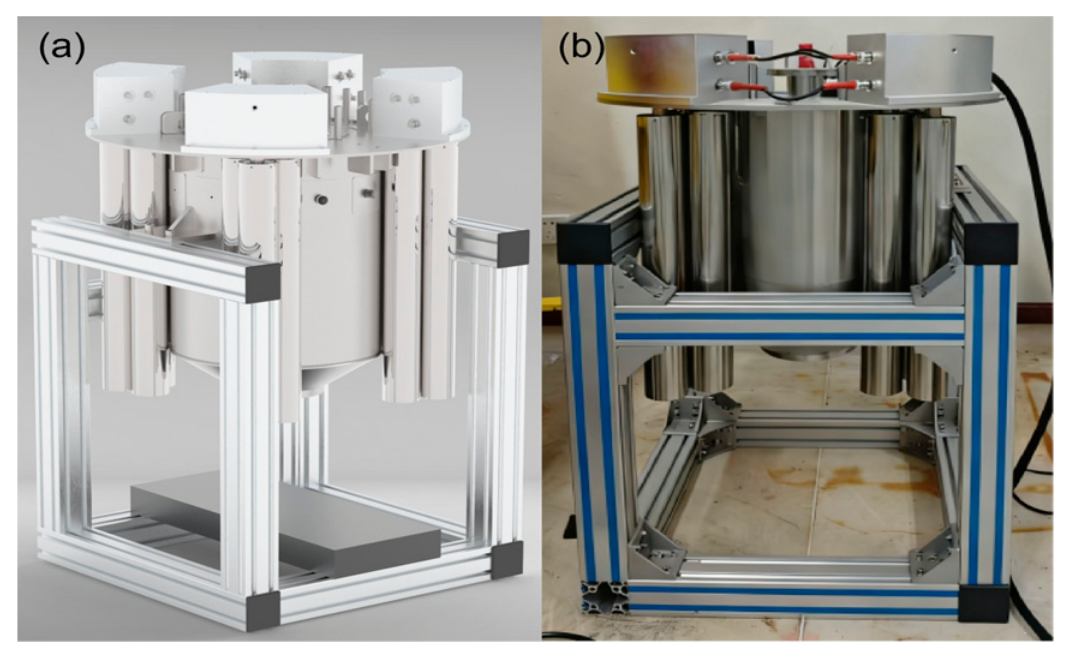
The simulation diagram and physical objects of the precipitation reactor and the detection system are shown in Figure 4. The research on the hold-up measurement system was carried out based on this integrated system.
Figure 4.
The precipitation reactor and detection system ((a): simulation diagram; (b): physical object).
3.2. Performance Testing
To verify the measurement uniformity and stability of the detection system, experimental investigations were performed on the hold-up measurement system.
3.2.1. Uniformity Test
To ensure the measurement uniformity of the detection system, the detection efficiency of four groups of measurement modules was measured respectively. Combined with the experimental parameters in the simulation, The 252Cf standard neutron source (source strength of 106,532.8 s−1 on the test day, Urel = 6% (k = 2)) was used for experimental testing and verification. The neutron source was placed at the center of the experimental model, where the distance from the radioactive source to each of the four groups of measurement modules was the same. The measurement time was 300 s (30 s × 10 timplease confirm whether the funding information in the Acknowledgments section should be moved to the Funding section.es), and the measurement results are shown in Table 2.
Table 2.
Data of the uniformity Test.
3.2.2. Stability Test
The 252Cf standard source was placed at the center of the annular chamber for measurement, with a total measurement time of 36 h (30 s × 4320 times). The measured net neutron count rate was 1054.5 s−1 (the source strength on the test day was 99,582.4 s−1). The net neutron count rate is the total value summed from all four detection modules. Unless otherwise specified, the term “net count rate” hereinafter refers uniformly to the total neutron count rate of the four modules. The detection efficiency of the measurement system was calculated to be , and the relative standard deviation (RSD) of the measurement was 0.59%, which is calculated by dividing the standard deviation of the counting rates by the average counting rate, reflecting the long-term stability of the detection system, demonstrating good long-term stability of the measurement system. Meanwhile, the detection efficiency obtained from both long-term measurement and short-term measurement was , which proves that the hold-up measurement system has good overall stability.
3.2.3. Detection Limit
After the debugging of the detection system, long-term environmental background measurement was carried out, with a measurement time of approximately 50 h (30 s × 6000 times). The average value of the background count rate was measured to be 0.94 s−1, and the standard deviation (SD) was 0.19 s−1, which further verifies the stability of the measurement system. According to the empirical Equation (3), which is simplified from the detection limit formula specified in ISO 11929-1:2025 [18], the detection limit of the measurement system was calculated to be 6.3 mg (normalized to the effective mass of 240Pu). The total detection efficiency used in the calculation is obtained from the 252Cf point neutron source experiment, and the calculated detection limit of 6.3 mg should be regarded as an order of magnitude, which is related to the Pu isotopic distribution (Equation (1)) but not related to the distribution of Pu-material hold-up within the reactor vessel.
where is the detection limit normalized to effective mass of 240Pu, and [s−1] is the neutron background count rate, the value of 3 represents the confidence factor (corresponding to a confidence level of 99.73%), 1800 denotes the measurement time of 1800 s, and 1.02 is an empirical coefficient normalized to the effective mass of 240Pu.
4. Establishment of the Mathematical Model
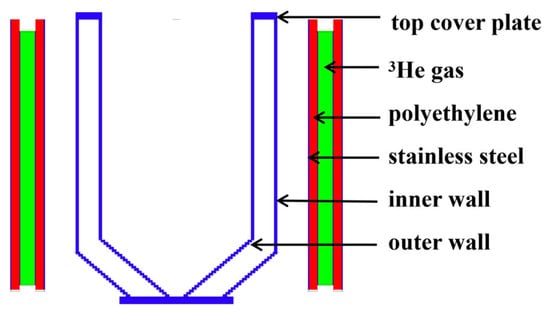
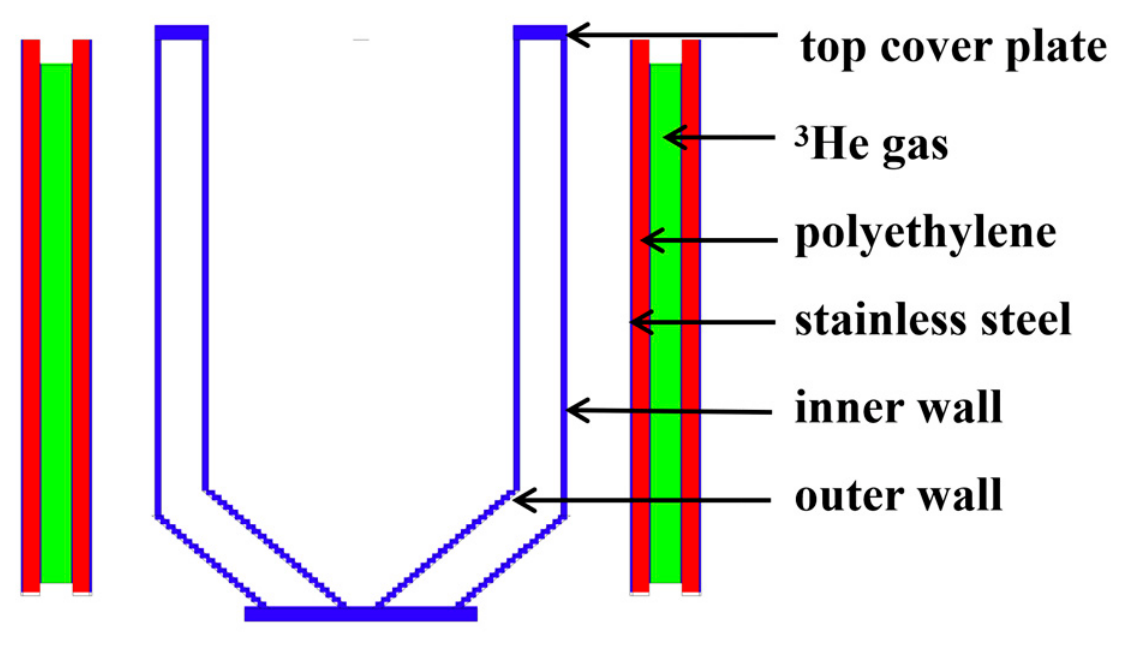
The simulation is carried out based on the Monte Carlo method. The structure and dimensions of the simulation model are consistent with the Precipitation Reactor model established in the laboratory (dimensions are diameter 320 mm and height 450 mm), except that only the top transport pipe is omitted, which has been verified to exert no significant influence on the simulation results. The reactor model is an annular chamber with an upper-circular and lower-conical configuration equipped with a top cover plate. The detector model includes 12 3He proportional counters at 4 atm (diameter 2.54 cm, effective length 40 cm), with both the stainless steel casing and 3He gas region fully established. The detectors are wrapped by a 1.31 cm-thick high-density polyethylene moderator and a 0.17 cm-thick stainless steel protective sleeve in sequence, as shown in Figure 5. The neutron emission rate of 1 × 10⁶ s−1 is set to characterize the neutron emission intensity of nuclear materials. The simulated radioactive sources are respectively placed on the inner and outer walls at various axial heights, where the holdup is likely to be distributed.
Figure 5.
Cross-section schematic diagram of the precipitation reactor and detection system.
When the simulated point source was placed at the center of the annular chamber, the calculated detection efficiency was 1.03% (relative error was 0.93%). To verify the accuracy of the mathematical model, the 252Cf standard source and the Pu sample were respectively placed at the center of the precipitation reactor (consistent with the simulation position), and measurement experiments were carried out to calculate their detection efficiencies. The specific results are shown in Table 3.
Table 3.
Comparison of experimental and simulated data.
For the 252Cf and Pu samples, the relative bias between the experimentally measured and simulated detection efficiencies is commensurate with its standard uncertainty, indicating that the two sets of results are in good statistical agreement. This rigorously validates the rationality, reliability, and high computational accuracy of the established simulation model.
5. Hold-Up Measurement Error Analysis
The hold-up in the precipitation reactor is mainly distributed on the inner and outer walls. Measurement experiments were performed along the axial and radial directions, respectively, and industrial Pu samples were used to validate the measurement results.
5.1. Analysis of Radial Error
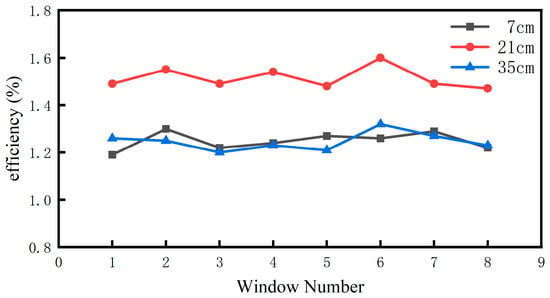
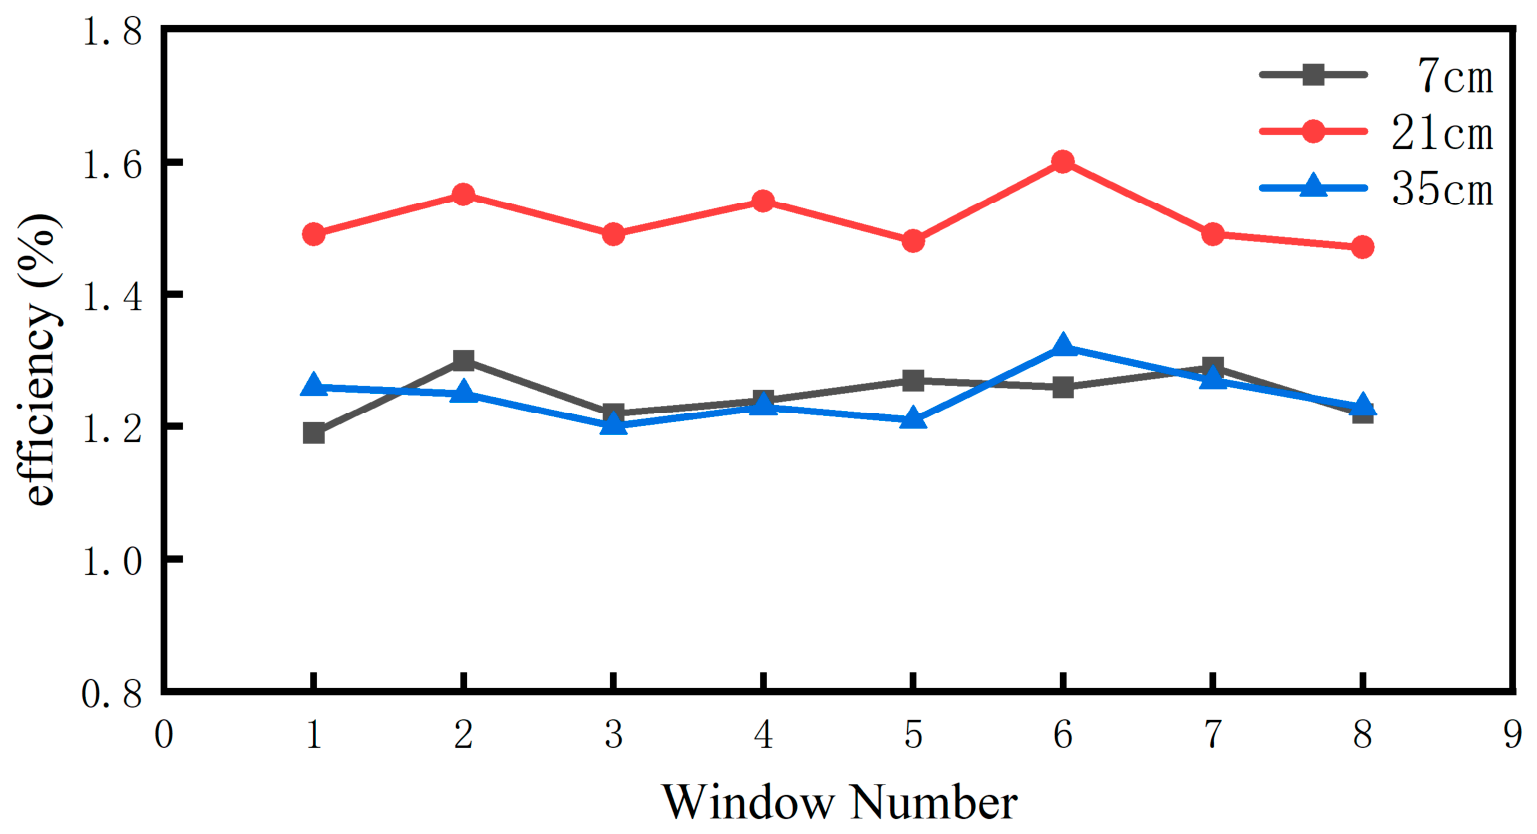
Since the hold-up in the precipitation reactor is mainly distributed non-uniformly along the axial direction, a combined simulation and experimental verification strategy was adopted in this work. A point source model was employed in the simulation, and the experiments were performed at positions consistent with the simulation. The 252Cf standard neutron source (the source strength of the test day was 99,725.5 s−1, Urel = 6% (k = 2)) was placed at eight window positions for measurement respectively. Three heights were selected for each window, with the axial distances from the reactor top being H1 = 7 cm, H2 = 20 cm and H3 = 35 cm (distances from the top of the reactor), totaling 24 measurement points. Each point was measured for 300 s (30 s × 10 times). The detailed results are presented in Table 4 and Figure 6.
Table 4.
Measurement results of spatial efficiency radial uniformity distribution.
Figure 6.
Efficiency distribution of eight windows at different heights.
The results listed in Table 4 and Figure 6 confirm that the measurement system exhibits excellent radial response characteristics. For the eight observation windows at the same height, the maximum relative deviation between the measured values and their average value is less than 5.6% at all measurement positions.
5.2. Analysis of Axial Error
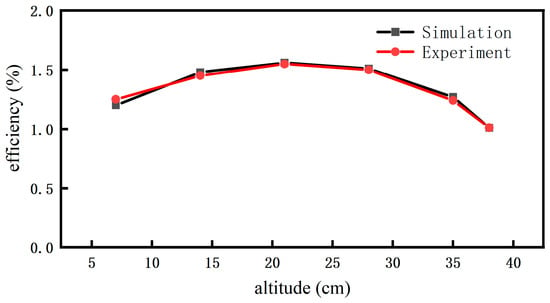
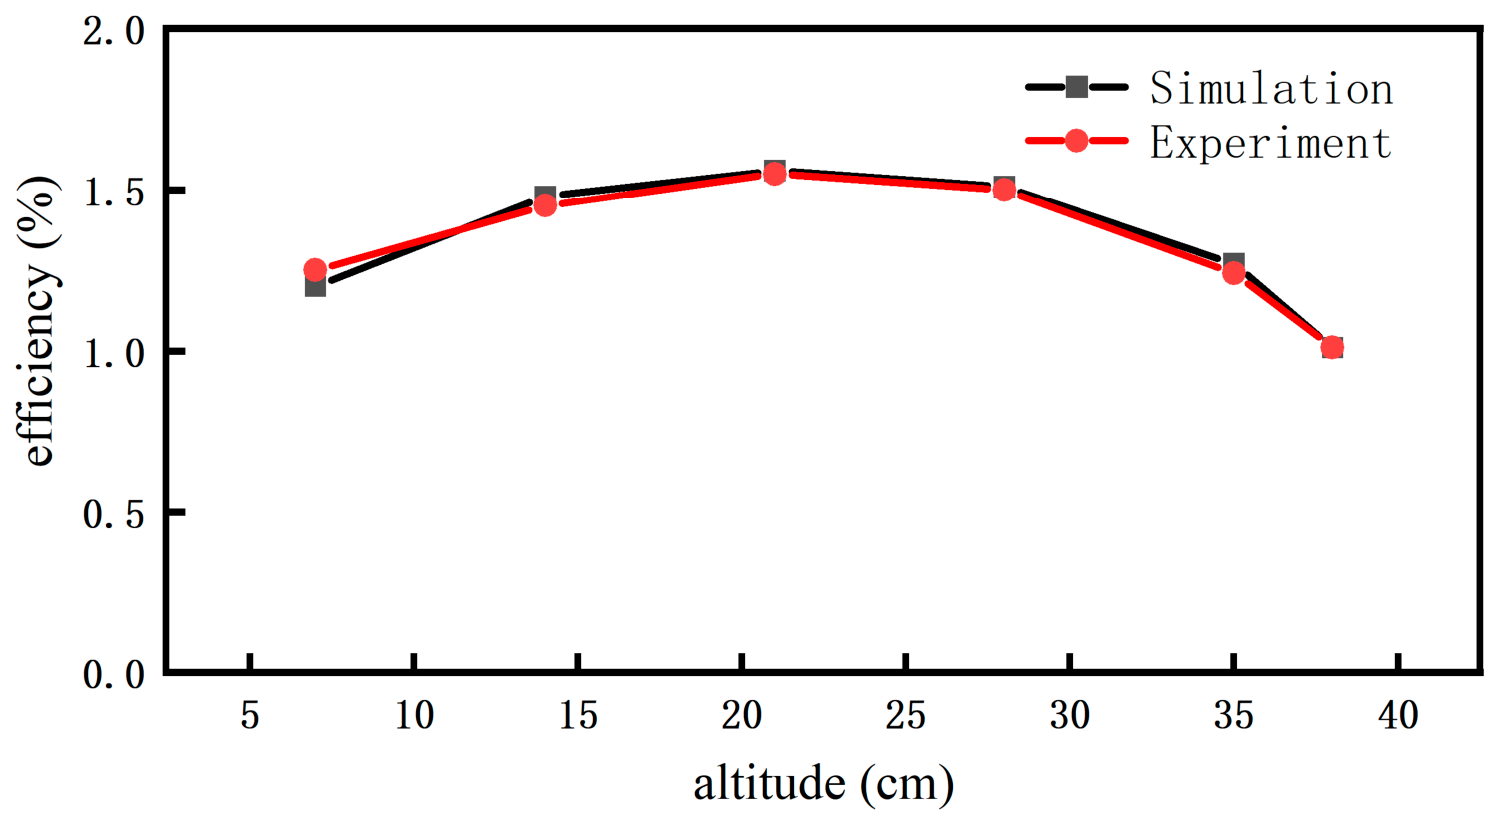
Since the hold-up in the precipitation reactor is mainly distributed non-uniformly along the axial direction, a combined simulation and experimental verification strategy was adopted in this work. The point source model was employed in the simulation, and the experiments were performed at positions consistent with the simulation. The 252Cf standard neutron source (source strength: 99,725.5 s−1 on the measurement date) was utilized, and six axial positions closely attached to the outer wall of the annular chamber were selected as measurement points. The measurement time for each position was 300 s (30 s × 10 times). The detailed results are presented in Table 5 and Figure 7.
Table 5.
Comparison of Simulated and Experimental Axial Detection Efficiencies.
Figure 7.
Comparison of simulated and experimental detection efficiency curves along the axial height.
Six measurement points at different axial heights were selected, and the detection efficiency was obtained by simulation and experiment measurement respectively. As shown in Figure 7, the simulation and measured detection efficiency curves exhibit consistent linear trends. The maximum relative bias between simulation and experiment is only 3.61%, which further validates the accuracy and reliability of the simulation model. Thereafter, the detection efficiency calculated with this verified simulation model can be directly applied to the study of hold-up spatial distribution.
5.3. Pu Sample Measurement
Operational Pu samples were used to preliminarily validate the feasibility of the proposed method. Owing to the large physical size of the samples, direct measurement inside the annular chamber was difficult. Thus, the Pu samples were placed at the center of the precipitation reactor model for measurement, with a single-point acquisition time of 300 s (30 s × 10 times), as listed in Table 6. By combining the data in Table 1 with the isotopic abundance information of the Pu samples and using Equation (1), the value of was calculated to be g−1·s−1. Based on the simulated detection efficiency at the central position, the measured mass of the operational Pu samples was derived from Equation (2) and subsequently compared with the nominal mass. The sample size and placement position are identified as the main sources of the deviation.
Table 6.
Comparison of Measured and Nominal Neutron Emittance Rates and Their Deviations for operational Pu samples.
6. Conclusions
The precipitation reactor is a key process equipment in nuclear fuel reprocessing facilities. Measuring the nuclear material hold-up inside it is of great significance for radiation protection in the operation of reprocessing plants, criticality safety analysis, and accurate accounting of nuclear materials. In this paper, a laboratory model of the precipitation reactor and a hold-up measurement system were established. Through simulation and experimental verification, the measurement uniformity, stability and reliability of the entire system were comprehensively evaluated. Additionally, a variety of operational Pu samples with different masses were measured to verify the accuracy of the simulation model. In future research, it is necessary to combine actual on-site conditions, consider the influences on hold-up measurement such as neutron-absorbing poisons in the precipitation reactor, transportation pipelines and hold-up distribution, and continuously optimize the parameters of the measurement model to further improve the accuracy of hold-up measurement.
Author Contributions
Conceptualization, H.D. and L.B.; Methodology, H.D. and L.B.; Software, Z.Z.; Validation, H.D.; Formal analysis, L.B.; Investigation, H.D.; Data curation, L.B., H.Z., Z.Z., J.Q. and M.F.; Writing—original draft, H.D.; Writing—review & editing, H.D., L.B. and Z.Z.; Project administration, L.B. All authors have read and agreed to the published version of the manuscript.
Funding
This research received no external funding.
Data Availability Statement
The data presented in this study will be available on request from the corresponding author. Due to the commercial sensitivity associated with the program, full disclosure of underlying data may not be possible. The datasets used in this article are not publicly available, since the relevant experimental data are still for follow-up research. Please contact the corresponding author if you need to obtain the datasets.
Acknowledgments
This work was supported by the China Institute of Atomic Energy (CIAE). The views expressed herein are those of the authors alone and do not necessarily reflect the views of the CIAE. The CIAE assumes no responsibility for any use of the information contained in this article.
Conflicts of Interest
The authors declare no conflicts of interest.
References
- International Atomic Energy Agency (IAEA). Guidelines for Non-Destructive Measurement of Nuclear Material Holdup in Nuclear Facilities; IAEA-TECDOC-1923; IAEA: Vienna, Austria, 2023; pp. 45–78. [Google Scholar]
- Pillay, K.K.S. Tracer Techniques in Estimating Nuclear Materials Holdup. J. Radioanal. Nucl. Chem. 1988, 124, 313–329. [Google Scholar] [CrossRef] [Scilit]
- Zucker, M.S.; Degen, M.; Cohen, I. Holdup measurement for nuclear fuel manufacturing plants. In Proceedings of the Institute of Nuclear Materials Management Conference, Upton, NY, USA, 13 July 1981. [Google Scholar]
- Borda, G.; Brackx, E.; Boisset, L. Use of a Pulsed Column Contactor as a Continuous Oxalate Precipitation Reactor. Nucl. Eng. Des. 2011, 241, 809–814. [Google Scholar] [CrossRef] [Scilit]
- Dirksen, J.A.; Benjelloun, S.; Ring, T.A. Modelling the Precipitation of Copper Oxalate Aggregates. Colloid Polym. Sci. 1990, 268, 864–876. [Google Scholar] [CrossRef] [Scilit]
- He, L.X.; Gan, L.; Sui, H.Z.; Chen, L.J. Self-Absorption Correction Method for Holdup Measurement in Uranium Produced Tank. At. Energy Sci. Technol. 2014, 48, 908–912. [Google Scholar] [CrossRef]
- Wang, J.; He, L.X.; Shao, J.W.; Li, Y.R. Study on Holdup Measurement of Uranium in Valve by γ-Ray Spectrometry. At. Energy Sci. Technol. 2024, 58, 489–497. [Google Scholar] [CrossRef]
- Wu, L.Q.; Wei, M.F.; Zhang, L.P.; Yang, S.L. Primary Study on Holdup Measurement of 235U in Pipe Using γ-Ray Spectrometry and Monte Carlo Simulation. Nucl. Sci. Tech. 2006, 17, 241–244. [Google Scholar] [CrossRef] [Scilit]
- Hagenauer, R.C.; Mayer, R.L. Methods for Nondestructive Assay Holdup Measurements in Shutdown Uranium Enrichment Facilities; U.S. Department of Energy: Washington, DC, USA, 1991.
- Russo, P.A.; Sprinkle, J.K.; Bjork, C.W.; McKnown, T.O.; Sheppard, G.A.; Smith, S.E.; Harri, J.F. Evaluation of the Integrated Holdup Measurement System with the M3CA for Assay of Uranium and Plutonium Holdup; Office of Scientific and Technical Information (OSTI): Oak Ridge, TN, USA, 1999. [CrossRef] [Scilit]
- Lu, W.G.; Xu, Z.; Cheng, Y.M. Research on Pipeline Holdup Measurement Technology. Annu. Rep. China Inst. At. Energy (Engl. Ed.) 2012, 1, 221–222. [Google Scholar]
- Wang, Z.J.; Zhang, Q.H.; Liu, J.; Guan, C.L. Design of the 3He Detector in Neutron Multiplicity Counter Based on MCNP Simulation. Nucl. Electron. Detect. Technol. 2010, 30, 1626–1628. [Google Scholar] [CrossRef]
- Wang, X.Z.; Jia, X.J.; Liu, J.G. Measurement of Plutonium-Containing Materials by Passive Coincidence Neutron Method. At. Energy Sci. Technol. 1998, 32, 42–47. (In Chinese) [Google Scholar] [CrossRef]
- Zhou, C.L.; Liang, Y.; Wang, H.B. Study on Total Neutron Measurement Method for Plutonium-Containing Materials in Reprocessing Plants. Acad. Annu. Meet. Chin. Nucl. Soc. 2013, 3. [Google Scholar]
- Reilly, D.; Ensslin, N.; Smith, H., Jr.; Kreiner, S. Passive Nondestructive Assay of Nuclear Materials; NUREG/CR-5550; U.S. Nuclear Regulatory Commission: Rockville, MD, USA, 1991.
- Zhang, Z.F.; Wang, J.F.; Zhang, T.X.; Ren, F.Y.; Wang, J.; Ding, G.L.; Diao, Y.H.; Wang, H.B.; Wang, J.Y.; Wang, H.F.; et al. Engineering of Nuclear Fuel Reprocessing for Power Reactors; China Atomic Energy Press: Beijing, China, 2013. [Google Scholar]
- Wang, Z.Y.; Li, H.L.; Feng, C.Q.; Zhang, B.; Ma, J. Optimization of Liquid Level Detection Technology for Pulse Precipitation Reactor in Reprocessing Plant. Nucl. Electron. Detect. Technol. 2025, 45, 1079–1085. [Google Scholar] [CrossRef]
- ISO 11929-1:2025; Determination of the Characteristic Limits (Decision Threshold, Detection Limit and Limits of the Coverage Interval) for Measurements of Ionizing Radiation—Fundamentals and Application—Part 1: Elementary Applications. ISO: Geneva, Switzerland, 2025.

Disclaimer/Publisher’s Note: The statements, opinions and data contained in all publications are solely those of the individual author(s) and contributor(s) and not of MDPI and/or the editor(s). MDPI and/or the editor(s) disclaim responsibility for any injury to people or property resulting from any ideas, methods, instructions or products referred to in the content. |
© 2026 by the authors. Licensee MDPI, Basel, Switzerland. This article is an open access article distributed under the terms and conditions of the Creative Commons Attribution (CC BY) license.