


Abstract
Oxalis tuberosa (oca) is an underutilized Andean tuber with potential as an alternative starch source. This study compared native starches isolated from locally recognized yellow, pink, and black oca materials using compositional, structural, morphological, hydration, pasting, and thermal analyses. All starches exhibited B-type crystallinity but differed significantly in their measured characteristics. Black oca starch had the highest amylose content (28.1%), relative crystallinity (35.8%), median granule diameter (22.8 μm), and FTIR 1047/1022 ratio (1.36). Conversely, pink starch showed the highest swelling power at 90 °C (17.5 g g−1), peak viscosity (3900 cP), and gelatinization enthalpy (12.83 J g−1), compared with 10.9 g g−1, 2350 cP, and 7.61 J g−1, respectively, for black starch. The ordering of DSC parameters did not parallel XRD-derived relative crystallinity, indicating that relative crystallinity alone did not explain the thermal behavior. The contrasting functional profiles suggest that pink starch warrants further evaluation for applications requiring high hydration and viscosity development, whereas the lower RVA breakdown of black starch may be advantageous where resistance to viscosity loss during heating and shear is required. These findings demonstrate starch-level variation among the three local oca materials; however, application performance requires formulation-level validation, and broader multi-location and multi-harvest studies are needed to establish the stability of these characteristics.
1. Introduction
Starch is a ubiquitous biopolymer and an important functional ingredient in foods, pharmaceuticals, and numerous industrial applications because of its diverse physicochemical characteristics. Its functionality is associated with a hierarchical structure ranging from molecular architecture, including the amylose–amylopectin ratio, to supramolecular organization involving crystalline and amorphous regions, granule morphology, and macroscopic properties such as swelling behavior, pasting characteristics, and thermal stability [1,2,3]. Botanical origin is an important source of variation in these characteristics, resulting in diverse starch properties among plant species.
Oxalis tuberosa is a native Andean tuber crop increasingly recognized as a potential alternative starch source. Oca is traditionally cultivated in highland Andean production systems and forms part of the region’s considerable tuber-crop diversity. Previous studies have shown that tuber starches generally exhibit B-type crystallinity, varying amylose contents, and diverse granule morphologies associated with differences in hydration behavior, thermal transitions, and rheological properties [4,5]. From an agronomic perspective, its productivity can vary with germplasm, altitude, growing environment, crop management, and harvest conditions, while its commercial and industrial development remains limited compared with major starch crops. Consequently, greater utilization of oca as an alternative starch resource requires consideration of both its technological characteristics and the biological and environmental variability of the crop [6,7].
Although several studies have reported individual physicochemical or functional characteristics of oca starch, comprehensive comparisons among cultivars integrating structural, thermal, and functional properties remain limited. Previous investigations have shown that O. tuberosa starch exhibits B-type crystallinity, intermediate amylose content, and physicochemical properties comparable to those of other Andean tuber starches. Zhu and Cui [8] compared oca, potato, and maize starches and reported differences in crystallinity, swelling behavior, and gelatinization characteristics. Puelles-Román et al. [9] further demonstrated that annealing modifies the thermal, rheological, and functional properties of oca starch, illustrating the responsiveness of this starch to processing. More recently, Aurora-Vigo et al. [10] summarized the physicochemical, nutritional, and industrial relevance of O. tuberosa and highlighted its potential as a non-conventional starch source. Together, these studies demonstrate that research on oca starch has progressed from basic native-starch characterization toward evaluation of physical modification and potential technological utilization. Nevertheless, the available evidence remains much less extensive than that for established commercial starch sources, and comparative information across locally differentiated oca materials remains limited.
Studies of starches from different cultivars and genotypes have also shown that variation can occur within a botanical species, including differences in amylose content, crystalline organization, granule morphology, and functional behavior [11,12]. Advances in analytical characterization have emphasized the value of examining multiple structural descriptors alongside physicochemical and functional measurements when characterizing native starch resources [13]. Nevertheless, most published work on oca starch has focused on individual materials, comparisons of oca with other botanical starch sources, or modification of a particular oca starch rather than side-by-side characterization of multiple locally differentiated materials under a common analytical framework. This gap is particularly relevant for pigmented Andean oca materials, because differences in external colour occur within a broader background of morphological, agronomic, and biochemical diversity. Consequently, comparative characterization of starches from locally recognized yellow, pink, and black materials can provide information on starch-level variation within this broader phenotypic diversity, if pigmentation itself is not interpreted as the causal determinant of starch properties.
The functional behavior of starch has been associated with several characteristics, including amylose content, crystalline organization, granule morphology, and short-range molecular order. Variations in these characteristics may accompany differences in swelling capacity, viscosity development, gelatinization behavior, and thermal properties [3,14,15,16]. However, starch functionality arises from multiple interacting levels of molecular and supramolecular organization, and individual structural descriptors should not necessarily be regarded as direct predictors of functional behavior. Comparative characterization across cultivars can therefore help identify patterns of variation while also indicating which relationships require further mechanistic investigation. Principal component analysis (PCA), for example, has been applied in starch and food characterization to summarize covariation among multiple measured characteristics and visualize differences among samples [13,17].
Therefore, the present study comparatively characterized native starches isolated from three O. tuberosa cultivars (yellow, pink, and black). The yellow, pink, and black materials were selected because they represent locally recognized and readily distinguishable oca materials occurring within the same production area in Acobamba Province, Huancavelica. Their contrasting pigmentation provided a practical basis for field identification and consistent separation during sampling, but colour itself was not considered the biological mechanism responsible for differences in starch properties. Rather, these materials were used as a phenotypically contrasting subset of the broader diversity of locally maintained oca. Comparing materials obtained from the same geographical setting and processing their starches using identical extraction and analytical procedures provided a common framework for evaluating whether appreciable starch-level variation exists among locally differentiated oca materials while minimizing variation introduced by analytical methodology. Because differences among locally maintained oca materials may extend beyond pigmentation to broader morphological, biochemical, and agronomic characteristics, identifying variation in their native starch properties can also help determine whether this local diversity warrants broader germplasm-level and application-oriented investigation. The present comparison does not establish that pigmentation or any other unmeasured tuber characteristic caused the observed starch differences; rather, it provides a comparative baseline for subsequent multi-genotype, multi-environment, and formulation-level studies. The specific objectives were to: (1) characterize their amylose content, crystalline characteristics, FTIR-derived short-range molecular order, and granule morphology; (2) evaluate swelling behavior, pasting characteristics, and conventional DSC gelatinization parameters; and (3) use exploratory PCA to summarize multivariate patterns among the measured characteristics. The resulting data provide comparative information on three native oca starches and establish a basis for broader investigations involving additional germplasm, growing environments, detailed molecular characterization, and application-level testing.
2. Materials and Methods
2.1. Materials
Fresh tubers of three locally recognized Oxalis tuberosa materials, identified as yellow, pink, and black according to their predominant external pigmentation, were collected on 15 May 2025 from Acobamba Province, Huancavelica, Peru. For each material, three independent biological replicates were collected from separate groups of mature plants. The tubers were transported to the Universidad Nacional de Huancavelica and processed within 72 h of collection. Representative photographs of the three tuber materials are provided in Supplementary Figure S6.
2.2. Starch Extraction
The starch was isolated by wet milling. The tubers were thoroughly washed to remove soil and other impurities, peeled by hand and sliced. Approximately 1 kg of peeled tuber material from each biological replicate was processed independently. The homogenate was passed through a double layer of muslin cloth to remove fiber. The suspension was kept at room temperature for 12 h and the supernatant removed. The starch was washed three times with distilled water to remove soluble contamination. The starch was dried in a hot-air oven (FD 23, Binder GmbH, Germany) at 40 °C for 24 h, gently ground and sieved through a 100-mesh sieve. The starch samples were stored in an airtight container at 4 °C until use.
2.2.1. Starch Extraction Yield
Starch extraction yield was determined independently for each biological replicate using a gravimetric recovery approach. Following wet milling, filtration, sedimentation, washing, and drying as described in Section 2.2, the recovered starch was dried at 40 °C for 24 h and weighed. Extraction yield was calculated as the mass of recovered dry starch relative to the initial fresh mass of peeled tuber subjected to extraction, following the general gravimetric approach used for starch recovery from root and tuber materials [18,19]. The extraction yield was calculated as follows:
where the mass of recovered dry starch represents the starch obtained after completion of the extraction, washing, and drying procedure, and the initial mass of fresh peeled tuber represents the starting material subjected to wet milling.
Starch extraction yield (%) = [mass of recovered dry starch (g)/initial mass of fresh peeled tuber (g)] × 100
The resulting value was interpreted as starch recovery under the specified extraction conditions rather than as a direct measurement of the total starch content of the intact tuber. Gravimetric extraction yield can be affected by both the amount of starch present in the starting material and the efficiency of its recovery during processing. In particular, the extent of tissue disruption and starch-granule liberation during milling, retention or loss of starch during filtration, sedimentation efficiency, losses during washing and decantation, and subsequent drying and handling can influence the amount of starch ultimately recovered. To minimize procedural variation among samples, the same starting mass, milling procedure, filtration conditions, 12 h sedimentation period, three washing cycles, and drying conditions were applied consistently to all biological replicates and cultivars.
Extraction yield was determined separately for the three independent biological replicates of each cultivar and is reported as mean ± standard deviation (n = 3). Accordingly, comparisons among cultivars represent differences in starch recovery under a common standardized wet-milling procedure and should not be interpreted independently as differences in the intrinsic total starch concentration of the original tubers.
2.2.2. Proximate Composition of Isolated Starch
The proximate composition of the isolated starches was determined to assess starch purity prior to structural and functional characterization. Moisture content was determined according to AOAC Official Method 925.10 by oven drying to constant weight. Crude protein content was determined using the Kjeldahl method (AOAC Official Method 960.52) with a nitrogen-to-protein conversion factor of 6.25. Crude lipid content was measured by Soxhlet extraction (AOAC Official Method 920.39) using petroleum ether as the extraction solvent, while ash content was determined by dry ashing in a muffle furnace at 550 °C according to AOAC Official Method 923.03. Total carbohydrate content was estimated by difference from the measured proximate components according to the following equation:
Carbohydrate (%) = 100 − [Moisture (%) + Protein (%) + Lipid (%) + Ash (%)]
Proximate composition was expressed on an as-is basis, and carbohydrate content was estimated by difference. All determinations were performed independently for the three biological replicates of each cultivar, and the results are reported as mean ± standard deviation (n = 3).
2.3. Amylose Content Determination
The amylose content was determined by iodine colorimetry. Prior to amylose determination, the isolated starch samples were defatted to eliminate residual lipids that could interfere with iodine complex formation. Briefly, the starch samples were mixed with 85% methanol (1:10, w/v) and stirred at room temperature for 2 h. The suspension was centrifuged at 3000× g for 10 min, the supernatant was discarded, and the residue was washed twice with fresh 85% methanol. The defatted starch was air-dried at room temperature to remove residual solvent before amylose analysis. A sample of starch (100 mg) was suspended in 10 mL of 1 M NaOH and heated at 90 °C for 10 min to dissolve the starch. The sample was then cooled and diluted to 100 mL with water. A sample (5 mL) was combined with 1 mL iodine solution and made up to 50 mL. The absorbance was measured at 620 nm in a UV-Vis spectrophotometer (Cary 5000, Agilent Technologies, Australia). Amylose percentage was determined from the calibration curve obtained from amylose standards and expressed on a dry-starch basis. A calibration curve was prepared using potato amylose standards (Sigma-Aldrich, St. Louis, MO, USA) within the concentration range of 0–100 μg mL−1 (R2 > 0.99).
2.4. X-Ray Diffraction and Relative Crystallinity
The crystalline structure of the starch samples was examined using X-ray diffraction (XRD). Diffraction patterns were obtained using a Bruker D8 Advance diffractometer (Bruker AXS GmbH, Karlsruhe, Germany) operated at 40 kV and 30 mA using Cu Kα radiation (λ = 1.5406 Å). Diffraction patterns were recorded over a 2θ range of 5–40°, with a step size of 0.02° and a scanning rate of 2° min−1. The same acquisition conditions were applied to all biological replicates, and the original experimental diffractograms prior to deconvolution are provided in Supplementary Figure S1.
XRD peak deconvolution was performed to estimate crystalline and amorphous contributions within each starch sample. Experimental diffractograms were fitted using nonlinear peak-fitting procedures in OriginPro 2023 (OriginLab Corporation, Northampton, MA, USA). The fitting procedure followed the general whole-profile approach used for semicrystalline starch systems, in which discrete crystalline reflections are resolved from a broad amorphous scattering contribution rather than treating all intensity above a simple baseline as crystalline. The complete experimental interval of 5–40° 2θ was considered during fitting, and the same fitting procedure was applied consistently to all biological replicates and cultivars.
Before deconvolution, the instrumental/background baseline was established across the analyzed 5–40° 2θ interval without removing the broad starch-associated diffuse scattering. The remaining starch diffraction profile was subsequently represented as the combination of a broad amorphous contribution and Gaussian crystalline components. This distinction was used to avoid assigning the broad diffuse intensity underlying the crystalline reflections to the crystalline fraction.
Characteristic B-type crystalline peaks were resolved from the amorphous background using Gaussian functions. Four principal Gaussian crystalline components were initialized from the reproducible diffraction maxima observed experimentally at approximately 5.6°, 17°, 22°, and 24° 2θ, corresponding to the characteristic B-type reflections identified in all three starch preparations. Peak centers were permitted only limited adjustment around the corresponding experimental maxima during nonlinear least-squares optimization, whereas peak intensities and widths were constrained to remain positive. The same component-assignment criteria and fitting strategy were maintained across samples.
Components were assigned to crystalline contribution when they represented reproducible, relatively narrow diffraction maxima or shoulders corresponding to the characteristic B-type pattern. In contrast, the broad diffuse component extending beneath the resolved reflections was assigned to the amorphous contribution. No additional component was classified as crystalline solely to improve numerical goodness of fit.
Relative crystallinity (Rc, %) was calculated according to:
where Ac represents the summed integrated area of the fitted crystalline Gaussian components and Aa represents the integrated area assigned to the broad amorphous contribution.
Rc (%) = [Ac/(Ac + Aa)] × 100
The crystalline-to-amorphous ratio was subsequently calculated by dividing the crystalline area by the amorphous area. Goodness-of-fit was evaluated using weighted residual values (Rwp), and residual plots were inspected to assess fitting quality. Fit adequacy was evaluated from agreement between the observed and calculated diffraction profiles, inspection of residuals across the complete fitted 2θ interval, and Rwp. The resulting Rwp values were 4.21% for pink, 4.06% for yellow, and 3.98% for black starch. Original diffractograms are provided in Supplementary Figure S1, while observed-versus-fitted profiles and residual plots are presented in Supplementary Figure S2; the corresponding deconvolution outputs are reported in Supplementary Table S4.
2.5. Fourier Transform Infrared Spectroscopy
FTIR spectra were obtained using a PerkinElmer spectrometer (PerkinElmer Inc., Waltham, MA, USA). Spectra were recorded within the range of 4000–400 cm−1 at a resolution of 4 cm−1 with 32 accumulated scans per sample. Prior to analysis, the ATR crystal was cleaned with ethanol, and background spectra were collected under identical conditions. The short-range molecular order of starch granules was evaluated using the absorbance ratio at 1047 and 1022 cm−1. The 1047/1022 and 1047/995 absorbance ratios were calculated from the fingerprint region and used as descriptors of FTIR-derived short-range molecular organization.
2.6. Scanning Electron Microscopy and Particle Size Analysis
Scanning electron microscopy (SEM) was used to examine the morphology and surface characteristics of the starch granules. The analyses were conducted using a JEOL JSM-6510LV scanning electron microscope (JEOL Ltd., Tokyo, Japan). Dried starch samples were mounted on aluminum stubs using double-sided carbon adhesive tape and coated with a thin layer of gold prior to observation. Micrographs were obtained at an accelerating voltage of 10–15 kV and a magnification of ×2000. For each biological replicate, representative micrographs were obtained from multiple non-overlapping fields of view. At least 200 granules were measured per starch sample for descriptive characterization of the granule-size distribution. Individual granules were not treated as independent biological replicates for inferential statistical analysis. The average diameter, standard deviation, skewness, and percentiles (D10, D50, and D90) were calculated.
2.7. Thermal Properties (Differential Scanning Calorimetry)
The gelatinization properties of the isolated starches were determined by differential scanning calorimetry (DSC) using a DSC Q2000 instrument (TA Instruments, New Castle, DE, USA). Approximately 3–5 mg of starch, calculated on a dry-weight basis, was weighed into aluminum DSC pans and mixed with distilled water at a starch-to-water ratio of 1:3 (w/w). The pans were hermetically sealed and equilibrated for 1 h at 30 °C to allow uniform hydration of the starch before thermal analysis. An empty sealed aluminum pan was used as the reference.
Samples were subjected to a continuous heating scan from 30 to 120 °C at a heating rate of 10 °C min−1 under a nitrogen atmosphere maintained at a flow rate of 50 mL min−1. The resulting endothermic thermograms were analyzed to determine the onset gelatinization temperature (To), peak gelatinization temperature (Tp), conclusion gelatinization temperature (Tc), and gelatinization enthalpy (ΔH). Gelatinization enthalpy was calculated from the integrated area of the gelatinization endotherm and expressed as J g−1 of dry starch. The gelatinization temperature interval (ΔT) was calculated as:
where To and Tc represent the onset and conclusion temperatures, respectively. This interval was used only as a descriptive measure of the width of the gelatinization transition.
ΔT = Tc – To
For each cultivar, DSC measurements were obtained from independently extracted biological replicates, and the thermal parameters are reported as mean ± standard deviation (n = 3). The experimental DSC thermograms and the conventional thermal parameters (To, Tp, Tc, and ΔH) were used for comparison among the three starch samples. No additional composite thermal or energy indices were used for interpretation.
2.8. Pasting Properties (Rapid Visco Analyzer)
The pasting properties of the native starches were determined using a Rapid Visco Analyzer (RVA 4500, Perten Instruments, AB, Hägersten, Sweden), following a standard RVA pasting procedure with minor adaptation. Starch (3.0 g, dry basis) was weighed directly into the RVA aluminum canister and 25.0 mL of distilled water was added. The starch–water suspension was mixed with the RVA paddle at 960 rpm for the first 10 s to ensure uniform dispersion, after which the paddle speed was maintained at 160 rpm for the remainder of the analysis.
The suspension was initially held at 50 °C for 1 min, heated from 50 to 95 °C at 6 °C min−1, maintained at 95 °C for 5 min, cooled to 50 °C at 6 °C min−1, and finally maintained at 50 °C for 2 min. Viscosity was continuously recorded during the heating–holding–cooling cycle.
Peak viscosity (PV), trough viscosity (TV), final viscosity (FV), breakdown viscosity (BD), and setback viscosity (SB) were obtained from the resulting pasting profiles and expressed in centipoise (cP). Breakdown viscosity (BD) was calculated as the difference between peak viscosity (PV) and trough viscosity (TV), whereas setback viscosity (SB) was calculated as the difference between final viscosity (FV) and trough viscosity:
where PV is the maximum viscosity attained during heating, TV is the minimum viscosity following peak development during the high-temperature holding stage, and FV is the viscosity recorded at the end of the cooling stage. Measurements were performed using three independently extracted biological replicates for each cultivar (n = 3), and the results are reported as mean ± standard deviation.
BD = PV − TV
SB = FV – TV
2.9. Swelling Power
Swelling power was determined using a gravimetric method based on previously reported procedures, with minor modifications. Starch suspensions (1%, w/v) were prepared in distilled water and heated separately at 50, 60, 70, 80, and 90 °C for 30 min with continuous mixing to maintain uniform dispersion. After heating, the suspensions were cooled to room temperature and centrifuged at 3000× g for 15 min. The supernatant was carefully decanted without disturbing the hydrated starch sediment, and the wet sediment was weighed immediately. Swelling power was calculated as:
Swelling power (g g−1) = mass of hydrated starch sediment (g)/initial dry mass of starch (g)
Measurements were performed independently for three biological replicates of each cultivar (n = 3), and the results are reported as mean ± standard deviation.
2.10. Data Analysis
Data are presented as mean ± standard deviation of three independent biological replicates (n = 3). Differences among the three local materials were evaluated using one-way analysis of variance (ANOVA), followed by Tukey’s honestly significant difference (HSD) test for multiple comparisons when the overall ANOVA was significant. Statistical significance was evaluated at p < 0.05. Assumptions of normality and homogeneity of variance were evaluated before ANOVA. Individual starch granules measured during image analysis were used only for descriptive particle-size characterization and were not treated as independent biological replicates in inferential analyses.
PCA was performed as an exploratory multivariate analysis using the independent biological replicates as observational units. The PCA input matrix comprised nine observations, corresponding to three independently analyzed biological replicates from each of the pink, yellow, and black cultivars, and ten variables: amylose content, XRD-derived relative crystallinity, FTIR 1047/1022 ratio, median granule diameter (D50), swelling power at 90 °C, peak viscosity, breakdown viscosity, setback viscosity, peak gelatinization temperature (Tp), and gelatinization enthalpy (ΔH).
Variables were selected to represent the principal structural, morphological, hydration, pasting, and thermal characteristics evaluated in the study while avoiding simultaneous inclusion of closely related or mathematically derived descriptors. Because the variables were expressed in different units and numerical scales, all variables were mean-centered and standardized to unit variance before PCA. The complete observation-by-variable matrix used for PCA is provided in Supplementary Table S6.
PCA was used solely as an exploratory descriptive analysis of multivariate variation within the present dataset. Although independent biological replicates were used as observational units, only three cultivars were represented; therefore, the PCA was not used for inferential hypothesis testing, prediction, classification, or establishment of causal or generalizable structure–property relationships.
3. Results
3.1. Starch Extraction Yield and Proximate Composition
The starch extraction yield and proximate composition of native starches isolated from the three Oxalis tuberosa cultivars are presented in Table 1. Extraction yield varied from 18.6 ± 0.5% for the pink cultivar to 21.4 ± 0.6% for the yellow cultivar and 24.1 ± 0.7% for the black cultivar, indicating differences in starch recovery under the same extraction conditions.
Table 1.
Starch extraction yield and proximate composition of native starches isolated from three Oxalis tuberosa cultivars.
The proximate compositions of the isolated starches were broadly comparable. Moisture content ranged from 9.8 ± 0.2% to 10.4 ± 0.2%, while residual protein, lipid, and ash contents were low in all three starches. Protein contents were 0.42 ± 0.03%, 0.37 ± 0.02%, and 0.31 ± 0.02% for the pink, yellow, and black cultivars, respectively. Corresponding lipid contents were 0.18 ± 0.01%, 0.15 ± 0.01%, and 0.12 ± 0.01%, while ash contents were 0.29 ± 0.02%, 0.24 ± 0.02%, and 0.20 ± 0.01%.
Carbohydrate content showed only a narrow numerical range among the samples, with values of 88.71 ± 0.28%, 89.14 ± 0.31%, and 89.57 ± 0.24% for the pink, yellow, and black cultivars, respectively. Although statistical differences were detected for some proximate-composition measurements (Table 1), the absolute differences were small. Overall, the high carbohydrate content and low residual protein, lipid, and ash contents indicate comparably high starch purity among the three preparations.
3.2. Structural Characteristics of Native O. tuberosa Starches
The three starch samples differed in several measured structural characteristics (Figure 1). Amylose content was 21.7% in the pink cultivar, 24.8% in the yellow cultivar, and 28.1% in the black cultivar (Figure 1A). Relative crystallinity followed the same numerical order, with values of 27.5%, 31.2%, and 35.8% for the pink, yellow, and black cultivars, respectively (Figure 1C). The FTIR 1047/1022 ratio, used here as an indicator of short-range molecular order, was 1.08 for pink, 1.23 for yellow, and 1.36 for black starch (Figure 1D).
Figure 1.
Structural characteristics of starches isolated from pink, yellow, and black Oxalis tuberosa cultivars: (A) amylose content, (B) X-ray diffraction (XRD) patterns showing B-type crystallinity, (C) XRD-derived relative crystallinity, and (D) FTIR 1047/1022 ratio as an indicator of short-range molecular order. Values are means ± SD of three independent biological replicates (n = 3). Different letters indicate differences according to Tukey’s HSD test (p < 0.05).
X-ray diffraction patterns showed the characteristic B-type crystalline pattern in all three starches, with reflections at approximately 5.6°, 17°, 22°, and 24° (2θ) (Figure 1B). Thus, the starches shared the same crystalline polymorph while differing in XRD-derived relative crystallinity. Among the three samples examined, the black cultivar had the highest measured amylose content, relative crystallinity, and FTIR-derived short-range order, whereas the pink cultivar had the lowest values and the yellow cultivar showed intermediate values.
3.3. X-Ray Diffraction Peak Deconvolution and Crystalline Domain Quantification
Peak deconvolution was used to estimate the crystalline and amorphous contributions to the XRD patterns (Figure 2). The fitted profiles followed the experimental diffractograms, with Rwp values ranging from 3.98% to 4.21% (Figure 2A–C).
Figure 2.
X-ray diffraction (XRD) peak deconvolution and estimated crystalline and amorphous contributions in native starches isolated from pink, yellow, and black Oxalis tuberosa cultivars. Panels (A–C) show the experimental and fitted profiles, and panel (D) summarizes XRD-derived relative crystallinity and amorphous fractions.
All three starches retained characteristic B-type reflections at approximately 5.6°, 17°, 22°, and 24° (2θ). XRD-derived relative crystallinity was 27.5 ± 0.7% for the pink cultivar, 31.2 ± 0.8% for the yellow cultivar, and 35.8 ± 0.9% for the black cultivar (Figure 2D). The corresponding estimated amorphous fractions were 72.5 ± 0.7%, 68.8 ± 0.8%, and 64.2 ± 0.9%, respectively.
The calculated crystalline-to-amorphous ratios were 0.38 for pink, 0.45 for yellow, and 0.56 for black starch. These measurements indicate differences in the relative proportions of XRD-derived crystalline and amorphous domains among the three samples without a change in the overall B-type crystalline polymorph.
3.4. FTIR Spectral Characteristics and Short Range Molecular Organization
The ATR–FTIR spectra of the three O. tuberosa starches displayed the characteristic absorption bands of native starch, including O–H stretching near 3400 cm−1, C–H stretching near 2930 cm−1, and H–O–H bending associated with bound water near 1640 cm−1 (Figure 3A). The overall spectral profiles were similar among the three starch samples.
Figure 3.
ATR–FTIR spectral characteristics of native starches isolated from pink, yellow, and black Oxalis tuberosa cultivars: (A) complete ATR–FTIR spectra, (B) fingerprint region, (C) 1047/1022 absorbance ratio, and (D) 1047/995 absorbance ratio. Values are means ± SD of three independent biological replicates (n = 3). Different letters indicate differences according to Tukey’s HSD test (p < 0.05).
Differences were observed in the fingerprint region between 1200 and 900 cm−1, particularly around 1150, 1047, 1022, and 995 cm−1 (Figure 3B). The 1047/1022 absorbance ratio was 1.08 ± 0.03 for pink, 1.23 ± 0.04 for yellow, and 1.36 ± 0.04 for black starch (Figure 3C). The corresponding 1047/995 ratios were 0.87 ± 0.02, 1.01 ± 0.03, and 1.13 ± 0.03, respectively (Figure 3D).
Accordingly, the black starch showed the highest FTIR-derived short-range order among the three samples, whereas the pink starch showed the lowest values for these FTIR ratios. These measurements describe differences in local molecular organization and should not be interpreted as a complete characterization of starch molecular architecture.
3.5. Granule Morphology and Particle-Size Characteristics
Granule morphology and particle-size distributions differed among the three starch samples (Figure 4). The median granule diameter (D50) was 14.2 μm for the pink cultivar, 17.4 μm for the yellow cultivar, and 22.8 μm for the black cultivar. Based on the corresponding D10 and D90 values, the D90−D10 distribution spans were 12.6 μm for pink starch, 17.4 μm for yellow starch, and 21.1 μm for black starch.
Figure 4.
Granule morphology and particle-size characteristics of native starches isolated from pink, yellow, and black Oxalis tuberosa cultivars. Representative scanning electron microscopy (SEM) images illustrate granule morphology, while particle-size distributions are summarized using D10, D50, and D90 descriptors. D50 represents the median granule diameter, and D10 and D90 represent the diameters below which 10% and 90% of the measured granules occurred, respectively. Particle-size summary values are reported for three independently extracted biological replicates (n = 3); where error bars are shown, they represent mean ± standard deviation.
Thus, within the samples examined, black starch contained larger granules and exhibited a broader particle-size distribution, whereas pink starch contained smaller granules with a narrower distribution. Yellow starch showed intermediate particle-size characteristics. These observations describe morphological differences among the three starch preparations; their relationship with other structural or functional measurements is considered separately as exploratory rather than causal.
3.6. Hydration and Pasting Characteristics
Swelling power increased with temperature in all three Oxalis tuberosa starch samples (Figure 5A). At 90 °C, pink starch exhibited the highest swelling power (17.5 ± 0.8 g g−1), followed by yellow (13.9 ± 0.7 g g−1) and black starch (10.9 ± 0.6 g g−1). Thus, the three starch preparations differed in the magnitude of their swelling response under the experimental conditions.
Figure 5.
Hydration, pasting, and exploratory multivariate characteristics of native starches isolated from pink, yellow, and black Oxalis tuberosa cultivars. (A) Temperature-dependent swelling power; (B) RVA pasting profiles; (C) breakdown viscosity; (D) setback viscosity; and (E) exploratory PCA biplot. Values in panels (A–D) are presented as mean ± SD of three independent biological replicates (n = 3). PCA in panel E was based on nine biological observations (three independent replicates per cultivar) and ten mean-centered, unit-variance standardized variables. PC1 and PC2 explained 96.6% and 2.7% of the total variance, respectively. The complete PCA input matrix is provided in Supplementary Table S6. PCA results are presented solely as an exploratory descriptive summary and not as evidence of causal, predictive, or generalizable structure–property relationships.
The RVA pasting profiles also differed among the three starches (Figure 5B). Peak viscosity was 3900 ± 85 cP for pink, 3100 ± 78 cP for yellow, and 2350 ± 64 cP for black starch. Trough viscosity followed the same numerical order, with values of 2500 ± 72, 2200 ± 65, and 1800 ± 54 cP, respectively. Final viscosity was 3200 ± 68 cP for pink, 2700 ± 60 cP for yellow, and 2100 ± 70 cP for black starch. These differences describe contrasting pasting profiles among the three starch preparations. Although they occurred alongside differences in amylose content, XRD-derived relative crystallinity, FTIR-derived short-range order, and granule characteristics, the present comparative design does not establish that any individual structural characteristic was responsible for the observed RVA behavior.
Breakdown viscosity, calculated as peak viscosity minus trough viscosity, was 1400 ± 70 cP for pink, 900 ± 58 cP for yellow, and 550 ± 46 cP for black starch (Figure 5C). Thus, black starch underwent the smallest viscosity decrease following peak development under the RVA heating and shear conditions. This observation indicates greater resistance to viscosity breakdown under the specific experimental conditions but does not identify the structural mechanism responsible for this behavior.
Setback viscosity, calculated as final viscosity minus trough viscosity, was 700 ± 45 cP for pink, 500 ± 38 cP for yellow, and 300 ± 32 cP for black starch (Figure 5D). These values indicate differences in development of viscosity during cooling among the three starches. Although setback viscosity is commonly used as an empirical indicator of starch-chain reassociation, long-term retrogradation was not directly measured in the present study; therefore, the observed values are interpreted as differences in RVA setback behavior rather than direct measurements of retrogradation.
Exploratory principal component analysis (PCA) was performed using nine biological observations, comprising three independent biological replicates for each cultivar, and ten standardized variables representing structural, morphological, hydration, pasting, and thermal characteristics (Figure 5E; Table S6). The first two principal components explained 99.3% of the total variance, with PC1 accounting for 96.6% and PC2 for 2.7%. The three biological observations from each cultivar clustered closely in the PCA score space, while the three cultivars occupied distinct regions of the ordination.
The loading pattern showed that amylose content, XRD-derived relative crystallinity, the FTIR 1047/1022 ratio, and median granule diameter (D50) were oriented toward one side of PC1, whereas swelling power at 90 °C, peak viscosity, breakdown viscosity, and setback viscosity were oriented in the opposite direction. Peak gelatinization temperature (Tp) and gelatinization enthalpy (ΔH) also contributed to the separation observed in the biplot. Pink starch was positioned closer to swelling power and the RVA-derived peak, breakdown, and setback viscosity variables, whereas black starch was positioned closer to amylose content, XRD-derived relative crystallinity, FTIR 1047/1022 ratio, and D50. Yellow starch occupied a distinct region of the ordination, representing an intermediate multivariate profile. These patterns provide a descriptive visualization of the combinations of measured characteristics within the present dataset. Although independent biological replicates were used as PCA observations, the analysis represented only three cultivars. Therefore, the PCA is interpreted solely as an exploratory summary and not as evidence of causal, predictive, or generalizable structure–property relationships.
3.7. Gelatinization Characteristics
An important observation is that the ordering of the DSC parameters did not parallel with XRD-derived relative crystallinity. Black starch exhibited the highest relative crystallinity (35.8%) but the lowest Tp (65.6 °C) and ΔH (7.61 J g−1), whereas pink starch exhibited the lowest relative crystallinity (27.5%) but the highest Tp (68.7 °C) and ΔH (12.83 J g−1). This inverse ordering is mechanistically plausible because XRD-derived relative crystallinity and DSC gelatinization parameters describe different aspects of starch organization. XRD estimates the relative contribution of long-range ordered domains to the diffraction pattern, whereas DSC reflects the thermal energy associated with disruption of hydrated molecular order during gelatinization. Consequently, a greater proportion of XRD-detectable crystalline material does not necessarily imply greater thermal stability of the structures contributing to the gelatinization endotherm (Figure 6).
Figure 6.
Differential scanning calorimetry characteristics of native starches isolated from pink, yellow, and black Oxalis tuberosa cultivars. Representative DSC thermograms are shown for (A) pink, (B) yellow, and (C) black starches, with onset (To), peak (Tp), and conclusion (Tc) gelatinization temperatures indicated by dashed vertical lines. The shaded endothermic area represents the region integrated to determine gelatinization enthalpy (ΔH). (D) Comparison of To, Tp, Tc, and ΔH among the three starch samples. DSC measurements were performed on starch–water suspensions (1:3, w/w) during continuous heating from 30 to 120 °C at 10 °C min−1. Values in panel D are presented as mean ± SD of three independent biological replicates (n = 3).
At the molecular level, gelatinization depends not only on the quantity of crystalline material but also on the organization and stability of amylopectin double helices within crystalline lamellae. Amylopectin branch-chain length and distribution can influence double-helical length, packing, and thermal stability. Therefore, starch may contain a relatively large proportion of ordered domains detectable by XRD while those domains are composed of less thermally stable or more heterogeneous structures that are disrupted at lower temperatures.
Water accessibility may provide an additional contribution. Gelatinization requires water penetration into amorphous regions followed by hydration and disruption of molecular order within semicrystalline lamellae. Differences in granule architecture, molecular packing, and accessibility of amorphous regions can consequently alter gelatinization temperature and enthalpy independently of the relative amount of crystalline material. In the present study, pink starch also exhibited greater swelling at 90 °C than black starch, confirming contrasting hydration behavior among the samples. However, because swelling power and DSC gelatinization were determined under different experimental conditions, this observation should be regarded as supporting evidence of differences in hydration behavior rather than direct evidence of the mechanism responsible for the DSC trend.
The FTIR results provide an additional indication that greater native molecular order does not necessarily correspond to greater gelatinization energy. Black starch exhibited both the highest XRD-derived relative crystallinity and the highest FTIR 1047/1022 ratio, yet it showed the lowest ΔH. Thus, the amount of long-range order detected by XRD and the short-range organization reflected by FTIR were not directly proportional to the energetic stability of the structures disrupted during gelatinization. The thermal response is therefore more appropriately considered the integrated result of crystalline quantity and quality, double-helical stability, amylopectin molecular architecture, amylose–amylopectin interactions, lamellar heterogeneity, and hydration accessibility rather than relative crystallinity alone.
These potential mechanisms cannot be distinguished directly in the present study because amylopectin chain-length distribution, double-helical stability, lamellar dimensions, and water mobility were not independently characterized. Therefore, the inverse XRD–DSC relationship should not be attributed to any single mechanism. Instead, the results demonstrate that XRD-derived relative crystallinity was decoupled from gelatinization energetics in these three starch preparations. More detailed molecular and supramolecular analyses would be required to establish the structural origin of this inverse relationship.
4. Discussion
4.1. Starch Extraction Yield and Proximate Composition
Starch extraction yield varied among the three Oxalis tuberosa cultivars, ranging from 18.6% for pink to 21.4% for yellow and 24.1% for black oca. These values should be interpreted as starch recovery under the standardized wet-milling procedure rather than as direct measurements of the intrinsic starch content of the intact tubers. Gravimetric extraction yield reflects both the amount of starch available in the starting material and the efficiency with which starch granules are liberated and recovered during processing. Tissue disruption during milling, granule release from the cellular matrix, retention of starch during filtration, sedimentation behavior, losses during washing and decantation, and drying and handling can all influence the final amount of recovered starch. Similar dependence of starch recovery on raw-material characteristics and isolation conditions has been recognized for root and tuber starches [18,19].
Because the same starting mass and standardized milling, filtration, sedimentation, washing, and drying conditions were applied to all biological replicates in the present study, the observed values provide a valid comparison of starch recovery among the three cultivars under a common extraction procedure. Nevertheless, the higher recovery obtained from black oca cannot be attributed exclusively to a greater starch concentration in the original tuber. Cultivar-dependent differences in tissue architecture, ease of cellular disruption, granule liberation, granule size, and sedimentation or filtration behavior may also influence recovery. Accordingly, determination of total starch directly in the intact tuber would be required to distinguish differences in intrinsic starch concentration from differences in extractability and processing losses.
The higher extraction yield of black oca occurred alongside its larger median granule size and higher measured amylose content and XRD-derived relative crystallinity. Although larger granules could potentially differ in their sedimentation and recovery behavior during wet isolation, these concurrent observations should not be interpreted as evidence that granule size, amylose content, or relative crystallinity caused the higher extraction yield. These characteristics were not experimentally manipulated independently, and extraction efficiency was not separately quantified at individual processing stages. The present results therefore demonstrate cultivar-associated differences in starch recovery under identical isolation conditions rather than a causal relationship between structural characteristics and extraction yield.
In contrast to extraction yield, the proximate compositions of the recovered starch preparations were broadly similar. All three samples contained approximately 89% carbohydrate and relatively low residual amounts of protein, lipid, and ash, indicating effective removal of major non-starch constituents during isolation. Although statistical differences were detected for several proximate components, their absolute magnitudes were small, particularly for total carbohydrate content. The observed differences should therefore not be interpreted as evidence of major differences in the overall purity of the isolated starch preparations.
Residual non-starch components may nevertheless influence starch functionality. Lipids can interact with amylose and modify hydration and pasting behavior, whereas proteins and mineral constituents may influence water interactions, thermal transitions, and viscosity development [3,20]. However, because residual protein, lipid, and ash contents were low in all three preparations, gross differences in starch purity are unlikely to account independently for the larger cultivar-associated contrasts observed in granule size, swelling power, pasting behavior, and gelatinization characteristics. More detailed compositional and molecular analyses would be necessary to determine the specific structural factors underlying these functional differences.
A further consideration is that the composition of the original tuber matrix may indirectly influence starch recovery even when the final isolated starch contains only low concentrations of residual non-starch constituents. O. tuberosa materials can differ in soluble phenolics, pigmented phenolic compounds, organic acids, oxalate, minerals, and other secondary or non-starch constituents. During wet milling, these components may influence tissue disruption, starch-granule release, interactions among suspended cellular components, filtration, sedimentation, washing efficiency, or the physicochemical environment in which starch is recovered. Thus, differences in the original tuber matrix could potentially contribute to variation in extraction behaviour without necessarily remaining at appreciable concentrations in the purified starch. Because these tuber-level secondary metabolites were not quantified in the source materials used in the present study, their contribution to the observed differences in starch recovery cannot be determined. The extraction-yield differences should therefore be interpreted as outcomes of the complete tuber–extraction system rather than as consequences of starch composition alone.
4.2. Structural Characteristics of Oxalis tuberosa Starches
All three O. tuberosa starches exhibited the characteristic B-type XRD pattern, with reflections near 5.6°, 17°, 22°, and 24° (2θ). B-type crystallinity is commonly reported for tuber starches and is consistent with previous descriptions of starches from underground storage organs [4]. Thus, the principal crystalline polymorph was common to the three samples, despite differences in XRD-derived relative crystallinity.
Among the samples examined, amylose content increased from 21.7% in pink to 24.8% in yellow and 28.1% in black starch, while relative crystallinity increased from 27.5% to 31.2% and 35.8%, respectively. The defatting procedure used before iodine-colorimetric amylose determination was intended to minimize interference from residual lipids, which can interact with amylose and affect iodine binding [3,21]. Accordingly, the observed amylose values provide a useful comparative description of the three isolated starches.
XRD peak deconvolution further indicated differences in the estimated proportions of crystalline and amorphous contributions. Black starch had the highest crystalline-to-amorphous ratio, whereas pink starch had the lowest. These values should be regarded as relative descriptors derived from peak fitting rather than as complete measures of starch molecular architecture. XRD-derived crystallinity reflects only one level of the hierarchical organization of starch and does not directly characterize amylopectin branch-chain distribution, double-helical organization, or lamellar architecture [22].
The FTIR spectra were broadly similar in their principal absorption bands, as expected for starches sharing the same botanical species. Differences were observed in the fingerprint-region absorbance ratios. The 1047/1022 and 1047/995 ratios were lowest in pink and highest in black starch. These ratios are commonly used as descriptors of short-range molecular organization in starch systems [23,24]. Their numerical correspondence with the XRD-derived relative crystallinity observed here is noteworthy, but the two analytical techniques probe different aspects and length scales of starch organization. Therefore, the present data support differences in XRD-derived relative crystallinity and FTIR-derived short-range order among these three starch samples, rather than a generalized conclusion that cultivar identity determines overall starch molecular organization.
4.3. Granule Morphology and Hydration Behavior
Granule-size analysis provided one of the clearer physical contrasts among the samples. Median granule diameter increased from 14.2 μm in pink starch to 17.4 μm in yellow and 22.8 μm in black starch, while the D10–D90 range was also broader for black starch. Variation in granule dimensions among cultivars or genotypes has previously been reported for starches from potato and other tuber crops [14,25]. Such variability may reflect differences in starch-granule development within storage tissues, although the developmental basis of the present differences was not investigated.
Swelling power increased with temperature in all three starches, as expected from progressive hydration and disruption of granule organization during heating. At 90 °C, swelling power was 17.5 g g−1 for pink, 13.9 g g−1 for yellow, and 10.9 g g−1 for black starch. Previous studies have shown that starch swelling is affected by several characteristics, including amylose content, amylopectin architecture, crystalline organization, granule size, and interactions among starch and non-starch components [11,14,23,25].
Within the present dataset, the starch with the smallest median granule size and lower XRD-derived relative crystallinity showed the greatest swelling at 90 °C, whereas the starch with larger granules and higher relative crystallinity showed the lowest swelling. This pattern is compatible with literature describing restricted swelling in some more highly organized starch systems. However, granule size or crystallinity cannot be identified independently as the cause of the observed swelling differences because these properties covaried among the three samples and other potentially relevant molecular characteristics were not measured. The results therefore identify contrasting hydration behavior among the starches rather than establish a specific structural mechanism for that behavior.
4.4. Pasting Behavior and Associations with Structural Characteristics
The RVA profiles further distinguished the functional behavior of the three starch preparations. Pink starch showed the highest peak viscosity (3900 cP), followed by yellow (3100 cP) and black starch (2350 cP). The same ordering was observed for swelling power. Pasting viscosity reflects the combined effects of granule hydration, swelling, disruption, leaching of starch polymers, and interactions within the continuous phase; consequently, it cannot generally be attributed to a single structural characteristic [3,5,26,27].
The observed viscosity pattern occurred alongside differences in amylose content, XRD-derived relative crystallinity, FTIR-derived short-range order, and granule dimensions. Literature studies have reported associations between these characteristics and pasting behavior, particularly through their effects on water accessibility and granule expansion [26,28,29]. In the present study, however, these variables were not manipulated independently, and only three cultivars were examined. Their concurrent variation should therefore be interpreted as an association within this dataset rather than evidence of a direct structure–property relationship.
Breakdown viscosity decreased from 1400 cP in pink starch to 900 cP in yellow and 550 cP in black starch. Because breakdown represents the decrease from peak to trough viscosity under the RVA heating and shear conditions, the lower value of black starch indicates that it underwent a smaller viscosity loss after reaching its peak. This provides an operational indication of greater resistance to viscosity breakdown under the specific RVA conditions used, without identifying the molecular basis of that behavior.
Setback viscosity similarly decreased from pink (700 cP) to yellow (500 cP) and black starch (300 cP). Setback reflects viscosity development during cooling and is often used as an empirical indicator of starch-chain reassociation [26,27]. Nevertheless, setback viscosity alone should not be equated with directly measured retrogradation, which is a time-dependent process that may require complementary techniques such as DSC, XRD, or rheological measurements during storage. Accordingly, the present results are more appropriately interpreted as differences in RVA setback behavior among the three starches.
4.5. Thermal Properties and Gelatinization Characteristics
The three starches also differed in their conventional DSC gelatinization parameters. Pink starch exhibited the highest measured To, Tp, Tc, and ΔH, followed by yellow and black starch. Gelatinization enthalpy ranged from 12.83 J g−1 for pink starch to 7.61 J g−1 for black starch, whereas the gelatinization interval (Tc − To) varied only slightly among samples. These values are within ranges reported for starches from tuber and other non-conventional botanical sources, for which gelatinization behavior varies with botanical and genetic background [4,15,18,30].
An important observation is that the ordering of the DSC parameters did not parallel XRD-derived relative crystallinity. Black starch had the highest relative crystallinity but the lowest gelatinization temperatures and enthalpy, whereas pink starch showed the opposite combination. This result indicates that relative crystallinity alone does not adequately describe the thermal behavior of these starch samples. XRD-derived relative crystallinity estimates the proportion of ordered crystalline contributions, whereas gelatinization involves hydration and thermal disruption of organized structures within the granule [3,5,31].
Starch gelatinization can additionally be affected by amylopectin branch-chain architecture, double-helical organization, lamellar arrangement, interactions with amylose, granule architecture, and water accessibility [4,31,32]. These characteristics were not directly measured in the present study. Consequently, it would be speculative to attribute the higher gelatinization temperature and enthalpy of pink starch to greater crystalline perfection, restricted water accessibility, or another particular molecular mechanism. The present DSC measurements instead demonstrate that the three starch preparations have different thermal transition profiles whose molecular basis requires further investigation.
4.6. Exploratory Multivariate Analysis
PCA provided an exploratory visualization of the multivariate characteristics of the three starch preparations using the nine biological observations. The first two principal components accounted for 99.3% of the total variance, with PC1 explaining 96.6% and PC2 explaining 2.7%. The loading pattern summarized the contrasting structural and functional profiles already evident from the individual measurements: amylose content, XRD-derived relative crystallinity, FTIR 1047/1022 ratio, and D50 were oriented oppositely along PC1 to swelling power and the RVA-derived peak, breakdown, and setback viscosity variables, while Tp and ΔH also contributed to differentiation among the observations.
The close grouping of biological replicates within each cultivar indicates that the multivariate profiles were comparatively consistent within the present experimental dataset. Nevertheless, the PCA should be interpreted cautiously. Although nine independent biological observations were included, they represented only three cultivars, and several measured properties showed strong covariation. Under these conditions, PCA primarily summarizes the multivariate structure of the present dataset and cannot establish predictive relationships, causal mechanisms, or general cultivar classes [33]. Broader sampling across additional O. tuberosa germplasm, growing environments, and harvest periods would be required to evaluate whether the observed multivariate patterns are reproducible and representative beyond the cultivars examined.
4.7. Comparison with Conventional and Non-Conventional Starches
The measured characteristics place the three O. tuberosa starches within the broad physicochemical and functional ranges reported for conventional and non-conventional tuber starches. Non-conventional starch sources have attracted interest because botanical diversity can provide variation in granule morphology, amylose content, hydration, pasting, and thermal behavior [15,30]. Previous work on oca starch has likewise demonstrated physicochemical and functional characteristics that overlap with, but are not identical to, those of commonly used starch sources.
Comparison with literature values for potato, cassava, sweet potato, and other tuber starches provides useful context for the present measurements (Figure 7). These literature ranges should not be interpreted as direct experimental controls because reported values may vary with genotype, growing conditions, maturity, starch-isolation procedures, sample preparation, moisture basis, and analytical protocols. Peak-viscosity values require particular caution because RVA measurements are sensitive to starch concentration, moisture correction, heating and cooling programs, holding times, paddle speed, and instrument settings. Consequently, the literature ranges presented in Figure 7 are intended solely as contextual benchmarks, and no direct statistical comparison or inference of superior functionality was made between the present O. tuberosa starches and starches reported in previous studies.
Figure 7.
Contextual comparison of selected physicochemical and functional characteristics of native starches isolated from pink, yellow, and black Oxalis tuberosa cultivars with literature ranges reported for potato, cassava, and sweet potato starches. Oca values are presented as mean ± SD of three independent biological replicates (n = 3), whereas literature values are shown as ranges for contextual comparison only; because the published data originate from different genotypes, growing conditions, starch-isolation procedures, sample preparations, and analytical protocols, no direct statistical comparison was performed between the present measurements and literature ranges. Source: For potato starch, the literature ranges were derived from Hoover [4], Singh et al. [18], Tester et al. [5], Pérez and Bertoft [22]. For cassava starch, the literature ranges were derived from Nwokocha et al. [34]. For sweet potato starch, the literature ranges were derived from Kim et al. [35], Zhou et al. [21], Zhang et al. [28], Li et al. [25], Wang et al. [36], Mauro et al. [27], and Ribeiro et al. [26].
Within this context, the present study expands the available comparative information for native O. tuberosa starch by documenting three cultivar samples under a common extraction and analytical framework. The main contribution is therefore the side-by-side characterization of these starches rather than demonstration that any cultivar possesses universally superior functionality.
4.8. Technological Implications, Limitations, and Future Research
The measured functional properties suggest differentiated application hypotheses for the three Oxalis tuberosa starches. Pink starch showed the highest swelling power (17.5 g g−1) and peak viscosity (3900 cP), supporting further evaluation in formulations requiring pronounced hydration and viscosity development. Black starch exhibited the lowest breakdown viscosity (550 cP), indicating a smaller viscosity loss during RVA heating and shear and warranting evaluation in systems where resistance to viscosity breakdown is desirable. Yellow starch showed an intermediate functional profile. These interpretations are consistent with previous reports describing the distinctive physicochemical properties, processing responsiveness, and technological potential of oca starch [8,9,10].
These potential applications remain hypotheses derived from isolated-starch measurements rather than demonstrated product performance. High swelling power and peak viscosity do not necessarily translate directly into effective thickening in complex foods, while low RVA breakdown does not by itself establish processing stability. Interactions with water, proteins, lipids, sugars, salts, pH, and processing conditions may substantially modify starch functionality. Therefore, formulation-level testing in real food systems is required before technological suitability can be established.
The study also has important sampling limitations. The three local oca materials were obtained from one geographical area and a single harvest period. Consequently, the observed starch-trait differences cannot be attributed exclusively to the local materials because material-associated variation cannot be fully disentangled from environmental, seasonal, and production influences. The findings should therefore be interpreted as characteristics of the samples examined under the conditions represented by this collection rather than stable or generalizable attributes of O. tuberosa. Multi-location and multi-season studies are required to evaluate the reproducibility and environmental stability of these differences.
Mechanistic interpretation is additionally limited because amylopectin chain-length distribution, molecular weight, double-helical organization, lamellar architecture, and water mobility were not directly determined. XRD-derived relative crystallinity is also model-dependent and can vary with baseline treatment, peak selection, fitting constraints, and separation of crystalline and amorphous scattering. Although the low Rwp values and residual profiles supported the fits for comparative purposes, the reported crystallinity values should be regarded as relative estimates rather than absolute crystalline fractions. The original diffractograms and fitting diagnostics are provided in Supplementary Figures S1 and S2 and Table S4.
The exploratory PCA should likewise be interpreted cautiously. Although nine biological observations were analyzed, they represented only three local oca materials. PCA therefore summarizes multivariate variation within the present dataset but does not establish causal, predictive, or broadly generalizable relationships.
Future studies should combine broader germplasm sampling across multiple locations and harvest periods with more detailed molecular characterization. Most importantly, the functional hypotheses identified here should be tested in formulated food systems under realistic processing and storage conditions to determine whether the greater hydration and viscosity development of pink starch, the lower RVA breakdown of black starch, and the intermediate profile of yellow starch translate into reproducible technological performance.
5. Conclusions
This study provides a comparative characterization of native starches isolated from three Oxalis tuberosa cultivars under a common extraction and analytical framework. All three starches exhibited a B-type crystalline pattern but differed in several measured characteristics. Among the samples examined, black oca starch had the highest amylose content (28.1%), XRD-derived relative crystallinity (35.8%), FTIR-derived short-range molecular order, and median granule size (22.8 μm), whereas pink starch showed lower values for these structural descriptors.
Contrasting patterns were observed for hydration, pasting, and thermal behavior. Pink starch exhibited the highest swelling power at 90 °C (17.5 g g−1), peak viscosity (3900 cP), and gelatinization enthalpy (12.83 J g−1), whereas black starch showed lower swelling power (10.9 g g−1), peak viscosity (2350 cP), and gelatinization enthalpy (7.61 J g−1). Notably, the ordering of the DSC parameters did not parallel XRD-derived relative crystallinity, indicating that relative crystallinity alone cannot account for the observed gelatinization behavior. The exploratory PCA summarized the contrasting multivariate profiles of the three starches but should not be interpreted as evidence of causal or predictive structure–property relationships.
Overall, the findings document measurable variation among the three O. tuberosa starch preparations and extend the available information on this underutilized Andean starch source. Comparisons with potato, cassava, and sweet potato starches provide literature-based context rather than direct statistical evidence of superior or application-specific performance. Because only three cultivars from one geographical region and harvest period were examined, the results should be regarded as cultivar-specific observations rather than generalized characteristics of O. tuberosa. Further studies incorporating broader germplasm, multiple growing environments and harvest periods, more detailed molecular and supramolecular characterization, and direct product-level testing are required to determine the reproducibility and technological relevance of the differences observed here.
Supplementary Materials
The following supporting information can be downloaded at: https://www.mdpi.com/article/10.3390/polysaccharides7030102/s1.
Author Contributions
F.O.A. contributed to conceptualization, methodology, investigation, formal analysis, writing—original draft, supervision, and project administration; N.E.M.C. contributed to methodology, validation, investigation, and writing—review and editing; G.C.P.A. contributed to formal analysis, data curation, visualization, and writing—review and editing; E.T.C.C. contributed to methodology, investigation, resources, validation, and writing—review and editing; O.O.O.A. contributed to conceptualization, data curation, software, formal analysis, visualization, and writing—review and editing; C.D.P.A.Q. contributed to methodology, conceptualization, investigation, resources, validation, and writing—review and editing; C.L.P.G. contributed to conceptualization, data curation, investigation, and writing—review and editing; J.R.R.R. contributed to methodology, formal analysis, visualization, validation, and writing—review and editing; B.M.V.M. contributed to conceptualization, investigation, resources, and writing—review and editing; W.A.G.S. contributed to methodology, conceptualization, software, formal analysis, and writing—review and editing; L.E.T.C. contributed to supervision, validation, and writing—review and editing. All authors have read and agreed to the published version of the manuscript.
Funding
This research received no external funding.
Data Availability Statement
The data supporting the findings of this study are available from the corresponding author upon reasonable request.
Acknowledgments
All the authors are highly thankful to the Universidad Nacional de Huancavelica, Huancavelica, Perú for their moral support.
Conflicts of Interest
Authors declared no conflict of interest to each other of any type.
References
- Varghese, S.; Awana, M.; Mondal, D.; Rubiya, M.H.; Melethil, K.; Singh, A.; Krishnan, V.; Thomas, B. Amylose–amylopectin ratio: Comprehensive understanding of structure, physicochemical attributes, and applications of starch. In Handbook of Biopolymers; Springer Nature: Singapore, 2022; pp. 1–30. [Google Scholar]
- Alcázar-Alay, S.C.; Meireles, M.A.A. Physicochemical properties, modifications and applications of starches from different botanical sources. Food Sci. Technol. 2015, 35, 215–236. [Google Scholar] [CrossRef] [Scilit]
- Copeland, L.; Blazek, J.; Salman, H.; Tang, M.C. Form and functionality of starch. Food Hydrocoll. 2009, 23, 1527–1534. [Google Scholar] [CrossRef] [Scilit]
- Hoover, R. Composition, molecular structure, and physicochemical properties of tuber and root starches: A review. Carbohydr. Polym. 2001, 45, 253–267. [Google Scholar] [CrossRef] [Scilit]
- Tester, R.F.; Karkalas, J.; Qi, X. Starch—Composition, fine structure and architecture. J. Cereal Sci. 2004, 39, 151–165. [Google Scholar] [CrossRef] [Scilit]
- Saiprabhath, T.; Samuel, M.; Duraiyan, D.; Basavegowda, N.; Somu, P.; Baek, K.H.; Haldar, D. Structural insights, modification techniques and multisectoral applications of starch from various plant sources: A review. J. Nat. Fibers 2026, 23, 2634408. [Google Scholar] [CrossRef] [Scilit]
- Velasquez-Barreto, F.F.; Barraza-Jaureguí, G.; Pena, R.D.S. Tuber and root starches: Molecular and physicochemical properties. Starch-Stärke 2026, 78, e70181. [Google Scholar] [CrossRef] [Scilit]
- Zhu, F.; Cui, R. Comparison of physicochemical properties of oca (Oxalis tuberosa), potato, and maize starches. Int. J. Biol. Macromol. 2020, 148, 601–607. [Google Scholar] [CrossRef] [Scilit] [PubMed]
- Puelles-Román, J.; Barroso, N.G.; Cruz-Tirado, J.P.; Tapia-Blácido, D.R.; Angelats-Silva, L.; Barraza-Jáuregui, G.; Siche, R. Annealing process improves the physical, functional, thermal, and rheological properties of Andean oca (Oxalis tuberosa) starch. J. Food Process Eng. 2021, 44, e13702. [Google Scholar] [CrossRef] [Scilit]
- Aurora-Vigo, E.F.; Paucar-Menacho, L.M.; Anaya-Esparza, L.M.; Schmiele, M. Oca (Oxalis tuberosa Mol.): An Andean tuber with promising physicochemical, technological and nutritional properties for potential industrial applications. Plant Foods Hum. Nutr. 2025, 80, 179. [Google Scholar] [CrossRef] [Scilit] [PubMed]
- Vamadevan, V.; Bertoft, E. Observations on the impact of amylopectin and amylose structure on the swelling of starch granules. Food Hydrocoll. 2020, 103, 105663. [Google Scholar] [CrossRef] [Scilit]
- Mojo-Quisani, A.; Licona-Pacco, K.; Choque-Quispe, D.; Calla-Florez, M.; Ligarda-Samanez, C.A.; Mamani-Condori, R.; Florez-Huaracha, K.; Huamaní-Melendez, V.J. Physicochemical properties of starch of four varieties of native potatoes. Heliyon 2024, 10, e35809. [Google Scholar] [CrossRef] [Scilit] [PubMed]
- Müller, A.; Coradi, P.C.; Nunes, M.T.; Grohs, M.; Bressiani, J.; Teodoro, P.E.; Anschau, K.F.; Flores, E.M.M. Effects of cultivars and fertilization levels on the quality of rice milling: A diagnosis using near-infrared spectroscopy, X-ray diffraction, and scanning electron microscopy. Food Res. Int. 2021, 147, 110524. [Google Scholar] [CrossRef] [Scilit] [PubMed]
- Cornejo-Ramírez, Y.I.; Martínez-Cruz, O.; Del Toro-Sánchez, C.L.; Wong-Corral, F.J.; Borboa-Flores, J.; Cinco-Moroyoqui, F.J. The structural characteristics of starches and their functional properties. CyTA J. Food 2018, 16, 1003–1017. [Google Scholar] [CrossRef] [Scilit]
- Carvalho, H.J.M.; Barcia, M.T.; Schmiele, M. Non-conventional starches: Properties and potential applications in food and non-food products. Macromol 2024, 4, 886–909. [Google Scholar] [CrossRef] [Scilit]
- Oyeyinka, S.A.; Singh, S.; Adebola, P.O.; Gerrano, A.S.; Amonsou, E.O. Physicochemical properties of starches with variable amylose contents extracted from bambara groundnut genotypes. Carbohydr. Polym. 2015, 133, 171–178. [Google Scholar] [CrossRef] [Scilit] [PubMed]
- Hsieh, C.F.; BeMiller, J.N.; Huber, K.C. Impact of granule hydration on maize and wheat starch chemical reactivity at the granular and molecular levels. Food Hydrocoll. 2020, 100, 105374. [Google Scholar] [CrossRef] [Scilit]
- Singh, N.; Singh, J.; Kaur, L.; Sodhi, N.S.; Gill, B.S. Morphological, thermal and rheological properties of starches from different botanical sources. Food Chem. 2003, 81, 219–231. [Google Scholar] [CrossRef] [Scilit]
- Wang, K.; Zhang, B.; Dhital, S. Starch: Measurement techniques at different length scales. In Starch and Starchy Food Products; CRC Press: Boca Raton, FL, USA, 2022; pp. 41–70. [Google Scholar]
- Gelders, G.G.; Goesaert, H.; Delcour, J.A. Amylose–lipid complexes as controlled lipid release agents during starch gelatinization and pasting. J. Agric. Food Chem. 2006, 54, 1493–1499. [Google Scholar] [CrossRef] [Scilit] [PubMed]
- Zhou, W.; Yang, J.; Hong, Y.; Liu, G.; Zheng, J.; Gu, Z.; Zhang, P. Impact of amylose content on starch physicochemical properties in transgenic sweet potato. Carbohydr. Polym. 2015, 122, 417–427. [Google Scholar] [CrossRef] [Scilit] [PubMed]
- Pérez, S.; Bertoft, E. The molecular structures of starch components and their contribution to the architecture of starch granules: A comprehensive review. Starch-Stärke 2010, 62, 389–420. [Google Scholar] [CrossRef] [Scilit]
- Sevenou, O.; Hill, S.E.; Farhat, I.A.; Mitchell, J.R. Organisation of the external region of the starch granule as determined by infrared spectroscopy. Int. J. Biol. Macromol. 2002, 31, 79–85. [Google Scholar] [CrossRef] [Scilit] [PubMed]
- Huang, S.; Chao, C.; Yu, J.; Copeland, L.; Wang, S. New insight into starch retrogradation: The effect of short-range molecular order in gelatinized starch. Food Hydrocoll. 2021, 120, 106921. [Google Scholar] [CrossRef] [Scilit]
- Li, M.; Daygon, V.D.; Solah, V.; Dhital, S. Starch granule size: Does it matter? Crit. Rev. Food Sci. Nutr. 2023, 63, 3683–3703. [Google Scholar] [CrossRef] [Scilit] [PubMed]
- Ribeiro, N.R.; Sousa, M.B.E.; Oliveira, L.A.D.; de Oliveira, E.J. Variability of amylose content and its correlation with the paste properties of cassava starch. PLoS ONE 2024, 19, e0309619. [Google Scholar] [CrossRef]
- Mauro, R.R.; Vela, A.J.; Ronda, F. Impact of starch concentration on the pasting and rheological properties of gluten-free gels: Effects of amylose content and thermal and hydration properties. Foods 2023, 12, 2281. [Google Scholar] [CrossRef] [Scilit] [PubMed]
- Zhang, H.; Huang, M.; Chen, J.; Shan, S.; Cao, F.; Chen, G.; Zou, Y. Amylose content and starch granule size in rice grains are affected by growing season. Phyton 2019, 88, 403. [Google Scholar] [CrossRef] [Scilit]
- Lin, X.; Zhang, X.; Du, B.; Xu, B. Morphological, structural, thermal, pasting, and digestive properties of starches isolated from different varieties of rice: A systematic comparative study. Foods 2023, 12, 4492. [Google Scholar] [CrossRef] [Scilit] [PubMed]
- Šárka, E.; Sinica, A.; Smrčková, P.; Sluková, M. Non-traditional starches, their properties, and applications. Foods 2023, 12, 3794. [Google Scholar] [CrossRef] [Scilit] [PubMed]
- Chakraborty, I.; N, P.; Mal, S.S.; Paul, U.C.; Rahman, M.H.; Mazumder, N. An insight into the gelatinization properties influencing the modified starches used in the food industry: A review. Food Bioprocess Technol. 2022, 15, 1195–1223. [Google Scholar] [CrossRef] [Scilit]
- Gu, F.; Gong, B.; Gilbert, R.G.; Yu, W.; Li, E.; Li, C. Relations between changes in starch molecular fine structure and in thermal properties during rice grain storage. Food Chem. 2019, 295, 484–492. [Google Scholar] [CrossRef] [Scilit] [PubMed]
- Granato, D.; Santos, J.S.; Escher, G.B.; Ferreira, B.L.; Maggio, R.M. Use of principal component analysis and hierarchical cluster analysis for multivariate association between bioactive compounds and functional properties in foods: A critical perspective. Trends Food Sci. Technol. 2018, 72, 83–90. [Google Scholar] [CrossRef] [Scilit]
- Nwokocha, L.M.; Aviara, N.A.; Senan, C.; Williams, P.A. A comparative study of some properties of cassava (Manihot esculenta Crantz) and cocoyam (Colocasia esculenta Linn) starches. Carbohydr. Polym. 2009, 76, 362–367. [Google Scholar] [CrossRef] [Scilit]
- Kim, J.; Ren, C.; Shin, M. Physicochemical properties of starch isolated from eight different varieties of Korean sweet potatoes. Starch-Stärke 2013, 65, 923–930. [Google Scholar] [CrossRef] [Scilit]
- Wang, F.; Xu, M.; Jiang, Y.; Zhang, B.; Shao, Y.; Liu, J.; Kan, J.; Zhang, M.; Xiao, L.; Qi, X.; et al. Comparative evaluation of structural characteristics of starch from 10 varieties of lotus root. Horticulturae 2024, 10, 1200. [Google Scholar] [CrossRef] [Scilit]
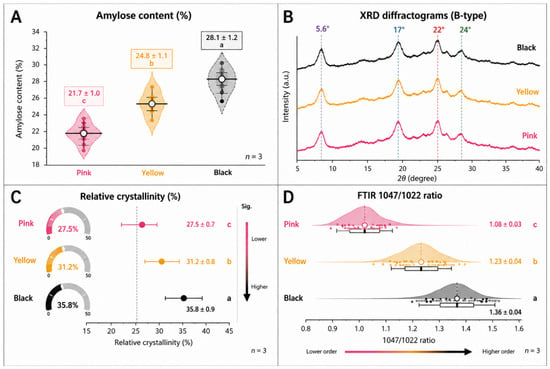
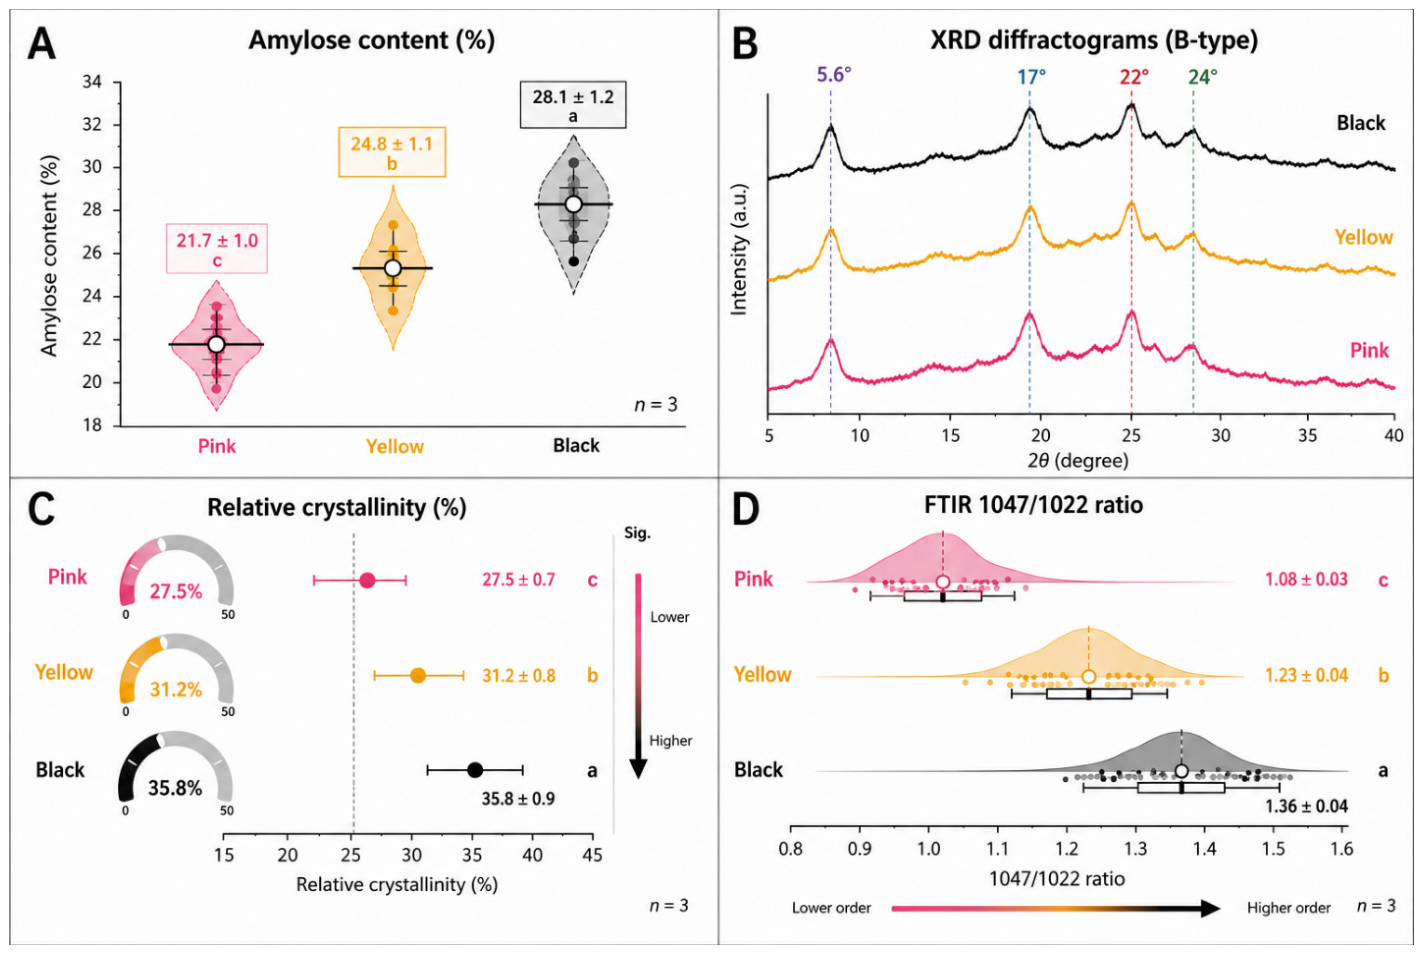
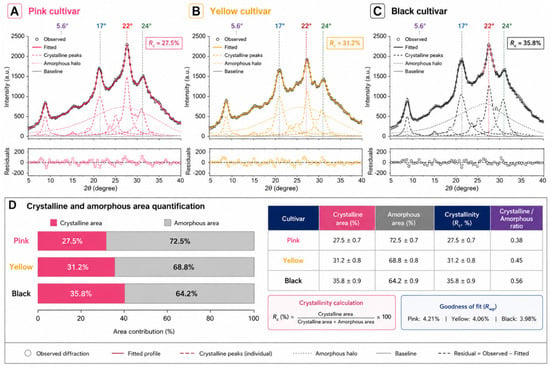
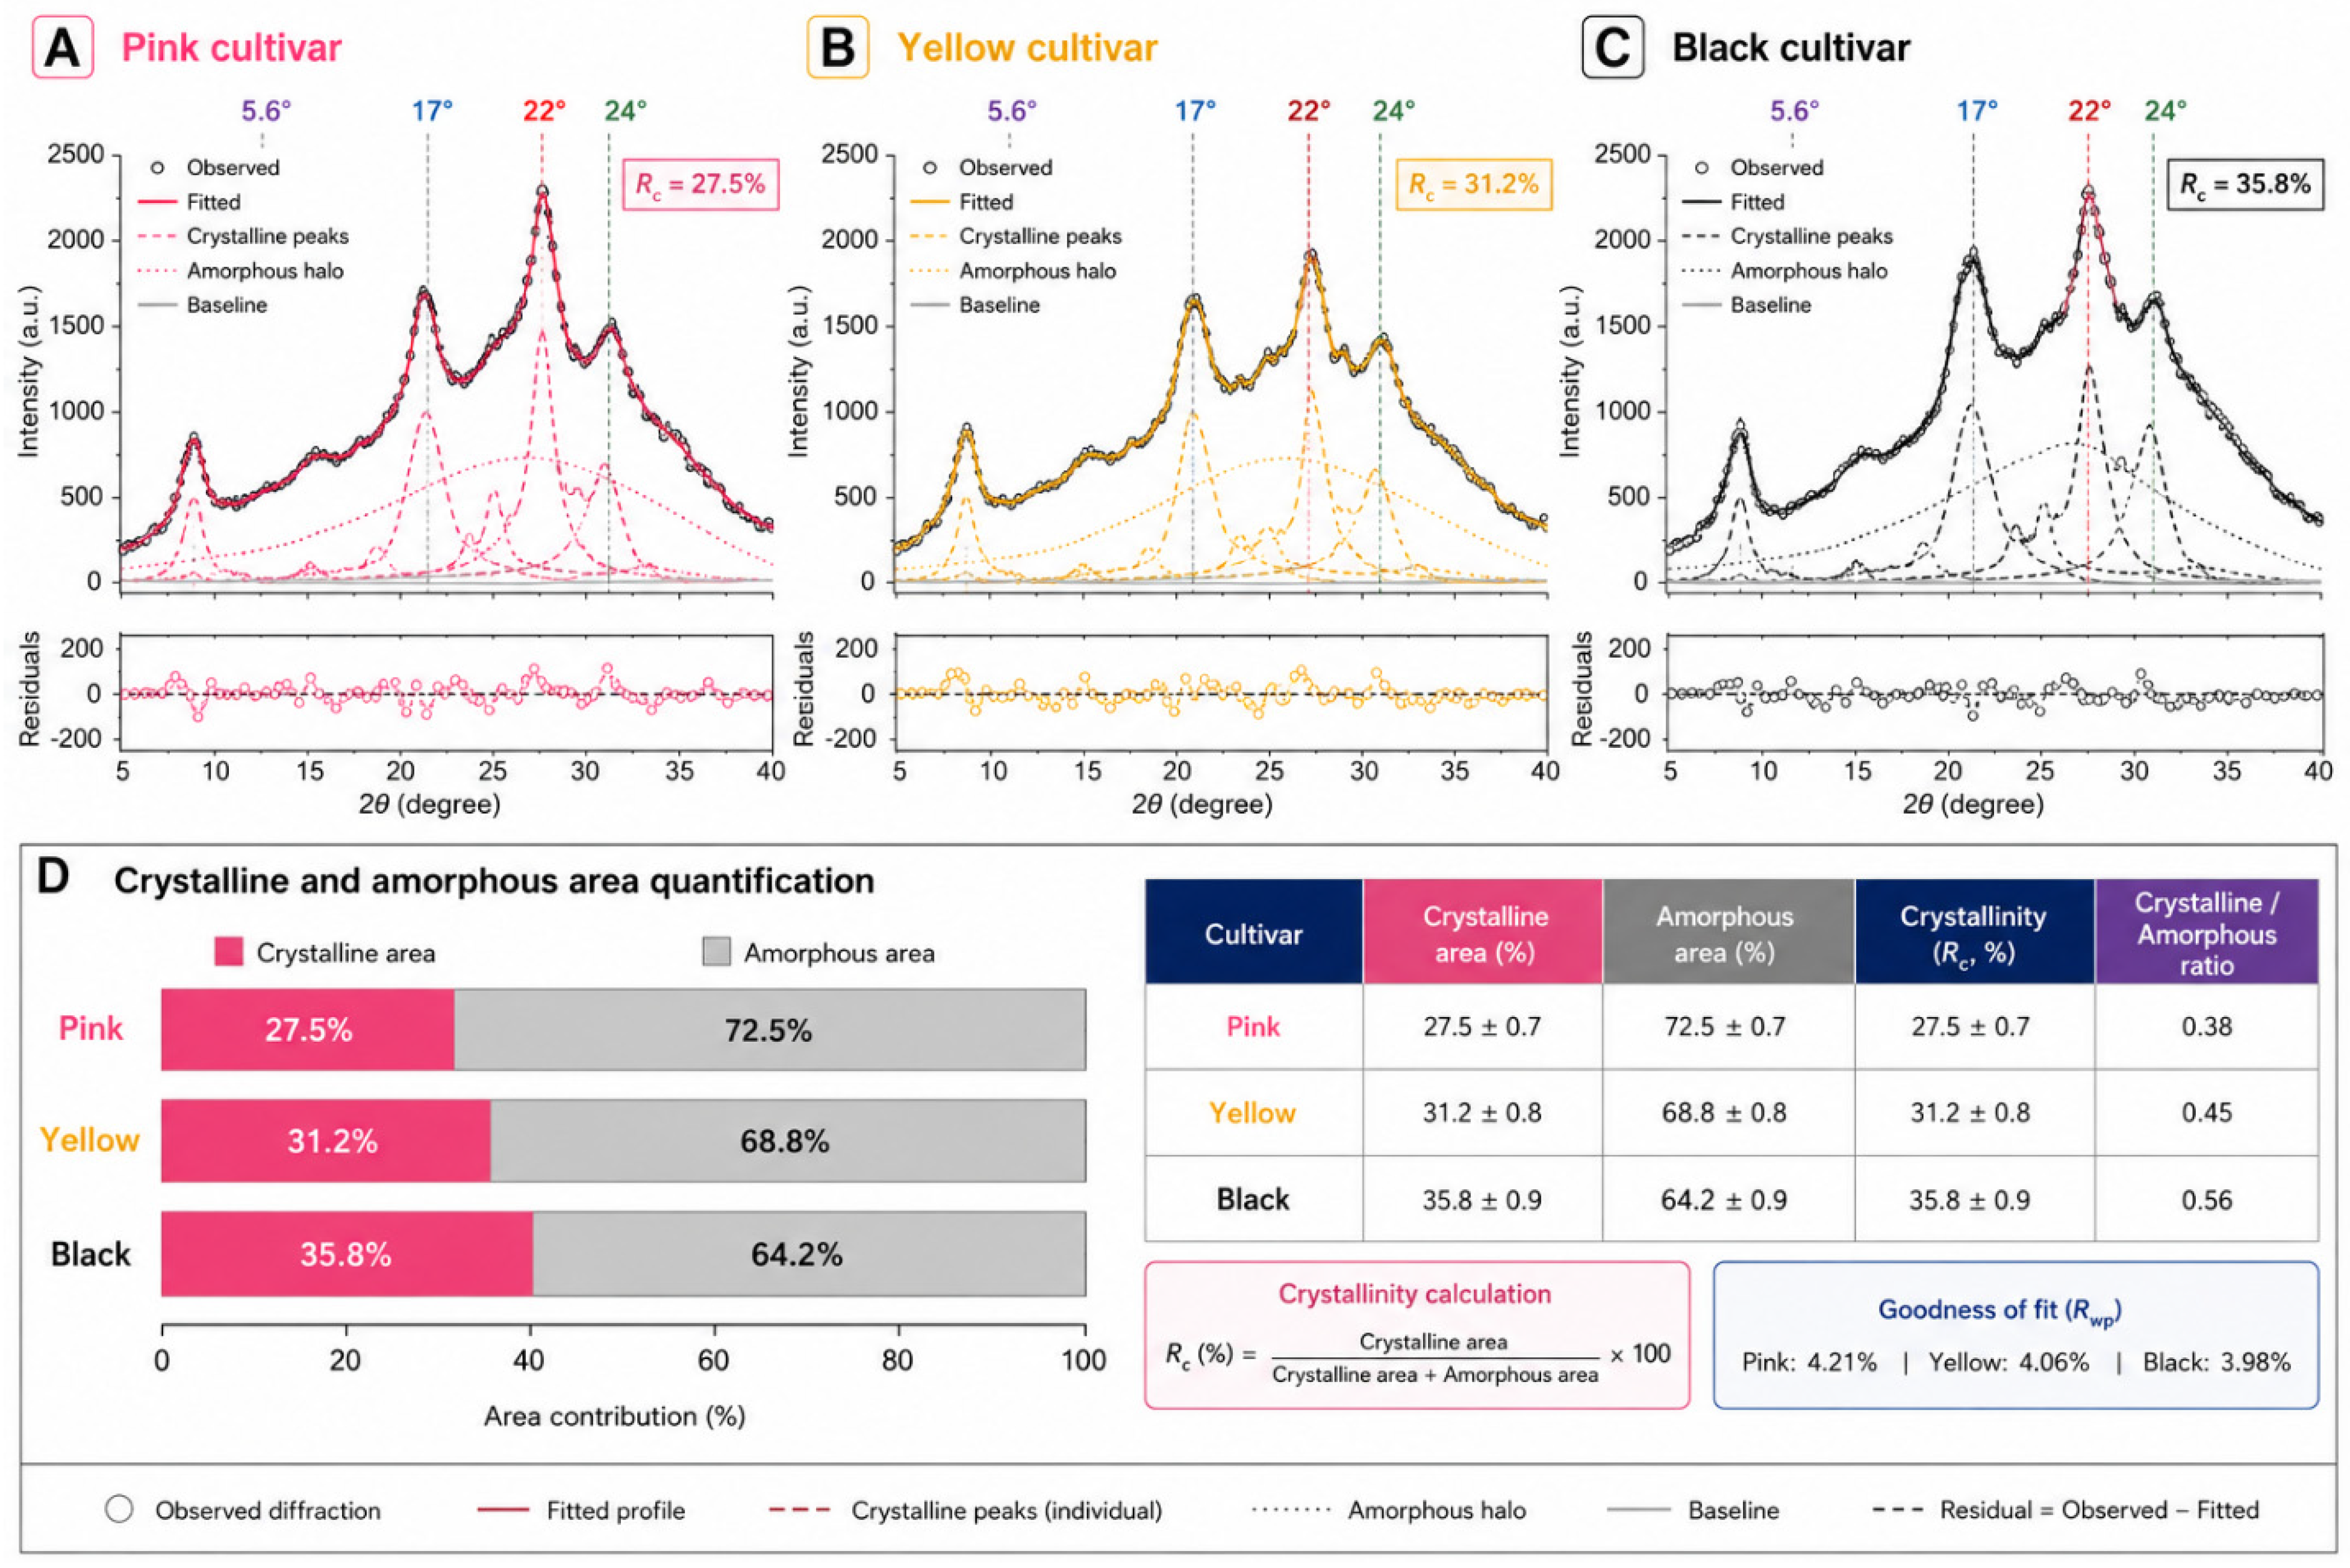
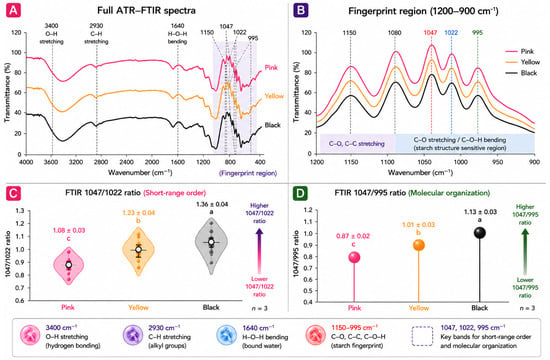
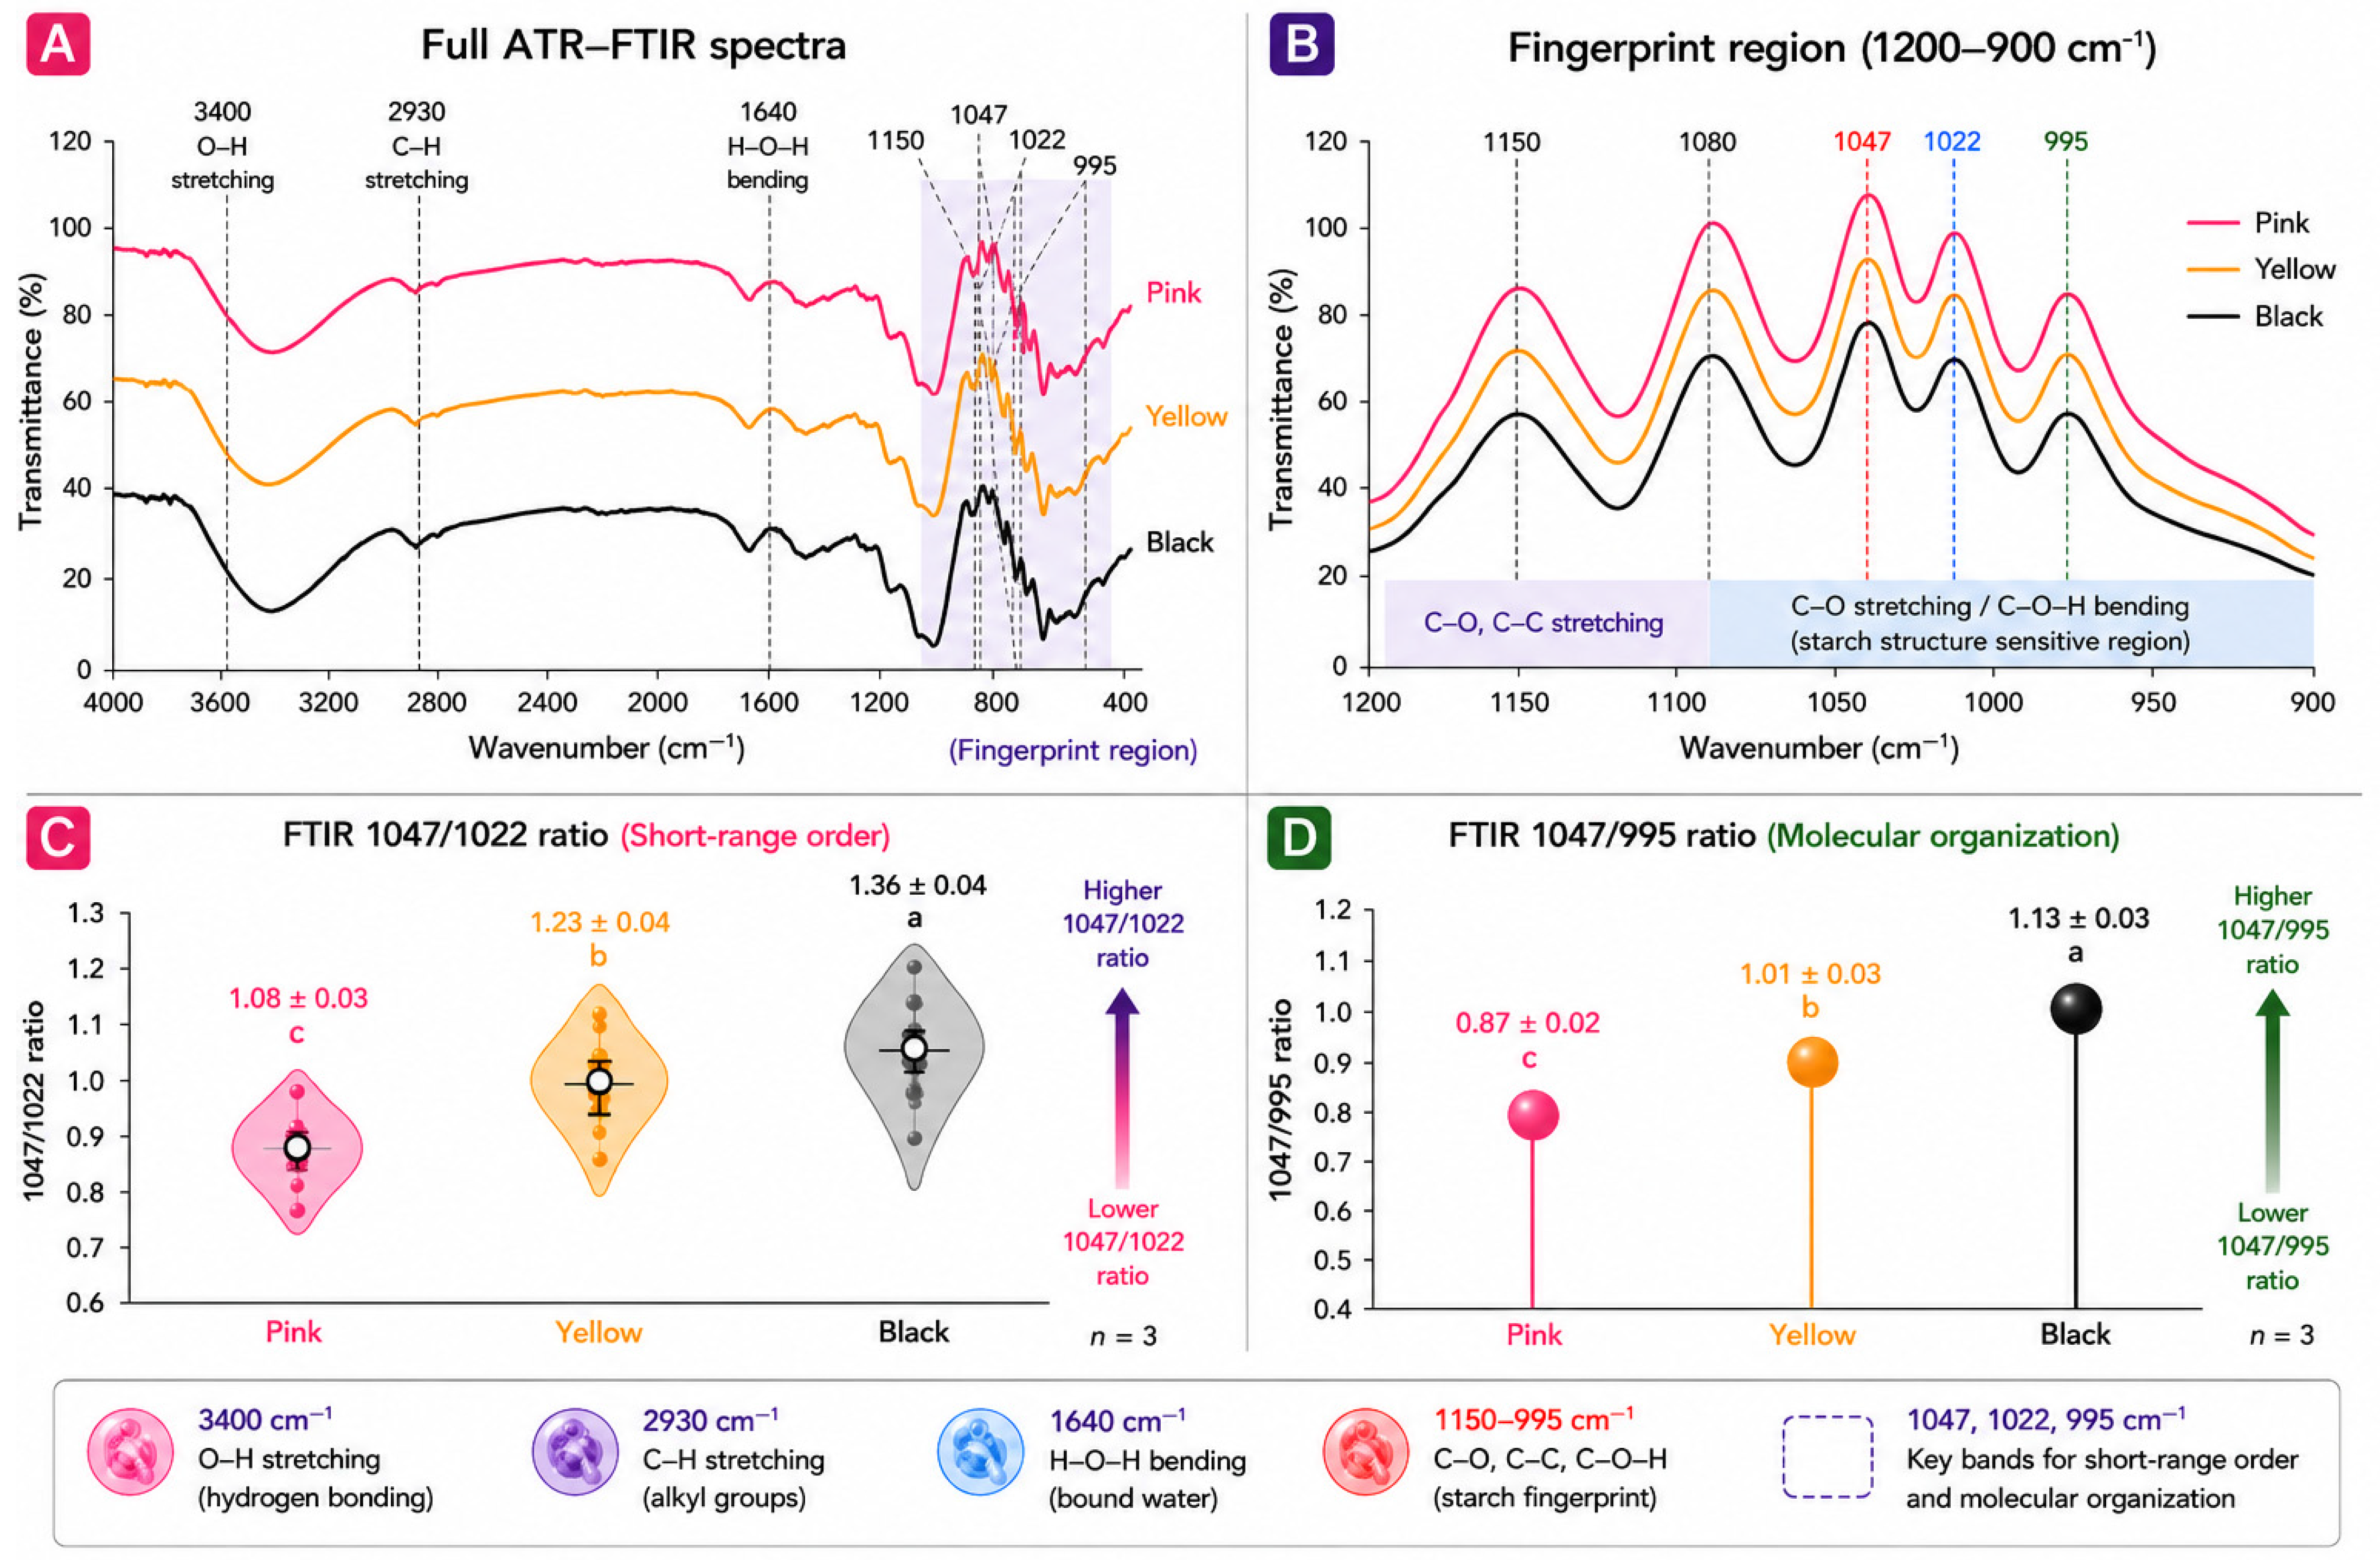
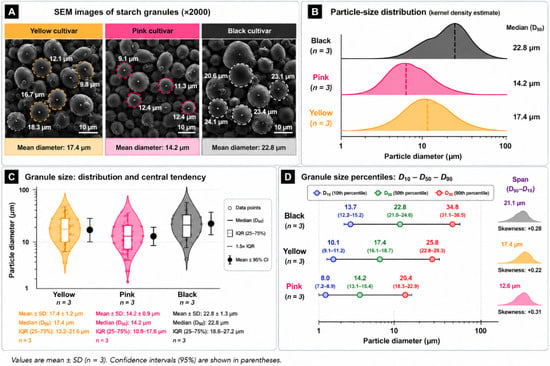
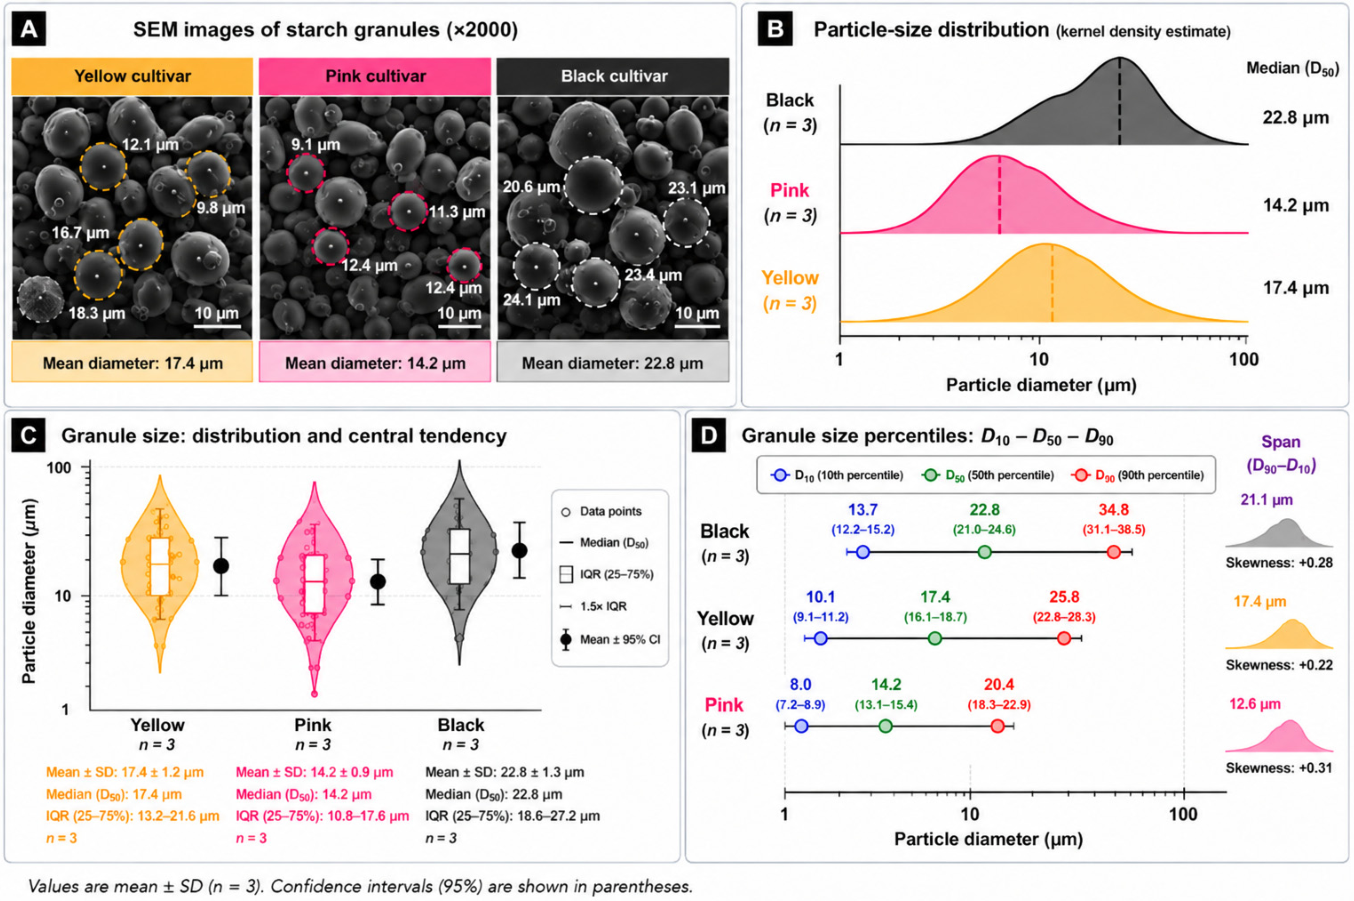
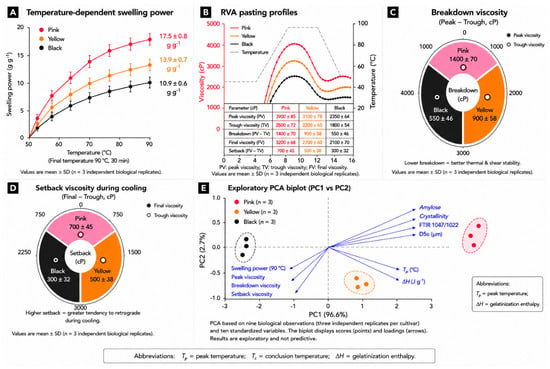
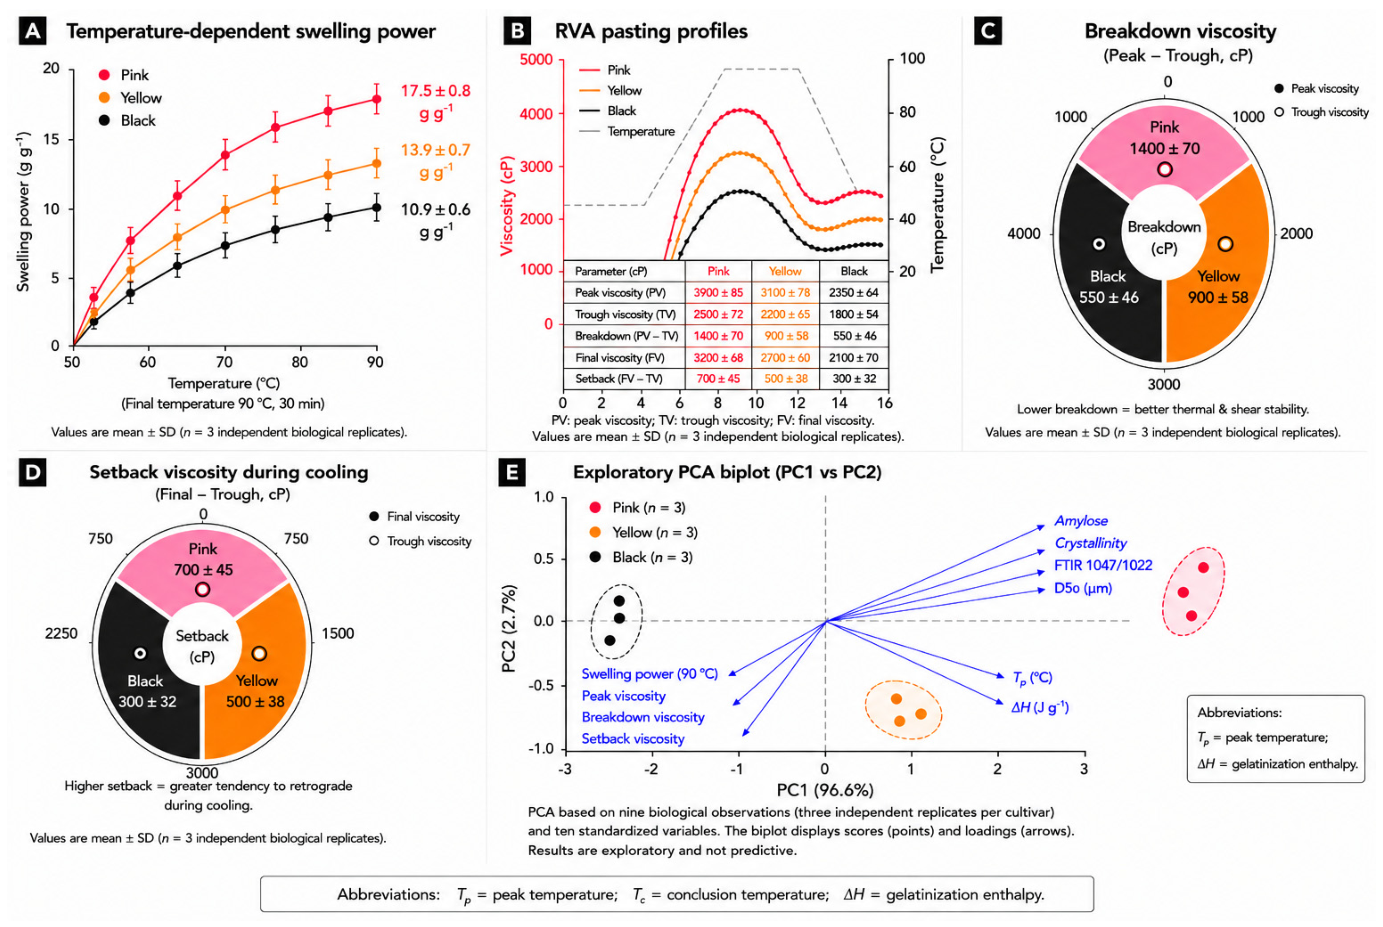
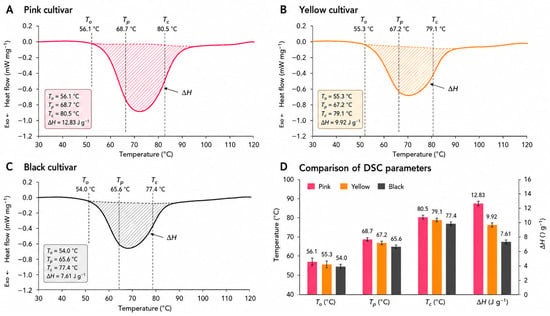
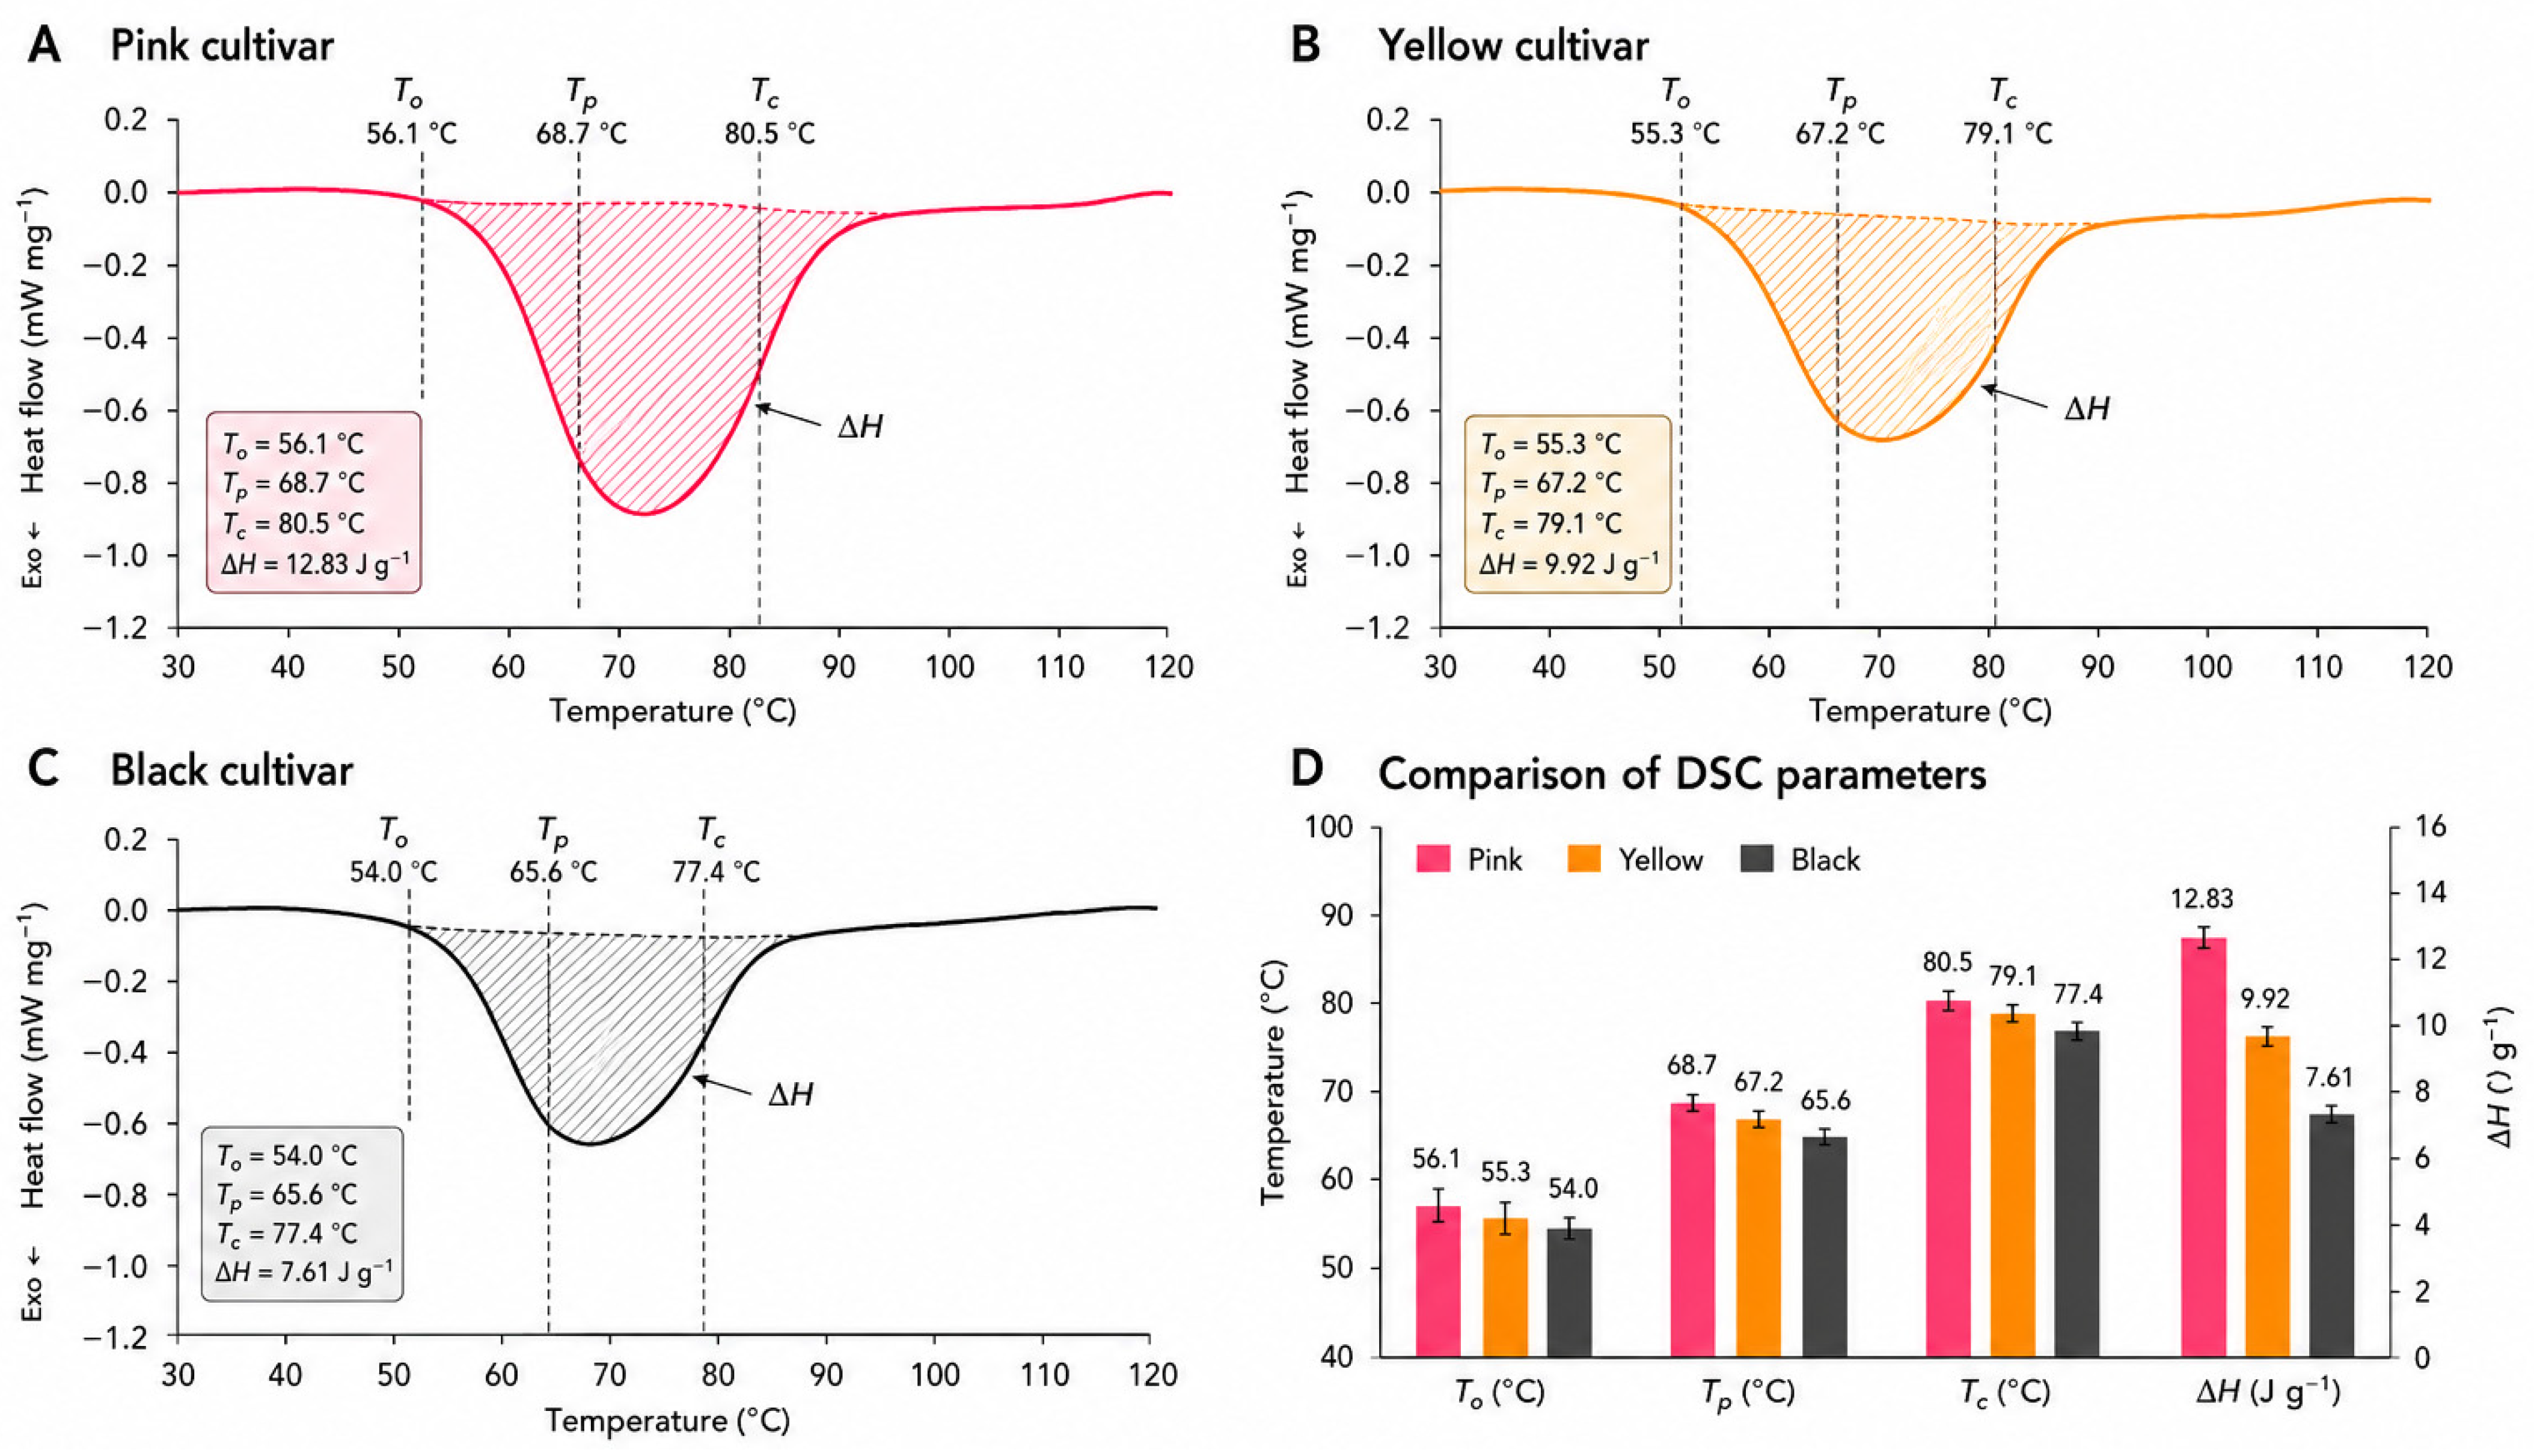
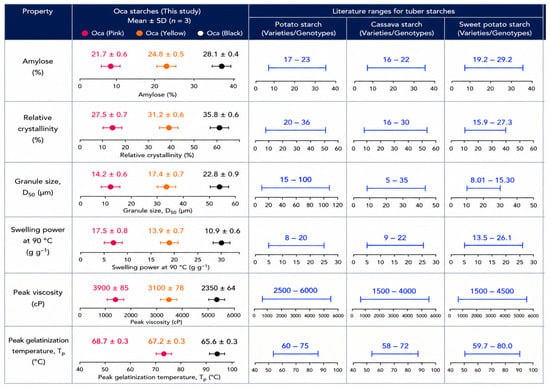
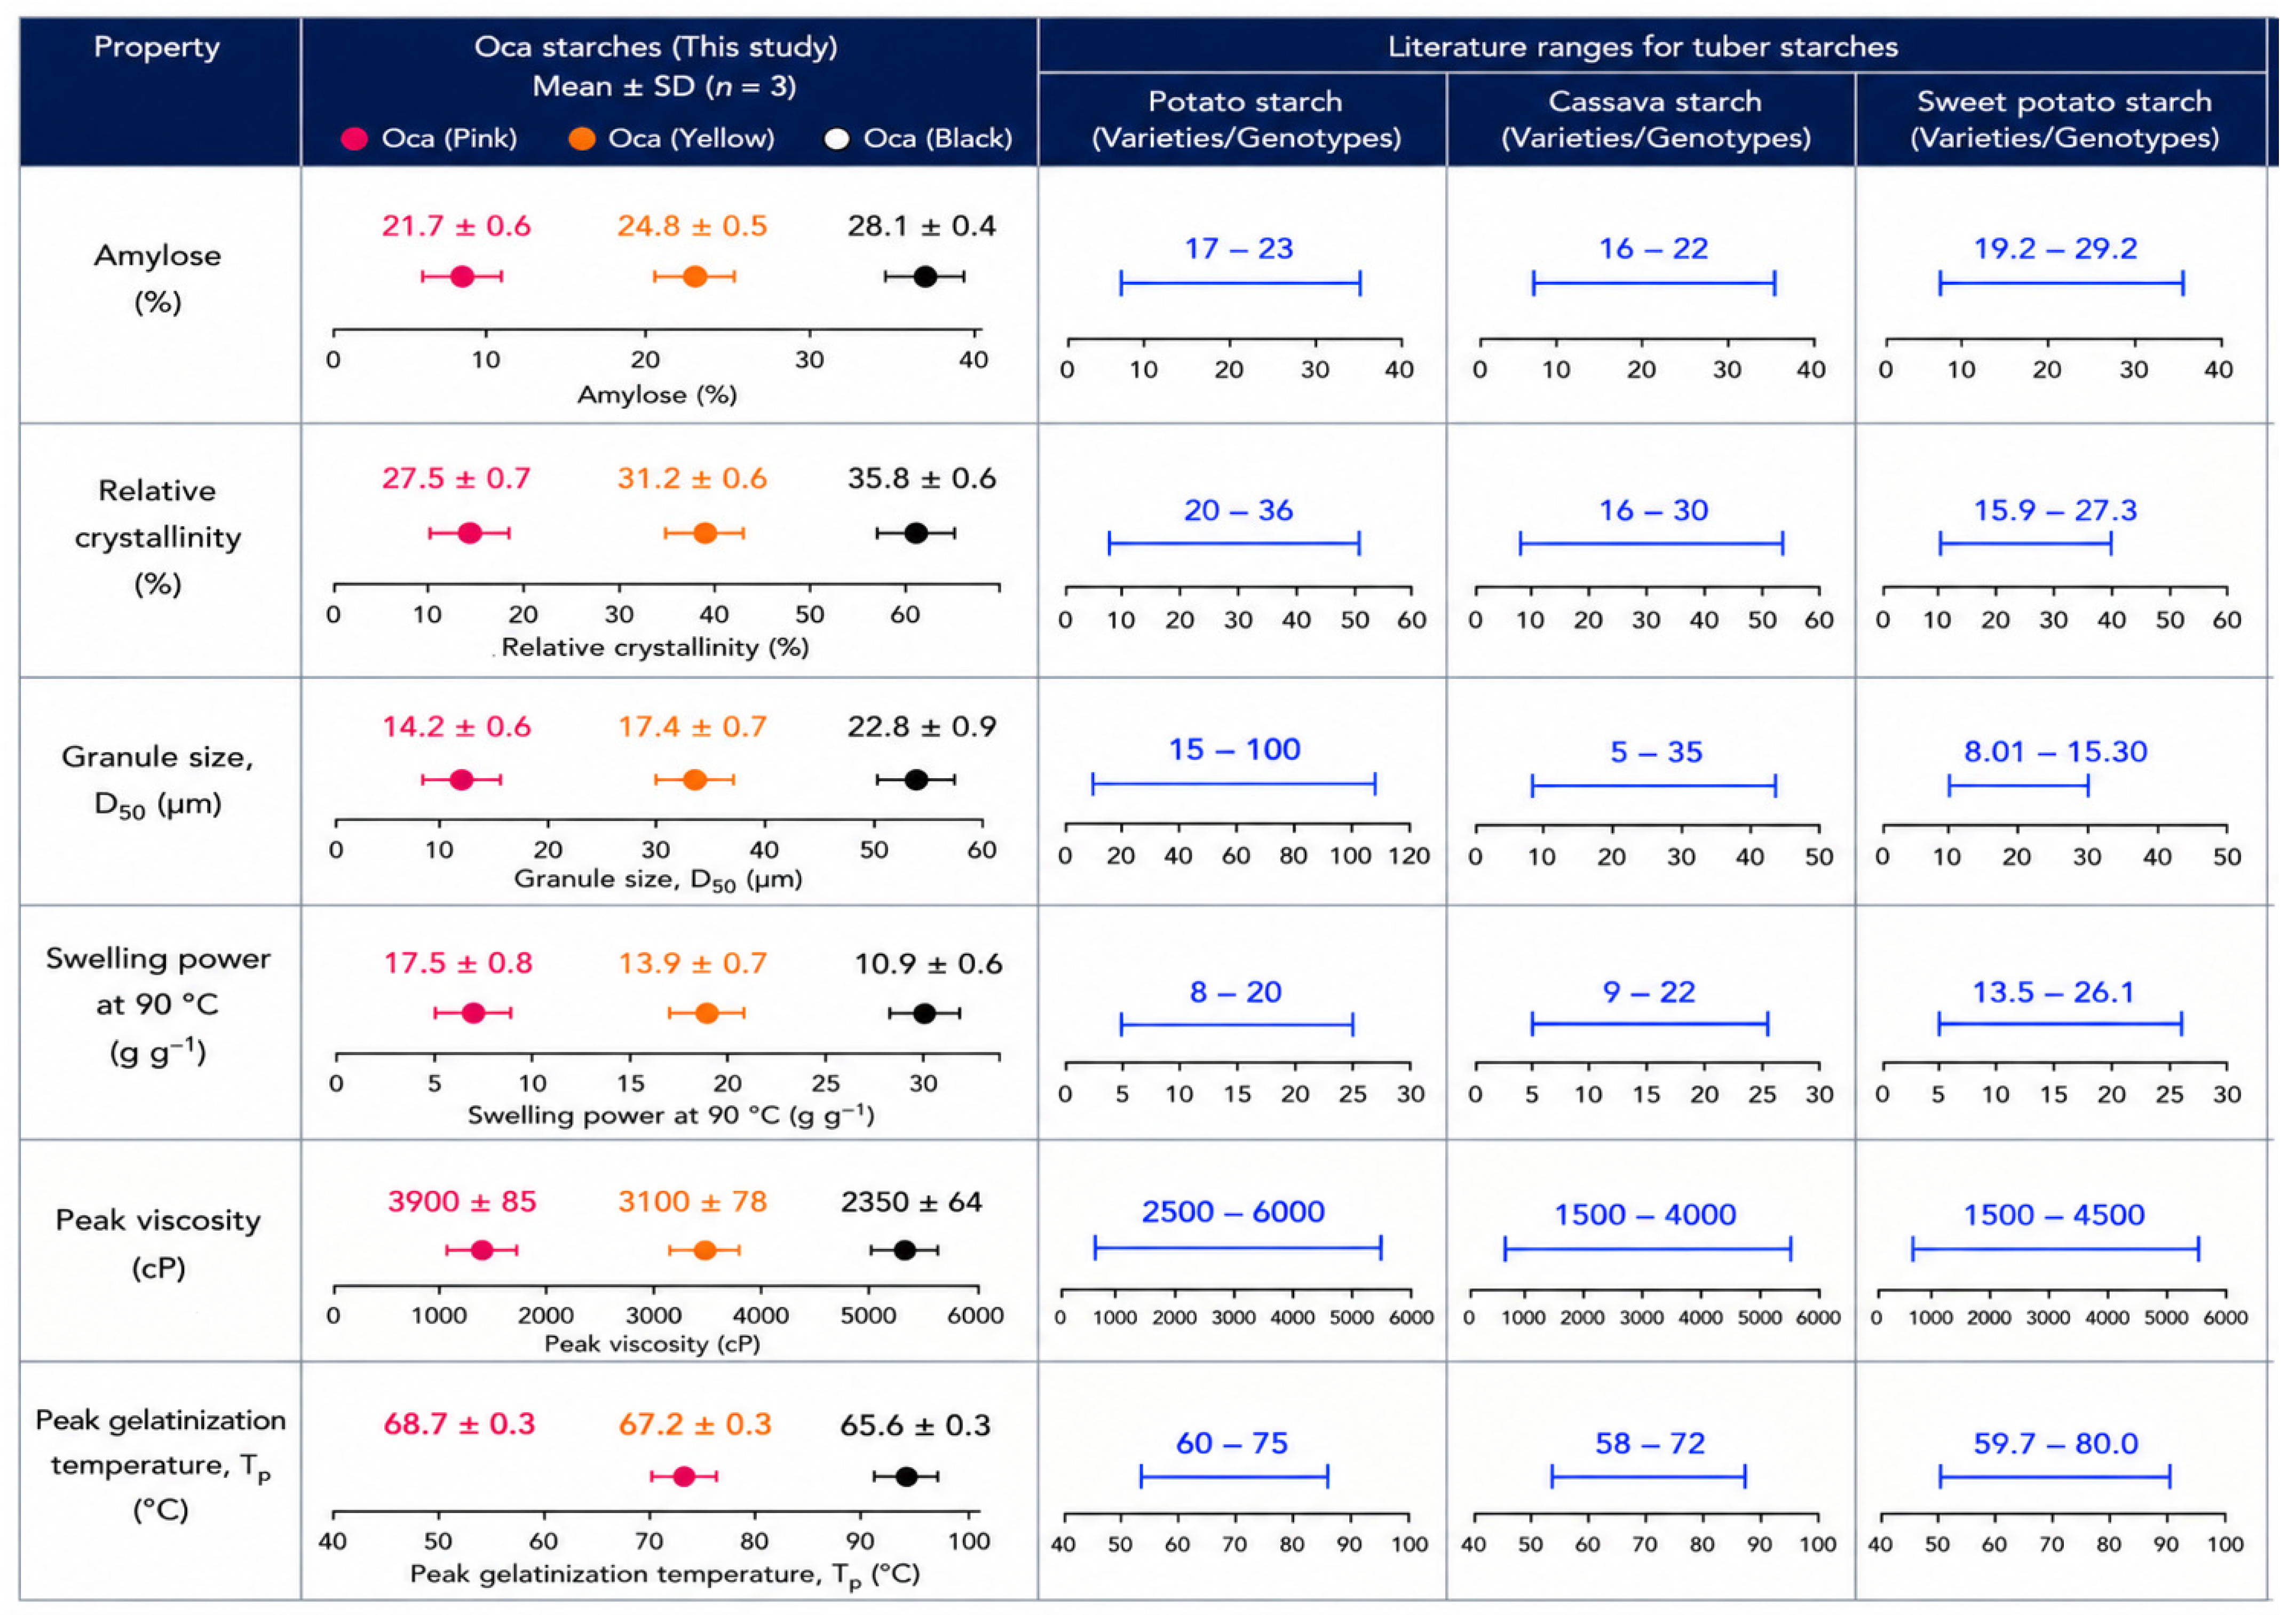

Disclaimer/Publisher’s Note: The statements, opinions and data contained in all publications are solely those of the individual author(s) and contributor(s) and not of MDPI and/or the editor(s). MDPI and/or the editor(s) disclaim responsibility for any injury to people or property resulting from any ideas, methods, instructions or products referred to in the content. |
© 2026 by the authors. Licensee MDPI, Basel, Switzerland. This article is an open access article distributed under the terms and conditions of the Creative Commons Attribution (CC BY) license.